Back to Journals » Neuropsychiatric Disease and Treatment » Volume 17
Maternal and Paternal Depression During Pregnancy in China: Prevalence, Correlates, and Network Analysis
Authors Zhang Y, Sun H, Li W, Luo X, Liu T, Fang F, Xiao J, Garg S, Yang Y, Chen Y
Received 26 May 2021
Accepted for publication 29 June 2021
Published 12 July 2021 Volume 2021:17 Pages 2269—2280
DOI https://doi.org/10.2147/NDT.S321675
Checked for plagiarism Yes
Review by Single anonymous peer review
Peer reviewer comments 3
Editor who approved publication: Professor Taro Kishi
Yongfu Zhang, 1,* Hengwen Sun, 2,* Wengao Li, 3 Xian Luo, 4 Ting Liu, 4 Fan Fang, 5 Julan Xiao, 5 Samradhvi Garg, 6 Yuan Yang, 4 Yu Chen 5
1Department of Anesthesiology, Guangzhou Women and Children’s Medical Centre, Guangzhou, Guangdong, People’s Republic of China; 2Department of Radiotherapy, Cancer Center, Guangdong Provincial People’s Hospital (Guangdong Academy of Medical Sciences), Guangzhou, Guangdong, People’s Republic of China; 3Department of Psychiatry, 999 Brain Hospital, Guangzhou, Guangdong, People’s Republic of China; 4Department of Psychiatry, Southern Medical University Nanfang Hospital, Guangzhou, Guangdong, People’s Republic of China; 5School of Nursing, Southern Medical University, Guangzhou, Guangdong, People’s Republic of China; 6School of Health in Social Science, University of Edinburgh, Edinburgh, Scotland, UK
*These authors contributed equally to this work
Correspondence: Yu Chen Email [email protected]
Yuan Yang Email [email protected]
Background: Depression is a commonly seen mental health concern for mothers and fathers during their transition to parenthood. This study aims to provide new insights into the prevalence of maternal and paternal depression, its demographic and clinical correlates, and its symptom network among Chinese pregnant women and their partners.
Methods: In this multicenter, cross-sectional study, 769 pregnant women and their partners were assessed by Edinburgh Postnatal Depression Scale (EPDS) from June 15th to Sep 15th, 2020 in southern China. Convenient sampling method was used. Univariate analyses, multivariate logistic regression, and network analyses were conducted. Networks of maternal and paternal depression were compared.
Results: In total, 60 (EPDS total score ≥ 13, 7.80%, 95% CI: 5.90– 9.70%) women and 23 (2.99%, 95% CI: 1.78– 4.20%) of these women’s partners reported depression. Physical comorbidities (OR=2.664, P=0.003) was the only factor that was found to significantly correlate with maternal depression. Network analyses showed that the resulting networks were well connected and that there was significant difference of network structure between maternal and paternal depression (M=0.330, P< 0.001). Centrality plot indicated that “sad or miserable” (strength=1.097) was the most central symptom in the maternal depression network, while “scared or panicky” (strength=1.091) was the most central node in the paternal network. The edge between “things have been getting on top of me” – “able to laugh and see the funny side of things” (difference: 0.153, P=0.020), and “scared or panicky” – “the thought of harming myself” (difference: 0.084, P< 0.001) was significantly stronger in women’s partners than that in pregnant women.
Conclusion: Maternal and paternal depression during pregnancy could result in significant negative consequences. Symptoms like “sad or miserable” and “scared or panicky” are critical and might be potential targets for further interventions. Evidence-based treatments, such as pharmacology, psychotherapy, community reinforcement and family training, might be beneficial for parents with depression during and after the pregnancy.
Keywords: depression, maternal, network, paternal, pregnancy
Corrigendum for this paper has been published
Introduction
Depression is a commonly seen mental health concern for mothers and fathers during their transition to parenthood. The prevalence of maternal and paternal depression varied significantly based on the time of assessment, study location, and the measurement method used. Recent meta-analyses revealed that the overall prevalence of maternal depression ranged from 11.9% (95% confidence interval (CI): 11.4–12.5%) to 17.4% (95% CI: 12.6–22.2%),1–3 and the meta-estimate for paternal depression ranged from 8.4% (95% CI: 7.2–9.6%) to 13.6% (95% CI: 8.7–21.3%).4–6 It is well established that both maternal and paternal depression have negative personal, familial and child developmental outcomes, such as poor infant-mother attachments, lower intimacy relationship satisfaction, poor parenting practices, and negative cognitive, social and behavioral development in children.4,7
In recent years, much public and clinical attention has been devoted to the mental health of new mothers, both prenatal and postnatal, while new fathers tend to receive less attention compared to their counterparts.8 However, due to recent shift in gender roles, fathers are frequently involved in childcare. Studies indicated that paternal depression usually has a longer illness duration and slower remission or recovery than maternal depression.7 The emerging literature on a new father’s depression suggests that men, like their maternal counterparts, are also at an increased risk of depression during their transition to parenthood, and ignoring the needs of this population is potentially a costly issue (ie decreased occupational functioning, loss of productivity).5,7 Thus, paternal mental health is as important as maternal mental health.
Based on Klein and White’s Family Systems Theory,9 anything that affects one family member also affects other members, either directly or indirectly. Researchers consistently found that higher maternal depression was associated with higher paternal depression, and vice versa. For example, Pilkington et al, and Phoosuwan et al, reported that women’s partner’s emotional closeness, support, and communication significantly affect maternal anxiety and depression.10,11 Paulson et al, and Wang et al reported that the association between maternal and paternal depression was positive and mild-to-moderate in size (r=0.308, 95% CI: 0.228–0.384, and r=0.295, 95% CI: 0.218–0.367, respectively).5,6
In the past decades, several studies have examined the epidemiology and correlates of maternal and paternal depression in China. A China-based meta-analysis revealed that the prevalence of maternal depression was 17.4% (95% CI: 12.6–22.2%) among Chinese women.3 Another meta-analysis of Chinese studies found that the overall prevalence of paternal postpartum depression was 13.6% (95% CI: 8.7–21.3%).6 It has been consistently reported that older maternal age, lower socioeconomic status, poorer family relationships, unwanted pregnancies, history of psychiatric illnesses, and intimate partner violence are strong risk factors for depression in pregnant and postpartum women.6,12–15 Whereas, risk factors that affect paternal depression have been reported to include paternal age, education, previous psychiatric history, and maternal depression.4,6
Until now, no study has examined the symptom networks of maternal and paternal depression in detail in China. Furthermore, no study has investigated the similarities and differences in risk factors, network structure, and central symptoms between maternal and paternal depression. This lack of understanding and awareness may result in inadequate measurement, identification, and subsequent treatment intervention. A recent study in Singapore used network analysis to examine maternal depression and anxiety, and found that central symptoms were mostly related to “feeling worthless or useless” during pregnancy, and a “feeling of being punished or overwhelmed” after child delivery.16
In comparison to traditional factor-analytic approaches, network analysis is a recent development that provides unique information on the dynamic relationship amongst the symptoms of depression.17 It is a data-driven approach that provides a visual depiction of the complex associations amongst symptoms, which could be understood as partial correlations.18 It allows identification of highly central symptoms (defined as nodes), and produces spatially ordered networks in which key nodes are located at the center of the network and nodes with fewer connections at the periphery.17 Previous studies on maternal and/or paternal depression mainly focused on its total score or mean score.3 However, it has been proven that some symptoms/items might be of more importance to depression than others, and solely relying on total or mean scoring that gives equal weight to all symptoms/items might be misleading when trying to determine the severity of depression.19 Analyzing depressive symptoms from the perspective of network analysis allows us to go beyond the current mean level of the symptoms and understand which symptoms might be particularly central to the experience of maternal and paternal depression.20 Meanwhile, understanding the specific links between symptoms allows for an understanding of which pairs of symptoms tend to occur or not occur simultaneously (ie, pathological network model vs healthy network model).17 These identified central symptoms and the related edges may have an outsized impact on clinical risk, trajectory, and outcomes.21 Hence, this study aims to provide new insights into the prevalence of maternal and paternal depression; its demographic and clinical correlates, and its symptom network amongst Chinese pregnant women and these women’s partners.
Methods
Study Design
This is a cross-sectional, hospital-based survey conducted from June 15th to Sep 15th, 2020 in China. Participants (pregnant women and their respective partners) were recruited from Guangzhou Women and Children’s Medical Centre, Guangdong Provincial People’s Hospital, and Southern Medical University Nanfang Hospital. Convenient sampling method was used. To be eligible, participants needed to fulfill the following criteria: 1) they should be aged 18 or above; 2) be a pregnant individual, and the partner of the said pregnant woman; 3) able to understand Mandarin and/or Cantonese; and 4) willing to provide written informed consent. Participants were not eligible if they had pre-existing diagnosed psychiatric disorders (such as, schizophrenia) and/or disturbance of consciousness. The study was anonymous, and confidentiality of information was assured. Participants were allowed to terminate the study at any time they desired. Ethical approval was obtained from the Ethics Committees of Guangzhou Women and Children’s Medical Centre (ID: 2020–29801). All participants provided informed consent to take part in this study, in accordance with the Declaration of Helsinki.
Instruments
Information Collection Form
An information collection form was designed and used to gather basic data, such as women and their partner’s age, residency, education level, employment status, monthly income level, physical comorbidities (such as, heart disease), and attitude towards the Coronavirus disease 2019 (COVID-19) pandemic. Participants were asked about whether the COVID-19 pandemic influenced their daily life (Not at all/mild affected/severe affected). Women were also asked to share their pregnancy stage, the number of previous pregnancies, history of previous natural miscarriage/s and/or drug induced abortion.
Edinburgh Postnatal Depression Scale (EPDS)
The EPDS is a self-reported tool to assess the severity of depressive symptoms in the last week of pregnant women.22 It has 10 items, and its total score ranges from 0 to 30, with a higher score indicating more severe depressive symptoms. A total score of 0–9 indicates the presence of several symptoms of short-lived psychological distress that are less likely to interfere with daily functioning (possible depression). A score of 10–12 indicates the presence of distress symptoms that may be discomforting and that may require the individual to be monitored regularly (minor depression). A score of 13 or above indicates severe depression, and a referral to a clinical psychologist or psychiatrist might be necessary. The Chinese EPDS showed good psychometric properties.23,24 In this study, the Cronbach’s alpha of the sample was satisfactory (0.86 for women, and 0.90 for these women’s partners, respectively).
Statistical Analyses
All data analyses were performed by SPSS statistical software version 22.0 and R programme. Significance was set at 0.05 (two-tailed). In the current study, an EPDS total score of 13 was considered as the cut-off value for depression. Firstly, all socio-demographic and clinical variables, such as residency, education, income level, physical comorbidities, miscarriage history etc., between the two groups (depressive group vs non-depressive group) were investigated using Chi-square test or Mann–Whitney U-test, as appropriate. Secondly, all variables were examined by multivariate logistic regression to determine potential risk factors for maternal and paternal depression. The associations between risk factors and outcomes are presented as Odds Ratios (ORs) and 95% Confidence Intervals (CIs). Thirdly, network analysis was conducted to identify central symptoms of maternal and paternal depression, respectively.
Network analysis
1) Network estimation
The R program “bootnet”25 and “qgraph”26 packages were used for network analysis. Individual items (ie, symptoms) were represented as nodes and associations between them as edges.18,27 Thicker edges indicate stronger associations. To construct network models and improve the accuracy of the network model, a sparse graphical Gaussian model (GGM) combined with the graphical least absolute shrinkage and selection operator (LASSO) method was used,28 which reduces small associations to zero and creates a more parsimonious model. Furthermore, to determine the optimal network model, the extended Bayesian information criterion (EBIC) was utilized, and the hyperparameter γ was set as 0.5 in the generated network, which kept an optimal balance between a network with many connections (γ = 0) and a network with minimal connections (γ = 1).29 In the current study, we used the “estimateNetwork” function in the R “bootnet” package to assess the network model,18,27 with “EBICglasso” as the default method.25
2) Network centrality
In network analysis, centrality indicators identify the most important vertices within the graph. Centrality is usually evaluated by 3 major indices: strength, betweenness, and closeness.26 Strength refers to the sum of the absolute value of a node’s correlations with other nodes in the structure. Betweenness is the number of times in which a given node lies on the shortest path between two other nodes. Closeness represents the reciprocal of the sum of the shortest path distance of a specific node to all other nodes in the network.27,30 Higher centrality index values are representative of greater importance within the network, and symptoms with high centrality measures might be important as potential targets for further treatment interventions.26
3) Network accuracy and stability
To determine the robustness of centrality indices, a case-dropping subset bootstrap to compute the correlation stability (CS) coefficient was applied (1000 iterations). A CS coefficient (r=0.7) represents the maximum percentage of sample cases that can be lost from the original full cases to retain a correlation of 0.7 in at least 95% of the samples. It has been recommended that the CS coefficient be higher than 0.25, which is the acceptable level.25 Furthermore, to evaluate the accuracy of the edge weights, nonparametric bootstrapping to estimate the 95% confidence intervals (CIs) of the edge was performed (1000 replicates). The narrower the CI, the more accurate is the estimate of the edge-weight.17
4) Network comparison
To compare the differences between symptom networks in maternal and paternal depression, we used the R “NetworkComparisonTest” package to investigate the possible difference at the level of network structure, global strength (ie, total absolute connectivity among the symptoms), and of each specific edge between the two groups. The NetworkComparisonTest is a permutation-based test that randomly regroups participants from each network repeatedly (1000 replicates) and then examines the differences amongst networks.31 The general network structure invariance test explores differences in the structure of the network as a whole. In situations where the network structure exhibited significant differences, we tested which specific edges differed significantly.
Results
Participant Characteristics
In total, 886 couples were invited to participate in the study, and finally 769 (86.79%) couples agreed and completed the assessments. The mean age of women was 29.49 years (SD=3.89), and the mean age of these women’s partners was 31.16 years (SD=4.45). Most of the participants lived in urban areas (85.8% for women, and 83.7% for their corresponding partners), had high educational levels (college or above, 72.1% for women, and 68.1% for their corresponding partners), were currently employed full-time (63.2% for women, and 89.2% for their corresponding partners), and did not report any other physical comorbidities (82.4% for women, and 88.9% for their corresponding partners). More than half of the women (50.8%) were in their third trimester, were having their first baby (58.0%), and did not have any previous natural miscarriage experience (82.2%) or drug abortion history (70.7%). In addition, 26.2% women felt that the COVID-19 outbreak influenced their daily work and life severely, while 24.6% of them felt the total opposite (no affection at all). The corresponding figures among these women’s partners were 14.5%, and 34.3% respectively. Demographic and clinical characteristics of included participants are presented in Table 1.
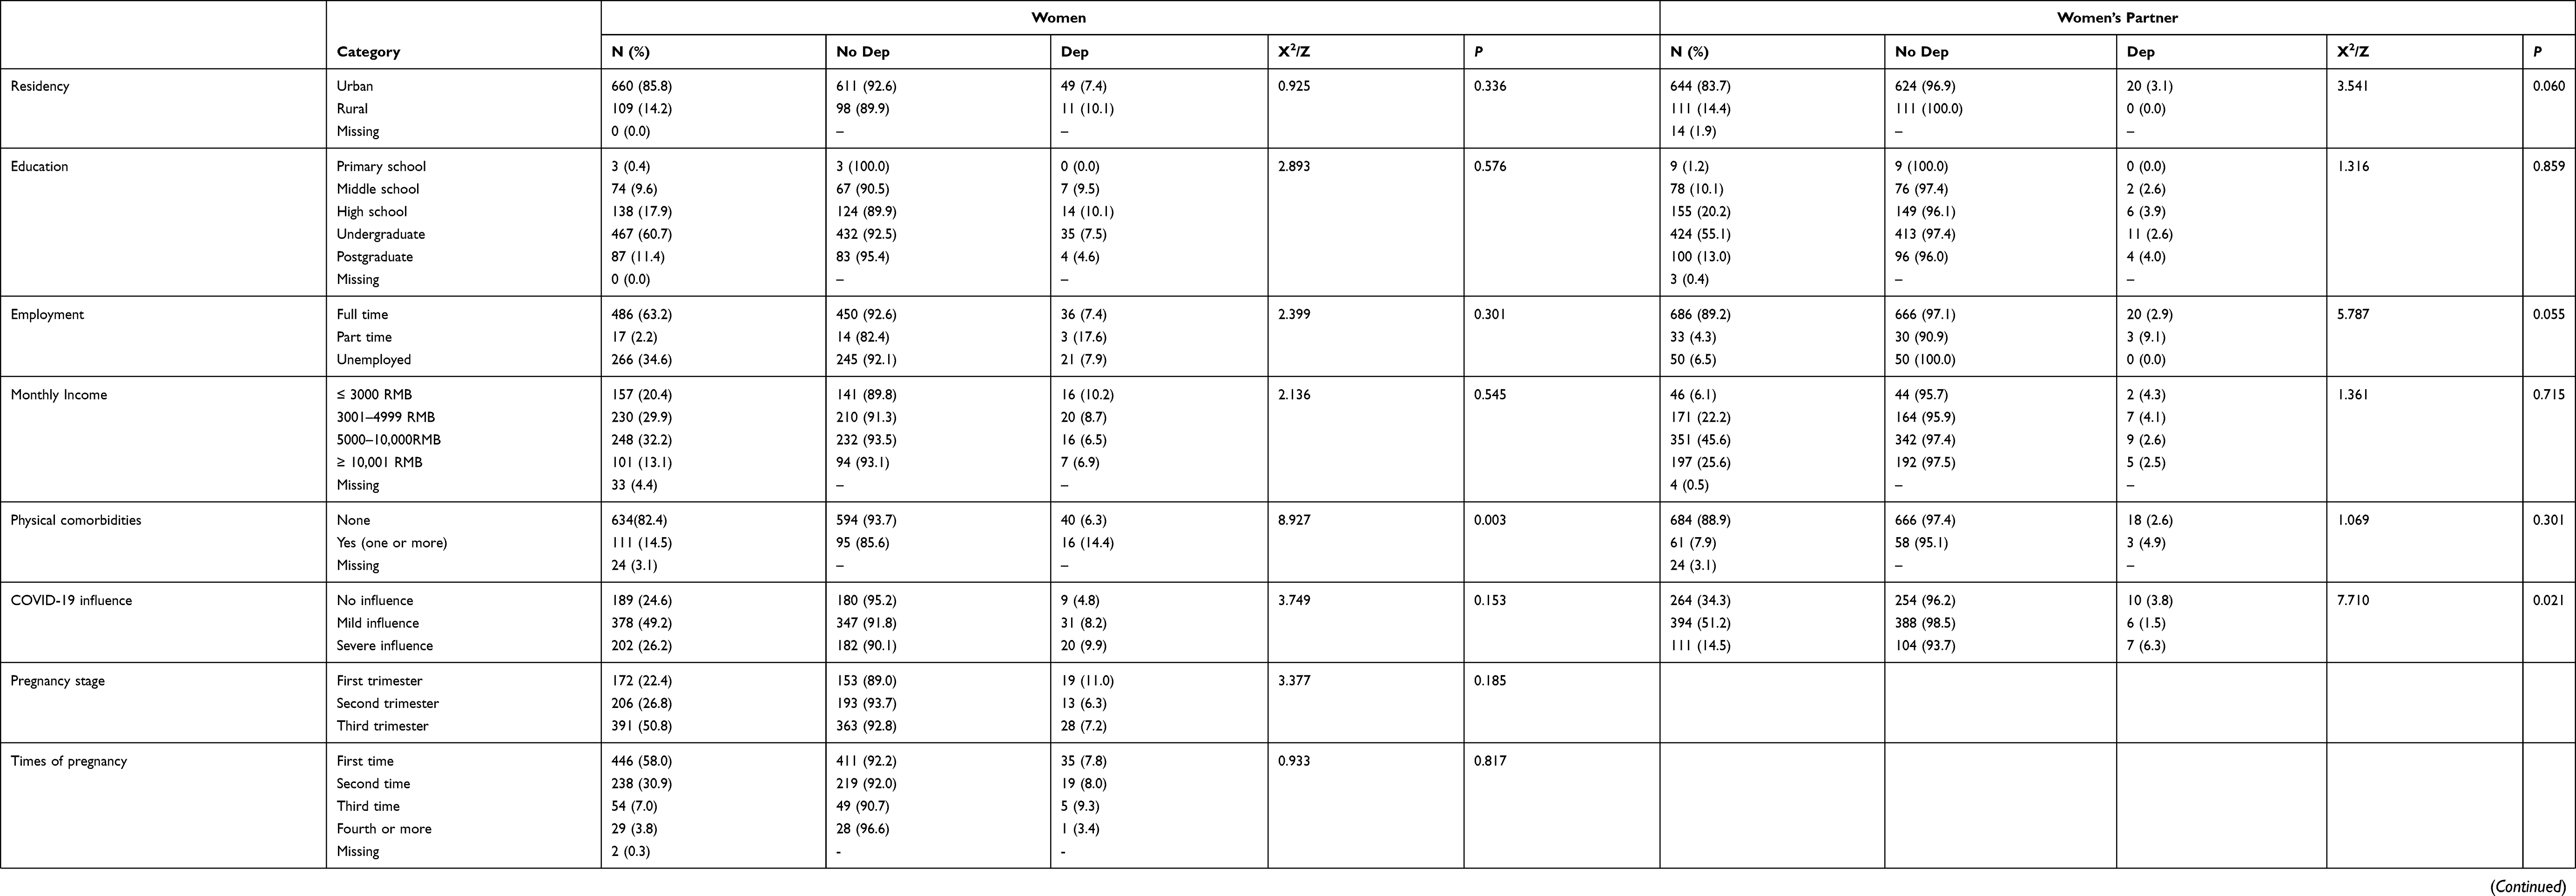 |
Table 1 Characteristics of the Chinese Pregnant Women and Their Partner (N=769) |
Prevalence of Depression
In total, 139 (18.08%, 95% CI: 15.35–20.80%) women reported minor depression (EPDS total score ≥ 10), and 60 (7.80%, 95% CI: 5.90–9.70%) of them reported severe depression (EPDS total score ≥ 13). Sixty-one (7.93%, 95% CI: 6.02–9.85%) partners reported minor depression, and 23 (2.99%, 95% CI: 1.78–4.20%) of them reported severe depression. In all, 30 couples (both the pregnant woman and her partner, 3.90%, 95% CI: 2.53–5.27%) reported minor depression, and 9 couples (1.17%, 95% CI: 0.41–1.93%) reported severe depression. Scores of EPDS are showed in Supplementary Table 1.
Correlates of Depression
The univariate analyses indicated that women’s previous history of natural miscarriages (P=0.042) and physical comorbidities (P=0.003) were significantly associated with maternal depression, and multivariate logistic regression analyses indicated that physical comorbidities (OR=2.664, P=0.003) was the only factor that significantly correlates with maternal depression. For women’s partners, COVID-19 influence (P=0.021) was the only factor that significantly associated with paternal depression in univariate analyses, nevertheless, none of the tested factors remained significant in multivariate logistic regression analyses (Table 1).
Network Analyses
1) Network structure, centrality, and stability of maternal depression
For the network of maternal depression, 37 out of 45 edges were estimated to be above zero. The resulting network was well-connected, with no isolated nodes. The edges of EPDS item 1 (able to laugh and see the funny side of things) - 2 (looking forward with enjoyment to things), EPDS item 4 (anxious or worried) - 5 (scared or panicky), and EPDS item 8 (sad or miserable) - 9 (unhappy of being crying) were the three strongest positive edges in the community (Figure 1A). Centrality plot showed that EPDS items 8 (sad or miserable, strength=1.097) was the most central node in the network, followed by item 4 (anxious or worried, strength=1.012), and item 5 (scared or panicky, strength=0.992) (Figure 2A, and Table 2). For the stability of the network, the case-dropping test showed that strength (the main indicator of stability) remained highly stable (Figure 3A), and the CS coefficients for strength was 0.75, exceeding the recommended threshold of 0.25. Additionally, the bootstrapped 95% CIs for estimated edge weights were relatively narrow (Supplementary Figure 1a), indicating that most edges in the maternal network were accurate and robust.
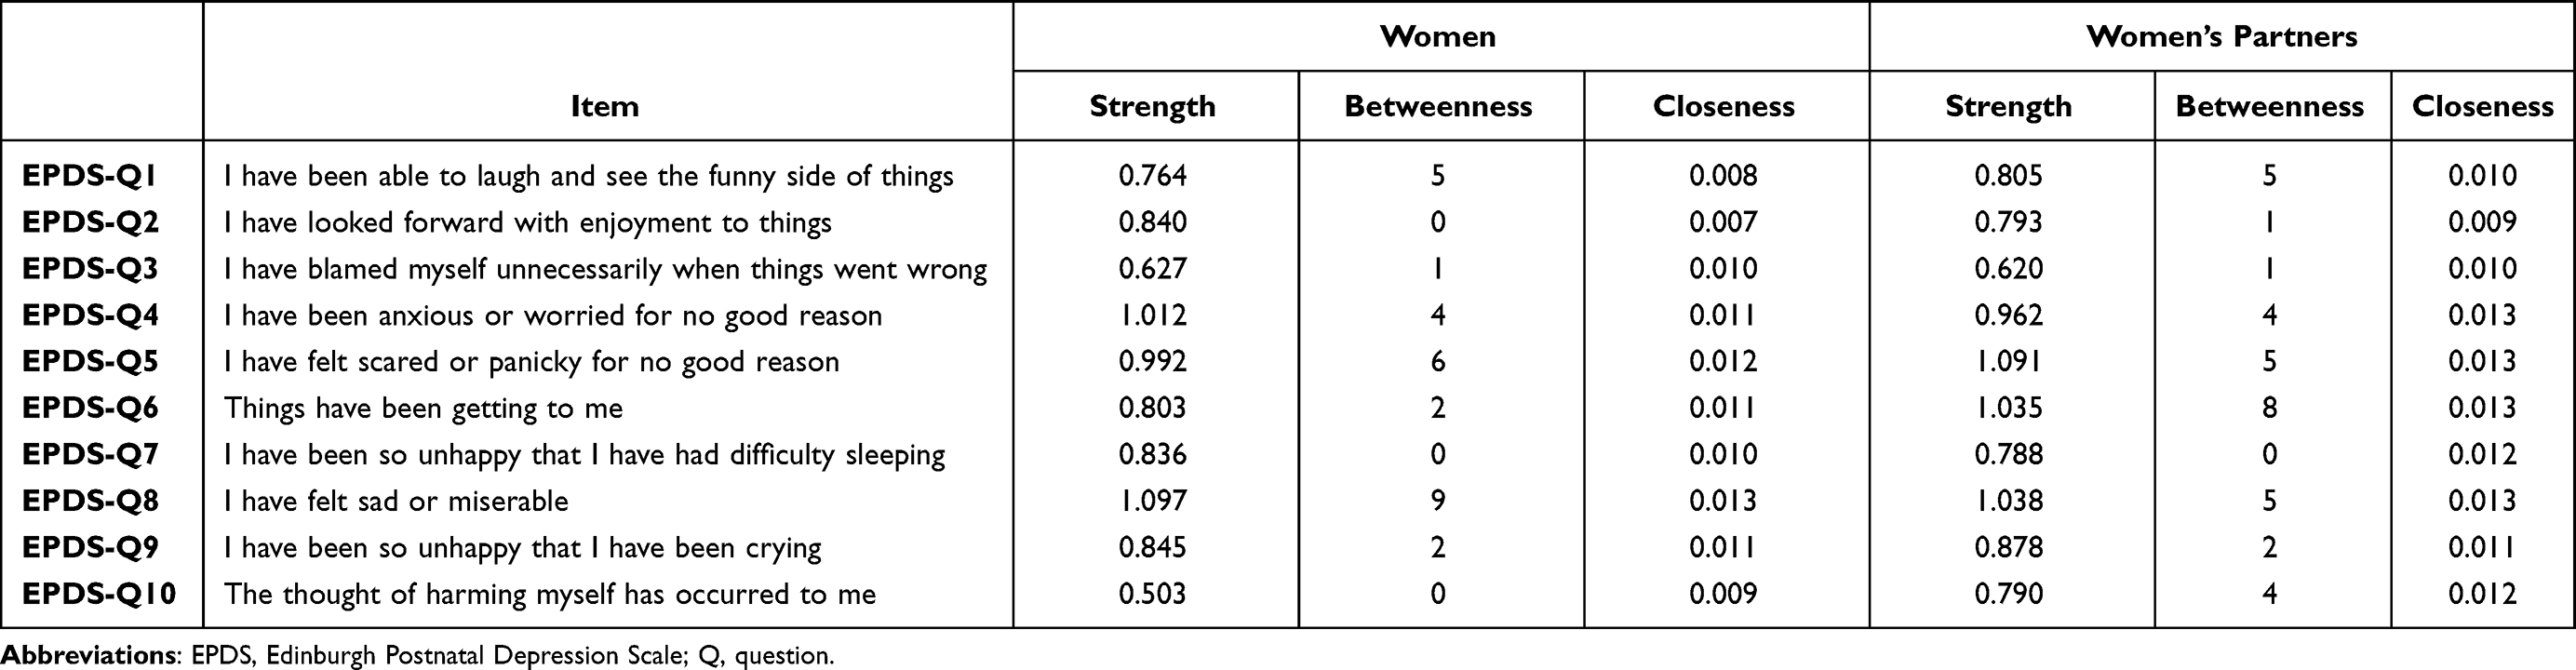 |
Table 2 Network Centrality Indices Between Women and Partners (N=769) |
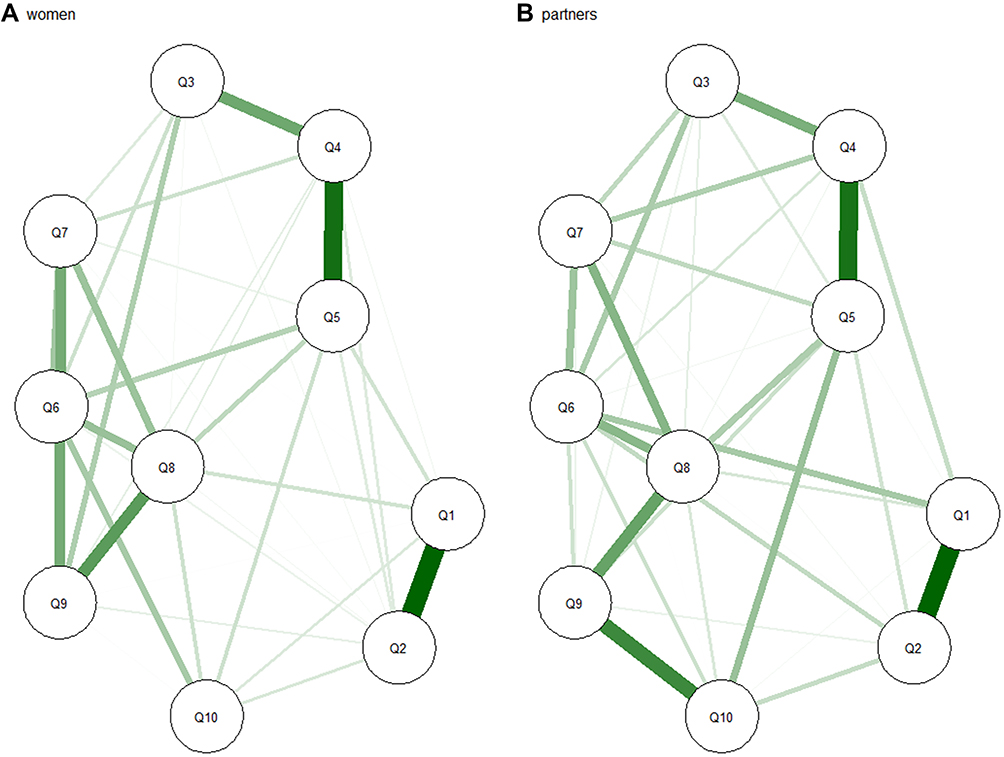 |
Figure 1 Comparison of network structure between women (A) and their partners (B).Note: Green lines = positive associations.Abbreviation: Q, question. |
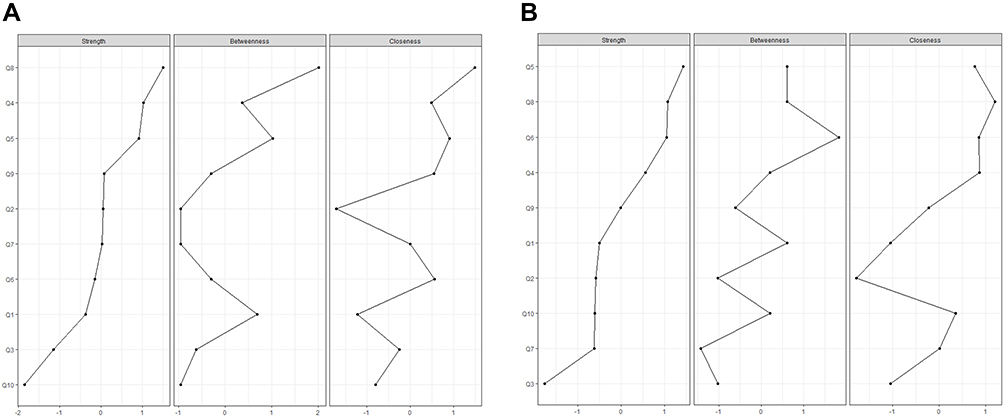 |
Figure 2 Comparison of network centrality indices between women (A) and their partners (B).Abbreviation: Q, question. |
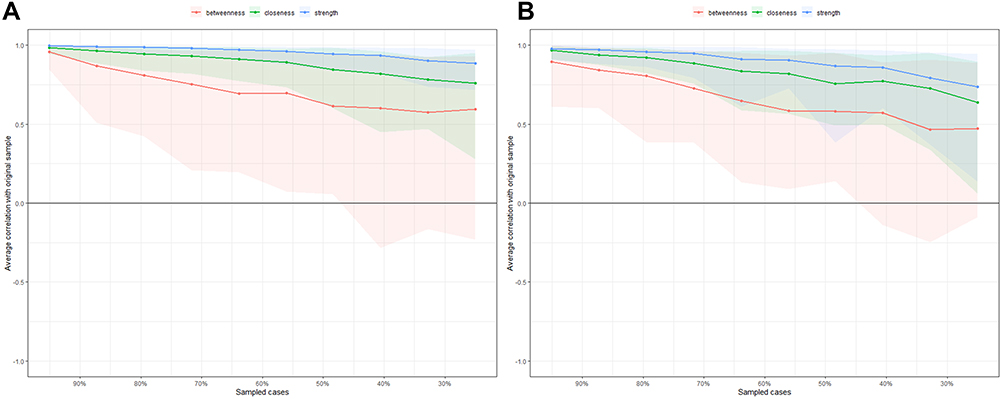 |
Figure 3 Comparison of stability of centrality indices between women (A) and their partners (B).Notes: The x-axis represents the proportion of sampled case at each step, while the y-axis represents the mean correlations between the original indices and the subset indices. Colorful areas represent 95% CI. |
2) Network structure, centrality, and stability of paternal depression
For the network of paternal depression, 38 out of 45 edges were estimated to be above zero. Similar to the network of maternal depression, the resulting network was well-connected, with no isolated nodes, and the edges of EPDS item 1 (able to laugh and see the funny side of things) - 2 (looking forward with enjoyment to things), and EPDS item 4 (anxious or worried) - 5 (scared or panicky) were the first and second strongest edges in the community. However, the third strongest edge in the paternal depression network was EPDS item 9 (unhappy of being crying) - 10 (having thoughts of harming yourself) (Figure 1B). Centrality plot indicated that, EPDS items 5 (scared or panicky, strength=1.091) was the most central node in the paternal network, followed by item 8 (sad or miserable, strength=1.038), and item 6 (things have been getting on top of me, strength=1.035) (Figure 2B, and Table 2). For the stability of the network, the case-dropping test showed that the strength indices remained relatively stable (Figure 3B), and the CS coefficients for strength was 0.44. Also, the bootstrapped 95% CIs for estimated edge weights were relatively narrow, indicating that the most edges were accurate in the network (Supplementary Figure 1b).
3) Network comparison between maternal and paternal depression
The network comparison test showed that there was significant difference of network structure between maternal and paternal depression (M=0.330, P<0.001). Results of global strength invariance test showed that the difference was not significant between the two groups (global strength among women: 4.159; among partners: 4.399; S: 0.240, P=0.087, Supplementary Figure 2a), which indicated that the total absolute connectivity amongst the symptoms were similar between the two networks. However, according to the plot of bootstrap value of the maximum difference in any of the edge weights (1000 permutations), the difference was significant (P<0.001, Supplementary Figure 2b). The strongest difference edge was EPDS item 6 (things have been getting on top of me) - 1 (able to laugh and see the funny side of things) (difference: 0.153, P=0.020), followed by EPDS item 5 (I have felt scared or panicky for no good reason) - 10 (the thought of harming myself has occurred to me) (difference: 0.084, P<0.001). The two edges in paternal depression were significantly stronger than that in maternal depression.
Discussion
This study investigated the prevalence, correlates, and networks of maternal and paternal depression amongst Chinese population. Results from this study suggest that the prevalence of depression is 7.80% (95% CI: 5.90–9.70%) for pregnant women, and 2.99% (95% CI: 1.78–4.20%) for these women’s partners. The results are significantly lower than the prevalence reported in Lin’s meta-analysis for pregnant Chinese women (17.4%, 95% CI: 12.6–22.2%) and Wang’s meta-analysis in Chinese new fathers (13.6%, 95% CI: 8.7–21.3%).3,6 Our findings are also lower than the meta-estimates reported in Asia (16%, 95% CI: 13–20% for pregnant women, and 7.8%, 95% CI: 4.5%–13.0% for new fathers) or in North America (16%, 95% CI: 11–20% for pregnant women, and 12.5%, 95% CI: 9.7%–15.9% for new fathers).1,4 Prevalence of maternal and paternal depression has varied greatly between studies. The discrepant findings could be proportionally explained by difference in the time of assessment, methods of assessment and/or cutoffs, sample size of the study, and socio-economic backgrounds and clinical status of participants.1,2,32 For the comparatively low rates found in this study, it is possible that in recent years, people might have had an increased awareness of mental health, better social and familial support, and easier access to mental health services, which could have contributed to lower prevalence of depression found in this study.33 We found that previous history of natural miscarriages and physical comorbidities were associated with maternal depression, which is in accordance with existing evidence.33–37 Previous pregnancy loss is a shocking and traumatic event for women and their families, and could lead to intense emotional distress.38,39 A study indicated that about 11% of the Chinese women suffer from major depression and around 1.4% of them were diagnosed with anxiety disorders 6 weeks after a natural miscarriage.36 Additionally, physical comorbidities could lead to increased physical discomfort and impaired daily functioning, which could result in an elevated likelihood of maternal depression.35,37
Fathers who considered that the COVID-19 outbreak severely influenced their daily work and life were more likely to report depression. The COVID-19 pandemic poses a significant mental health threat for people all over the world,40 and has changed family functioning, leading to increased risk for poor psychosocial outcomes. Additionally, during the COVID-19 pandemic, the combination of financial pressure, and health concerns was exceedingly challenging for families, especially males. However, it should be noted that the COVID-19 factor was no longer significant in multivariate analysis after controlling for covariates, which suggested that the influence of COVID-19 on paternal depression was not robust.
Using network analysis approach, we first identified several important interactions between symptoms. This interrelatedness of symptoms may further increase our understanding of psychopathology and provide important information for profiling.41 For example, for both women and their partners, the edges of EPDS item 1 (able to laugh and see the funny side of things) - 2 (looking forward with enjoyment to things), and EPDS item 4 (anxious or worried) - 5 (scared or panicky) were the two strongest edges in the network. This indicated that these two pairs of symptoms tend to occur simultaneously. Based on these associations, we therefore hypothesize that positive thinking might activate enjoyment, while anxious feelings may trigger frightened feelings.17 However, the edge strength between EPDS item 6 (things have been getting on top of me) - item 1 (able to laugh and see the funny side of things), and EPDS item 5 (I have felt scared or panicky for no good reason) - item 10 (the thought of harming myself has occurred to me) in paternal depression was significantly stronger than that in pregnant women, and they were the strongest difference edges between the two networks. This indicated that when feeling troubled, overwhelmed, scared, or panicky, women’s partners are more likely to think negatively, or even harm themselves compared to their counterparts.
Another main finding is that we identified EPDS items 8 (sad or miserable) as the common central symptom in both maternal and paternal network. The finding is in accordance with the Diagnostic and Statistical Manual of Mental Disorders (DSM-5), which states that depressed mood (eg, feeling sad, hopeless, empty, and tearful) and loss of interest or pleasure are core symptoms for the diagnosis of depressive disorders.42 This finding is also in line with Beck’s cognitive model of depression, which proposed sadness as the most important negative mood in maintaining depression.43 Moreover, a previous network analysis on maternal anxiety and depression in Singapore found that the cognitive-affective symptoms were more central among pregnant women, such as worthlessness or uselessness, negative emotions over past failures, or having disturbing thoughts.16 This evidence partially supports our findings. However, direct comparisons should be conducted with caution due to different assessment tools, study sample and point of assessment time.
It should be noted that item 8 was the second central node in the paternal network, the most central node in fathers was EPDS item 5 (scared or panicky). Until now, there remains limited research on paternal depressive symptomatology, and no study has examined the network structure of paternal depression. Previous International Delphi study in 2016 has indicated that “low mood” and “feeling inadequate” are the two most commonly experienced symptoms when a father is depressed,8 and our finding adds to the evidence that “scared or panicky” feeling might also be important and unique for understanding and predicting paternal depressive symptoms. Paying attention to these core symptoms may protect struggling fathers from going undetected and untreated. Taken together, our results imply that symptoms such as sad, miserable, scared, or panicky might be relevant as targets for future treatment interventions, as these symptoms are more likely to influence several other symptoms.
Strengths and limitations
The strength of this study lies in its large sample size, the use of standardized assessment instruments and sophisticated network analysis approach. Meanwhile, there are several limitations that should be acknowledged. First, the generated networks are based on group-level analysis, we are uncertain whether group-level results are representative for individuals, therefore, the results should be generalized with caution.44 Second, based on the cross-sectional study design, the direct causal relationships between relevant factors and target dependent are tentative. Longitudinal studies are needed to investigate the changes between symptoms over time. Third, certain biological and psychological factors that may influence an individual’s depression, such as, social support, marital relationship, communication with their partner, changes in cortisol, and substances use etc. was not examined in this study. Fourth, we used self-reported EPDS in this study, no objective measurement was involved. Hence, recall bias may exist. Further studies with more representative samples using validated objective instruments are needed.
Conclusion
Becoming a parent is associated with a variety of stressors, and depression during this critical time period can result in significant negative consequences for those involved. Our study highlighted that “sad or miserable” was the most central symptom in the maternal depression network, while “scared or panicky” was the most central node in the paternal network, indicating that these symptoms are critical and might be potential targets for further interventions. Evidence-based treatments, such as pharmacology, psychotherapy, community reinforcement and family training might be beneficial for parents with depression during and after pregnancy.
Abbreviations
CI, confidence interval; COVID-19, Coronavirus disease 2019; CS, correlation stability; EPDS, Edinburgh Postnatal Depression Scale; OR, odds ratios; GGM, graphical Gaussian model; LASSO, least absolute shrinkage and selection operator; EBIC, extended Bayesian information criterion.
Data Sharing Statement
The raw data supporting the conclusions of this article will be made available by the correspondence authors, without undue reservation, to any qualified researcher. All data will be deidentified.
Ethical Statement
Ethical approval was obtained from the Ethics Committees of Guangzhou Women and Children’s Medical Centre (ID: 2020-29801).
Acknowledgments
We greatly appreciate the contributions made by the participants in this study.
Author Contributions
All authors made a significant contribution to the work reported, whether that is in the conception, study design, execution, acquisition of data, analysis and interpretation, or in all these areas; took part in drafting, revising or critically reviewing the article; gave final approval of the version to be published; have agreed on the journal to which the article has been submitted; and agree to be accountable for all aspects of the work.
Funding
This research was supported in part by the National Natural Science Foundation of China (Grant Number: 71874075); and Humanities and Social Sciences Planning Fund of Ministry of Education of China (Grant Number: 18YJAZH008).
Disclosure
The authors have no conflicts of interest to declare for this work.
References
1. Shorey S, Chee CYI, Ng ED, Chan YH, Tam WWS, Chong YS. Prevalence and incidence of postpartum depression among healthy mothers: a systematic review and meta-analysis. J Psychiatr Res. 2018;104(9):235–248. doi:10.1016/j.jpsychires.2018.08.001
2. Woody CA, Ferrari AJ, Siskind DJ, Whiteford HA, Harris MG. A systematic review and meta-regression of the prevalence and incidence of perinatal depression. J Affect Disord. 2017;219(2017):86–92. doi:10.1016/j.jad.2017.05.003
3. Lin X, Zheng D, Lin XF, Dai Y. Perinatal depression in China: a meta-analysis (in Chinese). Fujian Med J. 2017;39(5):131–133.
4. Cameron EE, Sedov ID, Tomfohr-Madsen LM. Prevalence of paternal depression in pregnancy and the postpartum: an updated meta-analysis. J Affect Disord. 2016;206(2016):189–203. doi:10.1016/j.jad.2016.07.044
5. Paulson JF, Bazemore SD. Prenatal and postpartum depression in fathers and its association with maternal depression: a meta-analysis. JAMA. 2010;303(19):1961–1969. doi:10.1001/jama.2010.605
6. Wang T, Xu Y, Li ZZ, Chen LZ. Prevalence of paternal depression in China and its association with maternal postpartum depression: a Meta-analysis (in Chinese). J Central South Univ. 2016;41(1):1082–1089.
7. Rao WW, Zhu XM, Zong QQ, Hall BJ, Ungvari GS, Xiang YT. Prevalence of prenatal and postpartum depression in fathers: a comprehensive meta-analysis of observational surveys. J Affect Disord. 2020;263(2020):491–499.
8. Freitas CJ, Williams-Reade J, Distelberg B, Fox CA, Lister Z. Paternal depression during pregnancy and postpartum: an international Delphi study. J Affect Disord. 2016;202(2016):128–136. doi:10.1016/j.jad.2016.05.056
9. Klein MR, Lengua LJ, Thompson SF, et al. Bidirectional relations between temperament and parenting predicting preschool-age children’s adjustment. J Clin Child Adolesc. 2018;47(sup1):S113–S26. doi:10.1080/15374416.2016.1169537
10. Pilkington PD, Milne LC, Cairns KE, Lewis J, Whelan TA. Modifiable partner factors associated with perinatal depression and anxiety: a systematic review and meta-analysis. J Affect Disord. 2015;178(2015):165–180. doi:10.1016/j.jad.2015.02.023
11. Phoosuwan N, Manasatchakun P, Eriksson L, Lundberg PC. Life situation and support during pregnancy among Thai expectant mothers with depressive symptoms and their partners: a qualitative study. BMC Pregnanct Childb. 2020;20(1):207–216. doi:10.1186/s12884-020-02914-y
12. Gluckman PD, Hanson MA, Cooper C, Thornburg KL. Effect of in utero and early-life conditions on adult health and disease. N Engl J Med. 2008;359(1):61–73. doi:10.1056/NEJMra0708473
13. Becker M, Weinberger T, Chandy A, Schmukler S. Depression during pregnancy and postpartum. Curr Psychiatry Rep. 2016;18(3):32–40. doi:10.1007/s11920-016-0664-7
14. Hutchens BF, Kearney J. Risk factors for postpartum depression: an umbrella Review. J Midwifery Womens Health. 2020;65(1):96–108. doi:10.1111/jmwh.13067
15. Bhatta N, Assanangkornchai S. Patterns of domestic violence against women during pregnancy and the postpartum period in Kathmandu, Nepal. Asia Pac Psychiatry. 2019;11(1):e12342–50. doi:10.1111/appy.12342
16. Phua DY, Chen H, Chong YS, Gluckman PD, Broekman BFP, Meaney MJ. Network analyses of maternal pre- and post-partum symptoms of depression and anxiety. Front Psychiatry. 2020;11(1):785–797. doi:10.3389/fpsyt.2020.00785
17. Mullarkey MC, Marchetti I, Beevers CG. Using network analysis to identify central symptoms of adolescent depression. J Clin Child Adolesc. 2019;48(4):656–668. doi:10.1080/15374416.2018.1437735
18. Beard C, Millner AJ, Forgeard MJ, et al. Network analysis of depression and anxiety symptom relationships in a psychiatric sample. Psychol Med. 2016;46(16):3359–3369. doi:10.1017/S0033291716002300
19. Fried EI, Nesse RM. Depression sum-scores don’t add up: why analyzing specific depression symptoms is essential. Bmc Med. 2015;13(1):1–11. doi:10.1186/s12916-015-0325-4
20. Borsboom D. A network theory of mental disorders. World Psychiatry. 2017;16(1):5–13. doi:10.1002/wps.20375
21. Hofmann SG, Curtiss J, McNally RJ. A complex network perspective on clinical science. Perspect Psychol Sci. 2016;11(5):597–605. doi:10.1177/1745691616639283
22. Cox JL, Holden JM, Sagovsky R. Detection of postnatal depression - development of the 10-item edinburgh postnatal depression scale. BrJ Psychiatry. 1987;150(1):782–786. doi:10.1192/bjp.150.6.782
23. Qiu J, Wang ZC, Luo LM, Mei LP. The clinical use of edinburgh postnatal depression scale (in Chinese). Shanghai Arch Psychiatry. 2001;13(4):219–221.
24. Lee DT, Yip SK, Chiu HF, et al. Detecting postnatal depression in Chinese women. Validation of the Chinese version of the edinburgh postnatal depression scale. Br J Psychiatry. 1998;172(1):433–437. doi:10.1192/bjp.172.5.433
25. Epskamp S, Borsboom D, Fried EI. Estimating psychological networks and their accuracy: a tutorial paper. Behav Res Methods. 2018;50(1):195–212. doi:10.3758/s13428-017-0862-1
26. Epskamp S, Cramer AO, Waldorp LJ, Schmittmann VD, Borsboom D. qgraph: network visualizations of relationships in psychometric data. J Stat Softw. 2012;48(4):1–18. doi:10.18637/jss.v048.i04
27. Wang Y, Hu Z, Feng Y, Wilson A, Chen R. Changes in network centrality of psychopathology symptoms between the COVID-19 outbreak and after peak. Mol Psychiatry. 2020;25(12):3140–3149. doi:10.1038/s41380-020-00881-6
28. Friedman J, Hastie T, Tibshirani R. Sparse inverse covariance estimation with the graphical lasso. Biostatistics. 2008;9(3):432–441. doi:10.1093/biostatistics/kxm045
29. Chen J, Chen Z. Extended Bayesian information criteria for model selection with large model spaces. Biometrika. 2008;95(3):759–771. doi:10.1093/biomet/asn034
30. Dalege J, Borsboom D, van Harreveld F, van der Maas HLJ. Network analysis on attitudes: a brief tutorial. Soc Psychol Personal Sci. 2017;8(5):528–537. doi:10.1177/1948550617709827
31. van Rooijen G, Isvoranu AM, Meijer CJ, et al. A symptom network structure of the psychosis spectrum. Schizophr Res. 2017;189(2017):75–83. doi:10.1016/j.schres.2017.02.018
32. Gavin NI, Gaynes BN, Lohr KN, Meltzer-Brody S, Gartlehner G, Swinson T. Perinatal depression: a systematic review of prevalence and incidence. Obstet Gynecol. 2005;106(5 Pt 1):1071–1083. doi:10.1097/01.AOG.0000183597.31630.db
33. Bo HX, Yang Y, Zhang DY, et al. The prevalence of depression and its association with quality of life among pregnant and postnatal women in China: a Multicenter Study. Front Psychiatry. 2021;12(1):1–7. doi:10.3389/fpsyt.2021.656560
34. Abdollahpour S, Heydari A, Ebrahimipour H, Faridhoseini F, Heidarian Miri H, Khadivzadeh T. Postpartum depression in women with maternal near miss: a systematic review and meta-analysis. J Matern Fetal Neonatal Med. 2021;15(1):1–7. doi:10.1080/14767058.2021.1885024
35. Hunter A, Tussis L, MacBeth A. The presence of anxiety, depression and stress in women and their partners during pregnancies following perinatal loss: a meta-analysis. J Affect Disord. 2017;223(2017):153–164. doi:10.1016/j.jad.2017.07.004
36. Lok IH, Lee DT, Yip SK, Shek D, Tam WH, Chung TK. Screening for post-miscarriage psychiatric morbidity. Am J Obstet Gynecol. 2004;191(2):546–550. doi:10.1016/j.ajog.2004.01.003
37. Volgsten H, Jansson C, Svanberg AS, Darj E, Stavreus-Evers A. Longitudinal study of emotional experiences, grief and depressive symptoms in women and men after miscarriage. Midwifery. 2018;64(2018):23–28. doi:10.1016/j.midw.2018.05.003
38. Nynas J, Narang P, Kolikonda MK, Lippmann S. Depression and anxiety following early pregnancy loss: recommendations for primary care providers. Prim Care Companion CNS Disord. 2015;17(1):1–10.
39. Abdollahpour S, Keramat A, Mousavi S, Khosravi A. The effect of debriefing and brief cognitive-behavioral therapy on postpartum depression in traumatic childbirth: a Randomized Clinical Trial. J Midwifery Reprod Health. 2018;6(1):1122–1131.
40. Xiang YT, Yang Y, Li W, et al. Timely mental health care for the 2019 novel coronavirus outbreak is urgently needed. Lancet Psychiatry. 2020;7(3):228–229. doi:10.1016/S2215-0366(20)30046-8
41. van Rooijen G, Isvoranu AM, Kruijt OH, et al. A state-independent network of depressive, negative and positive symptoms in male patients with schizophrenia spectrum disorders. Schizophr Res. 2018;193(2018):232–239. doi:10.1016/j.schres.2017.07.035
42. American Psychiatric Association. Diagnostic and Statistical Manual of Mental Disorders (DSM-5). Washington, DC: American Psychiatric Pub; 2013.
43. Beck AT. Cognitive Models of Depression. NY: Springer; 2002.
44. Bos EH, Wanders RB. Group-level symptom networks in depression. JAMA Psychiatry. 2016;73(4):411–412. doi:10.1001/jamapsychiatry.2015.3103
 © 2021 The Author(s). This work is published and licensed by Dove Medical Press Limited. The
full terms of this license are available at https://www.dovepress.com/terms
and incorporate the Creative Commons Attribution
- Non Commercial (unported, 3.0) License.
By accessing the work you hereby accept the Terms. Non-commercial uses of the work are permitted
without any further permission from Dove Medical Press Limited, provided the work is properly
attributed. For permission for commercial use of this work, please see paragraphs 4.2 and 5 of our Terms.
© 2021 The Author(s). This work is published and licensed by Dove Medical Press Limited. The
full terms of this license are available at https://www.dovepress.com/terms
and incorporate the Creative Commons Attribution
- Non Commercial (unported, 3.0) License.
By accessing the work you hereby accept the Terms. Non-commercial uses of the work are permitted
without any further permission from Dove Medical Press Limited, provided the work is properly
attributed. For permission for commercial use of this work, please see paragraphs 4.2 and 5 of our Terms.