Back to Journals » Clinical Epidemiology » Volume 8
Maternal and infant characteristics: differences and similarities between the Nordic countries and the US
Authors Löfling L ![]() , Bröms G, Bahmanyar S, Kieler H
, Bröms G, Bahmanyar S, Kieler H
Received 9 February 2016
Accepted for publication 31 March 2016
Published 3 August 2016 Volume 2016:8 Pages 285—294
DOI https://doi.org/10.2147/CLEP.S106126
Checked for plagiarism Yes
Review by Single anonymous peer review
Peer reviewer comments 2
Editor who approved publication: Professor Henrik Toft Sørensen
Lukas Löfling, Gabriella Bröms, Shahram Bahmanyar, Helle Kieler
Department of Medicine, Solna Centre for Pharmacoepidemiology (CPE), Karolinska Institutet, Karolinska University Hospital, Stockholm, Sweden
Background: Data from the Nordic health care registers have been of great value in perinatal epidemiological research. It has been assumed that findings from the Nordic population (Denmark, Finland, Iceland, Norway, and Sweden) are applicable to other populations as well, including the population of the US.
Objective: To describe and compare maternal and infant characteristics between the Nordic and the American populations as recorded in the official statistics.
Materials and methods: This population-based study included data on all females who gave birth and their infants in the Nordic countries and the US. The data were obtained from the US National Center for Health Statistics and the official statistics data for the Nordic countries. The data from all six countries included births from 2006 to 2010.
Results: The mean maternal age at delivery was lower in the US than in the Nordic countries (27.5 vs 30.3 years). Cesarean sections (32.2% vs 17.9%), low birth weight (8.2% vs 4.8%), and preterm birth (12.3% vs 5.9%) were more common in the US than in the Nordic countries. Smoking during early pregnancy was slightly less common in the US compared with Nordic countries (9.8% vs 11.2%). Restricting the data from the US to females with a university degree, characteristics such as age at delivery, birth weight, and preterm deliveries were more in alignment with the Nordic data.
Conclusion: There are differences in some key maternal and neonatal characteristics between the Nordic countries and the US. However, some characteristics are related to socioeconomic status, suggesting that the Nordic data seem to be applicable to the part of the population in the US with a higher socioeconomic status.
Keywords: pregnancy, Nordic countries, US, health care registers
Background
The Nordic countries (Denmark, Finland, Iceland, Norway, and Sweden) have been collecting health data of high quality and complete coverage in national registers for decades.1–7 All the Nordic countries have public health care systems and it is mandatory for the health care professionals to report to the national registers, including data on births, cancer, in- and outpatient care visits, causes of death, and prescribed drugs.6,7
All residents of the Nordic countries are assigned a unique personal identification number at birth or immigration.6–9 The personal identification number allows for accurate linkage of information from the different registers. The possibility of linking data has made the Nordic health care registers valuable in epidemiological research.6,7
It has been assumed that findings in the Nordic population are applicable to other populations as well.10,11 However, due to genetic and socioeconomic differences between the Nordic and other populations, such as the population of the US, the generalizability of the data may be questioned. The aim of this population-based study was to describe and compare the characteristics of females and their infants in the Nordic countries and the US.
To the best of our knowledge, this is the first study that compares both similarities and differences in characteristics between the Nordic countries and the US among pregnant females and infants.
Materials and methods
Data source and study population
The study included data on all females who gave birth, and their infants, between 2006 and 2010 in the Nordic countries and the US. The American data were obtained from the official statistics held at the National Center for Health Statistics at the Centers for Diseases Control and Prevention.12 The Centers for Diseases Control and Prevention data files included data from the birth data files, the birth cohort – infant death data files, and the fetal death data files. The US data files are considered to have a high degree of completeness and 99% of all births are recorded in the birth data files. The Nordic data were obtained from the official statistics in each country13–22 and from a previous Nordic collaborative study based on information in the national health care registers.11 Some data from Finland were provided directly by the National Institute for Health and Welfare in Finland.23
Each Nordic country has a medical birth register that records detailed information on all females, deliveries, and their infants. The American data were based on birth certificates and included data on infants born after gestational week 17. In this study, a lower limit of 22 weeks gestational age was used for inclusion. The study was mainly based on official statistics from the Nordic countries and the US and included data at an aggregated level, which is publicly available on the Internet. For research containing no personal data there is, according to Swedish law, no requirement for ethics review. Data was also obtained from the previous Nordic collaborative study,11 and that study was approved by the Regional Ethical Review Board at Karolinska Institutet in Stockholm, Sweden; the National Board of Health, Denmark; the Danish Data Protection Agency; the National Institute for Health and Welfare of Finland; Statistics Finland; the Data Protection Authority and the National Bioethics Committee in Iceland; and the Norwegian Data Inspectorate.
Maternal and infant characteristics
Characteristics related to the pregnancy (maternal age, parity, maternal marital status, maternal country of birth, race, and smoking in early pregnancy), the delivery (cesarean section, number of infants, and gestational length), and the infants (birth weight, sex, congenital anomalies, stillbirth, and neonatal death) were compared between the Nordic countries and the US. Cesarean section was defined as a delivery performed by cesarean section independent of whether it was a planned or an emergency section. Parity was given based on the number of previous pregnancies leading to a delivery independent of whether the newborn was dead or alive at the time of birth. For the first pregnancy, the parity was zero. Number of infants were the number of infants born at a delivery and were grouped as single (one infant) or multiple (two or more infants). Maternal country of birth was only reported for the Nordic countries and the mothers were categorized as born in a Nordic country or not. Information on race was not available in the Nordic countries and was therefore only reported for the US as Whites, Blacks, American Indian/American native, or Asian/Pacific Islander. Low birth weight was defined as weight <2,500 g and high birth weight as >4,500 g. The sex of the infant was the sex reported on the birth certificate and was grouped as female or male. Preterm birth was defined as birth <37 gestational weeks and very preterm delivery as birth <32 gestational weeks. Post-term birth was defined as birth after ≥42 weeks of gestation. The congenital anomalies reported in the study were anencephaly, meningomyelocele/spina bifida, omphalocele/gastroschisis, and Down syndrome. Stillbirth was defined as the birth of an infant who showed no evidence of life after 22 weeks of gestation. Neonatal death was defined as the death of a live-born infant within the first 27 days after birth and was grouped as early neonatal death (0–6 days) and late neonatal death (7–27 days). Smoking in early pregnancy was defined as those who reported smoking during the first trimester. The marital status of the mother grouped as “married” included both legally married and cohabiting in Sweden, while in the US it only included the parents who were legally married. For Finland, Iceland, and Norway, information on legally married, cohabiting, and unmarried mothers was available in separate categories. No information on marital status was available from Denmark. The marital status was compared in two ways. First, “married” was compared, excluding Sweden, since Sweden did not have separate categories for married and cohabiting. Second, married and cohabiting as a combined variable in the Nordic countries was compared with married in the US. All data management and analysis were carried out using SAS 9.4 (SAS Institute Inc., Cary, NC, USA).
Statistical analysis
Descriptive estimates were calculated in the form of central tendency (mean values) and distributions. Estimates were presented together with 95% confidence intervals. For the Nordic data, the mean age for the aggregated years 2006–2010 was obtained by calculating the weighted mean age, using the number of deliveries per year to create the weight.
In additional analyses, characteristics related to the pregnancy, delivery, and infants were also estimated, restricting the data from the US to females who had graduated from university as a proxy for higher socioeconomic status (SES).
Results
In total, 22,593,635 births were included in the study, 21,099,903 from the US and 1,493,732 from the Nordic countries (Table 1).
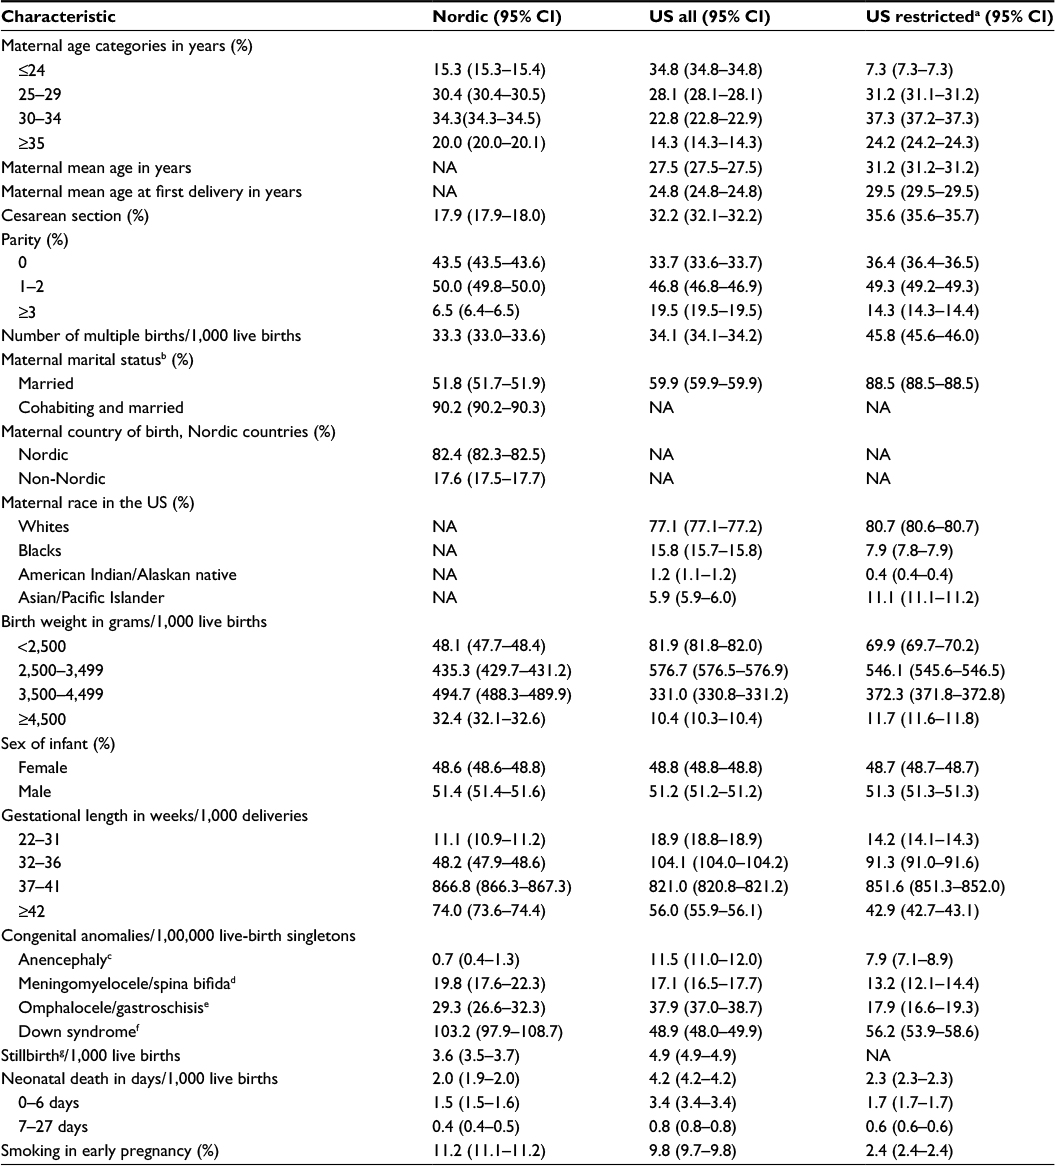 | Table 1 Point estimates and 95% CIs of maternal and infant characteristics for births between 2006 and 2010 in the US and the Nordic countries (Denmark, Finland, Iceland, Norway, and Sweden) Notes: aRestricted to American females with a university degree. bNordic data only include Finland, Iceland, and Norway. cAnencephaly (International Classification of Diseases 10th revision codes) ICD10:Q00; ICD9: 740. dMeningomyelocele ICD10: Q05; ICD9: 741. eOmphalocele/gastroschisis ICD10: Q79.2–79.3; ICD9: 756.72–756.73. fDown syndrome ICD10: Q90; ICD9: 758.0. gStillbirth was defined as birth of a fetus or an infant that shows no evidence of life typical of a live birth after 22 weeks of gestation. Abbreviations: CI, confidence interval; NA, not applicable. |
The mean maternal age at delivery was lower in the US compared to the Nordic countries, both for all deliveries (27.5 vs 30.3 years) and the first delivery (24.8 vs 28.3 years). The mean age for both the first delivery and all deliveries was stable in both the regions during the study period (Figures S1 and S2). Cesarean sections were almost twice as common in the US as in the Nordic countries (32.2% vs 17.9%), and the occurrence did not change during the study period (Figure S3). In the US, 19.5% of mothers had a parity ≥3. In the Nordic countries, the corresponding proportion was 6.5%. A higher proportion of females were married in the US compared to the Nordic countries (59.9% vs 51.8%). When comparing the Nordic combined variable of married and cohabiting to married in the USA, the proportion in the US was lower than in Nordic countries (59.9% vs 90.2%). Low birth weight (8.2% vs 4.8%) and preterm delivery (12.3% vs 5.9%) were more frequent in the US, while high birth weight (1.0% vs 3.3%) and post-term delivery (5.6% vs 7.4%) were less common in the US. The proportion of infants with low birth weight did not change over time in any of the compared populations (Figure S4).
The prevalence of congenital anomalies differed between the populations. For anencephaly, the prevalence was higher in the US (12 vs 1 per 1,00,000 live-birth singletons), and for Down syndrome the prevalence was lower in the US compared to the Nordic countries (49 vs 103 per 1,00,000 live-birth singletons). Smoking in early pregnancy was less common in the US than in the Nordic countries (9.8% vs 11.2%). Smoking varied widely among the Nordic countries: from 6.9% in Sweden to 18.0% in Norway (Table 2). The prevalence of smoking in early pregnancy decreased in both the Nordic countries and the US during the study period (Figure 1).
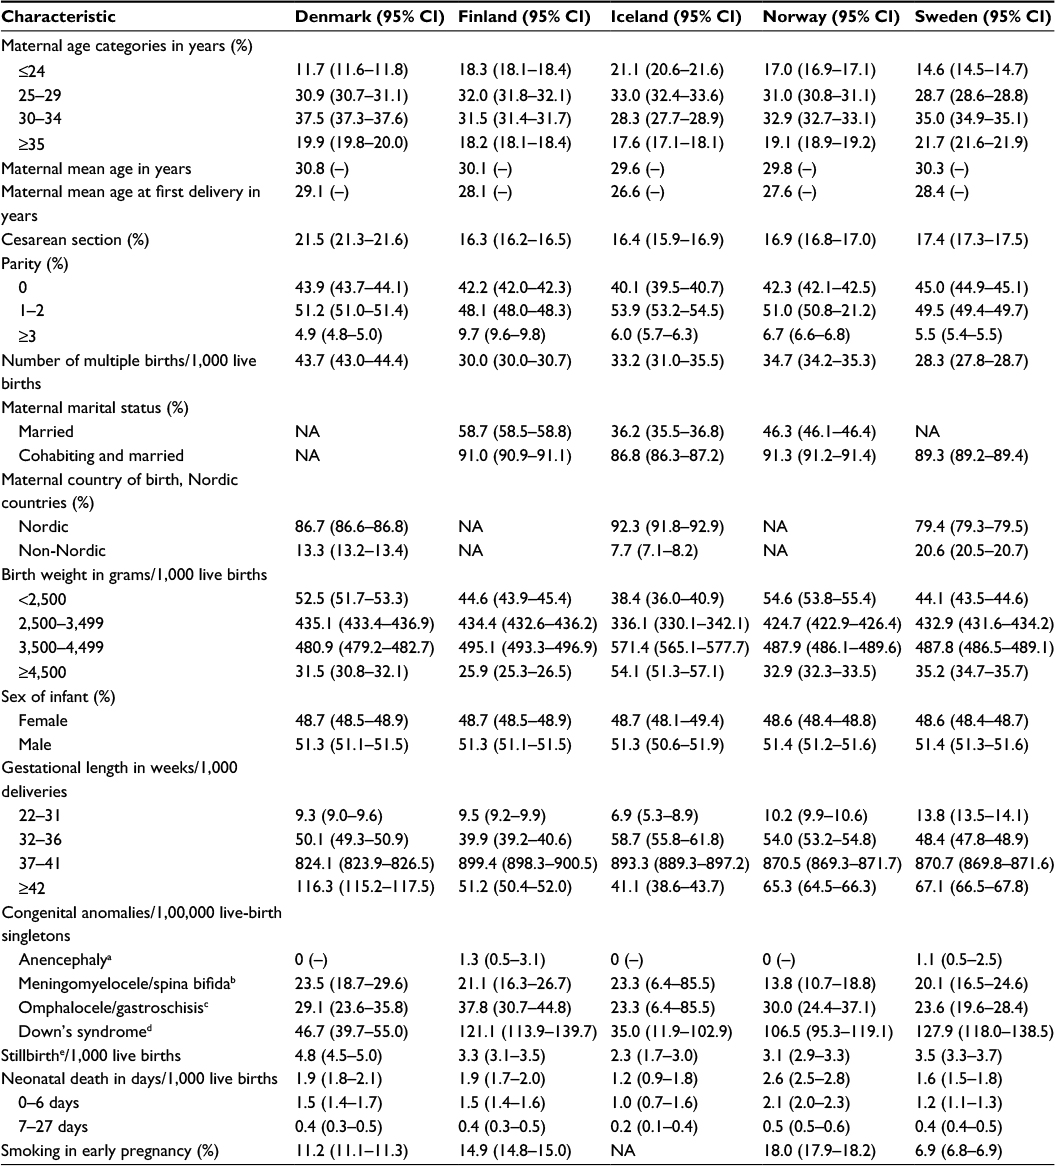 | Table 2 Point estimates and 95% CIs of maternal and infant characteristics for births between 2006 and 2010 by Nordic countries (Denmark, Finland, Iceland, Norway, and Sweden) Notes: aAnencephaly ICD10:Q00; ICD9: 740. bMeningomyelocele ICD10: Q05; ICD9: 741. cOmphalocele/gastroschisis ICD10: Q79.2–79.3; ICD9: 756.72–756.73. dDown syndrome ICD10: Q90; ICD9: 758.0. eStillbirth was defined as birth of a fetus or an infant that shows no evidence of life typical of a live birth after 22 weeks of gestation. Abbreviations: CI, confidence interval; NA, not applicable. |
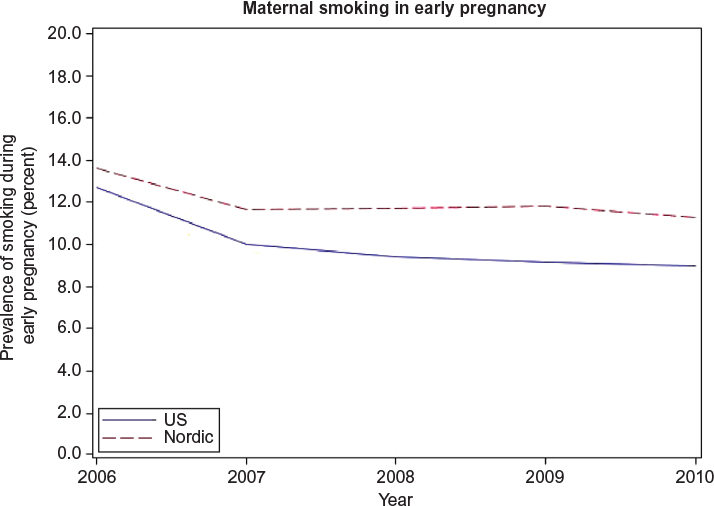 | Figure 1 Prevalence of females who gave birth and reported smoking during early pregnancy in the US and the Nordic countries between 2006 and 2010. |
Restricting the data from the US to only include females with a university degree revealed that their characteristics were more similar to those of females in the Nordic countries, eg, maternal age at all deliveries (31.2 years), maternal age at the time of the first delivery (29.5 years), parity ≥3 (14.3%), birth weight <2,500 g (7.0%), and preterm delivery <37 weeks of gestation (10.6%). The proportion of married pregnant females with a university degree in the US was similar to that of Nordic females who were married or cohabiting (88.5% vs 90.2%).
Discussion
In this comparison between the Nordic countries and the US, which included over 20 million pregnancies, we found that the mean maternal age was higher in the Nordic countries both for the first delivery and for all deliveries. The prevalence of cesarean section was almost twice as high in the US. Having at least three children, being married, low birth weight, preterm delivery, and anencephaly were more common in the US, whereas in the Nordic countries, it was more common that infants had a high birth weight, were born post-term, or had Down’s syndrome. Smoking in early pregnancy was more common in the Nordic countries.
The observed differences in the characteristics of pregnant populations of the US and the Nordic countries likely contribute to differences seen in pregnancy outcomes. In the US, ∼40% of the deliveries in 2003 were covered by Medicaid, a social health care program for families and individuals with low income and resources.24 This indicates that a high proportion of the mothers in the US had a low SES, which likely affected many of the variables assessed in this study. When restricting the US data to females with a university degree, as a proxy for higher SES, the characteristics were more similar to those of Nordic females. However, there were still differences between the groups, which are likely due to factors other than SES, such as genetic differences, or differences on a structural level in the society affecting all citizens independent of SES (eg, treatment recommendations, procedures, or organizations of the health care systems). Nevertheless, this indicates that the Nordic population mirrors those in the US with a higher SES better than the overall US population. It is also worth mentioning that, in Sweden, in 2010, ∼42% of all females in the age 25–64 years had a university degree.25
The prevalence of cesarean section increases with age.26 However, the results in this study found that cesarean section was less common in the Nordic countries compared to the US, despite a higher mean age at delivery. This contradiction may reflect different obstetric practices and health care system organizations. Cesarean section may affect morbidity and mortality later on in life for infants as well as mothers. For example, infants delivered by cesarean section have both short- and long-term increased risk of developing type 1 diabetes, asthma, and allergies.27,28 Cesarean sections have been associated with different complications for the mother, eg, an increased risk of preeclampsia in subsequent pregnancies,29 but may also have beneficial effects, such as lower risk of adverse birth outcomes in breech presentations and decreased risk of pelvic organ prolapse symptoms.30,31 Though the World Health Organization in 1985 set the optimal rates for cesarean section to be 10%–15%, the rates have continued to increase globally, including in the Nordic countries.32,33
Low maternal SES has been associated with an increased risk of both giving birth to infants with low birth weight (<2,500 g) and preterm deliveries (<37 weeks).34 A higher proportion of females with low SES in the US may explain the higher proportion of low birth weight and preterm deliveries in the US. As for cesarean delivery, both low and high birth weight may explain a higher occurrence of conditions seen later on in life. Low birth weight has been associated with systolic hypertension, asthma, and type 2 diabetes.35–37 High birth weight, which was more frequent in the Nordic countries, has also been associated with an increased risk of poor health such as type 1 and 2 diabetes, and obesity.35,38,39
The higher proportion of mothers with a parity ≥3 in the US may be a result of younger age at first delivery, allowing time for more pregnancies to occur during a female’s reproductive lifetime. It is also possible that the higher parity reflects religious and cultural differences between the compared regions.
There was a small difference in the prevalence of congenital anomalies between the compared regions. However, due to the rarity of congenital anomalies, the small number of observed cases limit the possibility to determine any real difference between the Nordic countries and the US. For example, during the 5 years studied, there were only nine cases of anencephaly in the Nordic countries. The observed differences could be due to differences in clinical practice such as routine ultrasounds during pregnancy and attitudes toward termination. The higher maternal age at delivery in the Nordic countries may contribute to the higher prevalence of Down syndrome seen in the Nordic countries.
It should be noted that, for the US, previous studies found the prevalence data concerning the anomalies that were assessed in this comparison to be underestimated.40,41 Data from Sweden42–46 and Finland47,48 also indicate that anomalies could be underreported in the medical birth registers, as some anomalies may be diagnosed after discharge from the postnatal care units and for that reason may not get included in the birth registers.
According to previous studies, smoking during pregnancy is more common among mothers with a low SES and younger mothers.49,50 With this in mind, and the assumed higher proportion of mothers with low SES in the US, it would be expected that smoking is more common in the US than in the Nordic countries. The higher prevalence in the Nordic countries was mainly due to the high prevalence in Finland (14.9%) and Norway (18.0%) (Table 2). In Norway, smoking was only recorded for females who gave their consent to register this information.13–17 Accordingly, the actual proportion of smokers during early pregnancy may be even higher in Norway.
Strengths
This study has covered all births in the Nordic countries and the US that occurred between 2006 and 2010, and the completeness of data in all countries is high.12,51 The large number of pregnancies obtained from using the registers facilitated comparison of the groups with a good degree of accuracy. The use of register data reduces the level of recall bias and sampling uncertainty. The study also included information concerning several covariates, which are important when considering differences in pregnancy outcomes.
Limitations
Some of the assessed variables were not available in all the Nordic countries. For example, maternal marital status was missing for Denmark; maternal country of birth was missing for Finland and Norway. Smoking during pregnancy was not captured in Iceland and in Norway only the mothers who gave their consent were registered as smokers. However, as the missing data were for a whole population, this cannot cause bias. Discrepancies between the different countries regarding the exact time period during pregnancy for which the characteristics were recorded may be a limitation to the comparisons.
Conclusion
There are some differences in maternal and neonatal characteristics between the Nordic countries and the US and it is important to be aware of these differences when generalizing findings based on data from the Nordic countries to the general US population. It is notable that the Nordic maternal and neonatal characteristics were more similar to those of the females in the US with a university degree, indicating that SES should be taken into consideration when generalizing findings from the Nordic countries.
Acknowledgment
We would like to thank Sarah Burkill for her help with the language copyediting.
Author contributions
All authors contributed toward data analysis, drafting and revising the paper and agree to be accountable for all aspects of the work.
Disclosure
The authors report no conflicts of interest in this work.
References
Gissler M, Teperi J, Hemminki E, Merilainen J. Data quality after restructuring a national medical registry. Scand J Soc Med. 1995;23(1):75–80. | ||
Teperi J. Multi method approach to the assessment of data quality in the Finnish Medical Birth Registry. J Epidemiol Community Health. 1993;47(3):242–247. | ||
Knudsen LB, Olsen J. The Danish Medical Birth Registry. Dan Med Bull. 1998;45(3):320–323. | ||
Melve KK, Lie RT, Skjaerven R, et al. Registration of Down syndrome in the Medical Birth Registry of Norway: validity and time trends. Acta Obstet Gynecol Scand. 2008;87(8):824–830. | ||
Cnattingius S, Ericson A, Gunnarskog J, Kallen B. A quality study of a medical birth registry. Scand J Soc Med. 1990;18(2):143–148. | ||
Kieler H. Nordic databases to evaluate medications in pregnancy. Therapie. 2014;69(1):65–69. | ||
Rosen M. National Health Data Registers: a Nordic heritage to public health. Scand J Public Health. 2002;30(2):81–85. | ||
Furu K, Wettermark B, Andersen M, Martikainen JE, Almarsdottir AB, Sorensen HT. The Nordic countries as a cohort for pharmacoepidemiological research. Basic Clin Pharmacol Toxicol. 2010;106(2):86–94. | ||
Langhoff-Roos J, Krebs L, Klungsoyr K, et al. The Nordic medical birth registers – a potential goldmine for clinical research. Acta Obstet Gynecol Scand. 2014;93(2):132–137. | ||
Ludvigsson JF, Strom P, Lundholm C, et al. Maternal vaccination against H1N1 influenza and offspring mortality: population based cohort study and sibling design. BMJ. 2015;351:h5585. | ||
Kieler H, Artama M, Engeland A, et al. Selective serotonin reuptake inhibitors during pregnancy and risk of persistent pulmonary hypertension in the newborn: population based cohort study from the five Nordic countries. BMJ. 2012;344:d8012. | ||
Center for diseases prevention (CDC). Vital statistics; 2015. Available from: http://www.cdc.gov/nchs/data_access/VitalStatsOnline.htm. Accessed September 29, 2015. | ||
Norwegian Institute of Public Health. Årstabeller for Medisinsk Fødselsregister 2005–2006; 2008. Available from: http://www.fhi.no/dokumenter/b268921580.pdf. Accessed October 12, 2015. | ||
Norwegian Institute of Public Health. Årstabeller for Medisinsk Fødselsregister 2007; 2009. Available from: http://www.fhi.no/dokumenter/676bc56530.pdf. Accessed October 12, 2015. | ||
Norwegian Institute of Public Health. Årstabeller for Medisinsk Fødselsregister 2008; 2010. Available from: http://www.fhi.no/dokumenter/b05ede8c59.pdf. Accessed October 12, 2015. | ||
Norwegian Institute of Public Health. Årstabeller for Medisinsk Fødselsregister 2009; 2011. Available from: http://www.fhi.no/dokumenter/9a55cc5467.pdf. Accessed October 12, 2015. | ||
Norwegian Institute of Public Health. Årstabeller for Medisinsk Fødselsregister 2010; 2012. Available from: http://www.fhi.no/dokumenter/d3421cc3c3.pdf. Accessed October 12, 2015. | ||
THL. Perinatal Statistics in the Nordic countries 2012. National Institute for Health and Welfare - Finland. 2014. Available from: https://www.julkari.fi/bitstream/handle/10024/125322/Tr31_14.pdf?sequence=3. Accessed October 14, 2015. | ||
THL. Perinatal Statistics: Parturients, Deliveries and Newborns 2013; 2014. Available from: https://www.julkari.fi/bitstream/handle/10024/116818/Tr23_14.pdf?sequence=3. Accessed October 14, 2015. | ||
Hagstofa Islands. Births and Deaths. Available from: http://www.statice.is/Statistics/Population/Births-and-deaths. Accessed October 16, 2015. | ||
Statistics Denmark (DST). Population and elections – births; 2015. Available from: http://www.statbank.dk/statbank5a/default.asp?w=2560. Accessed October 19, 2015. | ||
Socialstyrelsen. Pregnancies, Deliveries and Newborn Infants – The Swedish Medical Birth Register 1973–2013; 2014. Available from: https://www.socialstyrelsen.se/Lists/Artikelkatalog/Attachments/19627/2014-12-19.pdf. Accessed October 29, 2015. | ||
THL. National Institute for Health and Welfare; 2015. Available from: https://www.thl.fi/sv/web/thlfi-en. Accessed October 27, 2015. | ||
Garcia G. Maternal and Child Health (MCH) Update: States Increase Eligibility for Childrens’s Health in 2007; 2008. Available from: http://www.nga.org/files/live/sites/NGA/files/pdf/0811MCHUPDATE.PDF. Accessed October 20, 2015. | ||
Statistics Sweden, SCB. Utbildningsnivå 1990–2014 efter kön, 25–64 år; 2014. Available from: http://www.scb.se/sv_/Hitta-statistik/Statistik-efter-amne/Utbildning-och-forskning/Befolkningens-utbildning/Befolkningens-utbildning/#c_undefined. Accessed January 25, 2016. | ||
Luke B, Brown MB. Elevated risks of pregnancy complications and adverse outcomes with increasing maternal age. Hum Reprod. 2007;22(5):1264–1272. | ||
Thavagnanam S, Fleming J, Bromley A, Shields MD, Cardwell CR. A meta-analysis of the association between caesarean section and childhood asthma. Clin Exp Allergy. 2008;38(4):629–633. | ||
Bager P, Wohlfahrt J, Westergaard T. Caesarean delivery and risk of atopy and allergic disease: meta-analyses. Clin Exp Allergy. 2008;38(4):634–642. | ||
Cho GJ, Kim LY, Min KJ, et al. Prior cesarean section is associated with increased preeclampsia risk in a subsequent pregnancy. BMC Pregnancy Childbirth. 2015;15:24. | ||
Trutnovsky G, Kamisan Atan I, Martin A, Dietz HP. Delivery mode and pelvic organ prolapse: a retrospective observational study. BJOG. Epub 2015 Oct 5. | ||
Villar J, Carroli G, Zavaleta N, et al. Maternal and neonatal individual risks and benefits associated with caesarean delivery: multicentre prospective study. BMJ. 2007;335(7628):1025. | ||
Betran AP, Torloni MR, Zhang J, et al. What is the optimal rate of caesarean section at population level? A systematic review of ecologic studies. Reprod Health. 2015;12:57. | ||
WHO. Appropriate technology for birth. Lancet. 1985;2(8452):436–437. | ||
Blumenshine P, Egerter S, Barclay CJ, Cubbin C, Braveman PA. Socioeconomic disparities in adverse birth outcomes: a systematic review. Am J Prev Med. 2010;39(3):263–272. | ||
Harder T, Rodekamp E, Schellong K, Dudenhausen JW, Plagemann A. Birth weight and subsequent risk of type 2 diabetes: a meta-analysis. Am J Epidemiol. 2007;165(8):849–857. | ||
Mu M, Wang SF, Sheng J, et al. Birth weight and subsequent blood pressure: a meta-analysis. Arch Cardiovasc Dis. 2012;105(2):99–113. | ||
Mu M, Ye S, Bai MJ, et al. Birth weight and subsequent risk of asthma: a systematic review and meta-analysis. Heart Lung Circ. 2014;23(6):511–519. | ||
Harder T, Roepke K, Diller N, Stechling Y, Dudenhausen JW, Plagemann A. Birth weight, early weight gain, and subsequent risk of type 1 diabetes: systematic review and meta-analysis. Am J Epidemiol. 2009;169(12):1428–1436. | ||
Johnsson IW, Haglund B, Ahlsson F, Gustafsson J. A high birth weight is associated with increased risk of type 2 diabetes and obesity. Pediatr Obes. 2015;10(2):77–83. | ||
Parker SE, Mai CT, Canfield MA, et al. Updated National Birth Prevalence estimates for selected birth defects in the United States, 2004–2006. Birth Defects Res A Clin Mol Teratol. 2010;88(12):1008–1016. | ||
Watkins ML, Edmonds L, McClearn A, Mullins L, Mulinare J, Khoury M. The surveillance of birth defects: the usefulness of the revised US standard birth certificate. Am J Public Health. 1996;86(5):731–734. | ||
Socialstyrelsen. Birth Defects 2006; 2007. Available from: http://www.socialstyrelsen.se/lists/artikelkatalog/attachments/9323/2007-42-14_20074214.pdf. Accessed October 14, 2015. | ||
Socialstyrelsen. Birth Defects 2007; 2008. Available from: http://www.socialstyrelsen.se/Lists/Artikelkatalog/Attachments/8722/2008-125-22_200812522_rev.pdf. Accessed October 14, 2015. | ||
Socialstyrelsen. Birth Defects 2008; 2009. Available from: https://www.socialstyrelsen.se/Lists/Artikelkatalog/Attachments/17807/2009-11-6.pdf. Accessed October 14, 2015. | ||
Socialstyrelsen. Birth Defects 2009; 2010. Available from: https://www.socialstyrelsen.se/Lists/Artikelkatalog/Attachments/18175/2010-11-16.pdf. Accessed October 14, 2015. | ||
Socialstyrelsen. Birth Defects 2010; 2011. Available from: https://www.socialstyrelsen.se/Lists/Artikelkatalog/Attachments/18481/2011-11-10.pdf. Accessed October 14, 2015. | ||
THL. Congenital Anomalies 1993–2008; 2011. Available from: http://www.stakes.fi/tilastot/tilastotiedotteet/2011/Tr07_11.pdf. Accessed November 16, 2015. | ||
THL. Congenital Anomalies 1993–2011; 2014. Available from: http://www.julkari.fi/bitstream/handle/10024/114911/Tr06_14.pdf?sequence=4. Accessed October 14, 2015. | ||
Ekblad M, Gissler M, Korkeila J, Lehtonen L. Trends and risk groups for smoking during pregnancy in Finland and other Nordic countries. Eur J Public Health. 2014;24(4):544–551. | ||
Raisanen S, Kramer MR, Gissler M, Saari J, Hakulinen-Viitanen T, Heinonen S. Smoking during pregnancy was up to 70% more common in the most deprived municipalities – a multilevel analysis of all singleton births during 2005–2010 in Finland. Prev Med. 2014;67:6–11. | ||
Gissler M. Registration of births and induced abortions in the Nordic countries – Finnish yearbook of population research XLV; 2010:171–178. Available from: http://ojs.tsv.fi/index.php/fyp/article/viewFile/45059/11337. Accessed March 24, 2016. |
Supplementary materials
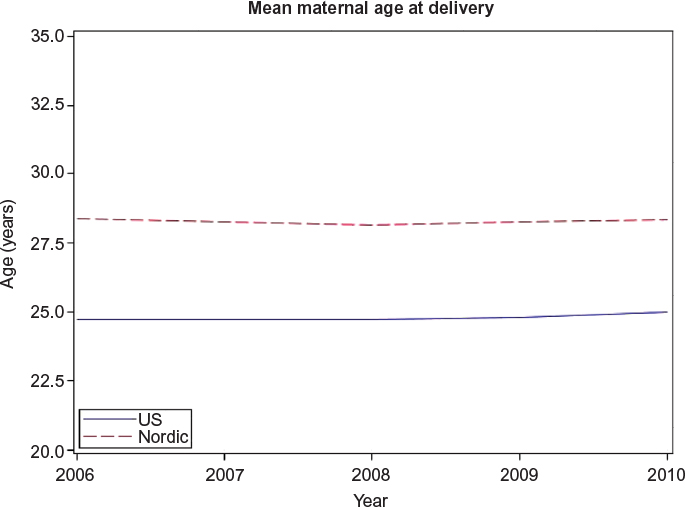 | Figure S1 Mean age at delivery for females who gave birth in the US and in the Nordic countries between 2006 and 2010. |
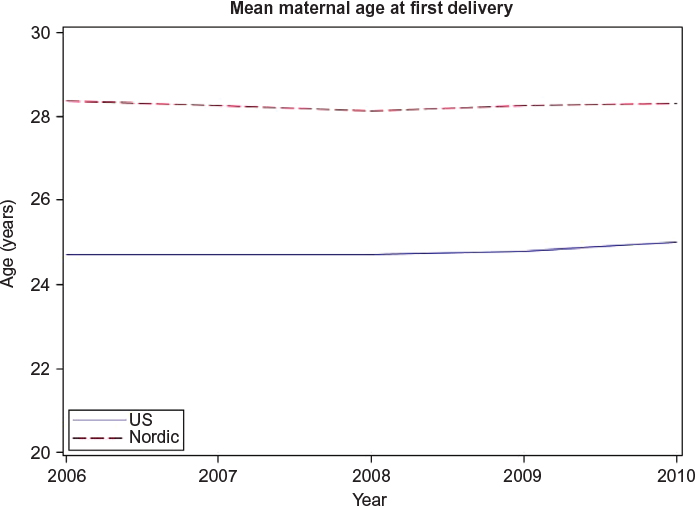 | Figure S2 Mean age at first delivery for females who gave birth in the US and the Nordic countries between 2006 and 2010. |
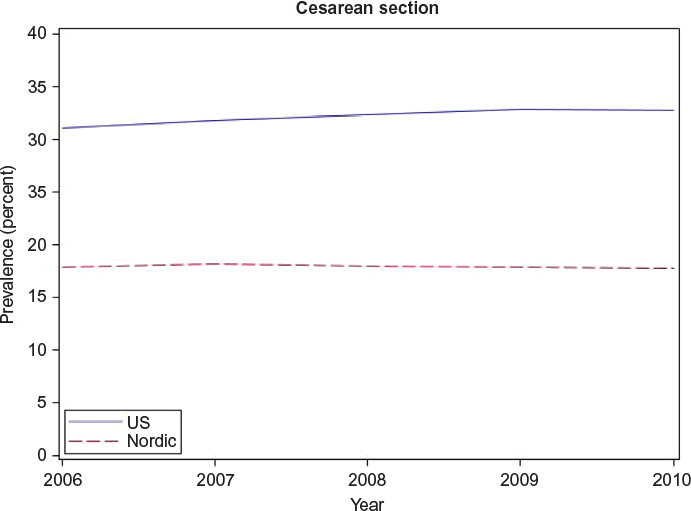 | Figure S3 Prevalence of cesarean section of females who gave birth in the US and the Nordic countries between 2006 and 2010. |
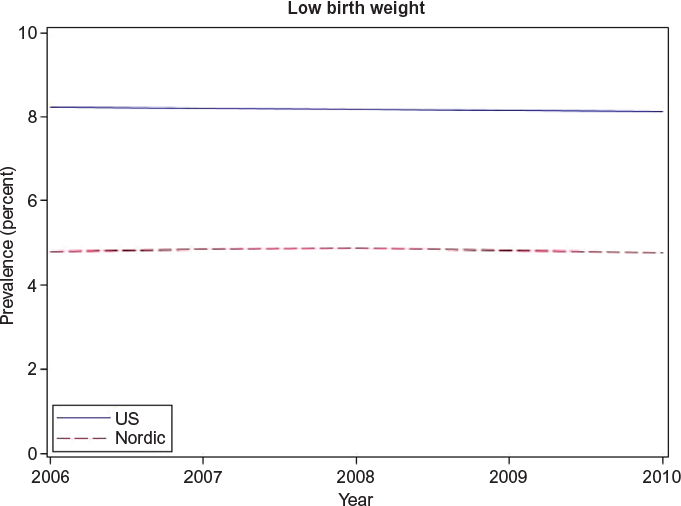 | Figure S4 Prevalence of low birth weight among infants born in the US and the Nordic countries between 2006 and 2010. |
 © 2016 The Author(s). This work is published and licensed by Dove Medical Press Limited. The
full terms of this license are available at https://www.dovepress.com/terms
and incorporate the Creative Commons Attribution
- Non Commercial (unported, 3.0) License.
By accessing the work you hereby accept the Terms. Non-commercial uses of the work are permitted
without any further permission from Dove Medical Press Limited, provided the work is properly
attributed. For permission for commercial use of this work, please see paragraphs 4.2 and 5 of our Terms.
© 2016 The Author(s). This work is published and licensed by Dove Medical Press Limited. The
full terms of this license are available at https://www.dovepress.com/terms
and incorporate the Creative Commons Attribution
- Non Commercial (unported, 3.0) License.
By accessing the work you hereby accept the Terms. Non-commercial uses of the work are permitted
without any further permission from Dove Medical Press Limited, provided the work is properly
attributed. For permission for commercial use of this work, please see paragraphs 4.2 and 5 of our Terms.