Back to Archived Journals » Advances and Applications in Bioinformatics and Chemistry » Volume 10
Mapping circulating serum miRNAs to their immune-related target mRNAs
Authors Nosirov B, Billaud J, Vandenbon A, Diez D, Wijaya E, Ishii KJ, Teraguchi S, Standley DM ![]()
Received 5 September 2016
Accepted for publication 7 November 2016
Published 2 February 2017 Volume 2017:10 Pages 1—9
DOI https://doi.org/10.2147/AABC.S121598
Checked for plagiarism Yes
Review by Single anonymous peer review
Peer reviewer comments 2
Editor who approved publication: Dr Juan Fernandez-Recio
Bakhtiyor Nosirov,1 Joël Billaud,1 Alexis Vandenbon,2 Diego Diez,3 Edward Wijaya,1 Ken J Ishii,4,5 Shunsuke Teraguchi,3 Daron M Standley1,6
1Systems Immunology Lab, 2Immuno-Genomics Research Unit, 3Quantitative Immunology Research Unit, 4Laboratory of Vaccine Science, WPI Immunology Frontier Research Center, Osaka University, Suita, 5Laboratory of Adjuvant Innovation, National Institute of Biomedical Innovation, Osaka, 6Lab of Integrated Biological Information, Institute for Virus Research Kyoto University, Kyoto, Japan
Purpose: Evidence suggests that circulating serum microRNAs (miRNAs) might preferentially target immune-related mRNAs. If this were the case, we hypothesized that immune-related mRNAs would have more predicted serum miRNA binding sites than other mRNAs and, reciprocally, that serum miRNAs would have more immune-related mRNA targets than non-serum miRNAs.
Materials and methods: We developed a consensus target predictor using the random forest framework and calculated the number of predicted miRNA–mRNA interactions in various subsets of miRNAs (serum, non-serum) and mRNAs (immune related, nonimmune related).
Results: Immune-related mRNAs were predicted to be targeted by serum miRNA more than other mRNAs. Moreover, serum miRNAs were predicted to target many more immune-related mRNA targets than non-serum miRNAs; however, these two biases in immune-related mRNAs and serum miRNAs appear to be completely independent.
Conclusion: Immune-related mRNAs have more miRNA binding sites in general, not just for serum miRNAs; likewise, serum miRNAs target many more mRNAs than non-serum miRNAs overall, regardless of whether they are immune related or not. Nevertheless, these two independent phenomena result in a significantly larger number of predicted serum miRNA–immune mRNA interactions than would be expected by chance.
Keywords: biomarker, posttranscriptional regulation, random forest, target prediction
Introduction
MicroRNAs (miRNAs) are small (~21 nucleotides long) noncoding RNAs that function as posttranscriptional regulators of gene expression in metazoans and plants.1 The identification of stable circulating miRNAs in mammals within a wide range of bodily fluids, including serum, suggested their use as noninvasive biomarkers.2 Indeed serum miRNA levels have been observed to correlate with a number of diseases, including various cancers, which has attracted great interest for their use for cancer diagnosis and to predict prognosis and response to therapy.3
Both the cellular origin and biological function of extracellular miRNAs remain controversial.4 Evidence exists for both passive release of miRNA from cells during cell death and cell–cell signaling, especially by circulating miRNAs encapsulated within apoptotic bodies or exosomes.5,6 Interestingly, blood cell counts significantly influence plasma miRNA biomarker levels, and many reported miRNA cancer biomarkers are in fact highly expressed in blood cells, suggesting that the levels of some circulating serum miRNAs are by-products of immune cell function.5 Regardless of the precise origins of circulating serum miRNAs, their known correlation with disease states, along with their co-localization with circulating immune cells, suggests that they represent a rich source of information about the status of the immune system. Consistently, a number of miRNAs have been shown to have critical roles in the regulation and development of adaptive and innate immune cells.7
A more mechanistic understanding of circulating miRNAs in the regulation of immune cell responses and development would enhance their use as disease biomarkers.8 One critical step in this direction is to associate circulating miRNAs with specific mRNA targets. Experimental identification of miRNA–mRNA interactions has been carried out using both small- and large-scale methods. Small-scale methods generally involve perturbing the expression level of a single miRNA of interest in a cell line or a tissue, following expression changes in putative targets and finally confirming the interaction physically.9 Recently, cross-linking immunoprecipitation (CLIP)-based techniques have been applied to miRNA–mRNA detection (high-throughput sequencing of RNA isolated by crosslinking immunoprecipitation [HITS-CLIP] and photoactivatable ribonucleoside-enhanced crosslinking and immunoprecipitation [PAR-CLIP]), greatly expanding the scope of putative miRNA–mRNA interactions.10,11 Computational miRNA–mRNA prediction integrates experimentally observed interactions along with sequence-level complementarity, conservation and other features.12 The use of both small-scale and large-scale datasets to train and test miRNA–mRNA target prediction remains challenging due to differences in the precision of various experimental approaches.
A 2008 study that used a simple consensus-based predictor found that the 3′-untranslated regions (UTRs) of immune-related genes had more predicted miRNA binding sites than background genes.13 This study did not distinguish between circulating and noncirculating miRNAs. We speculated that circulating serum miRNAs (referred to here as serum miRNAs) preferentially target genes expressed highly in immune cells. Specifically, we hypothesized that immune-related mRNAs would have more predicted serum miRNA binding sites than other mRNAs and, reciprocally, that serum miRNAs would have more predicted immune-related mRNA targets than non-serum miRNAs.
To test our hypotheses, we developed a consensus predictor using the random forest (RF) framework and carefully trained it on data from both validated small-scale miRNA–mRNA interaction experiments and recent large-scale data for both human and mouse miRNAs. We monitored the amount of large-scale data in order to identify an optimal balance between the two data sources. The results were highly consistent between human beings and mice in spite of the fact that independent data sources were utilized. Interestingly, although we found that immune-related mRNAs were predicted to be targeted by serum miRNAs modestly more than other mRNAs and that serum miRNAs were predicted to target many more immune-related mRNA targets than non-serum miRNAs, the two phenomena are, in fact, independent. That is, immune-related mRNAs have more miRNA binding sites in general, not just for serum miRNAs; reciprocally, serum miRNAs target many more mRNAs in general, not just immune-related mRNAs. In spite of this independence, the combined miRNA and mRNA biases result in a much greater number of serum miRNA–immune mRNA interactions than expected by chance.
Materials and methods
Sequence data sources
All human and mouse miRNAs were taken from miRBase (v21).14 Human and mouse mRNAs were retrieved from the Ensembl database.15 If the Ensemble mRNAs transcripts could be associated with established microarray experiments, they were used for further study.16,17 This mapping resulted in 22,084 and 23,575 mRNAs in human beings and mice, respectively.
Immune-related mRNAs
Immune-related mRNAs in human beings were taken from the microarray-based immune response in silico dataset.16 This dataset consists of human mRNAs for which significantly higher expression was observed in any of six immune cell types (T-cell, B-cell, natural killer cell, monocyte, dendritic cell and neutrophil) than in a representative set of nonimmune cells (brain, lung and kidney cells).16 Immune-related mRNAs in a mouse consisted of 1,227 orthologous mRNAs that had immune cell lineage-specific expression signatures in both human beings and mice.18 All mRNA names were mapped to the latest version of Ensembl, and only those with unambiguous gene names and annotations were retained for further analysis, resulting in 1,632 and 1,221 immune-related mRNAs in human beings and mice, respectively.
Circulating miRNAs
A set of 93 circulating miRNAs were taken from a previous study that demonstrated consistent expression levels in the serum of a large group of healthy donors.2 A set of 96 mouse serum miRNAs was assembled from two previous studies.19,20 Nomenclature of both human and mouse miRNAs was corrected so that they corresponded to their latest version of miRBase (v21).14
miRNA–mRNA interactions
A set of 777 high-confidence, experimentally validated small-scale miRNA–mRNA interactions was extracted from miRecords.9 A subset of large-scale (HITS-CLIP and PAR-CLIP) interactions was taken from DIANA-TarBase v7.21 The large-scale interactions were sorted by the number of times each interaction was observed in an independent experiment. The selection of how many large-scale interactions to use was based on the performance of the consensus-based predictor, as described in the following. In brief, the large-scale interactions were added to the small-scale interactions incrementally and were used for training and testing the consensus-based predictor and for testing each individual predictor, as described in the following.
Computational miRNA–mRNA target prediction
Individual target predictors used in this study included TargetScan, DIANA-microT-CDS, miRDB and miRanda.22–25 The choice of target predictors was based on the fact that, collectively, these predictors cover most features used in miRNA–mRNA target prediction and that they are regularly updated.26,27
We developed a consensus predictor based on the output of these four independent target predictors. Our consensus prediction method utilized the RF framework as implemented in the RandomForestClassifier class in the sklearn.ensemble package of the Python programming language. Raw outputs of the four individual predictors differed in scale and sign. For the TargetScan predictions, we used the context score of predicted miRNA–mRNA interactions.28 For DIANA-microT-CDS, the miTG score was used.24 For MiRanda, the mirSVR score was used after reversing the sign.22 Each score was scaled between 0 and 1 using min–max normalization.
In addition to the scores, the consensus method utilized the minimum distance between binding locations as a feature, the logic being that predictions with a smaller spread in distances would be more reliable. All training was carried out using the Matthews correlation coefficient (MCC) as a target function with the experimental miRNA–mRNA interactions randomly divided into 80% training and 20% test data. For estimating the number of trees (n_estimators) and maximum tree depth (n_ features), threefold cross-validation was used while searching a grid of values in the 5–100 and 1–20 range using a fixed set of 1,277 large-scale interactions and 777 small-scale interactions. Optimal values of 46 and 3 were subsequently obtained for the number of trees and maximum tree depth, respectively.
Further training of the consensus-based predictor involved adjusting the number of large-scale interactions based on the performance of the consensus predictor. We iteratively added the large-scale interactions to the 777 manually curated interactions in steps of 100 interactions. At each step, we examined the MCC from each individual predictor and our meta-predictor. The experimental data were again randomly split into training (80%) and test (20%) sets, as mentioned earlier. We artificially kept the class imbalance constant by repeated random sampling negative examples. To limit noise from random sampling and splitting, we repeated this operation 10 times for each dataset size.
Results and discussion
Consensus target prediction shows stable improvement over individual predictors
We evaluated four target prediction methods (DIANA-microT-CDS, TargetScan, miRDB and miRanda) and the consensus method, while adjusting the number of large-scale interactions used. First, we sorted the large-scale experimental data by the frequency that the interaction was observed in independent experiments. Next, we iteratively added these sorted interactions to 777 manually curated interactions, 100 interactions at a time. At each step, we computed the MCC for each individual predictor and the consensus predictor. We repeated this retraining 10 times for each dataset size.
Figure 1 shows the MCC of the consensus method along with the individual methods for the first 10 steps, where the x-axis shows the size of the large-scale data portion. As the figure shows, the mean MCC value of the consensus method was consistently above that of the individual predictors. This relative performance was maintained even when the dataset was dominated by the large-scale data (Figure S1A–D). The consensus MCC value reached a peak of 0.45 at the fifth step (red dashed line), indicating addition of 500 large-scale interactions. As the small-scale/large-scale balance shifted more toward large-scale data, the performance of all predictors, including the consensus-based predictor, declined, suggesting that the large-scale data are either noisy or that the features used in the predictors were insufficient to learn from the additional data. The consensus-based method consistently achieved a higher overall MCC value (0.37) than any of the individual predictors (0.33, 0.30, 0.33 and 0.21 for DIANA-microT-CDS, TargetScan, miRDB and miRanda, respectively). For these reasons, we used the consensus predictor and selected the RF model trained at the fifth step for all subsequent analysis.
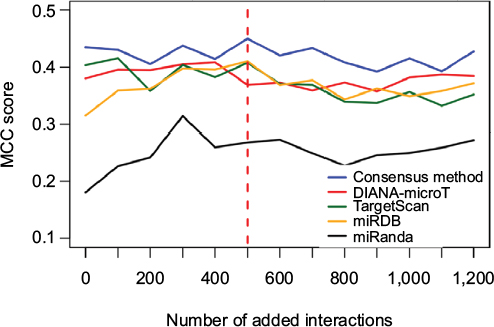 | Figure 1 Performance of the predictors based on large-scale data. Note: The red dashed line indicates the dataset size for which the RF-based consensus method achieved the maximum MCC. Abbreviations: MCC, Matthews correlation coefficient; RF, random forest. |
Serum miRNAs exhibit apparent preference for immune-related mRNAs
We next examined the number of miRNA–mRNA interactions for different subsets of miRNAs (serum, non-serum) and mRNAs (immune, nonimmune). We observed a modest but statistically significant (median values 3 and 4, Mann–Whitney U test: p-value 1.76E - 18) increase in the number of interactions for immune-related human mRNAs with serum miRNAs compared to nonimmune-related mRNAs, as shown in Figure 2A. Moreover, a similar trend was observed for mouse immune-related mRNAs (Figure S2A), which is consistent with previous observations that immune-related mRNAs have more miRNA binding sites than nonimmune-related mRNAs.13 Next, we examined the reciprocal relationship and analyzed the number of immune-related mRNAs targeted by serum and non-serum miRNAs. As shown in Figure 2B, serum miRNAs target many more immune-related mRNAs than non-serum miRNAs (median values 34 and 79, Mann–Whitney U test: p-value 2.89E - 30). The difference is particularly pronounced for miRNAs that have few or no predicted targets, but is maintained across the entire distribution of hits. Again, a similar trend was observed in mouse (Figure S2B). Taken together, these results appear to support the contention that serum miRNAs preferentially target immune-related mRNAs.
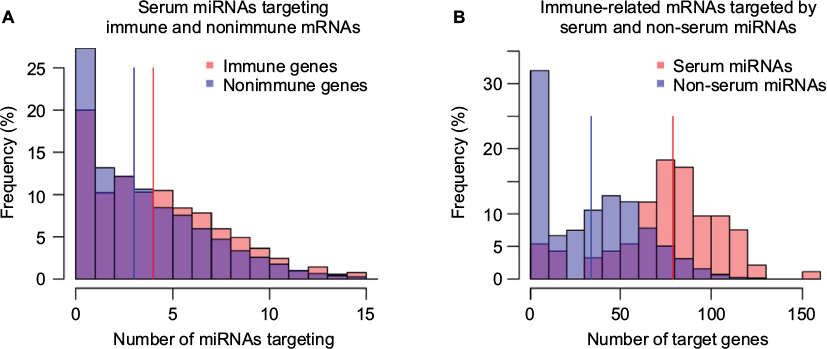 | Figure 2 Serum miRNAs apparently prefer immune-related mRNAs. Notes: (A) The distribution of immune and nonimmune mRNAs based on the number of serum miRNAs predicted to target. Each bin represents the frequency (in percentage) of immune (red) and nonimmune (blue) mRNAs (y-axis) targeted by a similar number of serum miRNAs (x-axis). (B) Distribution of serum and non-serum miRNAs based on the number of immune-related target mRNAs. Each bin corresponds to the percentage of serum (red) and non-serum miRNAs (blue) that target the same number of immune mRNAs (x-axis). Abbreviation: miRNA, microRNA. |
Serum miRNA and immune-related mRNA preferences are independent
We can see from Figure 2 that the bias in the serum versus non-serum miRNA (Figure 2B) is greater than that of immune versus related nonimmune mRNAs (Figure 2A), suggesting that the driving forces for the two phenomena might be different. Moreover, in order to say that serum miRNAs prefer immune-related mRNAs, it is necessary to show that the bias in Figure 2A is not observed for non-serum miRNAs. However, in contrast to our expectations, we found nearly the same modest but statistically significant (median values 40 and 50, Mann–Whitney U test: p-value 3.89E - 18) increase in the number of immune-related interactions for non-serum miRNAs, as shown in Figure 3A. Symmetrically, the dramatic differences between serum and non-serum miRNAs in targeting immune mRNAs (Figure 2B) were also observed for nonimmune mRNAs (median values 333 and 672, Mann–Whitney U test: p-value 2.32E - 30), as shown in Figure 3B and in Figure S3 for mouse. In other words, the 3′-UTRs of immune-related mRNAs simply have more miRNA binding sites than other mRNAs, as previously reported,13 and serum miRNAs have many more targets than non-serum miRNAs, regardless of whether the targets are immune related or not. Independently, these two phenomena lead to a greater number of circulating miRNA–immune mRNA interactions than would be expected by chance, as shown in Table 1 for human beings and in Table S2 for mice. For example, all 93 serum miRNAs and 1,632 immune-related mRNAs in human beings might be expected to have (93/2,613) × (1632/22,084) = 0.0026 interactions by chance. However, almost threefold more interactions were observed based on the consensus method, that is, 7,041/904,296 = 0.0078 interactions (Table S1). In contrast, the expected number of interactions between noncirculating miRNAs (2,613 - 93 = 2,520) and nonimmune-related mRNAs (22,084 - 1,632 = 20,452) would be (2,520/2,613) × (20,452/22,084) = 0.89, but the observed value was 75,732/904,296 = 0.83 interactions (Table S1).
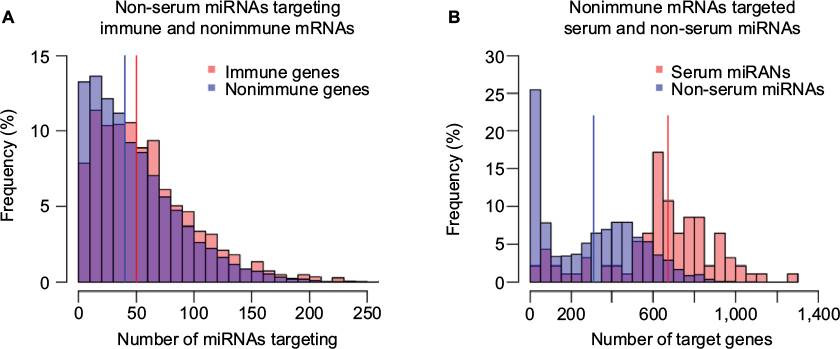 | Figure 3 Serum miRNA and immune-related mRNA preferences are independent. Notes: (A) The distribution of immune and nonimmune mRNAs based on the number of non-serum miRNAs predicted to target. Each bin shows the frequency (in percentage) of immune (red) and nonimmune (blue) mRNAs (y-axis) targeted by a similar number of non-serum miRNAs (x-axis). (B) Distribution of serum and non-serum miRNAs based on the number of nonimmune target mRNAs. Each bin corresponds to the percentage of serum (red) and non-serum miRNAs (blue) that target the same number of nonimmune mRNAs (x-axis). Abbreviation: miRNA, microRNA. |
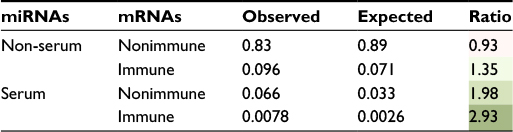 | Table 1 Predicted miRNA–mRNA interactions in human beings Notes: Observed and expected frequencies of miRNA–mRNA interactions are shown. Observed values were calculated by the consensus method’s genome wide predictions. The expected values were calculated by considering the frequencies of all subsets of miRNAs and mRNAs in this study. As the ratio increases, the green color shading also gets darker. Abbreviation: miRNA, microRNA. |
The basis for the observed preferences in immune-related 3′-UTRs may be due to several factors. For example, it is already well known that immune mRNAs, especially their 3′-UTRs, contain more adenylate-uridylate (AU)-rich elements.29 Asirvatham et al13 found that AU-rich regions in immune-related mRNAs were frequently targeted by miRNAs. In addition to their nucleotide composition, shorter transcripts tend to be less susceptible to regulation by miRNAs due to loss of miRNA binding sites.7 Indeed, the background distribution of 3′-UTR length has a median value of 1,350 nt in human beings, whereas the value for immune-related genes is 1,676 nt, which is statistically significant (Mann–Whitney U test: p = 5.60E - 18; Figure S4). Therefore, the results in Figures 2A and 3A can be rationalized in terms of the length of the 3′-UTRs in immune-related mRNAs. Taken together, immune-related mRNAs have a larger than expected number of miRNA binding sites, but are not specifically biased toward circulating miRNAs.
It is currently unclear why serum miRNAs would have dramatically more predicted targets than non-serum miRNAs. Since serum levels of some miRNAs are known to correlate with cellular miRNA levels, their presence in the blood might reflect higher expression levels overall.4 It has also been reported that nucleotide content affects serum miRNA extraction efficiency.30 At the same time, the ability to bind more mRNA targets might result from a sequence bias in the serum miRNAs. To test this idea, we surveyed the nucleotide content in serum miRNAs and found that, indeed, there were statistically significant differences in nucleotide usage between serum and non-serum miRNAs. Adenine (A) was more frequent and cytosine (C) was less frequent in serum miRNAs than in non-serum miRNAs; in non-serum miRNAs, guanine (G) was the most frequent nucleotide. The nucleotide usage of serum and non-serum miRNAs is shown in Table 2 and Figure 4. Very similar results were observed for serum and non-serum miRNAs in mouse, with the exception that uracil (U) was the most frequent nucleotide in serum miRNAs (Table S3 and Figure S5).
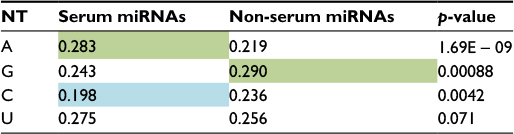 | Table 2 Nucleotide frequency of human miRNAs Notes: The second and third columns are the mean frequencies of A, G, C and U nucleotides for serum and non-serum miRNAs. Green color indicates most frequent nucleotides, while light blue color shows less frequent nucleotides. Two-tailed p-values for serum nucleotides were calculated from the ratio distributions of similar number of randomly selected miRNAs (10,000 times). Abbreviations: NT, nucleotide; miRNA, microRNA; A, adenine; G, guanine; C, cytosine; U, uracil. |
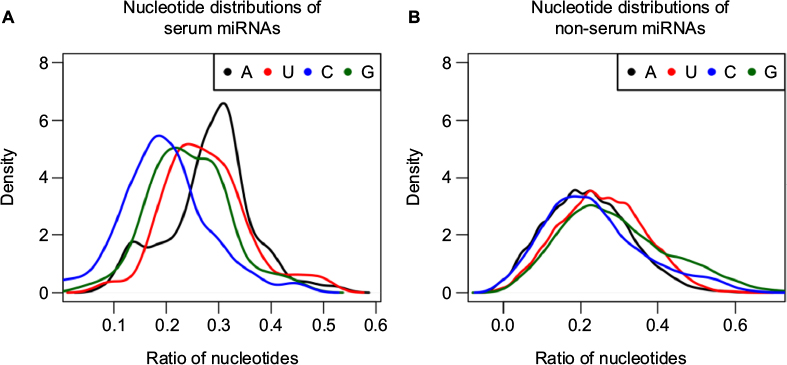 | Figure 4 Nucleotide distributions of serum (A) and non-serum (B) miRNAs in human beings. Notes: Nucleotide frequencies (expressed as a ratio to other nucleotides) of serum and non-serum miRNAs were calculated. Then, the frequency distribution of each nucleotide was constructed for serum and non-serum miRNAs. Abbreviations: miRNA, microRNA; A, adenine; U, uracil; C, cytosine; G, guanine. |
Next, we examined the position-wise nucleotide frequency of both serum and non-serum miRNAs to see if there is any difference in a particular nucleotide usage at any given position in the miRNA sequences. The results show that serum miRNAs tend to start with U at position 1 in significantly high frequency compared to non-serum miRNAs in human beings (Figure S6). The least frequent nucleotide for serum miRNAs at position 1 was G. The frequency of U is also significantly different in serum miRNAs at positions 9, 17, 21 and 22. Serum miRNAs also have significantly high frequencies of nucleotide A at positions 2, 4. 5, 7, 8, 13, 15, 16, 18 and 22. This comprises almost half (~45%) of miRNA sequences considered, and this is consistent with Figure 4. However, we rarely see any positions where serum miRNAs have remarkable high frequencies of C and G, except the positions 19 and 20 where G has significantly high frequency in serum miRNA sequences. Interestingly, we observed comparable position-wise nucleotide frequencies for mouse too, although there were a few positions for which mouse serum miRNAs have different nucleotide compositions (Figure S7). The seed region (positions 1–8) of miRNAs is the most important feature of miRNA–target mRNA biding, and we can see some notable differences in serum miRNAs and non-serum miRNAs in that region. For example, the seed region in human serum miRNAs most likely starts (position 1) and ends (position 9) by U. Next, the most frequent nucleotide at positions 2, 4, 7 and 8 is A. Position 5 is likely to be A or G. In our results, positions 3 and 6 of the seed region did not show preference to any nucleotide. Based on these results in human beings and mouse, the consensus seed sequence for human serum miRNAs would be UANA(A/G)NAA flanked by U, and for mouse serum miRNAs, it would be UAAN(A/G)NNN flanked by U.
The nucleotide usage suggests that there are fundamental differences between serum and non-serum miRNAs that can be understood at the sequence level; however, the detailed nature of these differences remains to be clarified.
Biological consistency of miRNA-targeting patterns
It is well known that miRNA–mRNA target prediction algorithms suffer from false positive and false negative predictions. In spite of the use of consensus-based prediction, which apparently mitigates such errors to some extent, it is useful to have a qualitative overview of the results presented here. To this end, we made use of human cell type-specific gene expression data to characterize mRNA binding profiles of each circulating miRNA in human beings. For each miRNA, to indicate its specificity to particular immune cell types, we counted the number of predicted interactions with mRNAs specifically expressed in each cell type, as defined in Abbas et al.16 Then, based on these mRNA binding profiles, we clustered the circulating miRNAs to compare with known lineage relationships (Figure 5).
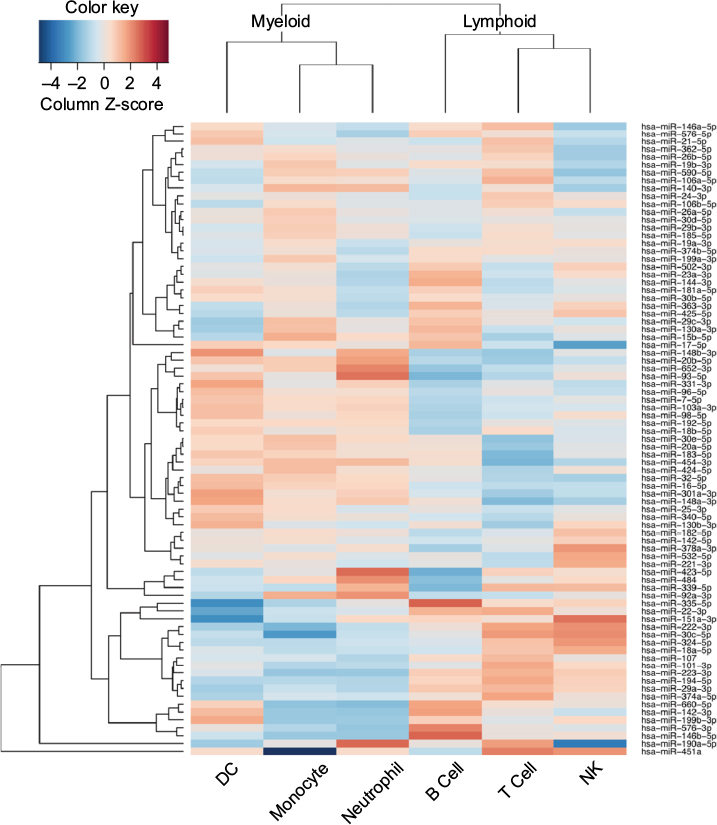 | Figure 5 A heat map of serum miRNAs targeting immune-related genes specifically expressed in the human immune cells. Notes: Colors represent Z-score of the number of predicted interactions with mRNAs specifically expressed in each cell type. Each row corresponds to a human serum miRNA. Serum miRNAs were hierarchically clustered by the number of immune-related genes they target in each immune cells (in columns). Abbreviations: miRNA, microRNA; DC, dendritic cell; NK, natural killer. |
Since dendritic cells, monocytes and neutrophils are all thought to descend from the myeloid lineage, we would expect to see higher similarity among these cells than, for example, B, T and natural killer cells, which descend from the lymphoid lineage. Figure 5 shows that such similarity is indeed recapitulated and that B and T cells contain mRNAs with similar miRNA binding profiles. In addition, we observe populations of miRNAs specifically targeting B or T cells. Similarly, we observed several clusters of miRNAs that appear to target mRNAs that are not present in cells from the lymphoid lineage. Such qualitative grouping is reassuring as it suggests that the differences observed in this study reflect biological differences and are not simply an artifact of the underlying prediction methods. Moreover, the ability to interpret predicted miRNA–mRNA interactions functionally is critical if serum miRNA levels are to be used as biomarkers of disease.
Conclusion
Serum miRNAs are potentially attractive as biomarkers but their cellular origins as well their biological functions are largely unknown. In the last decade, a number of miRNAs with functional roles in the immune system have been described.31–34 The majority of such studies were carried out by knocking out or overexpressing miRNAs of interest and then observing the changes in gene expression levels in particular immune cells. Here, we took a different approach: we prioritized miRNA–mRNA pairs with consensus target predictions and looked for target mRNAs with high expression in immune cells. We discovered that serum miRNAs target immune-related mRNAs much more than noncirculating miRNAs but that this difference is mostly due to two independent phenomena: 1) circulating miRNAs tend to target many more mRNAs in general and 2) immune-related mRNAs tend to be targeted slightly more, in general, than nonimmune-related mRNAs. Indeed, we can see these two effects independently, if we compare all pairs of expected and observed miRNA–mRNA interaction frequencies (Table 1).
There are several directions for future work to further elucidate the role of miRNA in immune cell regulation. The categorization of miRNAs into two groups – serum and non-serum – is only a first-order approximation. Serum miRNAs can be further subdivided according to their specific source (plasma or serum) or type of compartmentalization – e.g., those bound by the Argonaute 2 (AGO2) protein encapsulated in apoptotic bodies or in exosomes.4,35 Similarly, the categorization of mRNAs into immune/nonimmune-related mRNAs should take into account both up- and downregulated genes as well as additional cell types such as macrophages and innate lymphoid cells. Moreover, in the future, we aim to subdivide nonimmune cells into endothelial or stromal cells and to specifically examine expression in lymph nodes, spleen and bone marrow.
Despite these simplifications, the data presented in this study are remarkably consistent between human beings and mouse. The fact that serum miRNA–immune-related mRNA interactions are predicted to occur at higher frequencies than expected by chance, along with their co-localization in blood, strongly suggests that serum miRNAs carry important information about immune cell function. Consistently, the recapitulation of myeloid and lymphoid lineages from predicted interaction profiles suggests that groups of miRNAs in the blood can collectively be associated with the status of basic immune cell groups. Considering the fact that immune cell sequencing is also emerging as a very sensitive and specific biomarker for cancer, the combination of miRNA and mRNA levels in the blood represents the next-generation RNA-based disease diagnostics.36 In order to facilitate further use of specific miRNAs as biomarkers of immune status, we have summarized the number of immune-related targets for each miRNA utilized in this study in Table S3.
Acknowledgments
The authors thank all members of the Systems Immunology Lab. This work was supported by grants from the Ministry of Health, Labor and Welfare (MHLW) and the Research on Development of New Drugs, the Japan Agency for Medical Research and Development (AMED), as well as the Platform for Drug Discovery, Informatics and Structural Life Science.
Author contributions
BN prepared and analyzed miRNA–mRNA interaction data and cowrote the manuscript; JB developed the RF predictor; AV, DD and EW analyzed miRNA–mRNA interaction data and cowrote the manuscript; KJI analyzed immunological significance of immune-related mRNA targets and cowrote the manuscript; and ST and DMS designed the study, analyzed miRNA–mRNA interaction data and cowrote the manuscript. All authors contributed toward data analysis, drafting and critically revising the paper and agree to be accountable for all aspects of the work.
Disclosure
The authors report no conflicts of interest in this work.
References
Filipowicz W, Bhattacharyya SN, Sonenberg N. Mechanisms of post-transcriptional regulation by microRNAs: are the answers in sight? Nat Rev Genet. 2008;9(2):102–114. | ||
Chen X, Ba Y, Ma L, et al. Characterization of microRNAs in serum: a novel class of biomarkers for diagnosis of cancer and other diseases. Cell Res. 2008;18(10):997–1006. | ||
Schwarzenbach H, Nishida N, Calin GA, Pantel K. Clinical relevance of circulating cell-free microRNAs in cancer. Nat Rev Clin Oncol. 2014;11(3):145–156. | ||
Turchinovich A, Weiz L, Burwinkel B. Extracellular miRNAs: the mystery of their origin and function. Trends Biochem Sci. 2012;37(11):460–465. | ||
Pritchard CC, Kroh E, Wood B, et al. Blood cell origin of circulating microRNAs: a cautionary note for cancer biomarker studies. Cancer Prev Res. 2012;5(3):492–497. | ||
Turchinovich A, Samatov TR, Tonevitsky AG, Burwinkel B. Circulating miRNAs: cell-cell communication function? Front Genet. 2013;4:119. | ||
O’Connell RM, Rao DS, Chaudhuri AA, Baltimore D. Physiological and pathological roles for microRNAs in the immune system. Nat Rev Immunol. 2010;10(2):111–122. | ||
Robinson WH, Lindstrom TM, Cheung RK, Sokolove J. Mechanistic biomarkers for clinical decision making in rheumatic diseases. Nat Rev Rheumatol. 2013;9(5):267–276. | ||
Xiao F, Zuo Z, Cai G, Kang S, Gao X, Li T. miRecords: an integrated resource for microRNA-target interactions. Nucleic Acids Res. 2009;37(Database issue):D105–D110. | ||
Chi SW, Zang JB, Mele A, Darnell RB. Argonaute HITS-CLIP decodes microRNA-mRNA interaction maps. Nature. 2009;460(7254):479–486. | ||
Hafner M, Landthaler M, Burger L, et al. Transcriptome-wide identification of RNA-binding protein and microRNA target sites by PAR-CLIP. Cell. 2010;141(1):129–141. | ||
Ekimler S, Sahin K. Computational methods for MicroRNA target prediction. Genes (Basel). 2014;5(3):671–683. | ||
Asirvatham AJ, Gregorie CJ, Hu Z, Magner WJ, Tomasi TB. MicroRNA targets in immune genes and the Dicer/Argonaute and ARE machinery components. Mol Immunol. 2008;45(7):1995–2006. | ||
Kozomara A, Griffiths-Jones S. miRBase: annotating high confidence microRNAs using deep sequencing data. Nucleic Acids Res. 2014;42(Database issue):D68–D73. | ||
Aken BL, Ayling S, Barrell D, et al. The Ensembl gene annotation system. Database (Oxford). (2016);2016. | ||
Abbas AR, Baldwin D, Ma Y, et al. Immune response in silico (IRIS): immune-specific genes identified from a compendium of microarray expression data. Genes Immun. 2005;6(4):319–331. | ||
Heng TS, Painter MW. Immunological Genome Project C. The Immunological Genome Project: networks of gene expression in immune cells. Nat Immunol. 2008;9(10):1091–1094. | ||
Shay T, Jojic V, Zuk O, et al. Conservation and divergence in the transcriptional programs of the human and mouse immune systems. Proc Natl Acad Sci U S A. 2013;110(8):2946–2951. | ||
Jacob NK, Cooley JV, Yee TN, et al. Identification of sensitive serum microRNA biomarkers for radiation biodosimetry. PLoS One. 2013;8(2):e57603. | ||
Mi QS, Weiland M, Qi RQ, Gao XH, Poisson LM, Zhou L. Identification of mouse serum miRNA endogenous references by global gene expression profiles. PLoS One. 2012;7(2):e31278. | ||
Vlachos IS, Paraskevopoulou MD, Karagkouni D, et al. DIANA-TarBase v7.0: indexing more than half a million experimentally supported miRNA:mRNA interactions. Nucleic Acids Res. 2015;43(Database issue):D153–D159. | ||
Betel D, Koppal A, Agius P, Sander C, Leslie C. Comprehensive modeling of microRNA targets predicts functional non-conserved and non-canonical sites. Genome Biol. 2010;11(8):R90. | ||
Lewis BP, Burge CB, Bartel DP. Conserved seed pairing, often flanked by adenosines, indicates that thousands of human genes are microRNA targets. Cell. 2005;120(1):15–20. | ||
Paraskevopoulou MD, Georgakilas G, Kostoulas N, et al. DIANA-microT web server v5.0: service integration into miRNA functional analysis workflows. Nucleic Acids Res. 2013;41(Web Server issue):W169–W173. | ||
Wang X. miRDB: a microRNA target prediction and functional annotation database with a wiki interface. RNA. 2008;14(6):1012–1017. | ||
Bartel DP. MicroRNAs: target recognition and regulatory functions. Cell. 2009;136(2):215–233. | ||
Peterson SM, Thompson JA, Ufkin ML, Sathyanarayana P, Liaw L, Congdon CB. Common features of microRNA target prediction tools. Front Genet. 2014;5:23. | ||
Garcia DM, Baek D, Shin C, Bell GW, Grimson A, Bartel DP. Weak seed-pairing stability and high target-site abundance decrease the proficiency of lsy-6 and other microRNAs. Nat Struct Mol Biol. 2011;18(10):1139–1146. | ||
Bakheet T, Frevel M, Williams B. ARED: human AU-rich element-containing mRNA database reveals and unexpectedly diverse functional repertoire of encoded proteins. Nucleic Acids Res. 2001;29(1):246–254. | ||
Kim YK, Yeo J, Kim B, Ha M, Kim VN. Short structured RNAs with low GC content are selectively lost during extraction from a small number of cells. Mol Cell. 2012;46(6):893–895. | ||
Baltimore D, Boldin MP, O’Connell RM, Rao DS, Taganov KD. MicroRNAs: new regulators of immune cell development and function. Nat Immunol. 2008;9(8):839–845. | ||
Sonkoly E, Stahle M, Pivarcsi A. MicroRNAs and immunity: novel players in the regulation of normal immune function and inflammation. Semin Cancer Biol. 2008;18(2):131–140. | ||
Xiao C, Rajewsky K. MicroRNA control in the immune system: basic principles. Cell. 2009;136(1):26–36. | ||
Mehta A, Baltimore D. MicroRNAs as regulatory elements in immune system logic. Nat Rev Immunol. 2016;16(5):279–294. | ||
Shah R, Tanriverdi K, Levy D, et al. Discordant expression of circulating microRNA from cellular and extracellular sources. PLoS One. 2016;11(4):e0153691. | ||
Kirsch IR, Watanabe R, O’Malley JT, et al. TCR sequencing facilitates diagnosis and identifies mature T cells as the cell of origin in CTCL. Sci Transl Med. 2015;7(308):308ra158. |
 © 2017 The Author(s). This work is published and licensed by Dove Medical Press Limited. The
full terms of this license are available at https://www.dovepress.com/terms
and incorporate the Creative Commons Attribution
- Non Commercial (unported, 3.0) License.
By accessing the work you hereby accept the Terms. Non-commercial uses of the work are permitted
without any further permission from Dove Medical Press Limited, provided the work is properly
attributed. For permission for commercial use of this work, please see paragraphs 4.2 and 5 of our Terms.
© 2017 The Author(s). This work is published and licensed by Dove Medical Press Limited. The
full terms of this license are available at https://www.dovepress.com/terms
and incorporate the Creative Commons Attribution
- Non Commercial (unported, 3.0) License.
By accessing the work you hereby accept the Terms. Non-commercial uses of the work are permitted
without any further permission from Dove Medical Press Limited, provided the work is properly
attributed. For permission for commercial use of this work, please see paragraphs 4.2 and 5 of our Terms.