")
Back to Journals » Infection and Drug Resistance » Volume 15
Malnutrition is Associated with an Increased Risk of Death in Hospitalized Patients with Active Pulmonary Tuberculosis: A Propensity Score Matched Retrospective Cohort Study
Authors Xu X, Zhu H , Cai L, Zhu X, Wang H, Liu L, Zhang F, Zhou H, Wang J, Chen T , Xu K
Received 16 July 2022
Accepted for publication 28 September 2022
Published 26 October 2022 Volume 2022:15 Pages 6155—6164
DOI https://doi.org/10.2147/IDR.S382587
Checked for plagiarism Yes
Review by Single anonymous peer review
Peer reviewer comments 2
Editor who approved publication: Professor Suresh Antony
Xiaoqun Xu1,2 *, Houyong Zhu3 *, Long Cai1,2 *, Xinyu Zhu,4 Hanxin Wang,5 Libin Liu,1,2 Fengwei Zhang,1,2 Hongjuan Zhou,1,2 Jing Wang,1,2 Tielong Chen,3 Kan Xu1,2
1Centre of Laboratory Medicine, Affiliated Hangzhou Chest Hospital, Zhejiang University School of Medicine, Hangzhou, People’s Republic of China; 2Centre of Laboratory Medicine, Hangzhou Red Cross Hospital, Hangzhou, Zhejiang, People’s Republic of China; 3Department of Cardiology, Hangzhou TCM Hospital Affiliated to Zhejiang Chinese Medical University, Hangzhou, People’s Republic of China; 4Department of Cardiology, The Affiliated Hangzhou First People’s Hospital, Zhejiang University School of Medicine, Hangzhou, People’s Republic of China; 5The Fourth School of Clinical Medicine, Zhejiang Chinese Medical University, Hangzhou, People’s Republic of China
*These authors contributed equally to this work
Correspondence: Kan Xu, Affiliated Hangzhou Chest Hospital, Zhejiang University School of Medicine, No. 208 East Huancheng Road, Hangzhou, 310003, People’s Republic of China, Email [email protected] Tielong Chen, Department of Cardiology, Hangzhou TCM Hospital Affiliated to Zhejiang Chinese Medical University, No. 453 Stadium Road, Hangzhou, 310007, People’s Republic of China, Email [email protected]
Background: This study aimed to investigate whether nutrition levels in patients with active pulmonary tuberculosis (TB) affect their risk of all-cause mortality during hospitalization and to further evaluate the predictive ability of Geriatric Nutritional Risk Index (GNRI) and Body Mass Index (BMI) for risk of all-cause mortality.
Methods: Patients from January 1, 2020 to December 31, 2021 were retrieved, and a total of 1847 were included. The primary outcome was all-cause mortality. Propensity score matching (PSM) was performed for risk adjustment, and receiver operating characteristic (ROC) curve analysis was performed to assess the predictive ability of GNRI and BMI for all-cause mortality.
Results: Malnourished TB patients were older, had more congestive heart failure, and had more chronic obstructive pulmonary disease or asthma. Under the nutrition level grouping defined by GNRI, the all-cause mortality in the malnourished group did not appear to reach a statistical difference compared with the nonmalnourished group (P = 0.078). When grouped by level of nutrition as defined by BMI, the all-cause mortality was higher in the malnourished group (P = 0.009), and multivariate logistic regression analysis revealed that malnutrition was an independent risk factor for all-cause mortality. After propensity score matching, the results showed that the all-cause mortality was higher in the malnutrition group, regardless of BMI or GNRI defined nutrition level grouping, compared with the control group (both P < 0.001). The ROC curve analysis revealed that the area under the curve (AUC) was 0.811 ([95% confidence interval (CI) 0.701– 0.922], P < 0.001) for GNRI and 0.728 ([95% CI 0.588– 0.869], P = 0.001) for BMI.
Conclusion: In the clinical treatment of patients with active TB, more attention should be paid to the management of nutritional risk. GNRI may be a highly effective and easy method for predicting short-term outcomes in patients with active pulmonary TB.
Keywords: tuberculosis, malnutrition, Geriatric Nutritional Risk Index, body mass index
Introduction
The World Health Organization (WHO) plans to reduce new tuberculosis (TB) cases by 20% and TB deaths by 35% between 2015 and 2020, but in fact, the reduction of new TB cases by 11% and TB deaths by 9.2% is far from meeting expectations.1 This is attributed to the COVID-19 pandemic, which reversed the progress made over the years in providing basic TB services and reducing the burden of TB disease. Although there are successful cases in some countries and regions, most of the global tuberculosis goals have deviated from track. The most obvious impact is that the number of newly diagnosed and reported tuberculosis in the world has dropped significantly. This number decreased from 7.1 million in 2019 to 5.8 million in 2020, 18% lower than the level in 2012, and far lower than about 10 million TB patients in 2020. 16 countries accounted for 93% of the decrease, of which India, Indonesia, and the Philippines were the most affected. Provisional data as of June 2021 shows that the funding gap is still ongoing. The decrease in TB diagnosis and treatment opportunities has led to an increase in tuberculosis deaths.1,2
Malnutrition is strongly implicated in the development and progression of tuberculosis, and a 2017 report estimated that 815 million people are undernourished, most of whom live in low - and middle-income countries (LMICs), particularly sub-Saharan Africa and Southeast Asia, and that these regions also have a high incidence of tuberculosis.3 Patients with malnutrition and TB are mutually promoting, firstly, the ratio of helper T cells to suppressor T cells is decreased in patients with malnutrition, and their cellular immune function is impaired.4,5 A poor state of the body’s immune function can lead to TB even if the infecting strain is not virulent and not numerous. Secondly, patients with TB have a disturbed ratio of appetite mediators, such as increased leptin levels and downregulated ghrelin levels, which contribute to decreased appetite and further malnutrition.6–9
Whether the nutritional level of TB patients affects their prognosis during hospitalization is controversial, but it is important to clarify the relationship between the two as it relates to the treatment decision for supplemental nutrition. European Society of Parenteral and Enteral Nutrition (ESPEN)10 guidelines recommend combining Body Mass Index (BMI) and malnutrition universal screening tool (MUST) to assess a patient’s nutritional level, and although BMI is characterized by ease and high reproducibility, MUST be aware of weight loss over the past 3 to 6 months and have a 5% weight difference as the cutoff, which is difficult to properly assess. The French Programme National Nutrition Santé (PNNS)11,12 recommends the use of the nutritional risk index (NRI), which combines two nutritional indicators of body weight and albumin. Albumin is an important indicator of reactive energy expenditure, and hypoalbuminemia is very common in patients with TB, but the assessment of the NRI needs to make clear both usual and actual body weight, but there are many people, especially the elderly, who do not remember their usual body weight, and so bouillanne et al12 modified the NRI by replacing usual body weight by ideal body weight, which is called the Geriatric Nutritional Risk Index (GNRI), It may be promising as an efficient and easy method to predict the prognosis of TB.
Therefore, this study aimed to investigate whether nutrition levels in patients with active pulmonary TB affect the risk of all-cause mortality during hospitalization and to further evaluate the predictive ability of GNRI and BMI for all-cause mortality.
Methods
Subjects
This is a single-center, retrospective cohort study designed to evaluate whether nutrition levels in TB patients affect the risk of all-cause mortality during hospitalization. All patients diagnosed with active pulmonary tuberculosis between 1 January 2020 and 31 December 2021 were included in the study. These patients were all collected from and identified in the database of Affiliated Hangzhou Chest Hospital, Zhejiang University School of Medicine (specialized hospital for tuberculosis). An exemption from the informed consent requirement was approved by the ethics committee of Affiliated Hangzhou Chest Hospital, Zhejiang University School of Medicine (Ethical Application Ref: 2022YS61), as this was a retrospective cohort study. This study protocol strictly complied with the requirements of the Helsinki Declaration of the World Medical Association and the international ethics guide for human biomedical research of the Council for International Organizations of Medical Sciences (CIOMS).
Patient Selection
Inclusion criteria: diagnosis and classification of active TB referring to the standards of the health industry of the People’s Republic of China,13,14 in brief, active TB patients included in this study were confirmed cases. Confirmed cases mainly need to meet the definite pathogenic evidence, and the specific diagnostic basis is detailed in Appendix 1 in the Supplementary Materials.
Exclusion criteria: Patients who are critically ill but have not yet experienced all-cause death are automatically discharged.
Data Collection
Collection of patient baseline data referred to the age-adjusted Charlson comorbidity index,15 which includes age, gender, previous myocardial infarction (MI), congestive heart failure (CHF), peripheral vascular disease (PVD), cerebrovascular disease (CBVD), hemiplegia, dementia, chronic obstructive pulmonary disease (COPD) or asthma, connective tissue disease (CTD), ulcer disease (UD), diabetes, moderate or severe kidney disease, liver disease, tumor, leukemia, lymphoma, acquired immune deficiency syndrome (AIDS), and multidrug-resistant tuberculosis (MDR-TB). In addition, the primary outcome was all-cause mortality, and specific diagnostic criteria are detailed in Appendix 2. The raw data supporting the results of this study were uploaded to zenodo (https://zenodo.org/record/6668833), and accessed upon reasonable request.
Definition of Malnutrition Score
The parameters comprising the GNRI included gender, height, weight, and serum albumin, for which the scoring criteria refer to bouillanne et al,12 in brief, patients with a GNRI greater than or equal to 98 were considered not to be malnourished. Patients with a GNRI between 92 and 98 were considered mildly malnourished. Patients with a GNRI between 82 and 92 were considered to have moderate malnutrition. Patients with a GNRI of 82 or less were considered to have severe malnutrition.
The malnutrition scoring criteria for BMI refer to the previous study,16 and patients with a BMI greater than or equal to 18.5 kg/m2 were considered not to be malnourished. Patients with a BMI between 17.0 and 18.5 kg/m2 were considered mildly malnourished. Patients with a BMI between 16.0 and 17.0 kg/m2 were considered to have moderate malnutrition. Patients with a BMI less than or equal to 16 kg/m2 were considered to have severe malnutrition.
Statistical Analysis
Continuous variables were summarized as medians and quartiles and compared using the Mann–Whitney test. Dichotomous variables were analyzed by Pearson chi-square, continuously corrected chi-square, or Fisher’s test depending on the amount of data. Multivariate logistic regression analysis was done by backward likelihood ratio (LR) method with the included variables as those of the main study variables (malnutrition score) and clinical variables in the univariate analysis (P < 0.10), and the calibration of the multivariate logistic regression model was evaluated by the Hosmer-Lemeshow goodness-of-fit test. Propensity score matching (PSM) was performed to correct deviations in baseline data levels between the two groups. A propensity score was generated for each subject by taking the main study variable as the dependent variable, independent variables included all variables in the baseline data, and the C-statistic was calculated for the propensity model. Once generated, patients were matched 1 to 1 on their propensity score without replacement using the “nearest neighbor” matching method with a fixed caliper width of 0.2. After matching, standardized differences were used, and a high balance was reflected as a standardized difference of < 0.1. The power for the outcomes (dichotomous variable) is calculated based on McNemar’s test. The area under the curve (AUC) was calculated by receiver operating characteristic (ROC) curve analysis to determine the prediction of each score for the primary outcome. Pairwise comparisons of ROC curves were quantitatively analyzed by the Delong method. Expectation maximization (EM) was used to fill in missing variables. Two-sided P < 0.05 were considered statistically significant. The data were analyzed using SPSS 25.0 (SPSS, Inc., Chicago, IL) and MedCalc 19.0.7 (MedCalc Software Ltd, China).
Results
Baseline Patient Characteristics
A total of 1847 patients were finally included in this study (Supplementary Figure 1), and the main clinical characteristics of the subjects grouped in GNRI-defined nutrition levels are shown in Table 1, and malnourished patients had older age, more CHF, more CBVD, more COPD or asthma, more CTD, more nephropathy, and more moderate or severe liver disease. The main clinical characteristics of the subjects grouped by BMI-defined nutrition level are shown in eTable 1 in the Supplementary Materials, and those who were malnourished had older age, a higher proportion of females, more CHF, more COPD or asthma, and fewer diabetes without complications. There were missing values for alanine transaminase, albumin, creatinine, and urea, essential markers for the diagnosis of liver disease and nephropathy, and missing values were 0.9%, 1.0%, 0.8%, and 0.8%, respectively, with the imputation done by the EM method, which can be seen in eTable 2 in the Supplementary Materials.
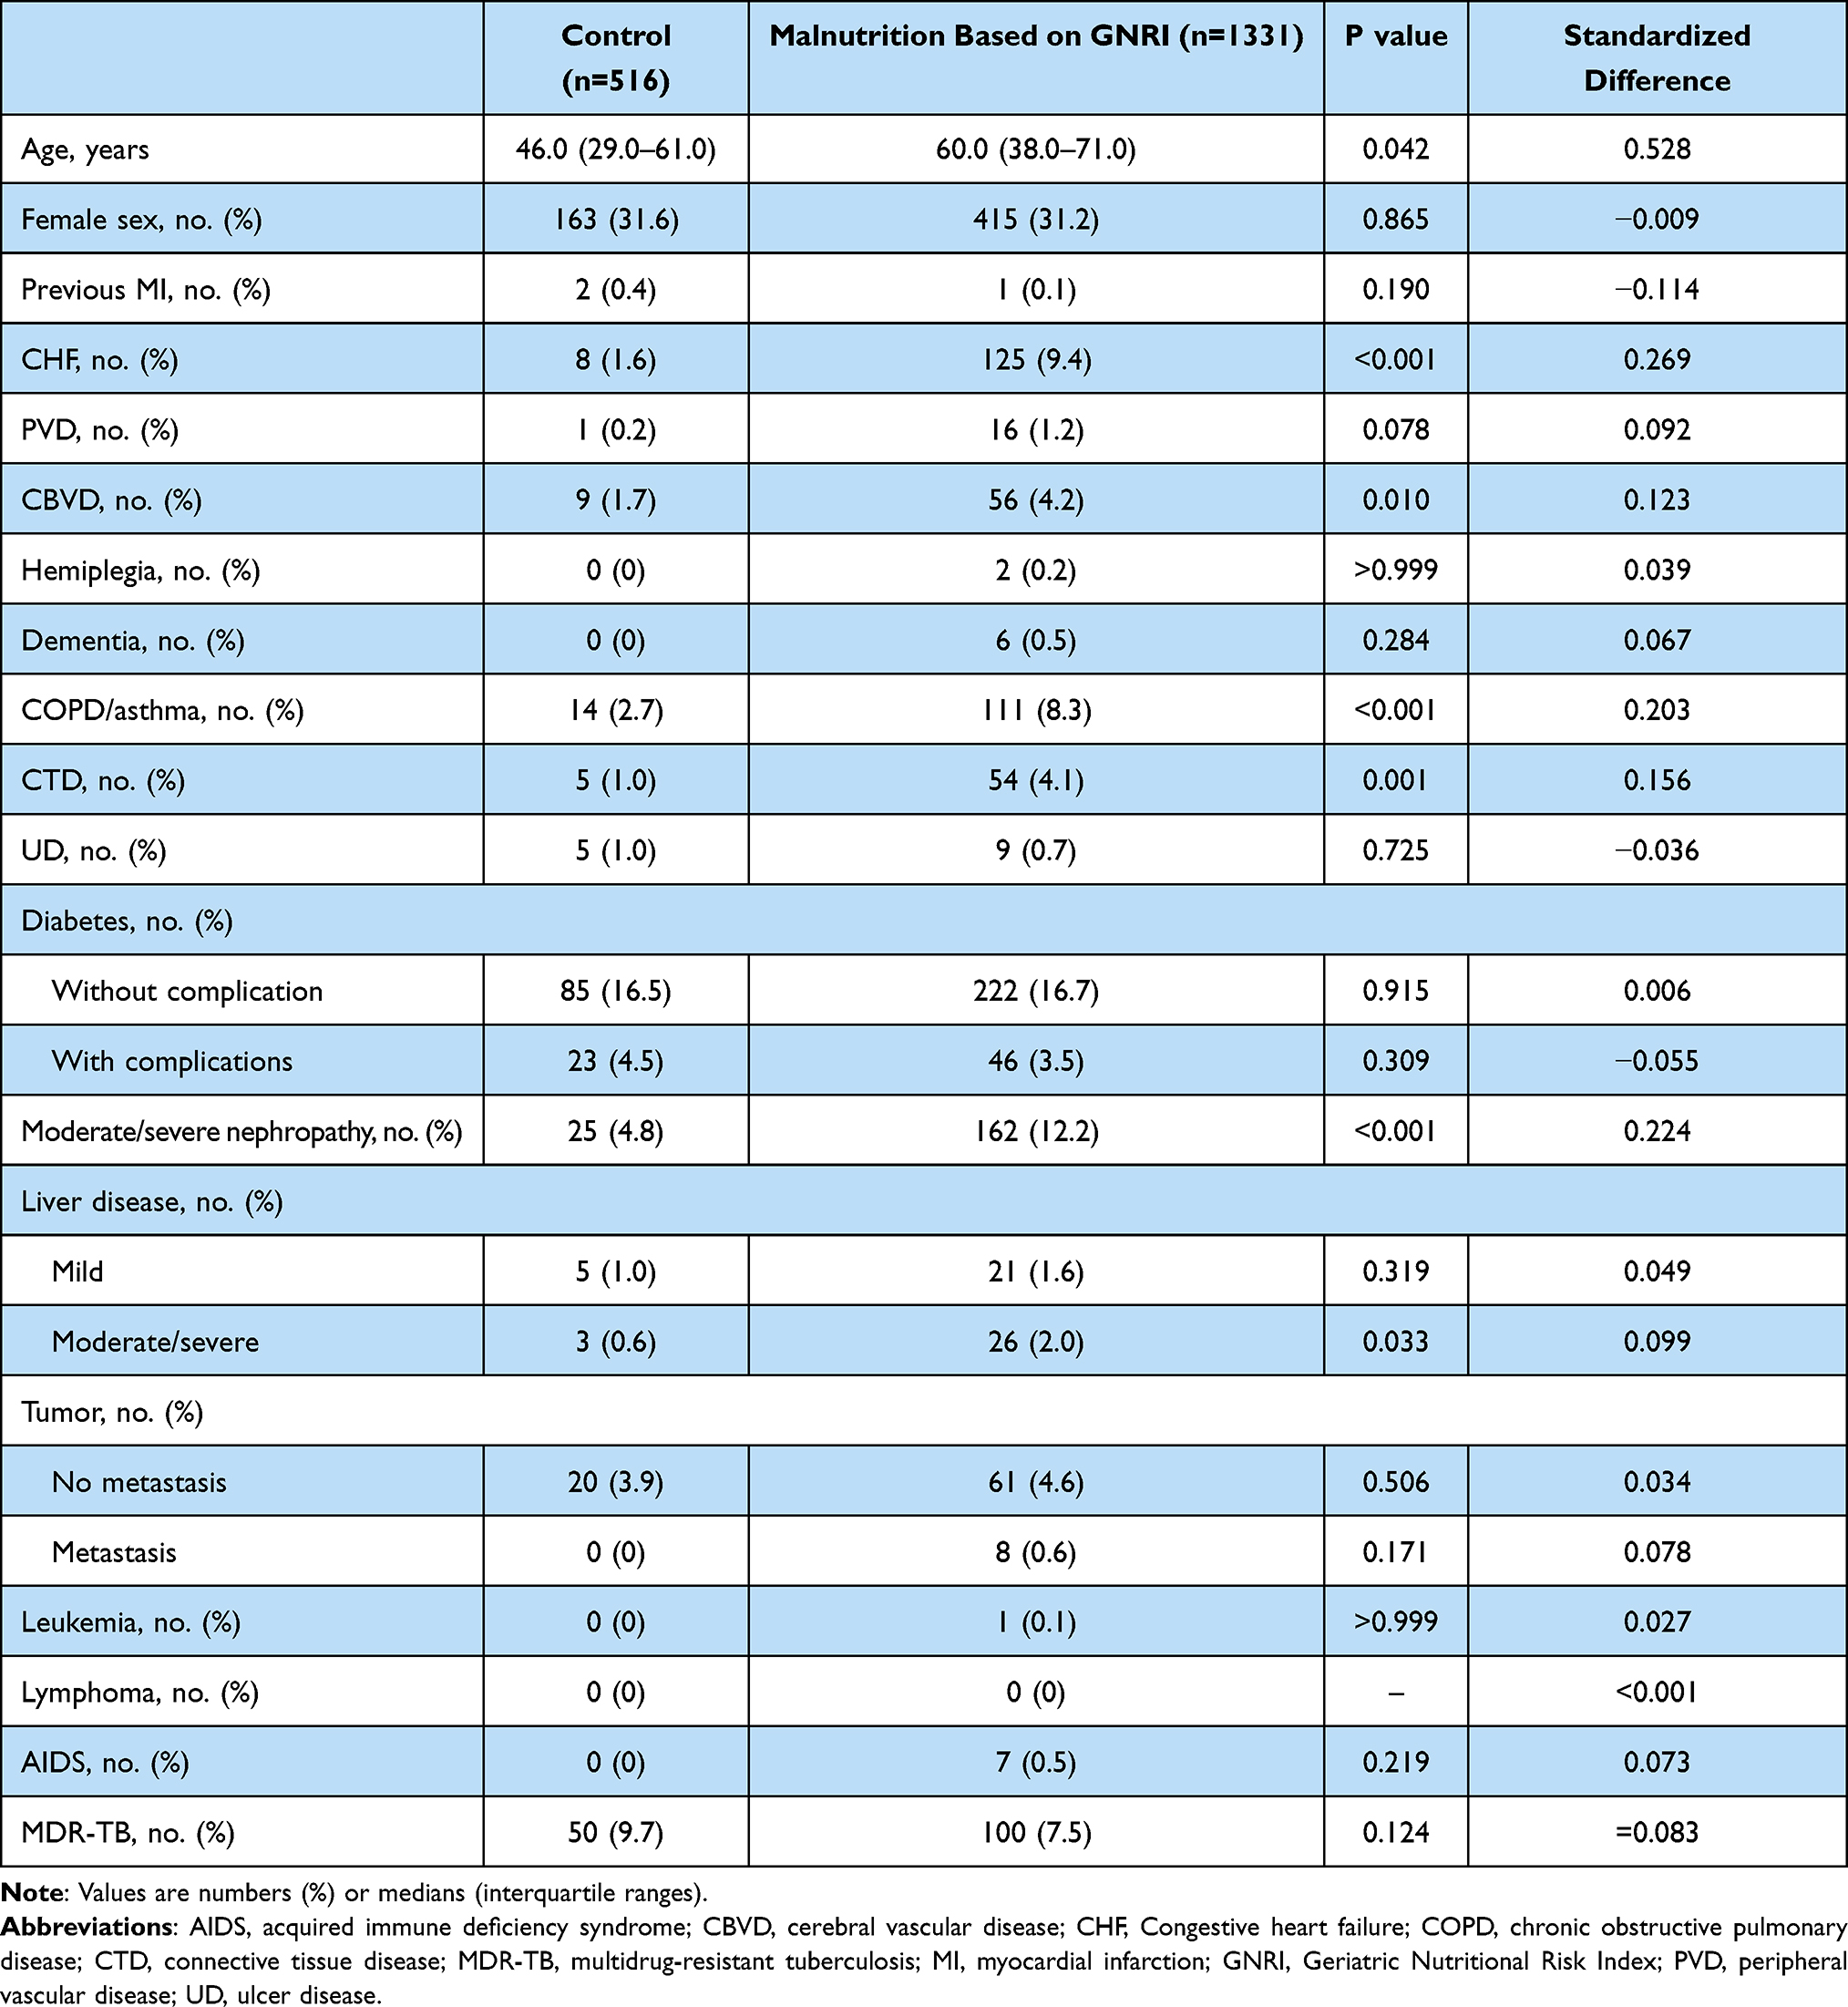 |
Table 1 Clinical Characteristics of Entire Study Cohort Based on GNRI Grouping |
Tuberculosis Characteristics of Patients
Mycobacterium TB which is proved to be resistant to at least isoniazid and rifampicin by drug sensitivity test is defined as MDR-TB. A total of 150 patients were found to be resistant to at least rifampicin and isoniazid by sputum culture, which was diagnosed as MDR-TB. The specific diagnostic basis for each TB patient included clinical manifestation, chest imaging, smear microscopy, mycobacterial culture, molecular biology examination, examination of TB pathology, immunological examination, drug resistance, and treatment history, as detailed in eTable 3 in the Supplement.
Outcomes for the Entire Study Cohort
The results for all-cause mortality are shown in Table 2. When grouped by the GNRI-defined nutritional level, there was no statistical difference in all-cause mortality in the malnourished group compared with the control group (P = 0.078). When grouped by level of nutrition as defined by BMI, malnourished patients had a higher risk of all-cause death compared to controls (P = 0.009).
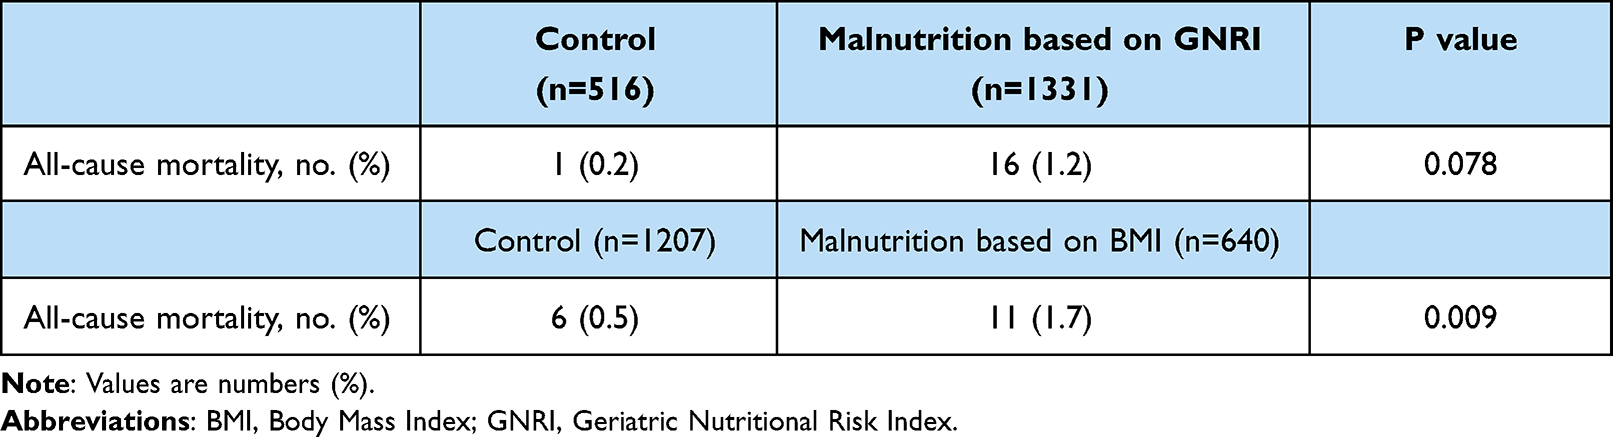 |
Table 2 All-Cause Mortality Among Entire Study Cohort |
Under the grouping of nutrient levels defined by GNRI, the univariate logistic regression analysis showed a statistically different odds ratio (OR) for in-hospital all-cause death was 13.205 (95% confidence interval (CI) 1.710–101.945) for malnutrition (severe vs normal) (Table 3), 1.068 (95% CI 1.030–1.107) for age, 57.125 (95% CI 4.928–662.238) for previous MI, 25.667 (95% CI 9.334–70.579) for CHF, 6.111 (95% CI 1.712–21.811) for CBVD, 22.812 (95% CI 2.521–206.443) for dementia, and 8.199 (95% CI 3.124–21.515) for moderate or severe nephropathy. The goodness-of-fit test for the multivariable logistics regression model was done via the Hosmer-Lemeshow method, which showed that the model had sufficient calibration (P = 0.466). Compared with the GNRI normal group, this OR for all-cause death was 9.128 (95% CI 0.686–121.499) for malnutrition (severe vs normal) (Table 3), 47.457 (95% CI 2.149–1047.807) for previous MI, 9.433 (95% CI 3.046–29.215) for CHF, and 3.528 (95% CI 1.202–1.349) for moderate or severe nephropathy.
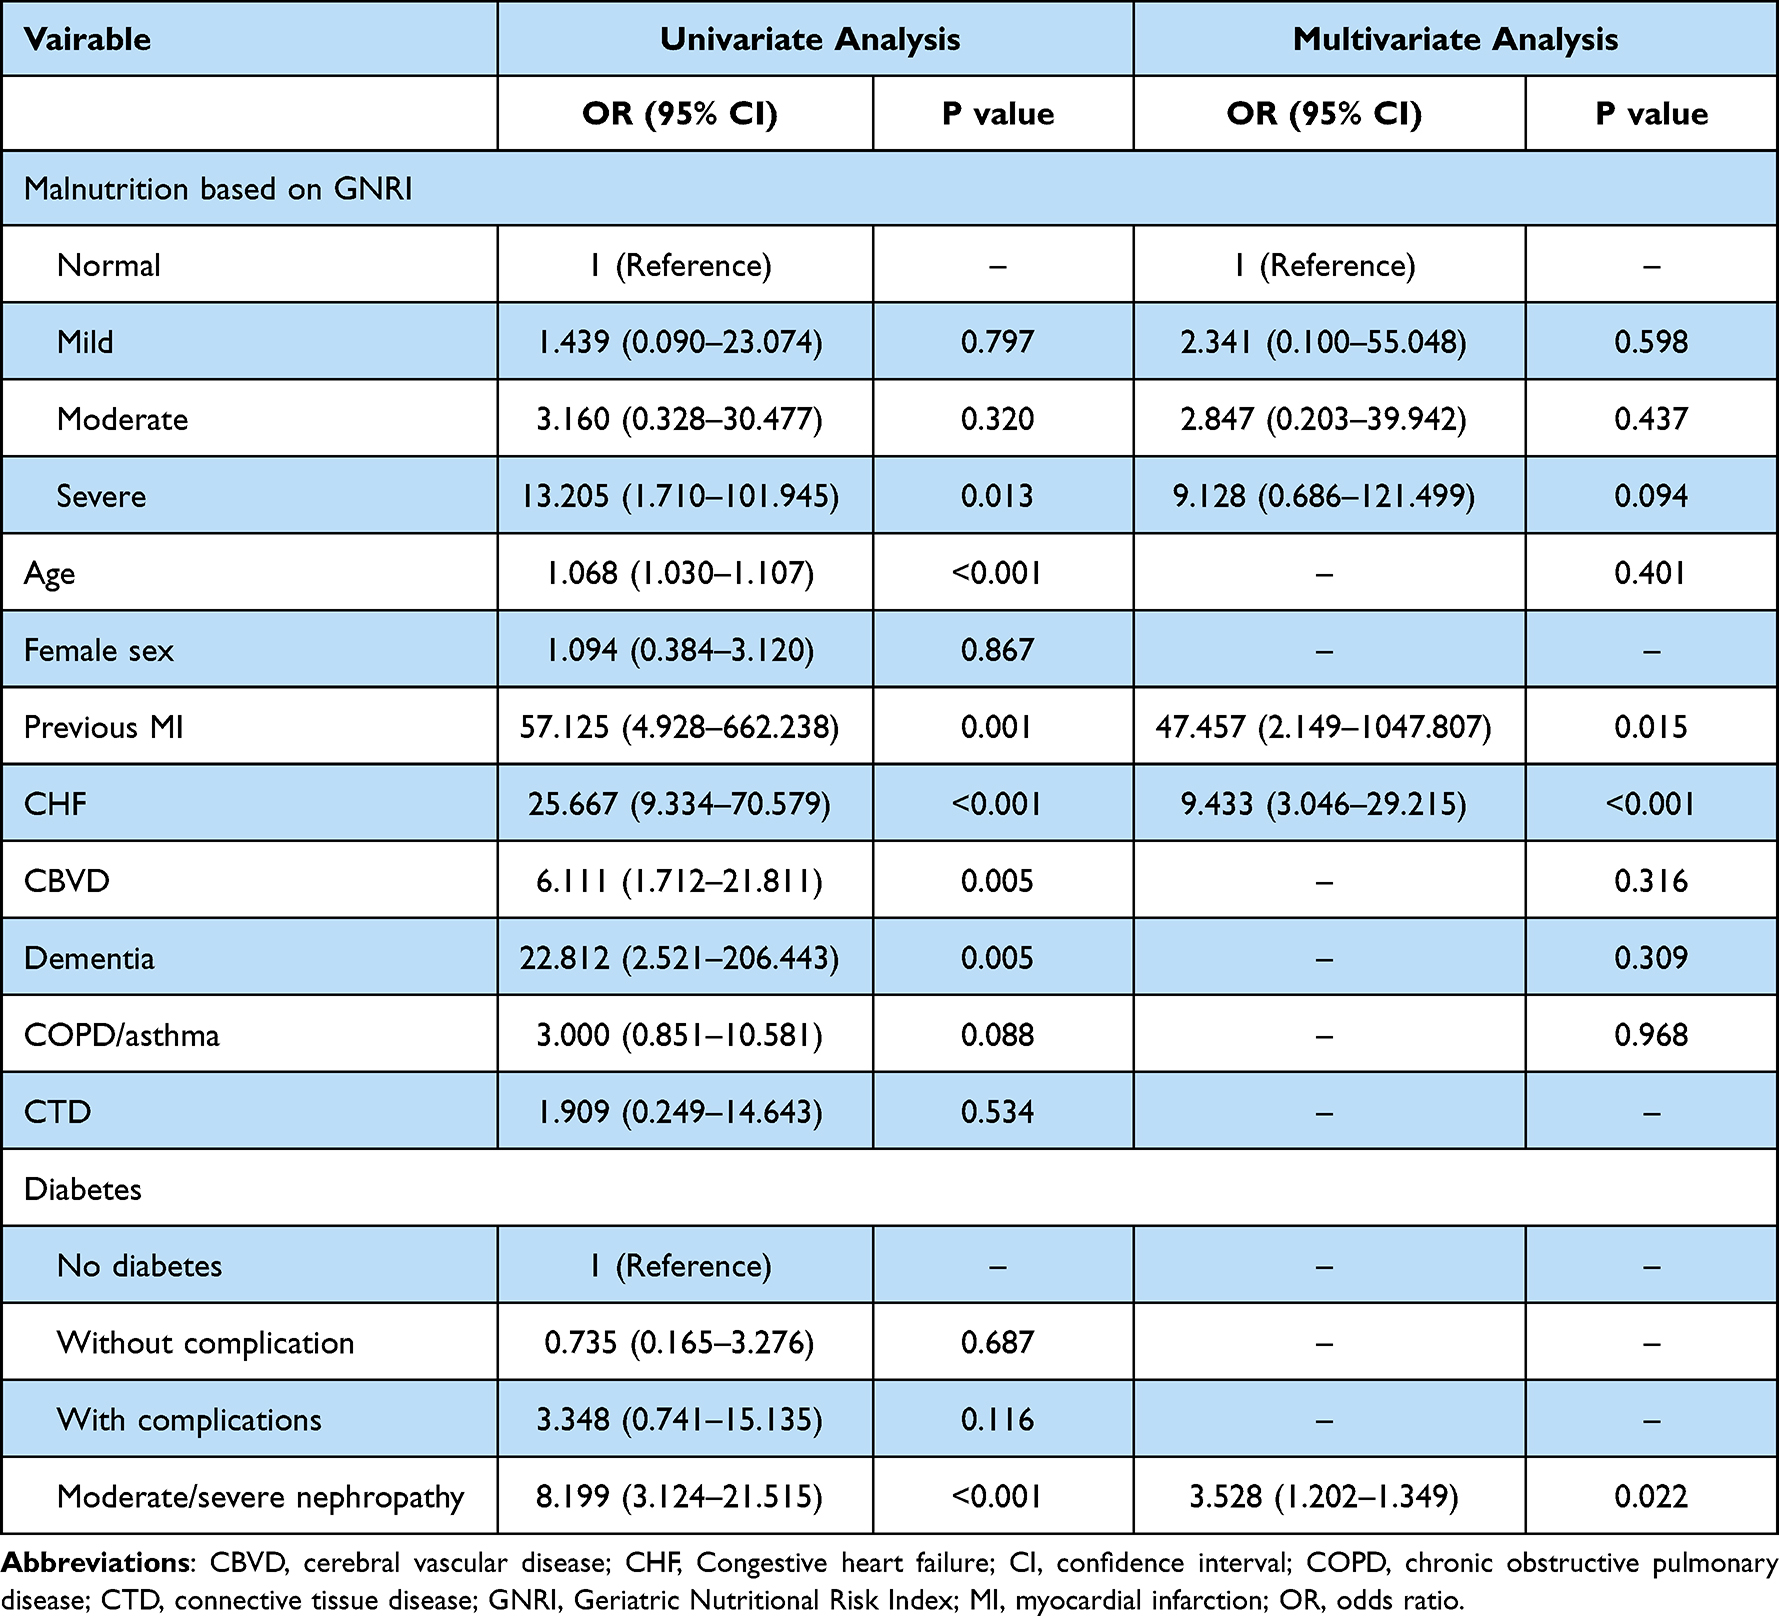 |
Table 3 Logistic Regression Analysis of All-Cause Mortality During Hospitalization Based on GNRI Grouping |
Under the grouping of nutritional levels defined by BMI, the univariate logistic regression analysis showed a statistically different OR for in-hospital all-cause death was 9.420 (95% CI 3.229–27.479) for malnutrition (severe vs normal) (eTable 4 in the Supplementary Materials), and the other univariate results were the same as above. The goodness-of-fit test for the multivariable logistics regression model was done, and it showed that the model had sufficient calibration (P=0.619). Compared with the BMI normal group, this OR for all-cause death was 8.020 (95% CI 2.409–26.698) (severe vs normal) (eTable 4 in the Supplementary Materials), 29.748 (95% CI 2.041–433.633) for previous MI, 11.330 (95% CI 3.726–34.454) for CHF, and 5.540 (95% CI 1.759–17.099) for moderate or severe nephropathy.
Patient Characteristics After Propensity Score Matching
Under the grouping of nutrient levels defined by GNRI, the propensity score model performed well with a C-statistic of 0.998 for all-cause death. Following the requirement of 1:1 matching, 513 malnourished patients were successfully matched with 513 non-malnourished patients, for a matching rate of 99.4%. The matching of all baseline variables is highly balanced (Table 4).
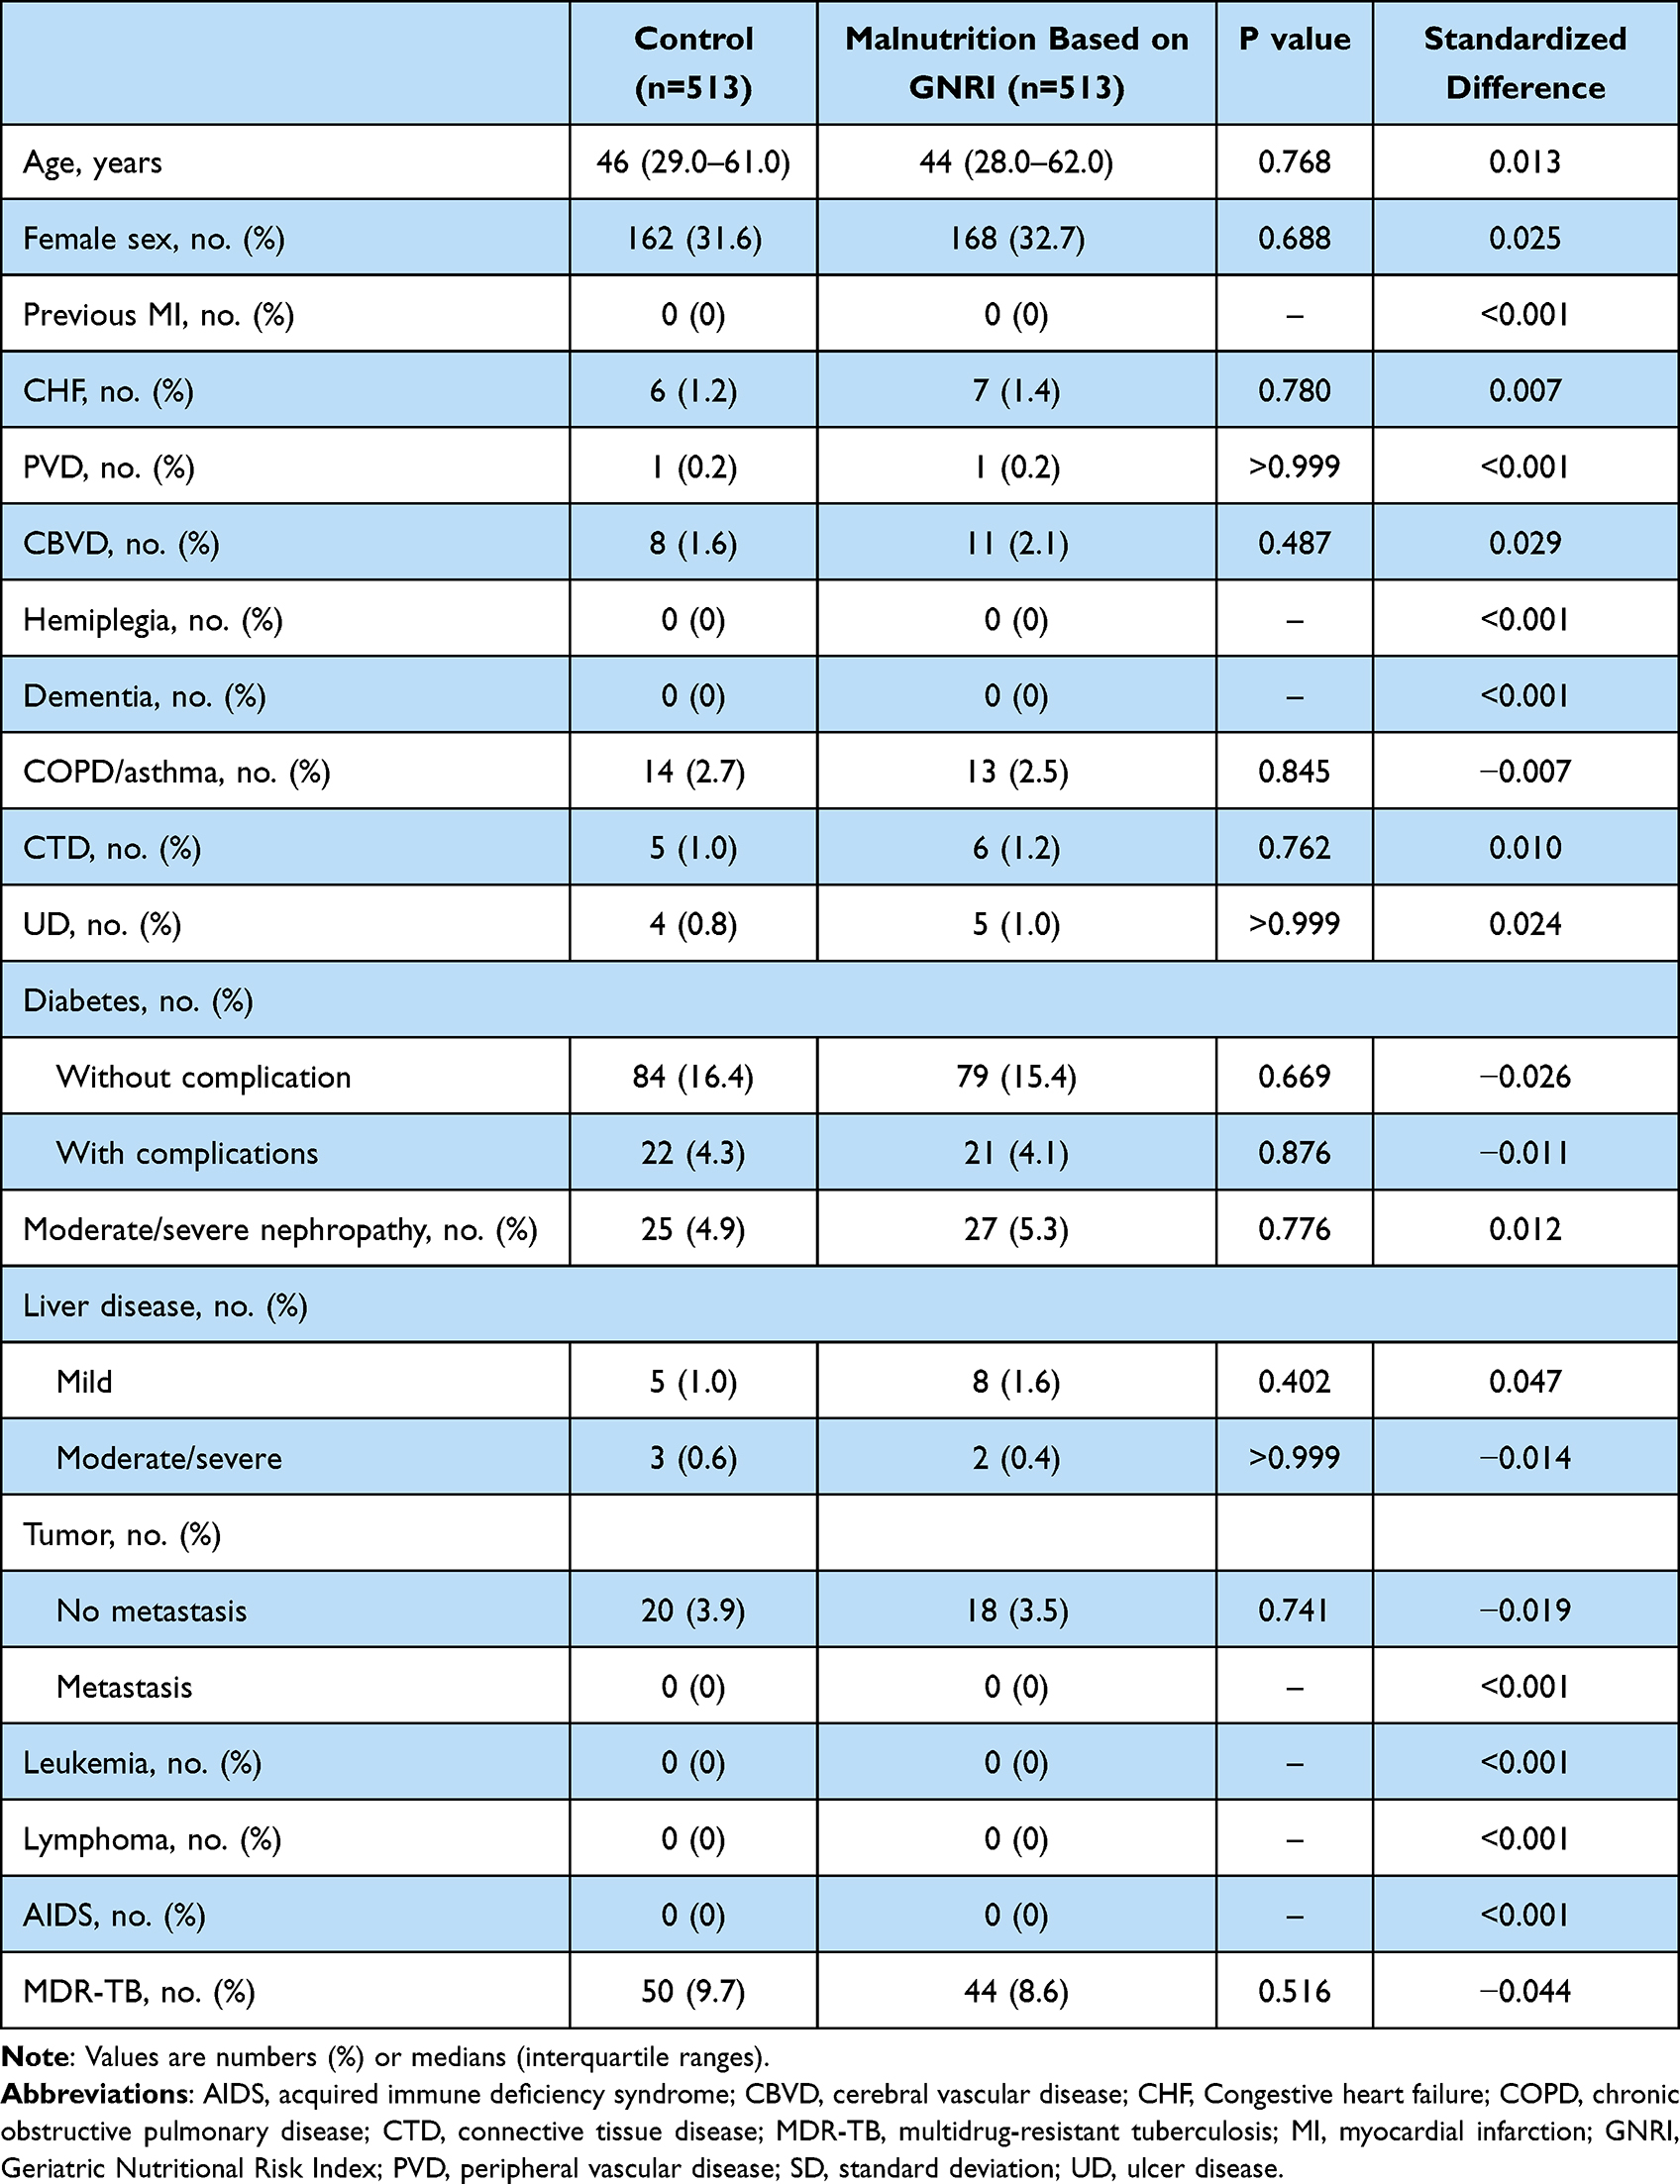 |
Table 4 Clinical Characteristics of Propensity Score Matched Patient Pairs Based on GNRI Grouping |
Under the grouping of nutritional levels defined by BMI, the propensity score model performed well with a C-statistic of 0.948 for all-cause death. Following the requirement of 1:1 matching, 620 malnourished patients were successfully matched with 620 non-malnourished patients, for a matching rate of 96.9%. The matching of all baseline variables is highly balanced (eTable 5 in the Supplement).
Outcomes After Propensity Score Matching
After propensity score matched pairs, grouped by GNRI-defined nutrition level, the primary outcome showed that those in the malnutrition group had a higher risk of all-cause mortality compared with the control group (P < 0.001) (Table 5). Similarly, when grouped by level of nutrition as defined by BMI, the malnourished group had a higher risk of all-cause mortality compared with the control group (P < 0.001).
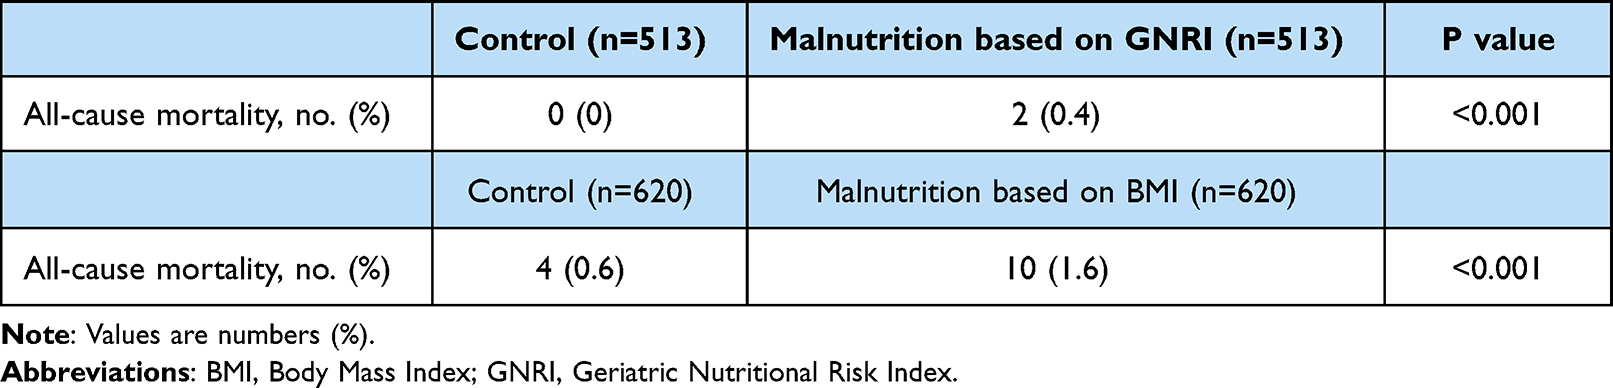 |
Table 5 All-Cause Mortality Among Propensity Score Matched Patient Pairs |
Prediction of the Outcome
The ROC curve analysis for the risk of all-cause death showed that this AUC was 0.811 ([95% CI 0.701–0.922], P < 0.001) for GNRI and 0.728 ([95% CI 0.588–0.869], P = 0.001) for BMI (Supplementary Figure 2). Quantitative analysis comparing the two ROC curves showed that no statistical difference was reached for GNRI compared to BMI (P = 0.0696) (eTable 6 in the Supplementary Materials).
Discussion
This study investigated the impact of malnutrition in patients with active pulmonary tuberculosis on the risk of all-cause death during hospitalization and further evaluated the predictive ability of GNRI compared with BMI for the risk of all-cause death. The main findings are that under the nutrition level grouping defined by GNRI, the risk of all-cause death in patients with TB and malnutrition seems to be higher, but there is no statistical difference. Under the nutrition level grouping defined by BMI, the risk of all-cause death in patients with TB and malnutrition is higher than that of patients without malnutrition, and multivariate logistic regression analysis showed that malnutrition was an independent risk factor for all-cause death. After the propensity score matched pairs, the baseline data of the two nutrition level scores were highly balanced, and the results showed that TB with malnutrition had a higher risk of all-cause death than TB without malnutrition under either BMI or GNRI-defined nutrition level grouping. In addition, GNRI seems to have a better ability to predict the risk of all-cause death than BMI, but this difference has not reached statistical significance.
Many studies3,17–19 showed a close relationship between malnutrition and the occurrence of pulmonary TB, but it has not been clarified whether malnutrition increases the short-term mortality risk of pulmonary TB, the results of univariate analysis generally tended that malnutrition was a factor affecting the mortality risk of TB patients. However, the results of the multivariate analysis were different. To our knowledge, there has never been a prospective cohort study comparing the risk of mortality between malnutrition and non-malnutrition during hospitalization, Propensity-score matched studies, such as this, although less powerful, provide an alternative approach to determine whether nutrient levels have an impact on short-term mortality risk. Intuitively, malnutrition attenuates patient immunity, accompanied by relatively enhanced mycobacterium tuberculosis toxicity, and decreased lesion repair, resulting in delayed healing or spread of lesions.
Wakjira et al20 designed a cross-sectional study on the determinants of treatment in patients with TB, the results of which showed that mortality was higher in patients with low Body Mass Index and human immunodeficiency virus (HIV) infection. In the systematic review of risk factors for mortality in adults during and after TB treatment, Waitt et al found that in the context of a high TB incidence and HIV prevalence, risk factors for mortality included HIV positivity and malnutrition, whereas malnutrition was not a risk factor for mortality in areas with a low TB incidence and HIV prevalence.21 Maayer et al, in a prospective descriptive study with a 6-month follow-up, found that HIV infection significantly increased severe malnutrition case fatality.22 On the premise that these results are fully trusted, they suggest that malnutrition may be an independent risk factor for mortality in immunocompromised patients. However, most of the previous prospective studies were descriptive studies, and although there was a correction for the multivariate logistic analysis model, it may still not eliminate the influence of differences in baseline data on the results. Our results showed conflicting results for BMI-defined malnutrition and GNRI-defined malnutrition in the whole cohort, with the former demonstrating in both chi-square analysis and multivariate logistics analysis that malnutrition increases the risk of mortality in patients with TB, while the latter did not reach a statistical difference. However, after propensity score matching, the risk of mortality was increased in the malnourished compared to the non-malnourished group as defined by both nutritional scores. HIV infection was rare among our included subjects this time, but the results still showed that malnutrition is an independent risk factor for short-term mortality of TB patients, suggesting that nutritional management should be given adequate attention during TB treatment even in areas with low HIV prevalence.
Another aim of our present study was to evaluate the predictive ability of GNRI and BMI for the risk of all-cause mortality. BMI as an indicator of the nutritional level of low body weight is widely used to assess the malnutrition grade of TB patients.20,22–25 However, there are still various types of malnutrition in clinics, such as total protein malnutrition, albumin malnutrition, nutritional anemia, and vitamin-related malnutrition.26–31. Previous studies suggested that multivitamin supplementation is beneficial to the prognosis of TB patients, and its effect may be through inhibiting growth, even killing Mycobacterium TB, and improving the internal environment of oxidative stress.30,31 Therefore, BMI may not provide a comprehensive assessment of nutritional levels in TB patients. The parameters of GNRI include height, weight, and albumin, and are also improved by NRI recommended by PNNs. It has been proved to have a good predictive ability for the prognosis of a variety of diseases, such as coronary heart disease patients undergoing percutaneous coronary intervention,32 patients after hip fracture surgery,33 patients with diabetic foot ulcers,34 and patients after radical oncological surgery.35 Our results showed that GNRI had a good predictive ability for the risk of death in patients with active pulmonary TB, and its predictive value tended to be higher than BMI, which also suggested that in addition to focusing on weight change during treatment, albumin supplementation should not be ignored. Albumin serves as an important energy source and the amount consumed reflects the extent of overall energy depletion by TB bacilli in patients, and in addition albumin deficiency impairs T cell function, and leads to trapping or sequestration of reactive T lymphocytes after BCG vaccination and loss of TB resistance.5
The advantage of this study is that the method of propensity score matching is used for the first time to fully balance the baseline data between groups. The results showed that malnutrition was an independent risk factor for short-term death of active pulmonary TB and is not restricted to, for example, specific groups in which HIV infection causes immunodeficiency. Furthermore, GNRI holds the promise of being more predictive than BMI for the risk of in-hospital mortality in patients with TB.
There are some limitations to this study. First, Some indicators of interest, such as the subject’s weight loss over the past 3 ~ 6 months, should ideally be included in the model, but not in the database. Second, the propensity score matching method, although adopted to de-balance differences in baseline data between groups and make comparisons of the primary outcomes, this approach respects the comparative requirements of prospective cohort studies and may still be inherently subject to hidden and unquantifiable biases. Finally, the subject of this study was simply looking at the association of malnutrition with in-hospital death and did not specifically assess whether improved nutrition levels after treatment would reduce the risk of death, which will be the subject of a future report by our group.
Overall, In the clinical treatment of patients with active TB, more attention should be paid to the management of nutritional risk. GNRI may be a highly effective and easy method for predicting short-term outcomes in patients with active pulmonary TB.
Funding
This study was supported by the Health Commission of Zhejiang Province (2023KY969 and 2021KY916), the Hangzhou Red Cross Hospital Young Fund (HHQN2021006), the Hangzhou Municipal Health Commission (A20210115), and the Hangzhou Key Discipline of Integrated Traditional Chinese and Western Medicine (2020SJZDXK06). All sponsors mainly provide remuneration or gratuities for lectures, speeches, speaker offices, manuscript writing or educational activities, and do not play any role in research design, data collection and analysis or decisions to submit articles for publication.
Disclosure
The authors report no conflicts of interest in relation to this work.
References
1. World Health Organization. Global Tuberculosis Report 2021. Geneva, Switzerland: World Health Organization; 2021. Available from: https://apps.who.int/iris/bitstream/handle/10665/346387/9789240037021-eng.pdf.
2. Di Gennaro F, Gualano G, Timelli L, et al. Increase in tuberculosis diagnostic delay during first wave of the COVID-19 pandemic: data from an italian infectious disease referral hospital. Antibiotics. 2021;10(3). doi:10.3390/antibiotics10030272
3. Sinha P, Davis J, Saag L, et al. Undernutrition and tuberculosis: public health implications. J Infect Dis. 2019;219(9):1356–1363. doi:10.1093/infdis/jiy675
4. Prezzemolo T, Guggino G, La Manna MP, Di Liberto D, Dieli F, Caccamo N. Functional signatures of human CD4 and CD8 T cell responses to Mycobacterium tuberculosis. Front Immunol. 2014;5:180. doi:10.3389/fimmu.2014.00180
5. Dai G, Phalen S, McMurray DN. Nutritional modulation of host responses to mycobacteria. Front Biosci. 1998;3:e110–e122. doi:10.2741/A371
6. Zheng Y, Ma A, Wang Q, et al. Relation of leptin, ghrelin and inflammatory cytokines with body mass index in pulmonary tuberculosis patients with and without type 2 diabetes mellitus. PLoS One. 2013;8(11):e80122. doi:10.1371/journal.pone.0080122
7. Ye M, Bian LF. Association of serum leptin levels and pulmonary tuberculosis: a meta-analysis. J Thorac Dis. 2018;10(2):1027–1036. doi:10.21037/jtd.2018.01.70
8. Kim JH, Lee CT, Yoon HI, Song J, Shin WG, Lee JH. Relation of ghrelin, leptin and inflammatory markers to nutritional status in active pulmonary tuberculosis. Clin Nutr. 2010;29(4):512–518. doi:10.1016/j.clnu.2010.01.008
9. Santucci N, D’Attilio L, Kovalevski L, et al. A multifaceted analysis of immune-endocrine-metabolic alterations in patients with pulmonary tuberculosis. PLoS One. 2011;6(10):e26363. doi:10.1371/journal.pone.0026363
10. Kondrup J, Allison SP, Elia M, Vellas B, Plauth M. ESPEN guidelines for nutrition screening 2002. Clin Nutr. 2003;22(4):415–421. doi:10.1016/S0261-5614(03)00098-0
11. Buzby GP, Williford WO, Peterson OL, et al. A randomized clinical trial of total parenteral nutrition in malnourished surgical patients: the rationale and impact of previous clinical trials and pilot study on protocol design. Am J Clin Nutr. 1988;47(2 Suppl):357–365. doi:10.1093/ajcn/47.2.357
12. Bouillanne O, Morineau G, Dupont C, et al. Geriatric Nutritional Risk Index: a new index for evaluating at-risk elderly medical patients. Am J Clin Nutr. 2005;82(4):777–783. doi:10.1093/ajcn/82.4.777
13. State health and Family Planning Commission of the People’s Republic of China. Diagnostic criteria of pulmonary tuberculosis. Electron J Emerg Infect Dis. 2018;3(1):59–61.
14. State health and Family Planning Commission of the People’s Republic of China. Tuberculosis classification. Electron J Emerg Infect Dis. 2018;3(3):191–192.
15. Koppie TM, Serio AM, Vickers AJ, et al. Age-adjusted Charlson comorbidity score is associated with treatment decisions and clinical outcomes for patients undergoing radical cystectomy for bladder cancer. Cancer. 2008;112(11):2384–2392. doi:10.1002/cncr.23462
16. Bailey KV, Ferro-Luzzi A. Use of body mass index of adults in assessing individual and community nutritional status. Bull World Health Organ. 1995;73(5):673–680.
17. Baluku JB, Namiiro S, Nabwana M, Muttamba W, Kirenga B. Undernutrition and treatment success in drug-resistant Tuberculosis in Uganda. Infect Drug Resist. 2021;14:3673–3681. doi:10.2147/IDR.S332148
18. Seid G, Ayele M. Undernutrition and mortality among adult tuberculosis patients in Addis Ababa, Ethiopia. Adv Prev Med. 2020;2020:5238010. doi:10.1155/2020/5238010
19. Bhargava A, Benedetti A, Oxlade O, Pai M, Menzies D. Undernutrition and the incidence of tuberculosis in India: national and subnational estimates of the population-attributable fraction related to undernutrition. Natl Med J India. 2014;27(3):128–133.
20. Wakjira MK, Sandy PT, Mavhandu-Mudzusi AH, Anupurba S. Treatment outcomes of patients with MDR-TB and its determinants at referral hospitals in Ethiopia. PLoS One. 2022;17(2):e262318. doi:10.1371/journal.pone.0262318
21. Waitt CJ, Squire SB. A systematic review of risk factors for death in adults during and after tuberculosis treatment. Int J Tuberc Lung Dis. 2011;15(7):871–885. doi:10.5588/ijtld.10.0352
22. De Maayer T, Saloojee H. Clinical outcomes of severe malnutrition in a high tuberculosis and HIV setting. Arch Dis Child. 2011;96(6):560–564. doi:10.1136/adc.2010.205039
23. Choi H, Yoo JE, Han K, et al. Body mass index, diabetes, and risk of tuberculosis: a retrospective cohort study. Front Nutr. 2021;8:739766. doi:10.3389/fnut.2021.739766
24. Kornfeld H, Sahukar SB, Procter-Gray E, et al. Impact of diabetes and low body mass index on tuberculosis treatment outcomes. Clin Infect Dis. 2020;71(9):e392–e398. doi:10.1093/cid/ciaa054
25. Lai HH, Lai YJ, Yen YF, Dowdy DW. Association of body mass index with timing of death during tuberculosis treatment. PLoS One. 2017;12(1):e170104. doi:10.1371/journal.pone.0170104
26. Rodríguez MG, Sichacá EG. Mortality due to malnutrition in older adults, Colombia, 2014–2016. Biomedica. 2019;39(4):663–672. doi:10.7705/biomedica.4733
27. Vadakattu SS, Ponday LR, Nimmathota A, et al. Prevalence of nutritional anemia and hyperhomocysteinemia in urban elderly. Indian J Clin Biochem. 2019;34(3):330–335. doi:10.1007/s12291-018-0756-8
28. Díaz DBM, Alarcón T, Menéndez-Colino R, Ramírez-Martín R, Otero Á, González-Montalvo JI. Prevalence of malnutrition in a cohort of 509 patients with acute Hip fracture: the importance of a comprehensive assessment. Eur J Clin Nutr. 2018;72(1):77–81. doi:10.1038/ejcn.2017.72
29. Cooper BA, Penne EL, Bartlett LH, Pollock CA. Protein malnutrition and hypoalbuminemia as predictors of vascular events and mortality in ESRD. Am J Kidney Dis. 2004;43(1):61–66. doi:10.1053/j.ajkd.2003.08.045
30. Patti G, Pellegrino C, Ricciardi A, et al. Potential role of vitamins A, B, C, D and E in TB treatment and prevention: a narrative review. Antibiotics. 2021;10(11):1354. doi:10.3390/antibiotics10111354
31. Papagni R, Pellegrino C, Di Gennaro F, et al. Impact of vitamin D in prophylaxis and treatment in tuberculosis patients. Int J Mol Sci. 2022;23(7):3860. doi:10.3390/ijms23073860
32. Anzaki K, Kanda D, Ikeda Y, et al. Impact of malnutrition on prognosis and coronary artery calcification in patients with stable coronary artery disease. Curr Probl Cardiol. 2022;101185. doi:10.1016/j.cpcardiol.2022.101185
33. Funahashi H, Morita D, Iwase T, Asamoto T. Usefulness of nutritional assessment using Geriatric Nutritional Risk Index as an independent predictor of 30-day mortality after Hip fracture surgery. Orthop Traumatol Surg Res. 2022;108(5):103327. doi:10.1016/j.otsr.2022.103327
34. Hong J, Huang QQ, Liu WY, et al. Three nutritional indices are effective predictors of mortality in patients with type 2 diabetes and foot ulcers. Front Nutr. 2022;9:851274. doi:10.3389/fnut.2022.851274
35. Nakamura Y, Imada A, Fukugaki A, et al. Association of nutritional risk and systemic inflammation with survival in patients with colorectal cancer who underwent curative surgery. Clin Nutr ESPEN. 2022;49:417–424. doi:10.1016/j.clnesp.2022.03.011
 © 2022 The Author(s). This work is published and licensed by Dove Medical Press Limited. The full terms of this license are available at https://www.dovepress.com/terms.php and incorporate the Creative Commons Attribution - Non Commercial (unported, v3.0) License.
By accessing the work you hereby accept the Terms. Non-commercial uses of the work are permitted without any further permission from Dove Medical Press Limited, provided the work is properly attributed. For permission for commercial use of this work, please see paragraphs 4.2 and 5 of our Terms.
© 2022 The Author(s). This work is published and licensed by Dove Medical Press Limited. The full terms of this license are available at https://www.dovepress.com/terms.php and incorporate the Creative Commons Attribution - Non Commercial (unported, v3.0) License.
By accessing the work you hereby accept the Terms. Non-commercial uses of the work are permitted without any further permission from Dove Medical Press Limited, provided the work is properly attributed. For permission for commercial use of this work, please see paragraphs 4.2 and 5 of our Terms.