Back to Journals » International Journal of Nanomedicine » Volume 10 » Issue 1
Magnetic resonance-guided regional gene delivery strategy using a tumor stroma-permeable nanocarrier for pancreatic cancer
Authors Wang Q, Li J, An S, Chen Y, Jiang C, Wang X
Received 18 March 2015
Accepted for publication 4 May 2015
Published 13 July 2015 Volume 2015:10(1) Pages 4479—4490
DOI https://doi.org/10.2147/IJN.S84930
Checked for plagiarism Yes
Review by Single anonymous peer review
Peer reviewer comments 5
Editor who approved publication: Professor Lei Yang
Qingbing Wang,1,2 Jianfeng Li,3 Sai An,3 Yi Chen,1 Chen Jiang,3 Xiaolin Wang1,2
1Department of Interventional Radiology, Zhongshan Hospital, Fudan University, 2Shanghai Institute of Medical Imaging, 3Key Laboratory of Smart Drug Delivery, Ministry of Education, Department of Pharmaceutics, School of Pharmacy, Fudan University, Shanghai, People’s Republic of China
Background: Gene therapy is a very promising technology for treatment of pancreatic ductal adenocarcinoma (PDAC). However, its application has been limited by the abundant stromal response in the tumor microenvironment. The aim of this study was to prepare a dendrimer-based gene-free loading vector with high permeability in the tumor stroma and explore an imaging-guided local gene delivery strategy for PDAC to promote the efficiency of targeted gene delivery.
Methods: The experimental protocol was approved by the animal ethics committee of Zhongshan Hospital, Fudan University. Third-generation dendrigraft poly-L-lysines was selected as the nanocarrier scaffold, which was modified by cell-penetrating peptides and gadolinium (Gd) chelates. DNA plasmids were loaded with these nanocarriers via electrostatic interaction. The cellular uptake and loaded gene expression were examined in MIA PaCa-2 cell lines in vitro. Permeability of the nanoparticles in the tumor stroma and transfected gene distribution in vivo were studied using a magnetic resonance imaging-guided delivery strategy in an orthotopic nude mouse model of PDAC.
Results: The nanocarriers were synthesized with a dendrigraft poly-L-lysine to polyethylene glycol to DTPA ratio of 1:3.4:8.3 and a mean diameter of 110.9±7.7 nm. The luciferases were strictly expressed in the tumor, and the luminescence intensity in mice treated by Gd-DPT/plasmid luciferase (1.04×10⁴±9.75×10² p/s/cm2/sr) was significantly (P<0.05) higher than in those treated with Gd-DTPA (9.56×10²±6.15×10 p/s/cm2/sr) and Gd-DP (5.75×10³± 7.45×10² p/s/cm2/sr). Permeability of the nanoparticles modified by cell-penetrating peptides was superior to that of the unmodified counterpart, demonstrating the improved capability of nanoparticles for diffusion in tumor stroma on magnetic resonance imaging.
Conclusion: This study demonstrated that an image-guided gene delivery system with a stroma-permeable gene vector could be a potential clinically translatable gene therapy strategy for PDAC.
Keywords: molecular imaging, magnetic resonance imaging, interventional, pancreatic cancer, genetic therapy, cell-penetrating peptides
Introduction
Pancreatic ductal adenocarcinoma (PDAC) is an aggressive malignancy with a 5-year survival rate of less than 5%.1 The mortality of PDAC is close to its incidence, and most patients die within a year of diagnosis, highlighting limitations in the currently available therapies. Novel clinically translatable therapeutic strategies are urgently needed to improve the dismal survival of patients with PDAC. The continuous identification of molecular changes that deregulate pivotal pathways in pancreatic tumor cells has provided a large number of novel candidates for PDAC gene therapy.2 At this point, development of a safe and effective gene delivery strategy is the major challenge to sustaining therapeutic gene expression changes in tumor cells.
Based on recent research, however, the abundant stromal response in the tumor microenvironment remains a critical barrier to widespread adoption of gene therapy for PDAC.3,4 The stroma, which is composed of protein such as collagen, hyaluronic acid, and cellular elements, contributes to poor vascularization and creates a high intratumoral pressure that decreases the ability of therapeutic agents to diffuse in tumor tissue, meaning that effective drug concentrations cannot reach tumor cells.5,6 Therefore, we propose that novel gene therapy strategies for PDAC should focus on optimizing nonvascular routes of gene delivery and enhancing the permeability of gene therapy vectors in the cancer stroma.
Compared with intravenous administration of therapeutic drugs, intratumoral injection guided by imaging techniques offers a more targeted route of delivery.7 Among the imaging modalities available, magnetic resonance imaging (MRI) is suitable for this purpose because it has high spatial resolution, tomographic capability, and the potential to provide quantitative information on the amount of contrast agent in the tissue.8,9 While adapting the therapeutic techniques of interventional radiology, MRI-guided nanoparticle delivery could enhance uptake of an intratumoral agent and limit its nonspecific delivery to the reticuloendothelial system.10,11 In support of this concept, some studies have reported on application of MRI-guided intra-arterial12 and intrabiliary13 nanoparticles for the treatment of liver tumors.
Cell-penetrating peptides (CPPs) are short 30-residue synthetic peptides and represent one of the most promising strategies for enhancing the permeability of therapeutic agents, despite the limitations of various biomolecules with regard to extracellular and intracellular diffusion.14 The mechanism of CPP translocation is not well established, but an inverted micelle mechanism has been proposed, in which positively charged peptides interact with negatively charged phospholipids to convert part of the membrane into an inverted micelle structure that can open on either the intracellular or the extracellular side of the membrane, making it possible for agents to diffuse through cells.15,16 To date, CPPs have been successfully applied to transport “cargo” across cells,17 the blood–brain barrier,18,19 and the skin.20,21
In the current study, we prepared a dendrimer-based gene vector modified by gadolinium (Gd) chelation and CPPs. We then used MRI to administer and monitor gene delivery in the tumor stroma. Our goal was to develop an imaging-guided local gene delivery strategy for PDAC to enhance the efficiency of targeted gene delivery.
Materials and methods
Preparation and characterization of nanoparticles
The nanoparticles were prepared step by step, and a detailed description can be found in the Supplementary materials section. Briefly, dendrigraft poly-L-lysines (DGLs) were modified by TAT peptide, a type of CPP, with polyethylene glycol (PEG) as a linker. These conjugates were then modified with 2-(4-isothiocyanatobenzyl)-diethylenetriaminepentaacetic acid (p-SCN-Bn-DTPA) and chelated with GdCl3 (Gd-DPT). Nanocarriers modified with neither PEG nor TAT (Gd-D) and with PEG but without TAT (Gd-DP) were prepared as controls. Finally, the nanocarriers were loaded with the DNA plasmid to form nanoparticles. Plasmid red fluorescence protein (pRFP) and plasmid luciferase (pLuci) were used in this study. The characteristics of the nanocarriers were analyzed by nuclear magnetic resonance (NMR) spectroscopy (before being chelated with Gd3+). The mean diameter of the nanoparticles was determined by Zetasizer Nano (Malvern Instruments Ltd, Malvern, UK). The nanoparticle morphology was examined using atomic force microscopy (Bruker, Karlsruhe, Germany). Longitudinal relaxation time measurements were performed using a clinical 3.0 T magnetic resonance (MR) scanner system (GE Healthcare, Milwaukee, WI, USA).
Gene transfection
MIA PaCa-2 cell lines were expanded and maintained routinely (see online Supplementary materials section). They were seeded in 24-well plates at a density of 5×10⁴ cells/well and cultured for 24 hours. A dendrimer/pRFP preparation in serum-free medium was then added to the cells at a dose of 5 μg DNA/well and the mixture was incubated at 37°C. Two hours later, the medium was replaced with fresh medium containing fetal calf serum. After 46 hours, fluorescence images were acquired using a fluorescence microscope (IX 71, Olympus, Japan).
For quantitative analysis of gene transfection, the same cultured cells were treated with pLuci-loaded nanoparticles (Gd-D/pLuci, Gd-DP/pLuci, and Gd-DPT/pLuci) for 2 hours. After 46 hours, luciferase activity was quantified using a luciferase assay (Promega, Madison, WI, USA) according to the manufacturer’s instructions. The efficiency of gene transfection with Lipofectamine® 2000, polyethylenimine (molecular weight 25 kDa), and gadopentetate dimeglumine (Gd-DTPA, Magnevist™, Bayer, Leverkusen, Germany) was also studied and served as controls. The transfection protocol was performed according to the manufacturer’s instructions.
Animal preparation
The protocol used to establish an orthotopic nude mouse model of pancreatic cancer was reported in a previous study.22 All animals received human care in accordance with the National Institute of Health (NIH) Policy on the Care and Use of Laboratory Animals and was approved by the Animal Use and Care Committee of Zhongshan Hospital, Fudan University. Briefly, MIA PaCa-2 cell lines were prepared at concentrations of 2×10⁶ per 100 μL. After anesthesia, the mouse’s abdominal cavity was opened and the tail of the pancreas was exposed. Tumor cells (100 μL) were slowly injected into the junction of the pancreas body and tail. Fifteen mice were included in this study; two were found to have peritoneal metastases, one died during surgery, and twelve (80%) finally grew tumors in the pancreas. The in vivo study was carried out 3 weeks after the implantation procedure.
Distribution of gene expression
Nine of the prepared mice were randomized to treatment with Gd-DTPA/pLuci, Gd-DP/pLuci, or Gd-DPT/pLuci (n=3 for each treatment). The complexes were injected percutaneously into the tumors at a dose of 10 μg DNA per mouse. Approximately 48 hours after injection, 3 mg of luciferin (Promega) in 0.2 mL of PBS was injected intraperitoneally, and the luminescence intensity from the mice was measured using an IVIS Lumina system coupled with Living Image software for data acquisition (Xenogen Corporation, Alameda, CA, USA).
MRI tracking in vivo and imaging analysis
Twelve mice underwent MR scanning and were randomly divided into three groups for administration of Gd-DTPA/pRFP, Gd-DP/pRFP, or Gd-DPT/pRFP. The complexes were injected percutaneously into the tumor of each mouse at a dose of 10 μg DNA per mouse. Abdominal MR imaging was performed using a clinical 3.0 T MR system (GE Healthcare) with a small animal coil immediately before and at 10 minutes, 30 minutes, 2 hours, and 6 hours post-injection. The mice were scanned in a prone position while under general anesthesia. A spin echo T1-weighted imaging sequence in the axial view was performed for real-time tracking of the nanoparticles (repetition time 300 msec; echo time 7.6 msec; echo train 3; matrix size 192×160; field of view 7×5 cm2). A fast inversion recovery sequence with variable time inversion was used for T1 measurements (variable time inversion 100, 150, 200, 300, 400, and 600 msec; repetition time 4,000 msec; echo time available minimum; echo train 4; slice thickness 2 mm; matrix size 192×160; field of view 7×5 cm2).
A software program for T1 mapping research (Function tool 4.3, GE Healthcare) was used to calculate the T1 relaxation times. To analyze distribution of the drug in tumor tissue, two circled regions of interest with the same area of 5 mm2 were used; one was placed at the central location where agents were injected and another was placed within the rim of tumor. Both of the regions were selected to be inside the tumor parenchyma to avoid overlap with one another. The diffusion breadth was defined as the short axis diameter of the enhanced area in the tumor parenchyma and was measured at the site of injection in T1-weighted images. A ratio was calculated from the present diffusion breadth measurements divided by the prior one, which measured in the same position. This measure was used to assess permeability, and was performed with consensus by two radiologists (QBW and YC).
Histopathologic study
Approximately 42 hours after MR scanning, the animals were anesthetized with diethyl ether and euthanized, after which the tumors were harvested. For immunofluorescence, a rabbit polyclonal anti-collagen I antibody (diluted 1:50, Abcam, Cambridge, UK) was incubated with sections overnight at 4°C followed by incubation with secondary anti-rabbit antibody (Dako, Carpinteria, CA, USA). The slides were then stained with 300 nM 4,6-diamidino-2-phenylindole (DAPI) for 10 minutes at room temperature and visualized with an inverted IX71 fluorescence microscope (Olympus). Frozen sections of fresh samples were prepared as well. After staining with DAPI, the stained slices were immediately examined under a confocal luminescence microscope (FV1000, Olympus).
Statistical analysis
The results of all experiments are expressed as the mean ± standard deviation. Statistical analyses were performed using a two-tailed, unpaired Mann–Whitney U-test. P<0.05 was considered to indicate a statistically significant difference. Data were analyzed using Stata software (version 11.2, StataCorp LP, Station, TX, USA).
Results
Synthesis and characterization of nanoparticles
As shown in Figure 1, nanocarriers (Gd-DPT) were constructed and administered regionally via an MR-guided percutaneous intratumoral delivery route. A control nanocarrier (Gd-DP) without modification of CPPs was also prepared. In the NMR spectra, the calculated molar ratio of DGL to PEG to DTPA was 1:3.4:8.3 (Figure 2A). The mean diameter of the Gd-DPT/plasmid nanoparticles was 110.9±7.7 nm (Figure 2B). Atomic force microscopy showed that the Gd-DPT/plasmid nanoparticles had a spherical shape and a compact structure (Figure 2C). A relatively lower r1 was detected for Gd-DPT/plasmid (0.88 mM−1s−1) and Gd-DP/plasmid (0.90 mM−1s−1) compared with Gd-DTPA/plasmid (3.92 mM−1s−1). Some Gd3+ ions were embedded by plasmid in the nanoparticles and limited the interaction with water protons23 (Figure 2D).
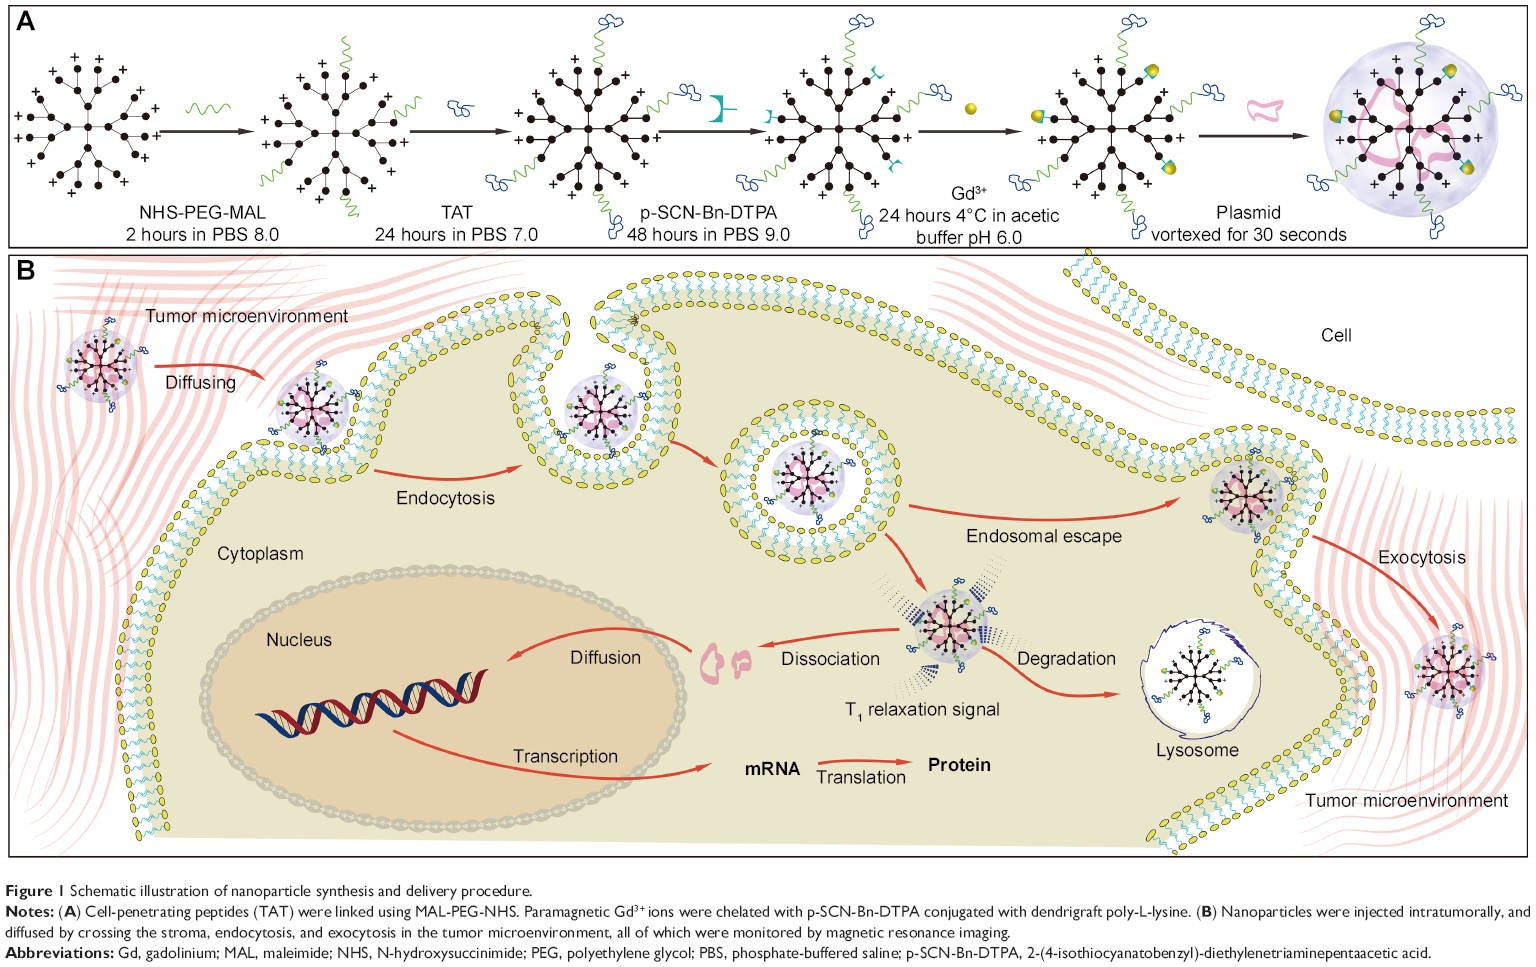 | Figure 1 Schematic illustration of nanoparticle synthesis and delivery procedure. |
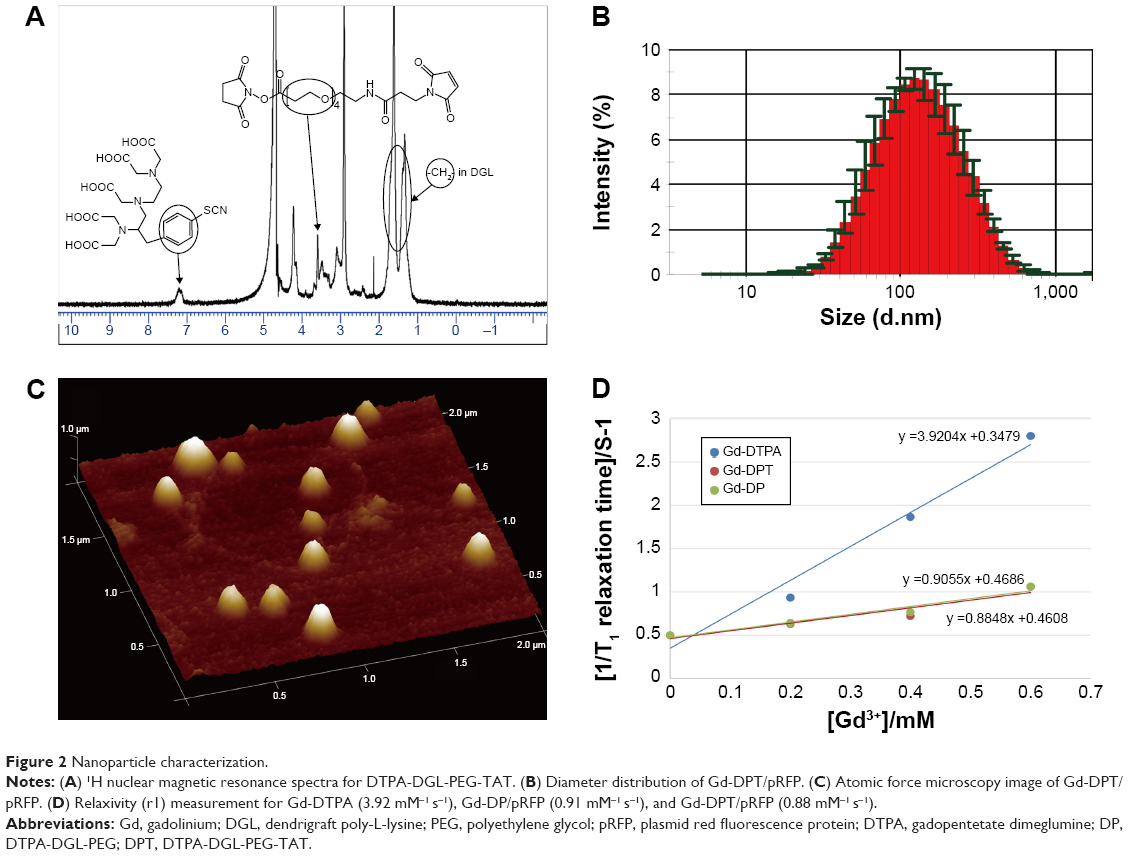 | Figure 2 Nanoparticle characterization. |
Gene transfection
The transfection efficiency of pRFP delivered by the different dendrimers in vitro is shown in Figure 3A. The red fluorescence protein (RFP) expression in cells transfected with Gd-DPT was high compared with transfection using Gd-DGL and Gd-DP. Under quantitative analysis, the luciferase activity in cells treated with Gd-DPT was similar to that of those treated with polyethylenimine (P>0.05), yet was obviously different from those treated with Gd-DTPA, Gd-D, Gd-DP, or Lipofectamine (P>0.05; Figure 3B). To evaluate the distribution of gene delivery in vivo, pLuci-loaded complexes were utilized and the expression of luciferase was detected by IVIS (Figure 3C). Forty-eight hours following intratumoral injection, it was found that the luciferases only expressed in tumors, and the luminescence intensity in mice treated with Gd-DPT/pLuci (1.04×10⁴±9.75×10² p/s/cm2/sr) was significantly higher than in mice treated with Gd-DTPA (9.56×10²±6.15×10 p/s/cm2/sr) or Gd-DP (5.75×10³±7.45×10² p/s/cm2/sr; Figure 3D, P<0.05).
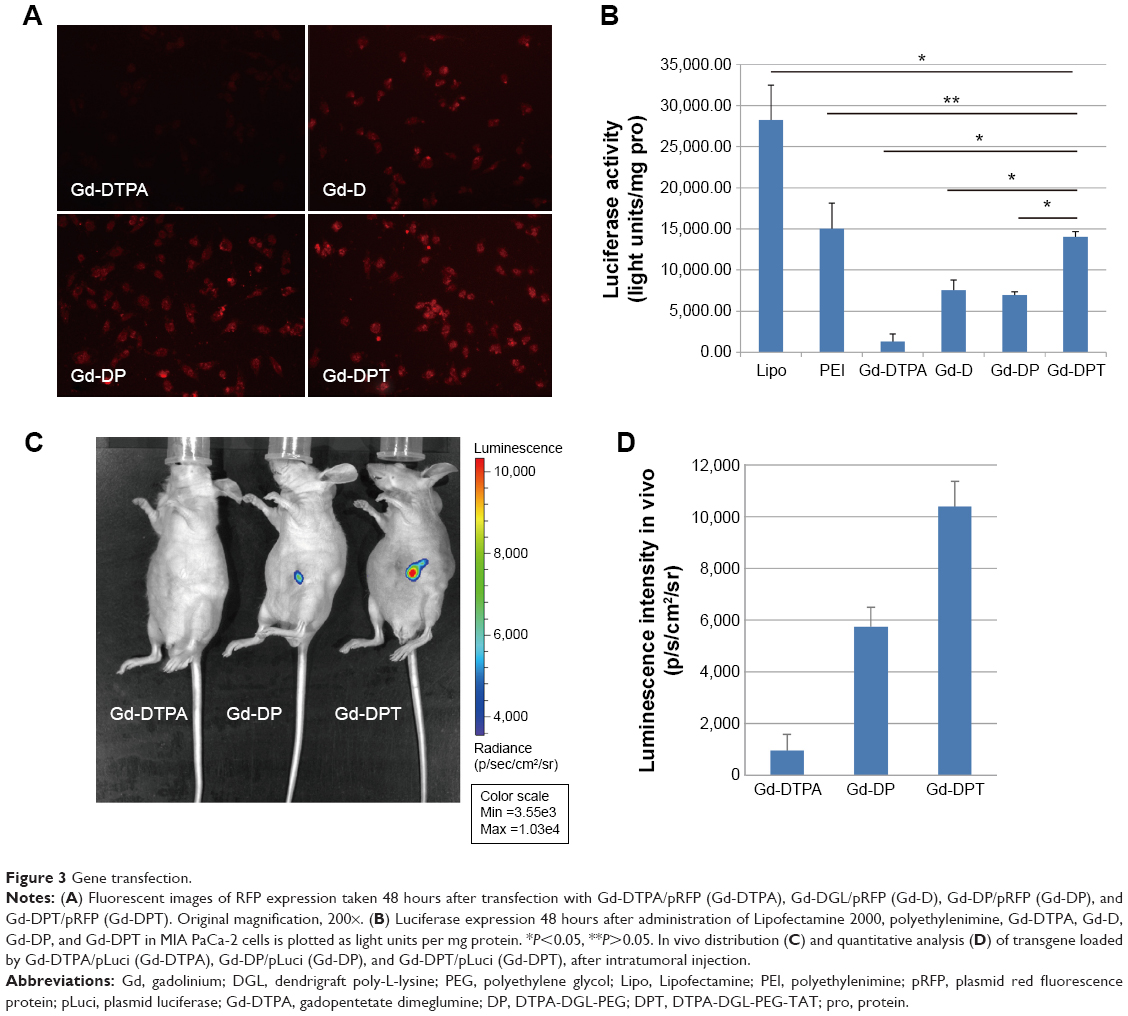 | Figure 3 Gene transfection. |
MRI tracking and imaging analysis in vivo
The signal intensity of the tumor parenchyma was homogeneous on T1-weighted images prior to administration of the complexes. As demonstrated in Figure 4, the small molecular Gd-DTPA cleared rapidly and showed limited diffusion in tumors of mice injected with the Gd-DTPA and pRFP complexes (upper panel). For Gd-DP, the MRI-visible contrast medium did not diffuse as rapidly or readily when compared with nanoparticles conjugated with Gd-DTPA during 6 hours of real-time scanning (middle panel). The permeability of Gd-DPT was superior to that of the unmodified counterpart, demonstrating its capacity for diffusion and tracking during MRI (lower panel).
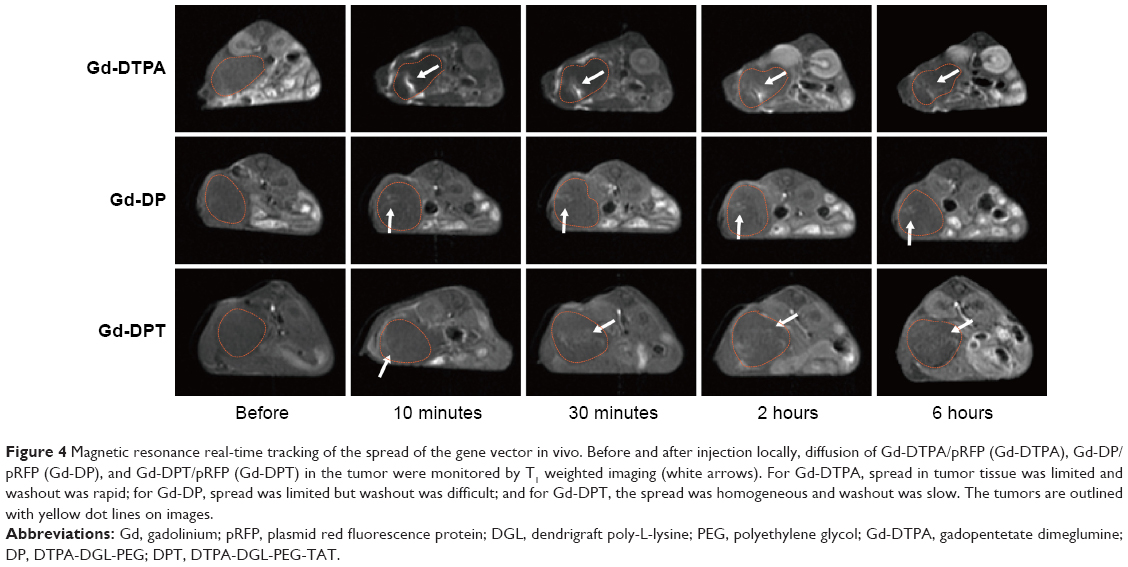 | Figure 4 Magnetic resonance real-time tracking of the spread of the gene vector in vivo. Before and after injection locally, diffusion of Gd-DTPA/pRFP (Gd-DTPA), Gd-DP/pRFP (Gd-DP), and Gd-DPT/pRFP (Gd-DPT) in the tumor were monitored by T1 weighted imaging (white arrows). For Gd-DTPA, spread in tumor tissue was limited and washout was rapid; for Gd-DP, spread was limited but washout was difficult; and for Gd-DPT, the spread was homogeneous and washout was slow. The tumors are outlined with yellow dot lines on images. |
Several characteristics were determined during quantitative analysis of the T1 relaxation time (Figure 5A–C). First, in the central region, the T1 relaxation time was decreased by Gd-DTPA (531.3±133.6 msec) when compared with Gd-DP/pRFP (761.1±269.5 msec; P<0.05) and Gd-DPT/pRFP (947.3±143.4 msec; P<0.05) at 10 minutes, indicating that the nanoparticles have a lower relaxivity rate when compared with small molecular contrast medium. Second, the signal in the center of the tumors treated by Gd-DP/pRFP was significantly enhanced at 6 hours when compared with those treated by Gd-DPT/pRFP (890.3±42.4 msec versus 983.2±24.1 msec; P<0.05). Third, at 6 hours, the difference in signals between the center and the rim of the tumors injected with Gd-DPT was almost nonexistent, while there was a clear difference between these areas for tumors treated with Gd-DTPA and Gd-DP. Relatively high diffusion breadth ratios were apparent after treatment with Gd-DPT, while the diffusion of Gd-DP was less apparent (Figure 5D).
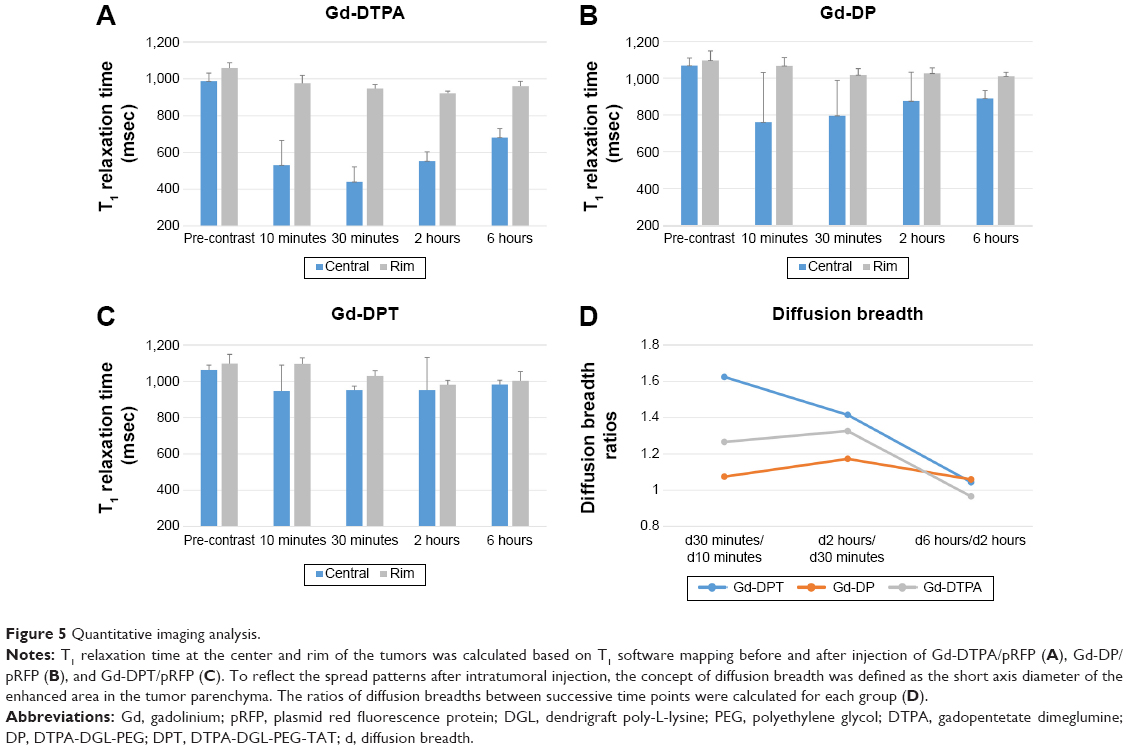 | Figure 5 Quantitative imaging analysis. |
Histopathology study
To monitor the tumor microenvironment in this orthotopic nude mouse model, we tested the expression and distribution of collagen, which is an important and abundant component of the extracellular matrix.3 As shown in Figure S1, there was a significant amount of collagen type I protein present in the tumor parenchyma, which comprised the non-integrated interval and separated the cancer cells into cancer nests. At the same time, we did not find necrotic regions within the tumor, which is consistent with the appearance on MRI (Figure 4).
A few cells with a weak luminescence signal in the tumors treated with the Gd-DTPA and pRFP complexes were detected using confocal luminescence microscopy, indicating that there was limited gene transfer when injecting naked plasmid (upper panel, Figure 6). The pRFP loaded by Gd-DP was better translated in a single cancer cell compared with Gd-DTPA/pRFP, demonstrating that dendrimers could protect the plasmid from being degraded in the lysosome24 (middle panel, Figure 6). Additionally, for both of the above groups, the transfected cells settled along crevices in the tumor tissue. However, expression of RFP in cells treated with Gd-DPT/pRFP was homogeneous in its distribution and had a strong signal intensity (lower panel, Figure 6).
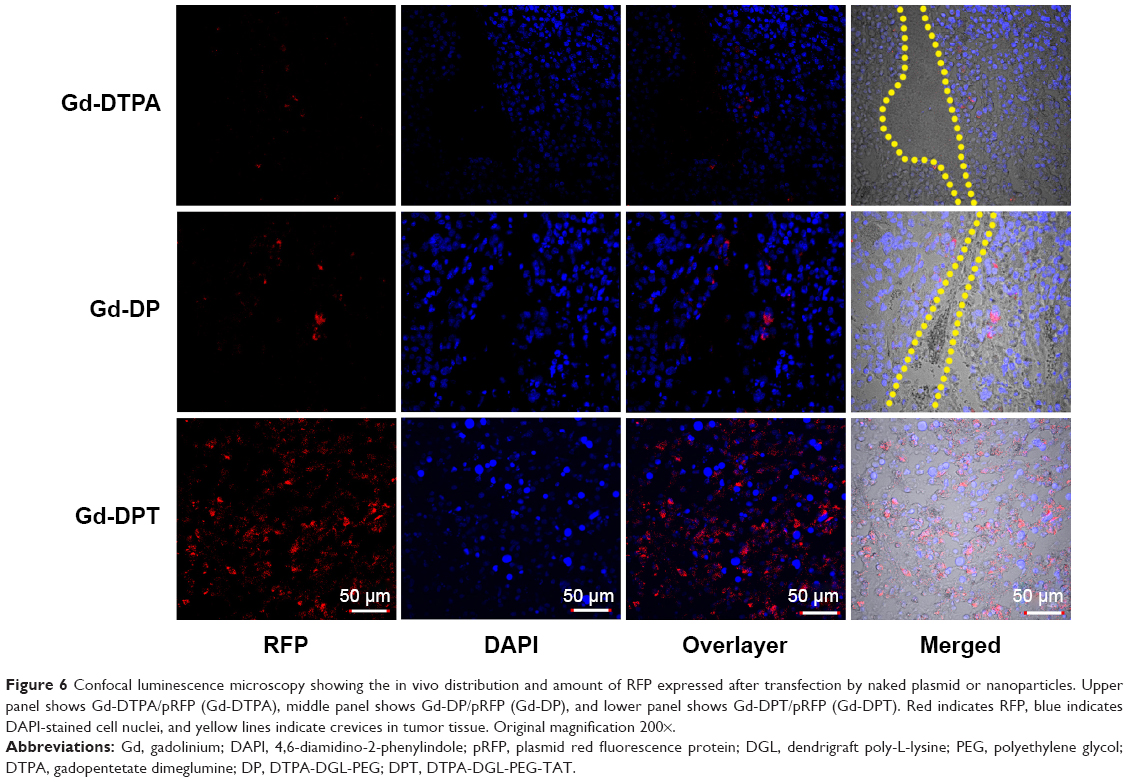 | Figure 6 Confocal luminescence microscopy showing the in vivo distribution and amount of RFP expressed after transfection by naked plasmid or nanoparticles. Upper panel shows Gd-DTPA/pRFP (Gd-DTPA), middle panel shows Gd-DP/pRFP (Gd-DP), and lower panel shows Gd-DPT/pRFP (Gd-DPT). Red indicates RFP, blue indicates DAPI-stained cell nuclei, and yellow lines indicate crevices in tumor tissue. Original magnification 200×. |
Discussion
The success of any gene therapy depends largely on the efficiency of gene delivery, which is the result of the combined effects of the delivery vector and the delivery route used.25 In this study, we prepared a multifunctional gene free-loading nanocarrier decorated with CPPs and Gd chelation products; concomitantly, a local MRI-guided delivery route was explored for PDAC. With the MR-visible gene vector, imaging-guided interventional gene therapy was not only feasible, but was also efficient for targeted gene delivery. The data in our investigation demonstrate that CPPs facilitated significant cellular uptake and enhanced loaded gene expression for nanoparticles administered regionally in the tumor microenvironment.
The development and implementation of targeted therapies is a crucial goal in modern oncology, especially in regard to gene therapy. However, both passive and active targeting strategies have been of little use in developing new therapies for PDAC. On the one hand, the tumor microenvironment has restricted the passively selective accumulation of nanoparticles in tumor sites with the effect of enhanced permeability and retention (EPR effect).26 On the other hand, in PDAC, pancreatic tumor cells have not been shown to express specific biomarkers; to date, there are very few examples of nanoparticles with therapeutic efficacy in experimental pancreatic models that have been functionalized with specific ligands, including nanoparticles decorated with epidermal growth factor,27 arginine-glycine-aspartic acid peptides,28 or an antibody against the transferrin receptor.29,30 In this study, dendrimers were modified by Gd to construct T1 relaxation-sensitive nanoprobes for MRI. Although minimally invasive, the imaging-guided percutaneous intratumoral gene delivery strategy efficiently targeted tumor tissue with an enhanced loaded gene transfection efficiency (Figure 6).
Our study confirms the advantage of an emerging concept of interventional molecular imaging, which employs imaging-guided percutaneous intratumoral or catheter-directed intra-arterial delivery of therapeutic nanoparticles to circumvent the toxicity and limitations of systemic delivery methods.10,31 Assessment of the distribution of our gene vector in vivo indicates that a percutaneous intratumoral delivery strategy can successfully deliver the loaded gene (pLuci), while limiting its expression to the target tumor tissue (Figure 3C). In contrast, conventional intravenous delivery of most nanoparticle platforms results in sequestration of nanoparticles in the organs of the reticuloendothelial system, leading to subtherapeutic dosing.32 At the same, in contrast with small molecular MR contrast medium (eg, Gd-DTPA), these dendrimer-based nanoparticles are a type of intracellular medium that makes it feasible to track therapeutic agents at the cellular level.33 In our study, these nanoparticles produced a relatively high signal intensity that washed out slowly when compared with Gd-DTPA (Figure 4).
With interventional intratumoral administration, the local agent concentration was obviously improved. However, the stromal compartment and extracellular matrix components in the tumor act as physical barriers that limit the spread of the vector within the tumor.25 To facilitate the diffusion and cellular uptake of the gene vector within the tumor stroma, CPPs were employed to decorate the nanocarrier (Gd-DPT) in this study. Consequently, high permeability in the tumor stroma was observed for Gd-DPT on real-time MR tracking (Figure 4) using an orthotopic nude mouse model of PDAC. In this model, we could detect much extracellular matrix distributed among the tumor cells, which is similar to the tumor microenvironment of human PDAC. Although our previous study showed that systemic application of CPPs in vivo can be challenging in that CPPs lack tumor specificity,34 sustained and well distributed transgene expression was detected in tumor cells when Gd-DPT was administered intratumorally.
Our study does have limitations. First, we did not test the delivery of a therapeutic gene. The RFP and luciferase plasmids were selected for the purposes of detection to monitor delivery in vivo as a proof of concept. Ultimately, we have demonstrated a free gene-loading and MR-visible gene vector with high permeability within the tumor microenvironment, which can be used for gene therapy. However, additional study is necessary to create personalized gene-targeted therapies for patients with PDAC.35 Second, with the fact that a part of Gd atoms in nanocarriers were isolated with water molecules (H2O) by the plasmid, the nanoparticles have a lower relaxivity rate compared with small molecular contrast medium, and the signal intensity in tumor parenchyma injected with nanoparticles was relatively lower than that of Gd-DTPA. However, further modification of Gd would limit the capacity for loaded gene.36
Conclusion
In this study, we developed a novel gene delivery strategy for PDAC using a combination of a plasmid free-loading gene delivery vector with high transfection efficiency and regional intratumoral delivery guided by MRI. This establishes the groundwork for development of personalized gene therapy in patients with PDAC.
Acknowledgments
The authors thank Min Chen PhD (Department of Chemistry, Fudan University) for the confocal luminescence microscopy work. This study was supported by the School of Pharmacy, Fudan University and the Open Project Program of Key Lab of Smart Drug Delivery (Fudan University), Ministry of Education, People’s Republic of China (SDD2013-07). The authors also thank the Important Innovative Program of Shanghai Municipal Commission of Health and Family Planning (201440017).
Disclosure
The authors reports no conflicts of interest in this work.
References
Siegel R, Naishadham D, Jemal A. Cancer statistics, 2013. CA Cancer J Clin. 2013;63(1):11–30. | ||
Jones S, Zhang X, Parsons DW, et al. Core signaling pathways in human pancreatic cancers revealed by global genomic analyses. Science. 2008;321(5897):1801–1806. | ||
Lunardi S, Muschel RJ, Brunner TB. The stromal compartments in pancreatic cancer: are there any therapeutic targets? Cancer Lett. 2014;343(2):147–155. | ||
Heinemann V, Reni M, Ychou M, Richel DJ, Macarulla T, Ducreux M. Tumour-stroma interactions in pancreatic ductal adenocarcinoma: rationale and current evidence for new therapeutic strategies. Cancer Treat Rev. 2014;40(1):118–128. | ||
Paulson AS, Tran Cao HS, Tempero MA, Lowy AM.Therapeutic advances in pancreatic cancer. Gastroenterology. 2013;144(6):1316–1326. | ||
Neesse A, Krug S, Gress TM, Tuveson DA, Michl P. Emerging concepts in pancreatic cancer medicine: targeting the tumor stroma. Onco Targets Ther. 2013;7:33–43. | ||
Vosburgh KG, Jolesz FA. The concept of image-guided therapy. Acad Radiol. 2003;10(2):176–179. | ||
Perumpail RB, Levitsky J, Wang Y, et al. MRI-guided biopsy to correlate tissue specimens with MR elastography stiffness readings in liver transplants. Acad Radiol. 2012;19(9):1121–1126. | ||
Silverman SG, Tuncali K, Morrison PR. MR Imaging-guided percutaneous tumor ablation. Acad Radiol. 2005;12(9):1100–1109. | ||
Monsky WL, Vien DS, Link DP. Nanotechnology development and utilization: a primer for diagnostic and interventional radiologists. Radiographics. 2011;31(5):1449–1462. | ||
Carrino JA, Jolesz FA. MRI-guided interventions. Acad Radiol. 2005;12(9):1063–1064. | ||
Mouli SK, Tyler P, McDevitt JL, et al. Image-guided local delivery strategies enhance therapeutic nanoparticle uptake in solid tumors. ACS Nano. 2013;7(9):7724–7733. | ||
Gao L, Xie L, Long X, et al. Efficacy of MRI visible iron oxide nanoparticles in delivering minicircle DNA into liver via intrabiliary infusion. Biomaterials. 2013;34(14):3688–3696. | ||
Heitz F, Morris MC, Divita G. Twenty years of cell-penetrating peptides: from molecular mechanisms to therapeutics. Br J Pharmacol. 2009;157(2):195–206. | ||
Zorko M, Langel U. Cell-penetrating peptides: mechanism and kinetics of cargo delivery. Adv Drug Deliv Rev. 2005;57(4):529–545. | ||
Patel LN, Zaro JL, Shen WC. Cell penetrating peptides: intracellular pathways and pharmaceutical perspectives. Pharm Res. 2007;24(11):1977–1992. | ||
Zhu X, Shan W, Zhang P, et al. Penetratin derivative-based nanocomplexes for enhanced intestinal insulin delivery. Mol Pharm. 2014;11(1):317–328. | ||
Sharma G, Modgil A, Zhong T, Sun C, Singh J. Influence of short-chain cell-penetrating peptides on transport of doxorubicin encapsulating receptor-targeted liposomes across brain endothelial barrier. Pharm Res. 2014;31(5):1194–1209. | ||
Sharma G, Modgil A, Layek B, Sun C, Singh J. Cell penetrating peptide tethered bi-ligand liposomes for delivery to brain in vivo: biodistribution and transfection. J Control Release. 2013;167(1):1–10. | ||
Do N, Weindl G, Grohmann L, et al. Cationic membrane-active peptides – anticancer and antifungal activity as well as penetration into human skin. Exp Dermatol. 2014;23(5):326–331. | ||
Desai PR, Cormier AR, Shah PP, Patlolla RR, Paravastu AK, Singh M. (31)P solid-state NMR based monitoring of permeation of cell penetrating peptides into skin. Eur J Pharm Biopharm. 2014;86(2):190–199. | ||
Wu L, Wang C, Yao X, et al. Application of 3.0 tesla magnetic resonance imaging for diagnosis in the orthotopic nude mouse model of pancreatic cancer. Exp Anim. 2014;63(4):403–413. | ||
Bruckman MA, Yu X, Steinmetz NF. Engineering Gd-loaded nanoparticles to enhance MRI sensitivity via T(1) shortening. Nanotechnology. 2013;24(46):462001. | ||
Dufès C, Uchegbu IF, Schätzlein AG. Dendrimers in gene delivery. Adv Drug Deliv Rev. 2005;57(15):2177–2202. | ||
Fillat C, Jose A, Bofill-Deros X, Mato-Berciano A, Maliandi MV, Sobrevals L. Pancreatic cancer gene therapy: from molecular targets to delivery systems. Cancers (Basel). 2011;3(1):368–395. | ||
Owens DE 3rd, Peppas NA. Opsonization, biodistribution, and pharmacokinetics of polymeric nanoparticles. Int J Pharm. 2006;307(1):93–102. | ||
Kudgus RA, Szabolcs A, Khan JA, et al. Inhibiting the growth of pancreatic adenocarcinoma in vitro and in vivo through targeted treatment with designer gold nanotherapeutics. PLoS One. 2013;8(3):e57522. | ||
Ji S, Xu J, Zhang B, et al. RGD-conjugated albumin nanoparticles as a novel delivery vehicle in pancreatic cancer therapy. Cancer Biol Ther. 2012;13(4):206–215. | ||
Camp ER, Wang C, Little EC, et al. Transferrin receptor targeting nanomedicine delivering wild-type p53 gene sensitizes pancreatic cancer to gemcitabine therapy. Cancer Gene Ther. 2013;20(4):222–228. | ||
Salvati A, Pitek AS, Monopoli MP, et al. Transferrin-functionalized nanoparticles lose their targeting capabilities when a biomolecule corona adsorbs on the surface. Nat Nanotechnol. 2013;8(2):137–143. | ||
Yang X. Interventional molecular imaging. Radiology. 2010;254(3):651–654. | ||
Brannon-Peppas L, Blanchette JO. Nanoparticle and targeted systems for cancer therapy. Adv Drug Deliv Rev. 2004;56(11):1649–1659. | ||
Cyran CC, Fu Y, Rogut V, et al. Evaluation of a novel macromolecular cascade-polymer contrast medium for dynamic contrast-enhanced MRI monitoring of antiangiogenic bevacizumab therapy in a human melanoma model. Acad Radiol. 2013;20(10):1256–1263. | ||
Huang S, Shao K, Liu Y, et al. Tumor-targeting and microenvironment-responsive smart nanoparticles for combination therapy of antiangiogenesis and apoptosis. ACS Nano. 2013;7(3):2860–2871. | ||
Lili LN, Matyunina LV, Walker LD, Daneker GW, McDonald JF. Evidence for the importance of personalized molecular profiling in pancreatic cancer. Pancreas. 2014;43(2):198–211. | ||
Mintzer MA, Simanek EE. Nonviral vectors for gene delivery. Chem Rev. 2009;109(2):259–302. |
Supplementary materials
Materials
Dendrigraft poly-L-lysine (DGL) G3 dendrimers with 123 lysine groups were purchased from Colcom (Clapiers, France). R-malemidyl-ω-N-hydroxysuccinimidyl polyethylene glycol (MAL-(PEG)4-NHS) was purchased from Thermo Fisher Scientific (Rockford, IL, USA). Cell-penetrating peptides (TAT: PGRKKRRQRRPPQCys) were synthesized by the Chinese Peptide Company (Hangzhou, People’s Republic of China). The 2-(4-isothiocyanatobenzyl)-diethylenetriaminepentaacetic acid (p-SCN-Bn-DTPA) was obtained from Macrocyclics (Dallas, TX, USA). The red fluorescence protein and luciferase plasmids were provided by Hanheng Biology (Shanghai, People’s Republic of China). Unless specified otherwise, all other chemicals were purchased from Sigma-Aldrich (St Louis, MO, USA) and were used without further purification.
Nanocarrier synthesis
DGL was reacted with PEG at a ratio of 1:4 (mol/mol) in phosphate-buffered saline (PBS; pH 8.0) for 2 hours at room temperature. The resulting conjugate, DGL-PEG (DP), was purified by ultrafiltration through a membrane (cutoff 5 kDa) and dissolved in PBS (pH 7.0). DP was reacted with TAT at a ratio of 1:2 (DGL to peptide, mol/mol) in PBS (pH 7.0) for 24 hours at room temperature. The MAL groups of PEG were specifically reacted with the thiol groups of TAT. The resulting DGL-PEG-TAT (DPT) conjugate was purified by ultrafiltration and dissolved in PBS (pH 9.0). Next, DP and DPT were reacted with p-SCN-Bn-DTPA, 1:10 (mol/mol), in PBS (pH 9.0) for 48 hours at room temperature. The resulting conjugate was also purified by ultrafiltration and dissolved in 0.1 M acetic acid buffer (pH 6.0). The dendritic chelator was then complexed with a 50% molar excess of GdCl3·6H2O in acetic acid buffer (pH 6.0) for 24 hours at 4°C. Finally, Gd-DTPA-DGL-PEG-TAT (Gd-DPT) and Gd-DTPA-DGL-PEG (Gd-DP) were purified by ultrafiltration and dissolved in 0.01 M PBS (pH 7.4).
Nanoparticle preparation
The nanocarriers were loaded with the DNA plasmid to form the nanoparticles. A DNA solution (400 μg DNA/mL in 50 mM sodium sulfate solution) was added to the nanocarrier solution (800 μg DGL/mL in Hank’s) and immediately vortexed for 30 seconds at room temperature (DGL:DNA =6:1, mg/mg). For the controls, Gd-DTPA (Magnevist, Schering, Germany) solution (3×10⁻⁵ μmol/μL in normal saline) was complexed with the above plasmid (DGL:DNA =3:1, v/v). Red fluorescence protein and luciferase plasmids were used in this study.
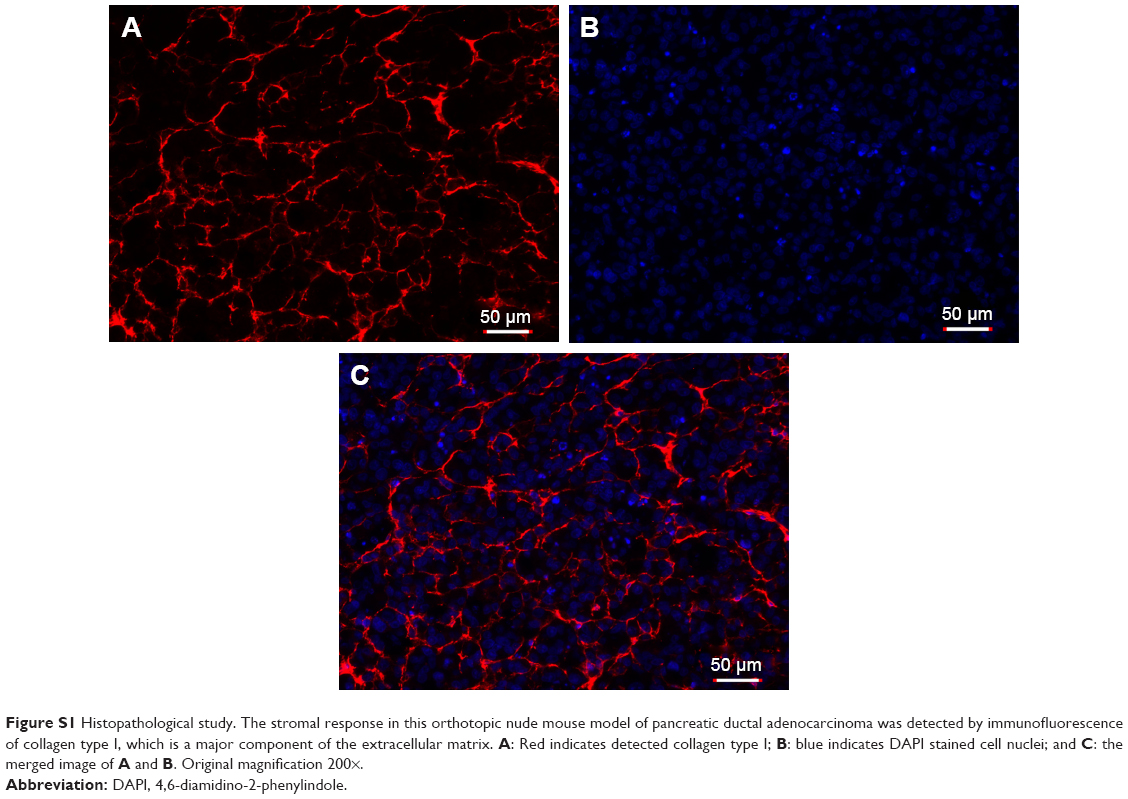 | Figure S1 Histopathological study. The stromal response in this orthotopic nude mouse model of pancreatic ductal adenocarcinoma was detected by immunofluorescence of collagen type I, which is a major component of the extracellular matrix. A: Red indicates detected collagen type I; B: blue indicates DAPI stained cell nuclei; and C: the merged image of A and B. Original magnification 200×. |
Characterization of nanocarriers and nanoparticles
The characteristics of DTPA-DGL-PEG-TAT were analyzed by nuclear magnetic resonance spectroscopy. The conjugate was dissolved in D2O and analyzed in a 600 MHz spectrometer (Varian, Palo Alto, CA, USA). The mean diameter of the nanoparticles was determined by a Zetasizer Nano (Malvern Instruments Ltd, Malvern, UK). For transmission electron microscopy, 0.05 mL of the nanoparticles was examined under an electron microscope (H-600, Hitachi, Tokyo, Japan). The longitudinal relaxation time measurements were performed using a clinical 3.0 T magnetic resonance scanner system (GE Healthcare, Milwaukee, WI, USA). The longitudinal relaxivity rate (r1) of water protons was determined by fitting of the plot of R1, where R1=1/T1, as a function of [Gd3+] using a linear function.1
Cell culture
MIA PaCa-2 cell lines were expanded and maintained in Dulbecco’s Modified Eagle’s Medium supplemented with 20% heat-inactivated fetal calf serum, 2 mmol/L L-glutamine, 20 mg/mL heparin, 40 mU/mL insulin, 100 U/mL penicillin, and 100 mg/mL streptomycin, and cultured at 37°C in a humidified atmosphere containing 5% CO2.
Reference
Caravan P, Farrar CT, Frullano L, Uppal R. Influence of molecular parameters and increasing magnetic field strength on relaxivity of gadolinium- and manganese-based T1 contrast agents. Contrast Media Mol Imaging. 2009;4:89–100. |
 © 2015 The Author(s). This work is published and licensed by Dove Medical Press Limited. The
full terms of this license are available at https://www.dovepress.com/terms
and incorporate the Creative Commons Attribution
- Non Commercial (unported, 3.0) License.
By accessing the work you hereby accept the Terms. Non-commercial uses of the work are permitted
without any further permission from Dove Medical Press Limited, provided the work is properly
attributed. For permission for commercial use of this work, please see paragraphs 4.2 and 5 of our Terms.
© 2015 The Author(s). This work is published and licensed by Dove Medical Press Limited. The
full terms of this license are available at https://www.dovepress.com/terms
and incorporate the Creative Commons Attribution
- Non Commercial (unported, 3.0) License.
By accessing the work you hereby accept the Terms. Non-commercial uses of the work are permitted
without any further permission from Dove Medical Press Limited, provided the work is properly
attributed. For permission for commercial use of this work, please see paragraphs 4.2 and 5 of our Terms.