Back to Journals » Clinical Ophthalmology » Volume 17
Macular Vascularity and Ganglion Cell Complex Parameters in the Young Adults with Myopia and Progressive Myopia
Authors Małyszczak A ![]() , Żyto M
, Żyto M ![]() , Przeździecka-Dołyk J
, Przeździecka-Dołyk J ![]() , Misiuk-Hojło M
, Misiuk-Hojło M ![]()
Received 19 September 2022
Accepted for publication 6 December 2022
Published 11 February 2023 Volume 2023:17 Pages 561—570
DOI https://doi.org/10.2147/OPTH.S389963
Checked for plagiarism Yes
Review by Single anonymous peer review
Peer reviewer comments 2
Editor who approved publication: Dr Scott Fraser
Artur Małyszczak,1 Magdalena Żyto,2 Joanna Przeździecka-Dołyk,2 Marta Misiuk-Hojło1
1Department and Clinic of Ophthalmology, Wroclaw Medical University, Wroclaw, Dolnoslaskie, Poland; 2Department of Optics and Photonics, Wroclaw University of Science and Technology, Wroclaw, Dolnoslaskie, Poland
Correspondence: Artur Małyszczak, Department and Clinic of Ophthalmology, Wroclaw Medical University, Borowska 213 50-556, Wroclaw, Dolnoslaskie, Poland, Email [email protected]
Purpose: The purpose of this study is to determine the relationships between foveal avascular zone (FAZ), foveal vascular density (FD) and GCC (ganglion cell complex) parameters in a healthy myopic population using optical coherence tomography angiography (angio-OCT).
Patients and Methods: Three hundred and eighty-one eyes of 381 healthy participants were included into this study and assigned to three groups according to their spherical equivalent (SE) values and an additional progressive myopia group. One randomly chosen eye from each patient was analyzed. GCC mean thickness, focal loss of volume (FLV), global loss of volume (GLV), FAZ area, FAZ perimeter, and FD parameters were obtained with the RTVue AngioOCT device.
Results: FAZ area and its perimeter were strongly correlated with the belonging spherical equivalent group (p = 0.0001, p = 0.0008 accordingly), being the largest in progressive myopia subgroup (mean size 0.42mm2). Other factors that were significantly higher in myopic eyes were FLV (p = 0.0023), GLV (p = 0.0020). There were no differences in FD between groups. In the myopic and progressive myopia groups, there was a significant relationship between FAZ area and FLV, GLV, and GCC thickness. We found that in myopic eyes with AXL exceeding 26.6 mm, FAZ becomes negatively correlated to mean GCC thickness.
Conclusion: In myopia, compared to non-myopic groups, there is a greater loss of neural tissue represented by a thinner GCC layer, greater FLV and GLV parameters, and worse blood supply represented by a larger FAZ area. Eye axial length of 26.6 mm is a breaking point, where the negative FAZ area to GCC thickness relationship curve is getting significantly steeper.
Keywords: GCC, FAZ, optical coherence tomography angiography, OCTA
Introduction
Myopia is the most common ocular disorder, and its complications can lead to vision loss and blindness, with myopic macular degeneration (MM) being the leading cause.1 The number of people affected grows, and it is especially high in Asian countries. In China, the prevalence of myopia in children reaches 78.4% in 15-year-olds.2 A meta-analysis from 2018 showed that the prevalence of myopia in adults was 26.5%, with Myanmar having the highest prevalence (51.0%), and India the lowest (4.4%).3
Myopia usually starts in childhood, research suggest that it may be caused by genetic and environmental factors.4 Despite the fact that myopia is usually thought to progress mainly during childhood and stabilize in teenage years, researchers suggest that it still can progress in early adulthood, even to later age. Lee et al analyzed myopia progression in the third decade of life. They found that in almost 40% of the studied population, myopia still progressed, by −0.5 diopters or more.5 Other findings agree with this statement, indicating that myopia can progress or even be initiated by intensive near-work in young adults. In a 3 year observation period on engineering students with the mean age of 20.6 years, the mean refractive change was −0.51±0.49 diopters.6 The time spent on near-work seems to play a significant role in that process.
As the myopia seems to progress even after childhood, its complications also become more common with age, with MM being one of the most significant.7 In a study of the European population, MM was present in 10.3% of high myopia participants, with the prevalence in the whole studied population being 0.5%.8 A study of a Chinese population found that in nearly 15% of people with high myopia, MM progressed within 2 years.9 In a longer 10-year observational study on the elderly population, MM in HM eyes progressed in 35.5% of participants.10
Angio-OCT is a widely used, non-invasive method to assess retinal and choroidal vessels as well as retinal nerve tissue of the macular area. Parameters describing macular vascularization such as foveal avascular zone (FAZ) or foveolar vascular density (FD) can be visualized with this type of device, and they have been proven to be altered in myopic AL elongation.11 Another useful feature of this type of device is the ability to measure ganglion cell complex (GCC) thickness. Available data suggests that myopia, especially high myopia, is correlated with neural and vascular defects such as GCC thinning and lower vessel densities in superficial and deep plexuses.12,13 Worse blood supply to the macular region and thinner GCC are related to myopic fundus.
Retinal disorders encountered in myopia are also important because retinal nerve tissue defects are fundamental to the pathophysiology of glaucoma, and myopic patients have an increased risk of developing open-angle glaucoma.14,15 Diagnosing glaucoma in myopic patients can pose a challenge, because both diseases cause retinal neural thinning and optic nerve head changes, such as disc tilt and torsion.16 Wang et al showed that in high myopia, GCC has higher diagnostic power than peripapillary RNFL thickness in differentiating glaucoma and non-glaucoma patients. Both parameters were negatively correlated with axial length.17
However, available data regarding healthy adults with progressive myopia are limited. Most researchers focus on high or pathologic myopia or patients with already developed complications.
The aim of this study is to determine the macular neural and vascular relationships in patients with myopia, particularly the progressive variant. The secondary aim is to find a cut-off point where these relationships in a healthy population may initiate retinal changes leading to myopic complications. Although these relationships have previously been studied in myopic patients, data defining these parameters in healthy adults with progressive myopia is lacking. This is important because this particular group is particularly vulnerable to both myopia complications and glaucomatous changes.
Materials and Methods
This retrospective study included patients from the Department of Ophthalmology of the Medical University in Wroclaw. Data were obtained from the database of the RTVue AngioOCT, Humphrey Perimeter and HS Lenstar biometer between September 2016 and April 2022. Participants’ data were confronted with their visual field and medical data to rule out all of the concomitant conditions. Only patients with available data from both eyes were taken into our study. Inclusion criteria were as follows: age over 18 years old, known refractive status, good quality of retinal images, good quality of biometry and angio-OCT images. Exclusion criteria: aberrant appearance of the superficial or deep retinal plexus, history of ophthalmological or systemic diseases (medical reasons for exclusion are listed in STable 1). Patients were grouped according to their refractive error in the form of spherical equivalent (SE). Emmetropic group (EG) was defined by ± 0.5 SE dioptres, hyperopic >+0.5 SE dioptres (HG), myopic group <-0,5 SE dioptres (MG). The last group was subdivided into the progressive myopia subgroup (MGprogr) consisted of patients with SE <-0.5 dioptres and axial length increase >0.1 mm per year for the minimum of 1.5 years (AXL data were available for all of the patients, confronted either by medical history record of described progression or directly by AXL measurement) and non-progressive myopia subgroup (MGnon-progr) – see Table 1.
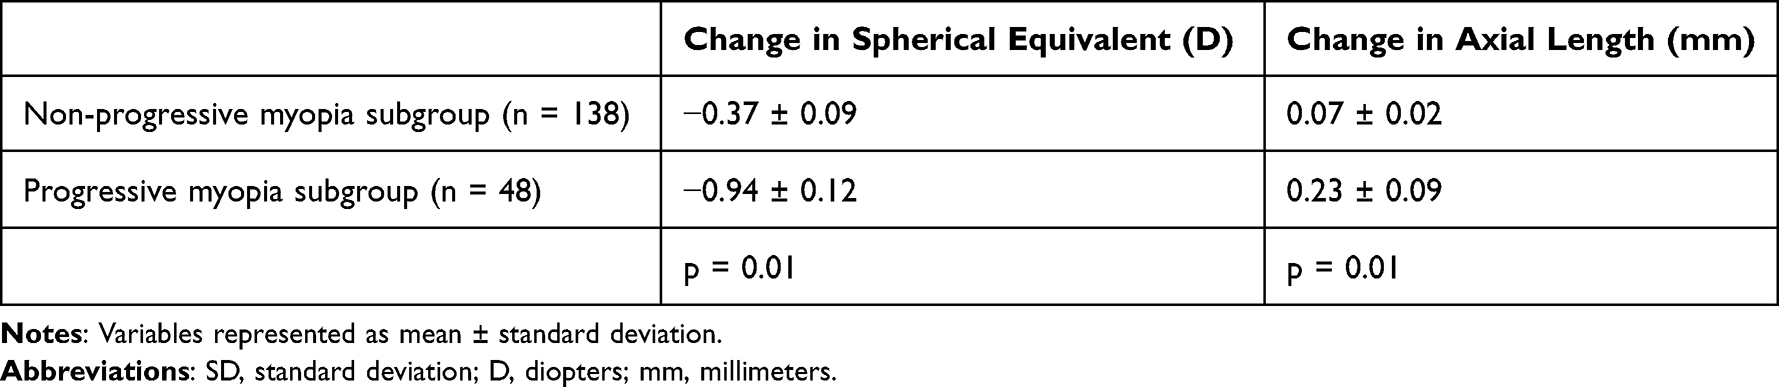 |
Table 1 Spherical Equivalent and Axial Length Increase per Year Observation Period in Myopia Group |
The study was conducted on patients who were over 18 years old, in good general health and had transparent ocular media. The study used a spectral domain optical coherence tomography (SD-OCT) instrument, the RTVue XR Avanti (Optovue, Inc., Fremont, CA), with a split-spectrum amplitude decorrelation angiography (SSADA) algorithm and a diode laser emitting 840 ± 10 nm light. OCT retinal nerve fiber layer (RNFL), optic nerve head (ONH), Ganglion Cell Complex (GCC), including FLV (focal loss volume), GLV (global loss volume) and AngioVueHD macular angio-OCT (6x6 mm scan – 400×400 line-A scans) examinations were performed on all subjects. The subfoveal avascular zone in the combined superficial and deep capillary plexuses was then measured in OCTA scans using commercial software available from RTVue XR Avanti. All of the measured parameters are listed in Tables 2–4 and STable 2. There were no breaks between each examination and each eye, they were performed on a single day. All patients were examined under the same room lighting conditions, by the same staff member and during the same duration of the day, in the morning. Statistical analyses were conducted using the MedCalc statistical software version 17.9.7 (MedCalc Software bvba, Ostend, Belgium; http://www.medcalc.org; 2017) and Statistica Software version 13.3 (TIBCO Statistica 1984–2017 TIBCO Software Inc.) licensed by the University of Science and Technology in Wroclaw and Wroclaw Medical University, respectively. The Shapiro–Wilk test was used to check the normality of the sample distribution. The F-test for equal variances was used to check the variance homogeneity. Intergroup comparisons were performed using the Mann–Whitney U-test for continuous variables and the Chi-square test for categorical variables. Correlations were examined with the Spearman rank correlation test. Regression analysis was used to determine factors associated with GCC thickness and FAZ area within the groups and in the whole population. Additionally, the non-linear regression model was used to determine the impact of the AXL on the GCC, FAZ, and vascularity measurements. Differences were considered statistically significant at p < 0.05. All data is expressed as mean±standard deviations, where applicable depending on whether or not normal distribution was achieved.
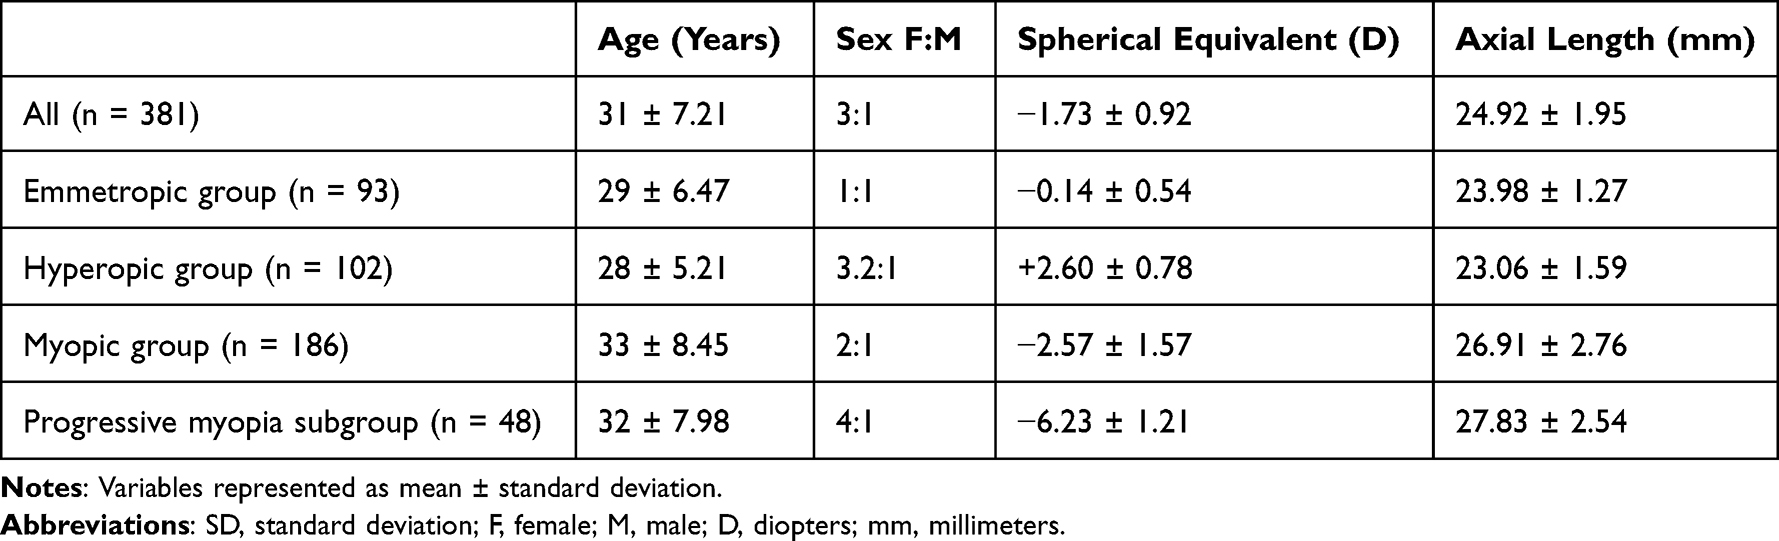 |
Table 2 Clinical Characteristics of the Studied Population |
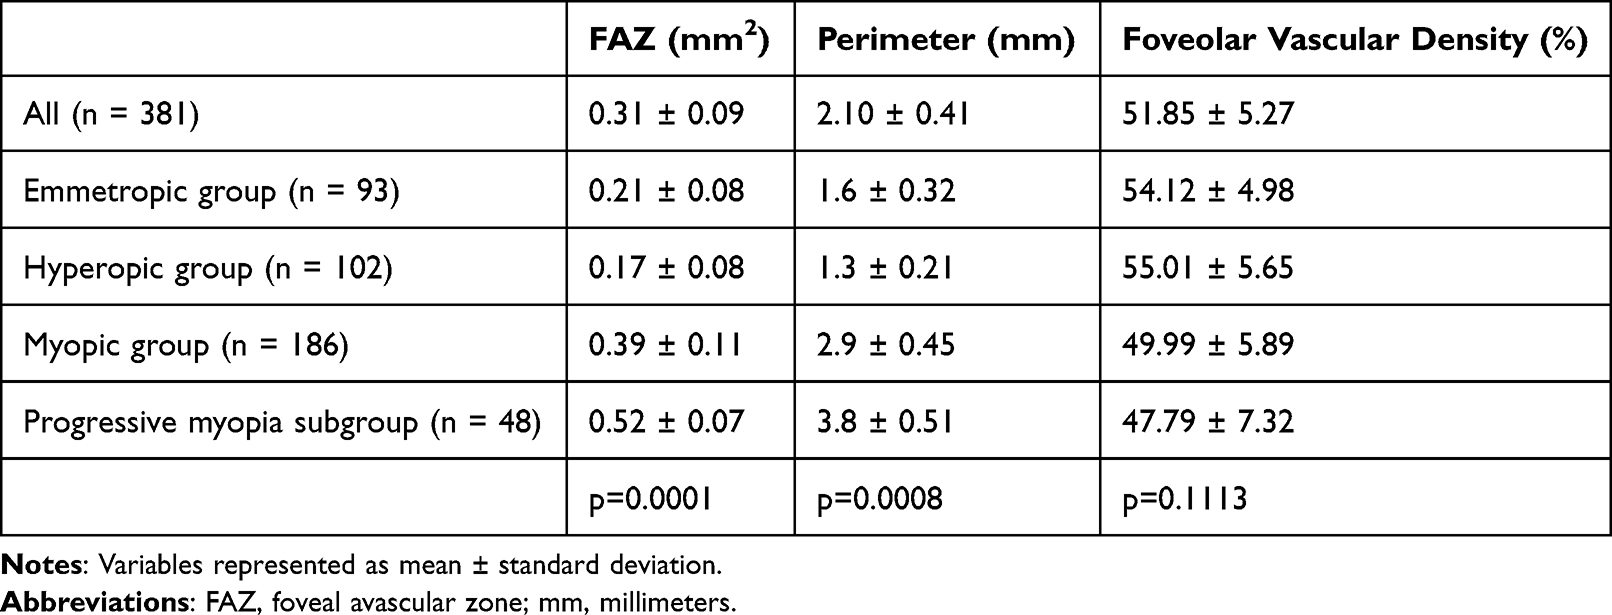 |
Table 3 Summary Statistics of the Vascular Network in the Macular Region |
 |
Table 4 Summary of the Ganglion Cells’ Parameters Divided by the Spherical Equivalent Groups |
Results
Clinical Characteristics
Initial 2056 participants’ data were confronted with their visual field and medical data to rule out all of the patients with concomitant conditions that did not meet the inclusion criteria. This procedure confirmed that 381 healthy participants (762 eyes) were included in this study but we analysed only one eye from each participant (randomly chosen).
The mean age of the study group was 31 years. Most were females (F:M ratio 3:1). Participants were divided into 4 groups according to their spherical equivalent based on refraction (Table 2). The mean SE in all of the studied populations was −1.73 D. The mean SE in the emmetropic group was −0.14 D, +2.6 D in the hyperopic group, −2.57 D in the myopic group, and −6.23 D in the progressive myopia group.
The FAZ area was significantly larger in the myopic groups (0.39 mm3 and 0.52 mm3 for the myopic and progressive myopia groups), than in the other groups (0.21 mm3 for emmetropes and 0.17 mm3 for hyperopic group) (Table 3). This was also true for the FAZ perimeter. Both the area and perimeter of the FAZ were largest in the group with progressive myopia and smallest in the hyperopic group. Foveal vascular density, on the other hand, was lowest in the group with progressive myopia and highest in the hyperopic group, but this was not a statistically significant relationship (p = 0.0113).
The loss of ganglion cells was significantly greater in the myopic groups (Table 4). This was particularly marked in the progressive myopia group (FLV 2.24% and GLV 4.01% vs 0.44% and 0.53% in emmetropic group). The average GCC thickness was smallest in the progressive myopia group (81.76um) and largest in the hyperopic group (98.01 um). Optic nerve disc parameters did not differ significantly between groups (STable 2).
Relationship Between Vascular and Neural Parameters in Refraction Groups
In the whole studied population, FAZ area and its perimeter were negatively correlated with the GCC thickness parameters, and positively with FLV and GLV. In the myopic groups (myopic and progressive myopia populations) these relations were even stronger (Table 5). Interestingly, the progressive myopia subgroup expressed less linear correlation than the myopia group, but this changed significantly towards an even stronger correlation when the inverse exponential correlation pattern was introduced (p < 0.0001). FAZ parameters were also negatively correlated with RNFL thickness in every refraction group (STable 3).
 |
Table 5 The Changes in the Linear Correlation (the r Parameter) Between Ganglion Cell Complex Parameters and Vascular Parameters in Macular Region |
Additional analysis revealed a stronger linear correlation of the ganglion cell parameters as well as vascular parameters of the macular region to the axial length (AXL), than to the refractive error (spherical equivalent), p < 0.001 in each comparison of the myopia group as well as the progressive myopia subgroup. The strongest linear correlation was found in the progressive myopia subgroup between GLV and AXL (r = 0.79, Table 6).
 |
Table 6 Linear Correlations Between Axial Length Measurements and Macular Parameters Including Vascular Macular Parameters |
In our further analysis, we found a difference in the distribution of GCC thickness compared with FAZ area in the myopia group compared to the rest of the participants. The correlation of both parameters was fitted with a polynomial quadratic fit (see Figure 1). The significant difference (p < 0.001) in both curves occurred when AXL exceeded 26.6 mm (evaluated with the advanced stepwise model builder, p < 0.001).
 |
Figure 1 Scatterplot of average ganglion cell complex thickness (GCC) against foveal avascular zone area (FAZ). All participants were divided into the myopia group all others were assigned to common group labelled as others. Both distributions were fitted with polynomial quadratic fit. |
Discussion
Foveal Avascular Zone
The foveal avascular zone (FAZ) is an area corresponding to the macular center and therefore the fixation point. It is a capillary-free area located in the highly metabolically active central retina.18 FAZ area is widely used as a parameter to describe macular capillaries, mainly in ischemic diseases such as different phases of diabetic retinopathy and in retinal vein occlusion. Bigger FAZ area is associated with ischemic processes.19–22 Other studies indicate that it may also be altered in glaucomatous neuropathy, as the vascular background is suspected.23
In our study, the mean FAZ size was 0.31 mm2 which consisted with previous studies on healthy adults where measurements were made on the same type of device.24,25 It is worth mentioning that FAZ size may differ significantly between devices, so it is important to compare the results obtained on the same type of device, if want to be precise.26 In our study, we found a significant correlation between FAZ parameters and refractive error. The FAZ size and its perimeter were the smallest in the hyperopic subgroup and the biggest in the progressive myopia subgroup. Our findings agree with previous studies that have shown a significant correlation between FAZ and SE, AXL.11,27 However, other authors report that FAZ size has not been affected by AXL or refractive errors, so this matter remains unresolved.27,28 Larger FAZ may be an indicator of poorer blood supply to the macula, but on the other hand, its size also depends on patients age, sex, and foveal morphology.29,30
However, we did not find a relationship between foveal vessel density and refractive group. In myopic groups, FD was smaller but the relation was not statistically significant. Our results are in contrast with previous studies. It has been reported that in high myopia, superficial vessel density is reduced.11,27,31 Foveal vessel densities were also reduced in other diseases affecting retinal ganglion cells. Choi et al reported that macular vascular density is decreased in eyes with open angle glaucoma, compared with healthy eyes.32 Takusagawa et al found that, in glaucoma, superficial macular vessel density is especially affected, as it supplies retinal ganglion cells, which are especially vulnerable to glaucomatous damage.33 Reduced vascular density was also observed in diabetic retinopathy.34 Our studied population was healthy, which could help to explain the lack of association between these values. Also, 38.4% of our myopic participants had predominantly refractive myopia, so the retinal stretching may have been less marked than in the studies cited. Another difference is that the mentioned studies with healthy participants considered Asian populations or used different angio-OCT devices (our population was Caucasian). It has been reported that there are differences in FD between Asian and Caucasian populations and that comparisons between different angio-OCT devices in terms of FAZ or FD may not be interchangeable.26,35
GCC Parameters and Refraction, Axial Length
GCC describes the thickness of retinal nerve tissue, RNFL and GC-IPL (ganglion cell-inner plexiform layer) combined. It also provides two additional parameters: FLV and GLV. FLV represents a focal decrease in the thickness of retinal nerve tissue, a percentage of significant GCC loss, and GLV compares decreased GCC volume within the scanned area with an age-matched normative database.36 GCC parameters are used in diagnosing glaucoma. Zhang et al showed that in glaucoma suspects and pre-perimetric glaucoma patients, FLV was a strong parameter to predict the development of visual field defects.37 They suggest that FLV is a more reliable glaucoma indicator, because focal damage could be unlikely without a disease where global thinning (GLV) may be due to myopia or normal population variation.
In our healthy studied population, FLV and GLV values were significantly higher among subjects with myopia, and the highest in progressive myopia, as GCC thickness lowered. Sezgin Akcay et al studied these values in three groups: mild, moderate, and advanced myopia. The nerve defects represented by higher GLV, FLV and thinner GCC were greater in the groups with more severe myopia.12 However, only myopic patients were analyzed in their study, and we compared myopia to non-myopic eyes as well.
A 2021 systematic review analyzing 12,223 eyes found significantly lower GCC thickness in subjects with high and moderate myopia, compared to controls.38 There were not enough studies reporting GCC relations with low myopic patients, so the authors did not carry out an analysis for this group. The tendency for GCC to get thinner as the eyeball becomes stretched is consistent with our results. Our findings confirm these relationships in a relatively young population, with the mean age being 31 years old, and in the eyes without myopic complications. The authors of the review could not precisely specify the age of the participants.
Foveal Vascular Density and GCC Parameters
FD was negatively correlated with GCC thickness in both myopic groups, but not in the overall population. In normal tension glaucoma, Cheng et al found a relationship between perifoveal vessel density and GCC, but not FAZ.39 A similar association was also reported in intermediate age-related macular degeneration (AMD) and healthy controls.40 As mentioned before, retinal ganglion cells are supplied by the superficial vascular plexus, which could explain the smaller GCC thickness in eyes with less vascular density.
The relationship between axial eyeball length and all vascularization and GCC parameters, was statistically significant only in groups with myopia. As AXL increased, FAZ area increased, FD and GCC decreased, and the rates of ganglion cell loss represented by FLV and GLV increased. Axial elongation of an eyeball causes stretching and thinning of retinal tissues, which results in decreased retinal blood flow. The cause of this process is unclear. It may be because thinner structures have reduced metabolic demand, or worse blood supply by elongated and narrower vessels causes secondary thinning of the tissues.27,41,42 Thinning is especially seen in the outer eye segment. When the sclera becomes thin, it loses its tissue and expands, forming posterior staphyloma.43 This process can be observed in other eyeball layers. Choroidal thinning and stretching can also be seen, and it has been identified as a risk factor for choroidal neovascularization (CNV).44,45 In fact, it was reported that, in patients younger than 50 years of age, high myopia is a leading cause of CNV.46 In the population we studied, there were no eyes with complications of myopia. It is possible, however, that in the absence of action, further increase in myopia and AXL, and aging of the group, these complications could arise and significantly impair patients’ vision.
The Effect of Progressive Myopia on Vascular and Neural Parameters
The group with progressive myopia was both the group with the smallest spherical equivalent SE (−6.23 D vs –2.57 in non-progressive myopia) and the largest mean AXL (27.83 mm vs 26.91 mm in non-progressive myopia). This was reflected in the smallest neural (GCC, FLV, GLV) and vascular (FZ, FD) parameters compared to the other groups. Therefore, we were unable to determine the effect of myopia progression alone on the described relationships. It is likely that the effect of greater ocular stretch in this group due to greater SE and AXL overlapped with the fact of myopia progression.
Relations Between GCC Parameters and FAZ Area
GCC consists of three layers: the ganglion cell layer (GCL), the inner plexiform layer (IPL), and the retinal nerve fiber layer (RNFL). These layers contain ganglion cell bodies, their axons and dendrites, structures especially affected by glaucoma.36 When RNFL is removed, the remaining layers form the Ganglion Cell–Inner Plexiform Layer, as mentioned above.
In our study, we also examined changes in the relationship between FAZ and GCC relative to refraction groups. The FAZ area was dependent on all measured GCC parameters, but only in the myopia and progressive myopia groups, not in the entire studied population.
There are not many studies regarding FAZ and GCC relations. Macular vascular and neural parameters are of special interest in glaucoma, as GCC is severely decreased in the course of the disease.47 In a 2016 study, the authors reported that in glaucoma with central visual field defects, FAZ area was negatively correlated to the ganglion cell-inner plexiform layer (GCIPL) thickness.48 Similar observations have been made in diabetic retinopathy, where the FAZ area was also negatively correlated to macular GCIPL.49 There are limited number of data concerning GCC and FAZ in myopia group. In our study, we were among the first to examine the above relationships in healthy myopic eyes.
In additional analysis, we found that in myopic eyes, AXL of 26.6 mm is the breaking point, after which GCC decreases significantly faster with an increase in FAZ area compared to emmetropic and hyperopic eyes. This finding may be particularly important, as it may indicate the length of the eyeball above which there is a greater risk of vascular and neovascular complications of myopia. With an axial length greater than 26.6 mm, worse blood supply represented by a bigger FAZ area causes more significant GCC loss. Hashimoto et al calculated the AXL cutoff levels for the detection of myopic maculopathy in a Japanese population over 40 years old. Their calculated AXL value was even smaller than ours, at 25.3 mm in women and 25.9 mm in men.50 It may come from the fact that our studied population was significantly younger, with a mean age of 31 years compared to 63 years. GCC tends to get thinner with age, as well as myopic complications become more frequent.39 Our finding suggests that patients with AXL of over 26.6 might be especially in danger of future myopic changes and need additional ophthalmic screening.
Since axial elongation of the eyeball is a risk factor for retinal complications, methods to inhibit its growth are being developed. Currently, the main methods used include the use of atropine or cyclopentolate eye drops, pirenzepine gel, increasing the time spent outdoors, multifocal spectacle lenses, dual-focus and multifocus contact lenses, and orthokeratology.51 Unfortunately, there is a lack of data on the use of these agents in adults.52 Based on our study, we emphasize the need to prevent myopia progression before the eyeball length reaches 26.6 mm. Although at this stage changes may not already be symptomatic, the neural and vascular structures of the retina begin to indicate a greater risk of complications.
Limitations
Our study has several limitations. First, it was not a gender-balanced group, the majority of the study population was female. Second, the angio-OCT results were taken directly from the device, and were not recalculated taking into account the magnification effect.
There were differences in the observation time between participants, all of them were observed for at least 1.5 years but some were observed even longer – an observational study including myopia control techniques is necessary to evaluate the changes during a longer observational period.
Conclusion
In our study, we showed how the parameters of macular vascularization and innervation differ between refractive groups and how they relate to the length of the eyeball. Myopic eyeballs have a significantly impaired vascularization parameter, represented by a bigger FAZ area, compared to non-myopic groups. However, this is not reflected in the density of vessels in the foveal area. In myopia, we also note a greater loss of neural tissue represented by a thinner GCC layer and greater FLV and GLV parameters. We are among the first to analyze FAZ to GCC relation in myopic patients. The highlight of the work is finding the point in the eyeball length, 26.6 mm, where the deteriorated blood supply represented by the larger FAZ area begins to negatively correlate with the GCC thickness. The findings of this study underline the importance of reducing myopia progression even in adult population. Patients with AXL of 26.6 mm and greater length are at particular risk for future myopia complications. They should receive special ophthalmological care, and methods to inhibit eyeball growth should be considered.
Acknowledgments
The study was conducted according to the guidelines of the Declaration of Helsinki, and approved by the Institutional Review Board (or Ethics Committee) of Wroclaw Medical University. Informed consent was obtained from all subjects involved in the study. This study was part of a larger research project “Choroidal Thickness Change in Response to Physiological and Refractive Changes”, registered on ClinicalTrials.gov, Identifier: NCT03906279. Publication fees were paid from statutory activity fund for authors obtained by Joanna Przeździecka-Dołyk.
Disclosure
The authors report no conflicts of interest in this work.
References
1. Holden B, Sankaridurg P, Smith E, Aller T, Jong M, He M. Myopia, an underrated global challenge to vision: where the current data takes us on myopia control. Eye Lond Engl. 2014;28(2):142–146.
2. Xiang F, He M, Morgan IG. The impact of parental myopia on myopia in Chinese children. Optom Vis Sci. 2012;89(10):1487–1496. doi:10.1097/OPX.0b013e31826912e0
3. Hashemi H, Fotouhi A, Yekta A, Pakzad R, Ostadimoghaddam H, Khabazkhoob M. Global and regional estimates of prevalence of refractive errors: systematic review and meta-analysis. J Curr Ophthalmol. 2018;30(1):3–22. doi:10.1016/j.joco.2017.08.009
4. Cooper J, Tkatchenko AV. A review of current concepts of the etiology and treatment of myopia. Eye Contact Lens. 2018;44(4):231–247. doi:10.1097/ICL.0000000000000499
5. Lee SSY, Lingham G, Sanfilippo PG, et al. Incidence and progression of myopia in early adulthood. JAMA Ophthalmol. 2022;140(2):162–169. doi:10.1001/jamaophthalmol.2021.5067
6. Kinge B, Midelfart A, Jacobsen G, Rystad J. The influence of near-work on development of myopia among university students. A three-year longitudinal study among engineering students in Norway. Acta Ophthalmol Scand. 2000;78(1):26–29. doi:10.1034/j.1600-0420.2000.078001026.x
7. Verkicharla PK, Ohno-Matsui K, Saw SM. Current and predicted demographics of high myopia and an update of its associated pathological changes. Ophthalmic Physiol Opt J Br Coll Ophthalmic Opt Optom. 2015;35(5):465–475. doi:10.1111/opo.12238
8. Hopf S, Korb C, Nickels S, et al. Prevalence of myopic maculopathy in the German population: results from the Gutenberg health study. Br J Ophthalmol. 2020;104(9):1254–1259. doi:10.1136/bjophthalmol-2019-315255
9. Li Z, Liu R, Xiao O, et al. Progression of myopic maculopathy in highly myopic Chinese eyes. Invest Ophthalmol Vis Sci. 2019;60(4):1096–1104. doi:10.1167/iovs.18-25800
10. Yan YN, Wang YX, Yang Y, et al. Ten-Year progression of myopic maculopathy: the Beijing eye study 2001-2011. Ophthalmology. 2018;125(8):1253–1263. doi:10.1016/j.ophtha.2018.01.035
11. Cheng D, Chen Q, Wu Y, et al. Deep perifoveal vessel density as an indicator of capillary loss in high myopia. Eye Lond Engl. 2019;33(12):1961–1968.
12. Akcay BIS, Gunay BO, Kardes E, Unlu C, Ergin A. Evaluation of the ganglion cell complex and retinal nerve fiber layer in low, moderate, and high myopia: a study by rtvue spectral domain optical coherence tomography. Semin Ophthalmol. 2017;32(6):682–688. doi:10.3109/08820538.2016.1170157
13. Yaprak AC, Yaprak L. Retinal microvasculature and optic disc alterations in non-pathological high myopia with optical coherence tomography angiography. Graefes Arch Clin Exp Ophthalmol Albrecht Von Graefes Arch Klin Exp Ophthalmol. 2021;259(11):3221–3227. doi:10.1007/s00417-021-05216-x
14. Marcus MW, Vries MM, Montolio FGJ, Jansonius NM. Myopia as a risk factor for open-angle glaucoma: a systematic review and meta-analysis. Ophthalmology. 2011;118(10):1989–1994.e2. doi:10.1016/j.ophtha.2011.03.012
15. Kansal V, Armstrong JJ, Pintwala R, Hutnik C. Optical coherence tomography for glaucoma diagnosis: an evidence based meta-analysis. PLoS One. 2018;13(1):e0190621. doi:10.1371/journal.pone.0190621
16. Tan NYQ, Sng CCA, Jonas JB, Wong TY, Jansonius NM, Ang M. Glaucoma in myopia: diagnostic dilemmas. Br J Ophthalmol. 2019;103(10):1347–1355. doi:10.1136/bjophthalmol-2018-313530
17. Wang WW, Wang HZ, Liu JR, et al. Diagnostic ability of ganglion cell complex thickness to detect glaucoma in high myopia eyes by Fourier domain optical coherence tomography. Int J Ophthalmol. 2018;11(5):791–796. doi:10.18240/ijo.2018.05.12
18. Wu LZ, Huang ZS, Wu DZ, Chan E. Characteristics of the capillary-free zone in the normal human macula. Jpn J Ophthalmol. 1985;29(4):406–411.
19. Spaide RF, Fujimoto JG, Waheed NK, Sadda SR, Staurenghi G. Optical coherence tomography angiography. Prog Retin Eye Res. 2018;64:1–55. doi:10.1016/j.preteyeres.2017.11.003
20. Kashani AH, Chen CL, Gahm JK, et al. Optical coherence tomography angiography: a comprehensive review of current methods and clinical applications. Prog Retin Eye Res. 2017;60:66–100. doi:10.1016/j.preteyeres.2017.07.002
21. Johannesen SK, Viken JN, Vergmann AS, Grauslund J. Optical coherence tomography angiography and microvascular changes in diabetic retinopathy: a systematic review. Acta Ophthalmol. 2019;97(1):7–14. doi:10.1111/aos.13859
22. Oliverio GW, Ceravolo I, Bhatti A, Trombetta CJ. Foveal avascular zone analysis by optical coherence tomography angiography in patients with type 1 and 2 diabetes and without clinical signs of diabetic retinopathy. Int Ophthalmol. 2021;41(2):649–658. doi:10.1007/s10792-020-01621-z
23. Zivkovic M, Dayanir V, Kocaturk T, et al. Foveal avascular zone in normal tension glaucoma measured by optical coherence tomography angiography. BioMed Res Int. 2017;2017:3079141. doi:10.1155/2017/3079141
24. Carpineto P, Mastropasqua R, Marchini G, Toto L, Nicola MD, Antonio LD. Reproducibility and repeatability of foveal avascular zone measurements in healthy subjects by optical coherence tomography angiography. Br J Ophthalmol. 2016;100(5):671–676. doi:10.1136/bjophthalmol-2015-307330
25. Wang Q, Chan S, Yang JY, et al. Vascular density in retina and choriocapillaris as measured by optical coherence tomography angiography. Am J Ophthalmol. 2016;168:95–109. doi:10.1016/j.ajo.2016.05.005
26. Corvi F, Pellegrini M, Erba S, Cozzi M, Staurenghi G, Giani A. Reproducibility of vessel density, fractal dimension, and foveal avascular zone using 7 different optical coherence tomography angiography devices. Am J Ophthalmol. 2018;186:25–31. doi:10.1016/j.ajo.2017.11.011
27. Min CH, Al-Qattan HM, Lee JY, Kim JG, Yoon YH, Kim YJ. Macular microvasculature in high myopia without pathologic changes: an optical coherence tomography angiography study. Korean J Ophthalmol KJO. 2020;34(2):106–112. doi:10.3341/kjo.2019.0113
28. Leng Y, Tam EK, Falavarjani KG, Tsui I. Effect of age and myopia on retinal microvasculature. Ophthalmic Surg Lasers Imaging Retina. 2018;49(12):925–931. doi:10.3928/23258160-20181203-03
29. Gómez-Ulla F, Cutrin P, Santos P, et al. Age and gender influence on foveal avascular zone in healthy eyes. Exp Eye Res. 2019;189:107856. doi:10.1016/j.exer.2019.107856
30. Dubis AM, Hansen BR, Cooper RF, Beringer J, Dubra A, Carroll J. Relationship between the foveal avascular zone and foveal pit morphology. Invest Ophthalmol Vis Sci. 2012;53(3):1628–1636. doi:10.1167/iovs.11-8488
31. Ucak T, Icel E, Yilmaz H, et al. Alterations in optical coherence tomography angiography findings in patients with high myopia. Eye Lond Engl. 2020;34(6):1129–1135.
32. Choi J, Kwon J, Shin JW, Lee J, Lee S, Kook MS. Quantitative optical coherence tomography angiography of macular vascular structure and foveal avascular zone in glaucoma. PLoS One. 2017;12(9):e0184948. doi:10.1371/journal.pone.0184948
33. Takusagawa HL, Liu L, Ma KN, et al. Projection-resolved optical coherence tomography angiography of macular retinal circulation in glaucoma. Ophthalmology. 2017;124(11):1589–1599. doi:10.1016/j.ophtha.2017.06.002
34. Saif PS, Salman AE, Omran NA, Farweez YA. Assessment of diabetic retinopathy vascular density maps. Clin Ophthalmol Auckl NZ. 2020;14:3941–3953. doi:10.2147/OPTH.S256963
35. Wylęgała A, Wang L, Zhang S, Liu Z, Teper S, Wylęgała E. Comparison of foveal avascular zone and retinal vascular density in healthy Chinese and Caucasian adults. Acta Ophthalmol. 2020;98(4):e464–e469. doi:10.1111/aos.14316
36. Tan O, Chopra V, Lu ATH, et al. Detection of macular ganglion cell loss in glaucoma by Fourier-domain optical coherence tomography. Ophthalmology. 2009;116(12):2305–14.e1–2. doi:10.1016/j.ophtha.2009.05.025
37. Zhang X, Loewen N, Tan O, et al. Predicting development of glaucomatous visual field conversion using baseline Fourier-domain optical coherence tomography. Am J Ophthalmol. 2016;163:29–37. doi:10.1016/j.ajo.2015.11.029
38. Salehi MA, Nowroozi A, Gouravani M, Mohammadi S, Arevalo JF. Associations of refractive errors and retinal changes measured by optical coherence tomography: a systematic review and meta-analysis. Surv Ophthalmol. 2022;67(2):591–607. doi:10.1016/j.survophthal.2021.07.007
39. Kim NR, Kim JH, Lee J, Lee ES, Seong GJ, Kim CY. Determinants of perimacular inner retinal layer thickness in normal eyes measured by Fourier-domain optical coherence tomography. Invest Ophthalmol Vis Sci. 2011;52(6):3413–3418. doi:10.1167/iovs.10-6648
40. Ozcaliskan S, Artunay O, Balci S, Perente I, Yenerel NM. Quantitative analysis of inner retinal structural and microvascular alterations in intermediate age-related macular degeneration: a swept-source OCT angiography study. Photodiagnosis Photodyn Ther. 2020;32:102030. doi:10.1016/j.pdpdt.2020.102030
41. Grudzińska E, Modrzejewska M. Modern diagnostic techniques for the assessment of ocular blood flow in myopia: current state of knowledge. J Ophthalmol. 2018;2018:4694789. doi:10.1155/2018/4694789
42. Shimada N, Ohno-Matsui K, Harino S, et al. Reduction of retinal blood flow in high myopia. Graefes Arch Clin Exp Ophthalmol Albrecht Von Graefes Arch Klin Exp Ophthalmol. 2004;242(4):284–288. doi:10.1007/s00417-003-0836-0
43. Matsumura S, Kuo AN, Saw SM. An update of eye shape and myopia. Eye Contact Lens Sci Clin Pract. 2019;45(5):279–285. doi:10.1097/ICL.0000000000000571
44. Gupta P, Thakku SG, Saw SM, et al. Characterization of choroidal morphologic and vascular features in young men with high myopia using spectral-domain optical coherence tomography. Am J Ophthalmol. 2017;177:27–33. doi:10.1016/j.ajo.2017.02.001
45. Ikuno Y, Jo Y, Hamasaki T, Tano Y. Ocular risk factors for choroidal neovascularization in pathologic myopia. Invest Ophthalmol Vis Sci. 2010;51(7):3721–3725. doi:10.1167/iovs.09-3493
46. Cohen SY, Laroche A, Leguen Y, Soubrane G, Coscas GJ. Etiology of choroidal neovascularization in young patients. Ophthalmology. 1996;103(8):1241–1244. doi:10.1016/S0161-6420(96)30515-0
47. Scuderi G, Fragiotta S, Scuderi L, Iodice CM, Perdicchi A. Ganglion cell complex analysis in glaucoma patients: what can it tell us? Eye Brain. 2020;12:33–44. doi:10.2147/EB.S226319
48. Kwon J, Choi J, Shin JW, Lee J, Kook MS. Alterations of the foveal avascular zone measured by optical coherence tomography angiography in glaucoma patients with central visual field defects. Invest Ophthalmol Vis Sci. 2017;58(3):1637–1645. doi:10.1167/iovs.16-21079
49. Kim K, Kim ES, Yu SY. Optical coherence tomography angiography analysis of foveal microvascular changes and inner retinal layer thinning in patients with diabetes. Br J Ophthalmol. 2018;102(9):1226–1231. doi:10.1136/bjophthalmol-2017-311149
50. Hashimoto S, Yasuda M, Fujiwara K, et al. Association between axial length and myopic maculopathy: the hisayama study. Ophthalmol Retina. 2019;3(10):867–873. doi:10.1016/j.oret.2019.04.023
51. Walline JJ, Lindsley KB, Vedula SS, et al. Interventions to slow progression of myopia in children. Cochrane Database Syst Rev. 2020;2020:1.
52. Jonas JB, Ang M, Cho P, et al. IMI prevention of myopia and its progression. Invest Ophthalmol Vis Sci. 2021;62:5. doi:10.1167/iovs.62.5.6
 © 2023 The Author(s). This work is published and licensed by Dove Medical Press Limited. The
full terms of this license are available at https://www.dovepress.com/terms
and incorporate the Creative Commons Attribution
- Non Commercial (unported, 3.0) License.
By accessing the work you hereby accept the Terms. Non-commercial uses of the work are permitted
without any further permission from Dove Medical Press Limited, provided the work is properly
attributed. For permission for commercial use of this work, please see paragraphs 4.2 and 5 of our Terms.
© 2023 The Author(s). This work is published and licensed by Dove Medical Press Limited. The
full terms of this license are available at https://www.dovepress.com/terms
and incorporate the Creative Commons Attribution
- Non Commercial (unported, 3.0) License.
By accessing the work you hereby accept the Terms. Non-commercial uses of the work are permitted
without any further permission from Dove Medical Press Limited, provided the work is properly
attributed. For permission for commercial use of this work, please see paragraphs 4.2 and 5 of our Terms.