Back to Journals » Clinical Ophthalmology » Volume 12
Macular choroidal thickness in pregnant women with type 1, type 2 and gestational diabetes mellitus measured by spectral-domain optical coherence tomography
Authors Benfica CZ ![]() , Zanella T, Farias LB, Oppermann MLR
, Zanella T, Farias LB, Oppermann MLR ![]() , Canani LH
, Canani LH ![]() , Lavinsky D
, Lavinsky D
Received 26 February 2018
Accepted for publication 18 April 2018
Published 17 July 2018 Volume 2018:12 Pages 1259—1265
DOI https://doi.org/10.2147/OPTH.S166620
Checked for plagiarism Yes
Review by Single anonymous peer review
Peer reviewer comments 2
Editor who approved publication: Dr Scott Fraser
Camila Zanella Benfica,1,2 Teresinha Zanella,3 Lucas Brandolt Farias,1,2 Maria Lúcia Rocha Oppermann,1,3 Luis Henrique Santos Canani,1,4 Daniel Lavinsky1,2
1Universidade Federal do Rio Grande do Sul (UFRGS), Porto Alegre, Brazil; 2Department of Ophthalmology, Hospital de Clínicas de Porto Alegre, Porto Alegre, Brazil; 3Department of Gynecology and Obstetrics, Hospital de Clínicas de Porto Alegre, Porto Alegre, Brazil; 4Department of Endocrinology, Hospital de Clínicas de Porto Alegre, Porto Alegre, Brazil
Purpose: To analyze choroidal thickness (CT) of pregnant women with type 1 diabetes mellitus (DM), type 2 DM and gestational diabetes mellitus (GDM) using spectral-domain optical coherence tomography.
Patients and methods: This cross-sectional study included 144 eyes of 72 pregnant women in the third trimester divided into four groups: 27 non-diabetic pregnant women; 15 pregnant women with GDM; 16 with type 2 DM and 14 with type 1 DM. CT was measured using optical coherence tomography at ten different locations. We also analyzed possible confounding factors, such as gestational age, glycosylated hemoglobin, time from DM diagnosis, hypertension and severity of diabetic retinopathy.
Results: The comparison between the four groups showed a thinner choroid in patients with type 1 DM in all locations, with statistical significance in subfoveal and temporal measurements. When comparing only patients with type 1 and type 2 DM, adjusting for confounding factors, the choroid of patients with type 1 DM remained thinner at all macular points, also with statistical significance in subfoveal and temporal measurements.
Conclusion: Pregnant women with type 1 DM had significantly thinner CT measurements on subfoveal and temporal locations. No differences were found in CT between the control group and pregnant women with GDM and type 2 DM.
Keywords: choroid, enhanced depth imaging optical coherence tomography, pregnancy, gestational diabetes mellitus, diabetes mellitus
Introduction
Diabetic retinopathy (DR) is a major cause of visual impairment in women during their childbearing years. It is known that pregnancy is an independent risk factor for DR progression,1–3 and its implications can persist for the first year after delivery. Other risk factors include glycemic control, duration of diabetes, baseline level of DR, hypertension and preeclampsia.4,5 Previous reports, however, suggest that rapid optimization in glucose control may result in an increased risk for the progression of DR during pregnancy.3,4
The reasons why pregnancy itself causes a worsening in DR are still being questioned. A possible relation with morphological changes of the choroid should be studied. Diabetic choroidopathy, first reported by Hidayat and Fine in 1985,6 might be present before the onset of DR.7 Several choroidal changes have been described in diabetic patients, including microaneurysms, dilatation and obstruction of the choriocapillaris, increased vascular tortuosity, vascular dropouts, areas of vascular non-perfusion and choroidal neovascularization.8
The development of the enhanced depth imaging (EDI) technique of spectral-domain optical coherence tomography (SD-OCT) systems have allowed adequate analysis of choroidal morphologic features in normal and pathological eyes.9 EDI-OCT dramatically increases image resolution of the choroid by decreasing signal strength posterior to the retinal pigment epithelium. Although many authors have reported a decrease in choroidal thickness (CT) among diabetic patients,10–15 there are some discordant studies.7,16,17
The presence of choroidal changes related to pregnancy is also being investigated. The strong correlation between central serous chorioretinopathy (CSC) and pregnancy is well documented.18,19 Choroidal dysfunction and ischemia are also a common ocular complication of preeclampsia.20–22 Since it is a noninvasive diagnostic method, OCT is ideal for the study of choroidal changes in pregnant women. Some studies have already analyzed CT in healthy pregnant women using OCT,23–28 but the results are still inconclusive.
The aim of this study was to analyze CT measurements of non-diabetic pregnant women and of pregnant women with type 1, type 2 and gestational diabetes mellitus (GDM) using SD-OCT.
Patients and methods
This cross-sectional study included 144 eyes of 72 pregnant women in the third trimester divided into four groups: Group 1 consisted of 27 non-diabetic pregnant women (control group); Group 2 consisted of 15 pregnant women with GDM; Group 3 consisted of 16 pregnant women with type 2 diabetes mellitus (type 2 DM) and Group 4 consisted of 14 pregnant women with type 1 diabetes mellitus (type 1 DM). The participants were recruited between March and September 2016 at the Hospital de Clinicas de Porto Alegre (HCPA), Brazil. All participants received in person a full explanation about the study and provided written informed consent. This study was approved by the HCPA research ethics committee and was conducted in accordance with the Declaration of Helsinki guidelines.
All participants were receiving prenatal care at HCPA and were in their third trimester of singleton pregnancy. Subjects with a history of laser photocoagulation, anti-vascular endothelial growth factor (VEGF) treatment, ocular surgery or any ocular pathology except for DR were excluded. Refractive disorders with spherical equivalent greater than ±1.0 diopters, intraocular pressure higher than 21 mmHg or best-corrected visual acuity worse than 0,1 logMAR were also exclusion criteria. Participants with preeclampsia, multiple pregnancies, renal or rheumatological diseases or history of smoking were also excluded.
The criteria used for GDM diagnosis followed the International Association of Diabetes in Pregnancy Study Groups (IADPSG) recommendations.29 We analyzed the glycosylated hemoglobin A1c (HbA1c) of all diabetic patients; the blood samples for HbA1c were collected within 30 days of the ophthalmic exam. DR grading was performed according to the international severity scale:30 mild nonproliferative DR (microaneurysms only); moderate nonproliferative DR (more than just microaneurysms but less than severe nonproliferative DR); severe nonproliferative DR (more than 20 intraretinal hemorrhages in each of four quadrants or venous beading in two quadrants or prominent intraretinal microvascular abnormalities in 1 quadrant) and proliferative DR (neovascularization or vitreous/preretinal hemorrhage). The diagnosis for each individual was based on the grading of the worse eye per subject. Only treatment-naive patients were included.
All study participants underwent an interview with demographic and background history. The ophthalmic examination included uncorrected visual acuity, best-corrected visual acuity, Goldmann applanation tonometry, slit-lamp assisted biomicroscopy, indirect ophthalmoscopy and SD-OCT. All OCT scans were performed in the morning (8:00 am to 12:00 pm) to avoid diurnal variations of CT. The same experienced ophthalmologist (CB) performed all ophthalmic examinations and OCT scans, using Heidelberg Spectralis OCT (Heidelberg Engineering Co, Heidelberg, Germany). Choroid was imaged with a 6-line radial scan (30°, 9.2 mm) using the EDI setting, with 100 images averaged per section. All scans were reviewed before being included in the study. Those with image artefacts or inaccurate choroidal limits were excluded.
CT was determined as the vertical distance from the outer surface of the line formed by the retinal pigment epithelium to the chorioscleral interface using the Spectralis OCT measurement software. The measurements were made by an experienced ophthalmologist (DL) masked to the participant group. Previous studies have already demonstrated the reproducibility of this technique, even across different OCT systems.31–33 CT was measured at ten different locations: at the fovea and every 500 μm from the fovea up to 2,500 μm temporally and up to 2,000 μm nasally (Figure 1). We used the following abbreviations for the macular points: T5: CT at 2,500 μm temporally to the fovea; T4: CT at 2,000 μm temporally to the fovea; T3: CT at 1,500 μm temporally to the fovea; T2: CT at 1,000 μm temporally to the fovea; T1: CT at 500 μm temporally to the fovea; SF: CT at the fovea; N1: CT at 500 μm nasally to the fovea; N2: CT at 1,000 μm nasally to the fovea; N3: CT at 1,500 μm nasally to the fovea and N4: CT at 2,000 μm nasally to the fovea.
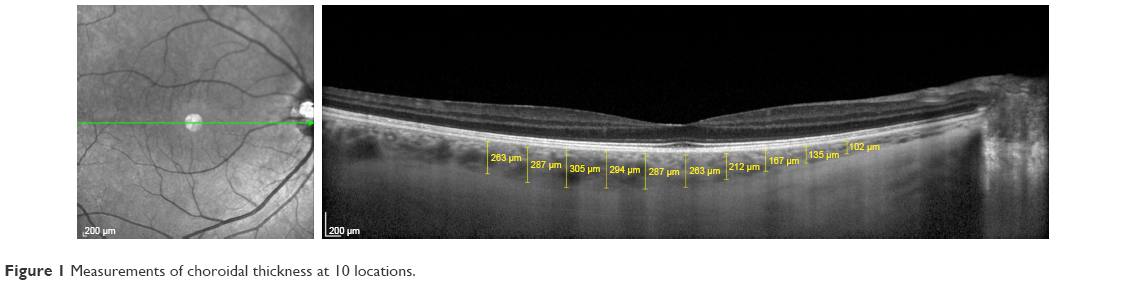 | Figure 1 Measurements of choroidal thickness at 10 locations. |
Statistical analysis
Statistical analyses were performed using SPSS V.15.0 (SPSS Science, Chicago, IL, USA). Quantitative variables were presented as mean (±SD) or median and interquartile range. Categorical variables were described by absolute and relative frequencies. To compare means between groups, analysis of variance (ANOVA) complemented by Tukey was applied. In case of asymmetry, Mann–Whitney and Kruskal–Wallis tests were used. For qualitative data, a chi-squared test was used. Differences in CT were analyzed using generalized estimating equations (GEE) with Bonferroni adjustment. A p-value ≤0.05 was considered statistically significant.
Results
The demographic and clinical characteristics of the subjects are summarized in Table 1. The OCT scans were performed in 54 eyes of 27 healthy pregnant women, 30 eyes of 15 pregnant women with GDM, 32 eyes of 16 pregnant women with type 2 DM and 28 eyes of 14 pregnant women with type 1 DM. There was no significant difference in age, ethnicity and gestational age between groups. As expected, time from DM diagnosis was significantly higher in subjects with type 1 DM in comparison with subjects with type 2 DM. HbA1c values were significantly higher in patients with type 1 DM (7.4% ± 1.2%) compared with GDM patients (5.7% ± 0.8%) (p=0.06). Two patients from group 2 and six patients from group 3 had chronic hypertension diagnosis (p=0.001), requiring adjustment in CT analysis.
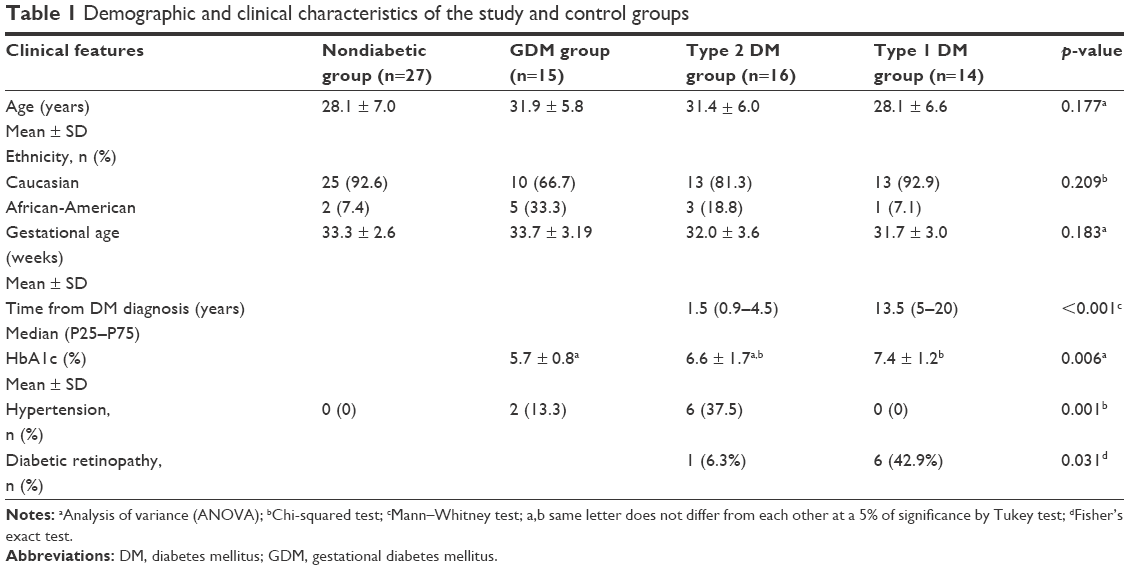 | Table 1 Demographic and clinical characteristics of the study and control groups |
Of the 14 subjects with type 1 DM, 6 (42.9%) were diagnosed with DR (1 mild nonproliferative, 4 moderate nonproliferative and 1 proliferative DR). In comparison, only one patient (6.3%) with type 2 DM was diagnosed with moderate nonproliferative retinopathy (p=0.031). None of the subjects with DR had macular edema on OCT and all of them were treatment-naive at the time of the exam.
Comparing the 10 CT measurements of the four groups, adjusted for the presence of hypertension, the choroid always tended to be thinner in patients with type 1 DM. There was no significant differences between nondiabetic, GDM and type 2 DM groups. From macular points T5 to T1, macular thickness was significantly higher in pregnant women with GDM in comparison with pregnant women with type 1 DM. In the subfoveal measurement, however, macular thickness was significantly higher in pregnant women with type 2 DM in comparison with pregnant women with type 1 DM. No measures nasal to the fovea were statistically different between the groups. All measurements and p-values are shown in Table 2.
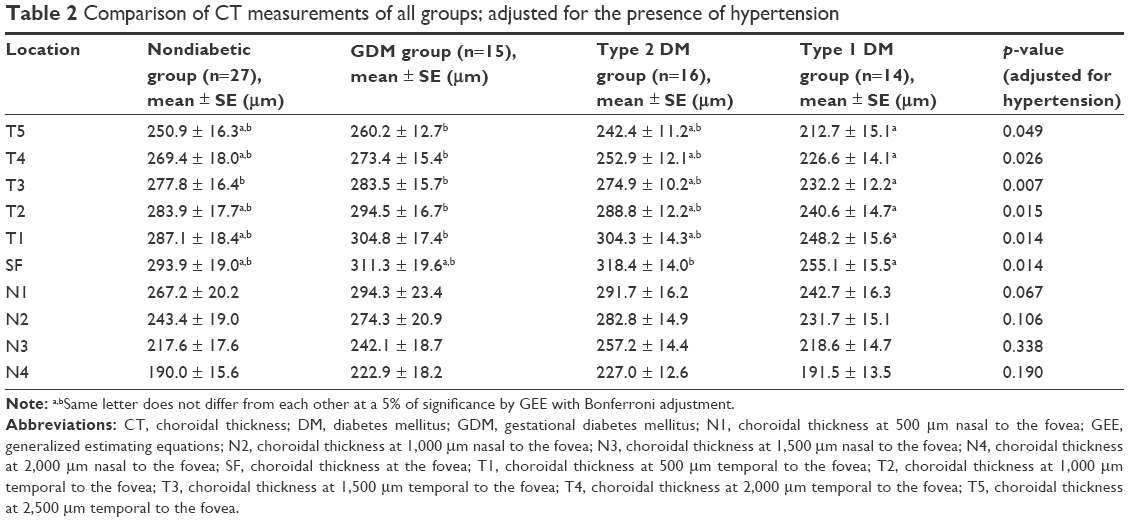 | Table 2 Comparison of CT measurements of all groups; adjusted for the presence of hypertension |
When we analyzed only the groups with diabetic patients, adjusting also for HbA1c levels, the choroid was thinner in patients with type 1 DM in comparison with patients with GDM or type 2 DM (Table 3). CT measurements in T5, T3, T2, T1 and SF macular points were significantly thinner in patients with type 1 DM in comparison with patients with GDM and type 2 DM. The choroid in T4 and N1 macular points, however, was significantly thinner in patients with type 1 DM only in comparison with patients with DMG. No statistically significant difference between groups was found at the N2, N3 and N4 macular points.
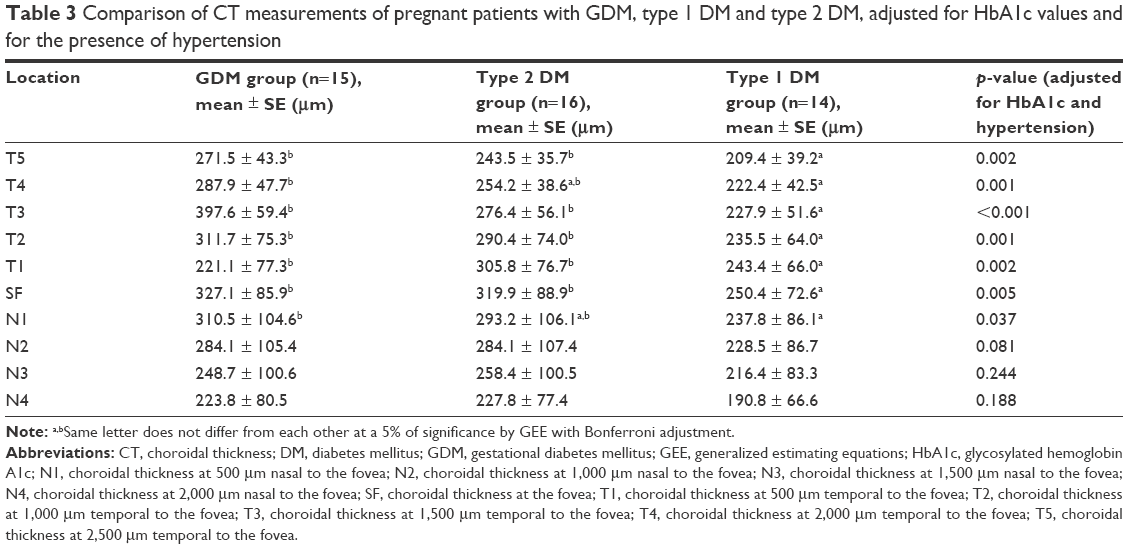 | Table 3 Comparison of CT measurements of pregnant patients with GDM, type 1 DM and type 2 DM, adjusted for HbA1c values and for the presence of hypertension |
In order to analyze CT adjusting also for time of DM diagnosis and presence of DR, we also performed an analysis only between the type 1 DM and type 2 DM groups (Table 4). CT of patients with type 1 DM remained thinner than in patients with type 2 DM at all macular points, but with statistical significance only in T4, T3, T2, T1 and SF points.
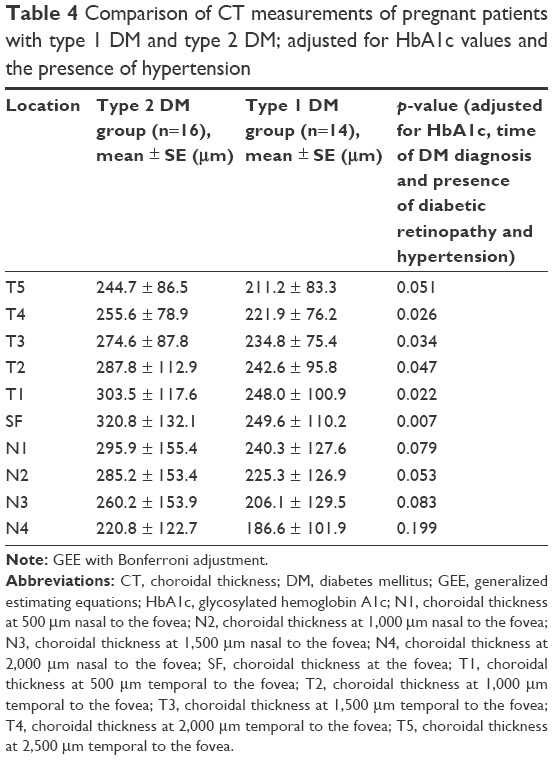 | Table 4 Comparison of CT measurements of pregnant patients with type 1 DM and type 2 DM; adjusted for HbA1c values and the presence of hypertension |
Discussion
The choroid is a complex vascular network which provides vascular supply for the retinal pigment epithelium and outer retina layers, representing the sole provider of oxygen and nutrients to the avascular fovea. This vascular network is responsible for more than 85% of the blood flow in the eye. Unlike the retina, autoregulation of choroidal blood flow is limited and it has intense autonomic innervation. Abnormal choroidal blood flow can result in photoreceptor dysfunction and death.34,35
CT is influenced by major factors such as age, refractive error and axial length (AL), with increasing age, AL and decreasing refractive diopter being associated with a reduction of CT.36 Diurnal variations in CT have also been reported.37,38 Although choroidal thickness has more precise characteristics in some diseases such as CSC and age-related macular degeneration (AMD), choroidal changes in diabetic patients have been studied and controversial results have been published.
Recent studies conducted by Yazici et al7 and Tavares Ferreira et al16 found that the choroid is thicker in diabetic patients. The population-based Beijing Eye study17 also found that DM can lead to a slight thickening of the choroid, although not related to the severity of DR. Yulek et al concluded that subfoveal CT was not significantly correlated with increased duration of diabetes.39 Regatieri et al,10 however, reported a thinner CT in patients with diabetic macular edema or treated proliferative DR compared with normal subjects. Vujosevic et al,11 Esmaeelpour et al,12,13 Querques et al14 and Shen et al15 also demonstrated that CT decreases in diabetic eyes with clinical signs of DR compared with controls.
The aim of this study was to analyze these possible changes in CT in diabetic patients during pregnancy. Since pregnancy is an independent risk factor for the progression of DR, we questioned if possible changes in the choroid may contribute to this progression. There is limited data on this issue and to the best of our knowledge this is the first study to compare CT in pregnant women with type 1 and type 2 DM. Acmaz et al40 reported that CT was significantly thicker in healthy pregnant women and women with GDM in comparison with non-pregnant women. However, there was no significant difference between the GDM group and the healthy pregnant women group.
As pregnancy itself could lead to physiological changes in the choroid, our control group consisted of nondiabetic pregnant women. In this study, we found no difference in CT between non-diabetic pregnant women, women with GDM and pregnant women with type 2 DM. Pregnant women with type 1 DM, however, had smaller CT measurements at all points analyzed.
This choroid thinning in patients with type 1 DM was more significant in the measurements located temporally to the fovea. Measurements of CT nasally to the fovea were not statistically different.
We also performed this analysis only among diabetic patients to enable adjustment for HbA1c, with similar results. When we compared only pregnant women with type 1 and type 2 diabetes, adjusting also for time of diabetes and presence of retinopathy, CT remained significantly thinner in subjects with type 1 DM between T4 and SF points.
Despite being a controversial subject, most of the available evidence seems to indicate that choroid thins in diabetic eyes.41 According to our findings, pregnant subjects with type 1 DM also followed this thinning pattern. The significantly higher prevalence of DR found in these patients may have contributed to this finding. It is possible to hypothesize that choroidal thinning in type 1 pregnant diabetic patients occurs as part of diabetic choroidopathy modifications. The decreased choroidal blood flow found in diabetic patients,42–44 along with changes such as atrophy and dropout of the choriocapillaris,6,45 could contribute to this thinning. It remains to be understood how these ocular blood flow abnormalities seen in diabetic patients are influenced by pregnancy hyperflow and whether these modifications could contribute to the DR progression seen in pregnancy.
Since CT measurements may be susceptible to several confounding factors, we tried to minimize possible biases. The examinations were performed only in the morning shift to avoid diurnal variations, and patients with refractive disorders with spherical equivalent greater than ±1.0 diopters were excluded. Exams without clear identification of the choroid-scleral junction were also excluded from the analysis. Since laser photocoagulation and anti-VEGF treatments may change CT,10,41,46 only treatment-naive patients were included. None of the subjects with DR had macular edema on OCT.
Our study also has some limitations, such as the small number of subjects. Its cross-sectional design allow us to analyze choroid characteristics only from the third trimester of pregnancy. Further prospective studies with a larger number of subjects should be performed to confirm these findings.
Conclusion
Our study showed no statistically significant difference in CT between non-diabetic pregnant women, pregnant women with GDM and pregnant women with type 2 DM during the third trimester. Pregnant women with type 1 DM had significantly thinner CT measurements on subfoveal and temporal to the fovea analysis.
Disclosure
The authors report no conflicts of interest in this work.
References
The Diabetes Control and Complications Trial Research Group. Effect of pregnancy on microvascular complications in the diabetes control and complications trial. Diabetes Care. 2000;23(8):1084–1091. | ||
Klein BE, Moss SE, Klein R. Effect of pregnancy on progression of diabetic retinopathy. Diabetes Care. 1990;13(1):34–40. | ||
Chew EY, Mills JL, Metzger BE, et al. Metabolic control and progression of retinopathy. The Diabetes in Early Pregnancy Study. National Institute of Child Health and Human Development Diabetes in Early Pregnancy Study. Diabetes Care. 1995;18(5):631–637. | ||
Morrison J, Hodgson L, Lim L, Al-Qureshi S. Diabetic retinopathy in pregnancy: a review. Clin Exp Ophthalmol. 2016;44(4):321–334. | ||
Rosenn B, Miodovnik M, Kranias G, et al. Progression of diabetic retinopathy in pregnancy: association with hypertension in pregnancy. Am J Obstet Gynecol. 1992;166(4):1214–1218. | ||
Hidayat AA, Fine BS. Diabetic choroidopathy. Light and electron microscopic observations of seven cases. Ophthalmology. 1985;92(4):512–522. | ||
Yazici A, Sogutlu Sari E, Koc R, et al. Alterations of choroidal thickness with diabetic neuropathy. Invest Ophthalmol Vis Sci. 2016;57(4):1518–1522. | ||
Melancia D, Vicente A, Cunha JP, Abegão Pinto L, Ferreira J. Diabetic choroidopathy: a review of the current literature. Graefes Arch Clin Exp Ophthalmol. 2016;254(8):1453–1461. | ||
Spaide RF, Koizumi H, Pozonni MC. Enhanced depth imaging spectral-domain optical coherence tomography. Am J Ophthalmol. 2008;146(4):496–500. | ||
Regatieri CV, Branchini L, Carmody J, Fujimoto JG, Duker JS. Choroidal thickness in patients with diabetic retinopathy analyzed by spectral-domain optical coherence tomography. Retina. 2012;32(3):563–568. | ||
Vujosevic S, Martini F, Cavarzeran F, Pilotto E, Midena E. Macular and peripapillary choroidal thickness in diabetic patients. Retina. 2012;32(9):1781–1790. | ||
Esmaeelpour M, Považay B, Hermann B, et al. Mapping choroidal and retinal thickness variation in type 2 diabetes using three-dimensional 1060-nm optical coherence tomography. Invest Ophthalmol Vis Sci. 2011;52(8):5311–5316. | ||
Esmaeelpour M, Brunner S, Ansari-Shahrezaei S, et al. Choroidal thinning in diabetes type 1 detected by 3-dimensional 1060 nm optical coherence tomography. Invest Ophthalmol Vis Sci. 2012;53(11):6803–6809. | ||
Querques G, Lattanzio R, Querques L, et al. Enhanced depth imaging optical coherence tomography in type 2 diabetes. Invest Ophthalmol Vis Sci. 2012;53(10):6017–6024. | ||
Shen ZJ, Yang XF, Xu J, et al. Association of choroidal thickness with early stages of diabetic retinopathy in type 2 diabetes. Int J Ophthalmol. 2017;10(4):613–618. | ||
Tavares Ferreira J, Vicente A, Proença R, et al. Choroidal thickness in diabetic patients without diabetic retinopathy. Retina. 2018;38(4):795–804. | ||
Xu J, Xu L, Du KF, et al. Subfoveal choroidal thickness in diabetes and diabetic retinopathy. Ophthalmology. 2013;120(10):2023–2028. | ||
Haimovici R, Koh S, Gagnon DR, et al. Risk factors for central serous chorioretinopathy: a case-control study. Ophthalmology. 2004;111(2):244–249. | ||
Kuroda S, Ikuno Y, Yasuno Y, et al. Choroidal thickness in central serous chorioretinopathy. Retina. 2013;33(2):302–308. | ||
Valluri S, Adelberg DA, Curtis RS, Olk RJ. Diagnostic indocyanine green angiography in preeclampsia. Am J Ophthalmol. 1996;122(5):672–677. | ||
Garg A, Wapner R, Ananth C, et al. Choroidal and retinal thickening in severe preeclampsia. Invest Ophthalmol Vis Sci. 2014;55(9):5723–5729. | ||
Somfai GM, Miháltz K, Tulassay E, Rigó J Jr. Diagnosis of serous neuroretinal detachments of the macula in severe preeclamptic patients with optical coherence tomography. Hypertens Pregnancy. 2006;25(1):11–20. | ||
Kara N, Sayin N, Pirhan D, et al. Evaluation of subfoveal choroidal thickness in pregnant women using enhanced depth imaging optical coherence tomography. Curr Eye Res. 2014;39(6):642–647. | ||
Takahashi J, Kado M, Mizumoto K, Igarashi S, Kojo T. Choroidal thickness in pregnant women measured by enhanced depth imaging optical coherence tomography. Jap J Ophthalmol. 2013;57(5):435–439. | ||
Goktas S, Basaran A, Sakarya Y, et al. Measurement of choroid thickness in pregnant women using enhanced depth imaging optical coherence tomography. Arq Bras Oftalmol. 2014;77(3):148–151. | ||
Dadaci Z, Alptekin H, Oncel Acir N, Borazan M. Changes in choroidal thickness during pregnancy detected by enhanced depth imaging optical coherence tomography. Br J Ophthalmol. 2015;99(9):1255–1259. | ||
Ulusoy DM, Duru N, Ataş M, Altinkaynak H, Duru Z, Açmaz G. Measurement of choroidal thickness and macular thickness during and after pregnancy. Int J Ophthalmol. 2015;8(2):321–325. | ||
Rothwell RT, Meira DM, Oliveira MA, Ribeiro LF, Fonseca SL. Evaluation of choroidal thickness and volume during the third trimester of pregnancy using enhanced depth imaging optical coherence tomography: a pilot study. J Clin Diagn Res. 2015;9(8):NC08–NC11. | ||
International Association of Diabetes and Pregnancy Study Groups Consensus Panel. International association of diabetes and pregnancy study groups recommendations on the diagnosis and classification of hyperglycemia in pregnancy. Diabetes Care. 2010;33(3):676–682. | ||
Wilkinson CP, Ferris FL 3rd, Klein RE, et al. Proposed international clinical diabetic retinopathy and diabetic macular edema disease severity scales. Ophthalmology. 2003;110(9):1677–1682. | ||
Chhablani J, Barteselli G, Wang H, et al. Repeatability and reproducibility of manual choroidal volume measurements using enhanced depth imaging optical coherence tomography. Invest Ophthalmol Vis Sci. 2012;53(4):2274–2280. | ||
Branchini L, Regatieri C, Flores-Moreno I, Baumann B, Fujimoto JG, Duker JS. Reproducibility of choroidal thickness measurements across three spectral domain optical coherence tomography systems. Ophthalmology. 2012;119(1):119–123. | ||
Koay C, Quo M, Subrayan V. Reproducibility of choroidal thickness measurements in subjects on 3 spectral domain optical coherence tomography machines. Int Ophthalmol. 2017;37(3):655–671. | ||
McDougal D, Gamlin P. Autonomic control of the eye. Compr Physiol. 2015;5(1):439–473. | ||
Regatieri CV, Branchini L, Fujimoto JG, Duker JS. Choroidal imaging using spectral-domain optical coherence tomography. Retina. 2012;32(5):865–876. | ||
Xiong S, He X, Deng J, et al. Choroidal thickness in 3001 Chinese children aged 6 to 19 years using swept-source OCT. Sci Rep. 2017;7:45059. | ||
Tan C, Ouyang Y, Ruiz H, Sadda SR. Diurnal variation of choroidal thickness in normal, healthy subjects measured by spectral domain optical coherence tomography. Invest Ophthalmol Vis Sci. 2012;53(1):261–266. | ||
Chakraborty R, Read S, Collins M. Diurnal variations in axial length, choroidal thickness, intraocular pressure, and ocular biometrics. Invest Ophthalmol Vis Sci. 2011;52(8):5121–5129. | ||
Yülek F, Uğurlu N, Önal ED, et al. Choroidal changes and duration of diabetes. Semin Ophthalmol. 2014;29(2):80–84. | ||
Acmaz G, Atas M, Gulhan A, et al. Assessment of macular peripapillary nerve fiber layer and choroidal thickness changes in pregnant women with gestational diabetes mellitus, healthy pregnant women, and healthy non-pregnant women. Med Sci Monit. 2015;21:1759–1764. | ||
Campos A, Campos EJ, Martins J, Ambrósio AF, Silva R. Viewing the choroid: where we stand, challenges and contradictions in diabetic retinopathy and diabetic macular oedema. Acta Ophthalmol. 2017;95(2):446–459. | ||
Nagaoka T, Kitaya N, Sugawara R, et al. Alteration of choroidal circulation in the foveal region in patients with type 2 diabetes. Br J Ophthalmol. 2004;88(8):1060–1063. | ||
Geyer O, Neudorfer M, Snir T, et al. Pulsatile ocular blood flow in diabetic retinopathy. Acta Ophthalmol Scand. 1999;77(5):522–525. | ||
Langham ME, Grebe R, Hopkins S, Marcus S, Sebag M. Choroidal blood flow in diabetic retinopathy. Exp Eye Res. 1991;52(2):167–173. | ||
Lutty GA, Cao J, McLeod DS. Relationship of polymorphonuclear leukocytes to capillary dropout in the human diabetic choroid. Am J Pathol. 1997;151(3):707–714. | ||
Lains I, Figueira J, Santos AR, et al. Choroidal thickness in diabetic retinopathy: the influence of antiangiogenic therapy. Retina. 2014;34(6):1199–1207. |
 © 2018 The Author(s). This work is published and licensed by Dove Medical Press Limited. The
full terms of this license are available at https://www.dovepress.com/terms
and incorporate the Creative Commons Attribution
- Non Commercial (unported, 3.0) License.
By accessing the work you hereby accept the Terms. Non-commercial uses of the work are permitted
without any further permission from Dove Medical Press Limited, provided the work is properly
attributed. For permission for commercial use of this work, please see paragraphs 4.2 and 5 of our Terms.
© 2018 The Author(s). This work is published and licensed by Dove Medical Press Limited. The
full terms of this license are available at https://www.dovepress.com/terms
and incorporate the Creative Commons Attribution
- Non Commercial (unported, 3.0) License.
By accessing the work you hereby accept the Terms. Non-commercial uses of the work are permitted
without any further permission from Dove Medical Press Limited, provided the work is properly
attributed. For permission for commercial use of this work, please see paragraphs 4.2 and 5 of our Terms.