")
Back to Journals » Neuropsychiatric Disease and Treatment » Volume 15
Machine learning techniques in a structural and functional MRI diagnostic approach in schizophrenia: a systematic review
Authors de Filippis R , Carbone EA, Gaetano R, Bruni A, Pugliese V , Segura-Garcia C , De Fazio P
Received 22 January 2019
Accepted for publication 9 April 2019
Published 19 June 2019 Volume 2019:15 Pages 1605—1627
DOI https://doi.org/10.2147/NDT.S202418
Checked for plagiarism Yes
Review by Single anonymous peer review
Peer reviewer comments 2
Editor who approved publication: Dr Roger Pinder
Renato de Filippis,1,* Elvira Anna Carbone,1,* Raffaele Gaetano,1 Antonella Bruni,1 Valentina Pugliese,1 Cristina Segura-Garcia,2 Pasquale De Fazio1
1Department of Health Sciences, University Magna Graecia of Catanzaro, Catanzaro 88100, Italy; 2Department of Medical and Surgical Sciences, University Magna Graecia of Catanzaro, Catanzaro 88100, Italy
*These authors contributed equally to this work
Background: Diagnosis of schizophrenia (SCZ) is made exclusively clinically, since specific biomarkers that can predict the disease accurately remain unknown. Machine learning (ML) represents a promising approach that could support clinicians in the diagnosis of mental disorders.
Objectives: A systematic review, according to the PRISMA statement, was conducted to evaluate its accuracy to distinguish SCZ patients from healthy controls.
Methods: We systematically searched PubMed, Embase, MEDLINE, PsychINFO and the Cochrane Library through December 2018 using generic terms for ML techniques and SCZ without language or time restriction. Thirty-five studies were included in this review: eight of them used structural neuroimaging, twenty-six used functional neuroimaging and one both, with a minimum accuracy >60% (most of them 75–90%). Sensitivity, Specificity and accuracy were extracted from each publication or obtained directly from authors.
Results: Support vector machine, the most frequent technique, if associated with other ML techniques achieved accuracy close to 100%. The prefrontal and temporal cortices appeared to be the most useful brain regions for the diagnosis of SCZ. ML analysis can efficiently detect significantly altered brain connectivity in patients with SCZ (eg, default mode network, visual network, sensorimotor network, frontoparietal network and salience network).
Conclusion: The greater accuracy demonstrated by these predictive models and the new models resulting from the integration of multiple ML techniques will be increasingly decisive for early diagnosis and evaluation of the treatment response and to establish the prognosis of patients with SCZ. To achieve a real benefit for patients, the future challenge is to reach an accurate diagnosis not only through clinical evaluation but also with the aid of ML algorithms.
Keywords: machine learning, schizophrenia, support vector machine, resting-state fMRI, sMRI, multivariate pattern analysis
Introduction
Schizophrenia (SCZ) is a major psychiatric disorder characterized by delusions and hallucinations with a loss of contact with reality (so-called positive symptoms), flat affect, anhedonia, loss of motivation (avolition), poor speech (alogia), social withdrawal (so-called negative symptoms) and cognitive impairment, which have a strong impact on the patient and society.1 The average incidence is 15.2 per 100,000 people, the lifetime prevalence is 0.40% and the pooled male–female rate ratio is 1.4.2 A recent review estimated that approximately 1 in 200 individuals will be diagnosed with SCZ at some point during their lifetime, with variations based on the geographic region.3 Diagnosis is based on the Diagnostic and Statistical Manual of Mental Disorders 5 (DSM-5)4 or on the ICD5 and is exclusively clinical, since specific biomarkers that can predict the illness accurately remain unknown.6 Pattern recognition methods applied to neuroimaging data represent a new and promising approach that could support clinicians in the diagnosis of mental disorders.7 Magnetic resonance imaging (MRI) is today one of the most used techniques for the study of the neurobiological bases of SCZ. Computerized methods are necessary to analyze large amounts of imaging data with great precision. The most relevant information is extracted from the images, and then a model classification method is able to process this information in order to determine the probability of disease.8 The new approach is exemplified by the application of machine learning (ML) techniques such as support vector machines (SVM), a high-dimensional, pattern recognition, supervised learning algorithm9 or multivariate pattern analysis (MVPA) or the random forest (RF). These techniques are most useful when analyzing highly complex datasets to enable the discovery of relationships that are not evident from simple statistics and thus to make accurate predictions based on these statistics.10
This research seeks to evaluate the evidence about the role of ML techniques in making diagnostic discrimination in SCZ during the last 30 years. To the best of our knowledge, there are no systematic reviews investigating these features. We aimed to provide a comprehensive systematic review according to the PRISMA statement11 of different ML techniques used to distinguish SCZ patients from healthy controls (HC). It was not our goal to catalog all methods of ML, to report on applications of ML in psychiatry nor to explain or illustrate any particular method in detail.
Materials and methods
Search strategy
We searched PubMed, Embase, MEDLINE, PsychINFO and the Cochrane Library for articles published up to December 31, 2018, without language and time restriction, by using the following keywords: (“Big data” OR “Artificial Intelligence” OR “Machine Learning” OR “Gaussian process” OR “Cross-validation” OR “Cross validation” OR “Crossvalidation” OR “Regularized logistic” OR “Linear discriminant analysis” OR “LDA” OR “Random forest” OR “Naïve Bayes” OR “Least Absolute selection shrinkage operator” OR “elastic net” OR “LASSO” OR “RVM” OR “relevance vector machine” OR “pattern recognition” OR “Computational Intelligence” OR “Machine Intelligence” OR “Knowledge Representation” OR “Knowledge Representations” OR “support vector” OR “SVM” OR “Pattern classification” OR “Deep learning”) AND (“Schizophrenia”). Two authors reviewed all the selected studies independently. The reference lists were screened to find additional data. The eligible publications have been included and cited in this review. This systematic review was developed according to the PRISMA statement.11
Assessment of study quality
The Jadad rating system12 was applied to check the methodological quality of studies in this systematic review. Jadad’s procedure enables qualification of a study according to the clarity in describing the randomization, the double-blinding procedure and the withdrawal and dropout reports. Score ranges from 0 to 5. For this systematic review, the inclusion criteria was a Jadad score >3.
Selection criteria
We included studies using ML techniques with schizophrenic patients diagnosed according to the DSM-IV, DSM IV-TR, DSM-5 or ICD-10 criteria. These patients could have chronic SCZ or be diagnosed with a first episode of schizophrenia (FES) and could be drug-naïve or under antipsychotic treatment. We excluded studies with patients who exhibited general medical, neurological or psychiatric comorbidity, substance abuse or alcohol dependence, traumatic brain injuries with loss of consciousness or unclear or unverified diagnoses according to the DSM or ICD criteria. Studies without control groups were also excluded.
Data collection, extraction and statistical analysis
Two researchers (EAC and RdF) independently screened the titles and abstracts of the identified articles and read the full texts of articles that met the eligibility criteria, supervised by RG, who made the final decision in cases of disagreement. Article data included year of publication, ML model and algorithm (eg, SVM, MVPA, RF), sample size, diagnoses assessed in the study and statistical data (ie, accuracy, sensitivity, specificity, area under the ROC curve [AUC]).
Results
Initially, 2,386 items were identified, of which 2,215 articles were excluded because they did not fulfill inclusion criteria. The abstracts of the remaining 171 articles were reviewed. In all, 60/171 articles were deleted because they were editorials, letters to editors, reviews, meta-analyses, case reports or different interventions. Then, 76 manuscripts of 111 papers were deleted because they did not fulfill the criteria for inclusion, while the remaining 35 were included. Of the latter, 8 used structural neuroimaging and 26 used functional neuroimaging and 1 both (Figure 1).
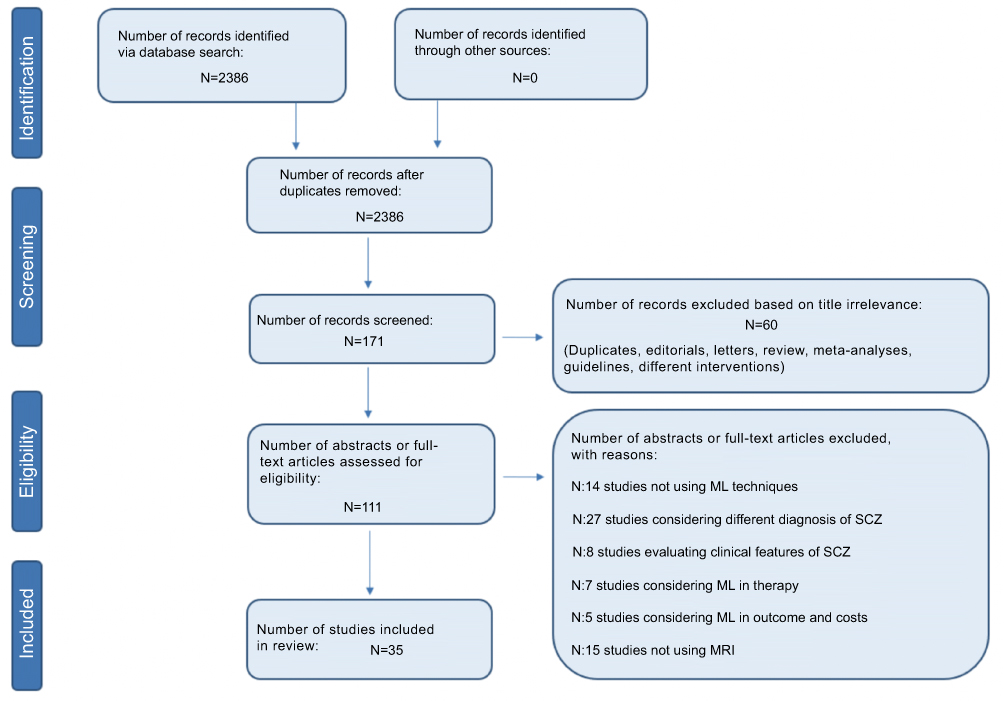 | Figure 1 PRISMA flow diagram of included studies. |
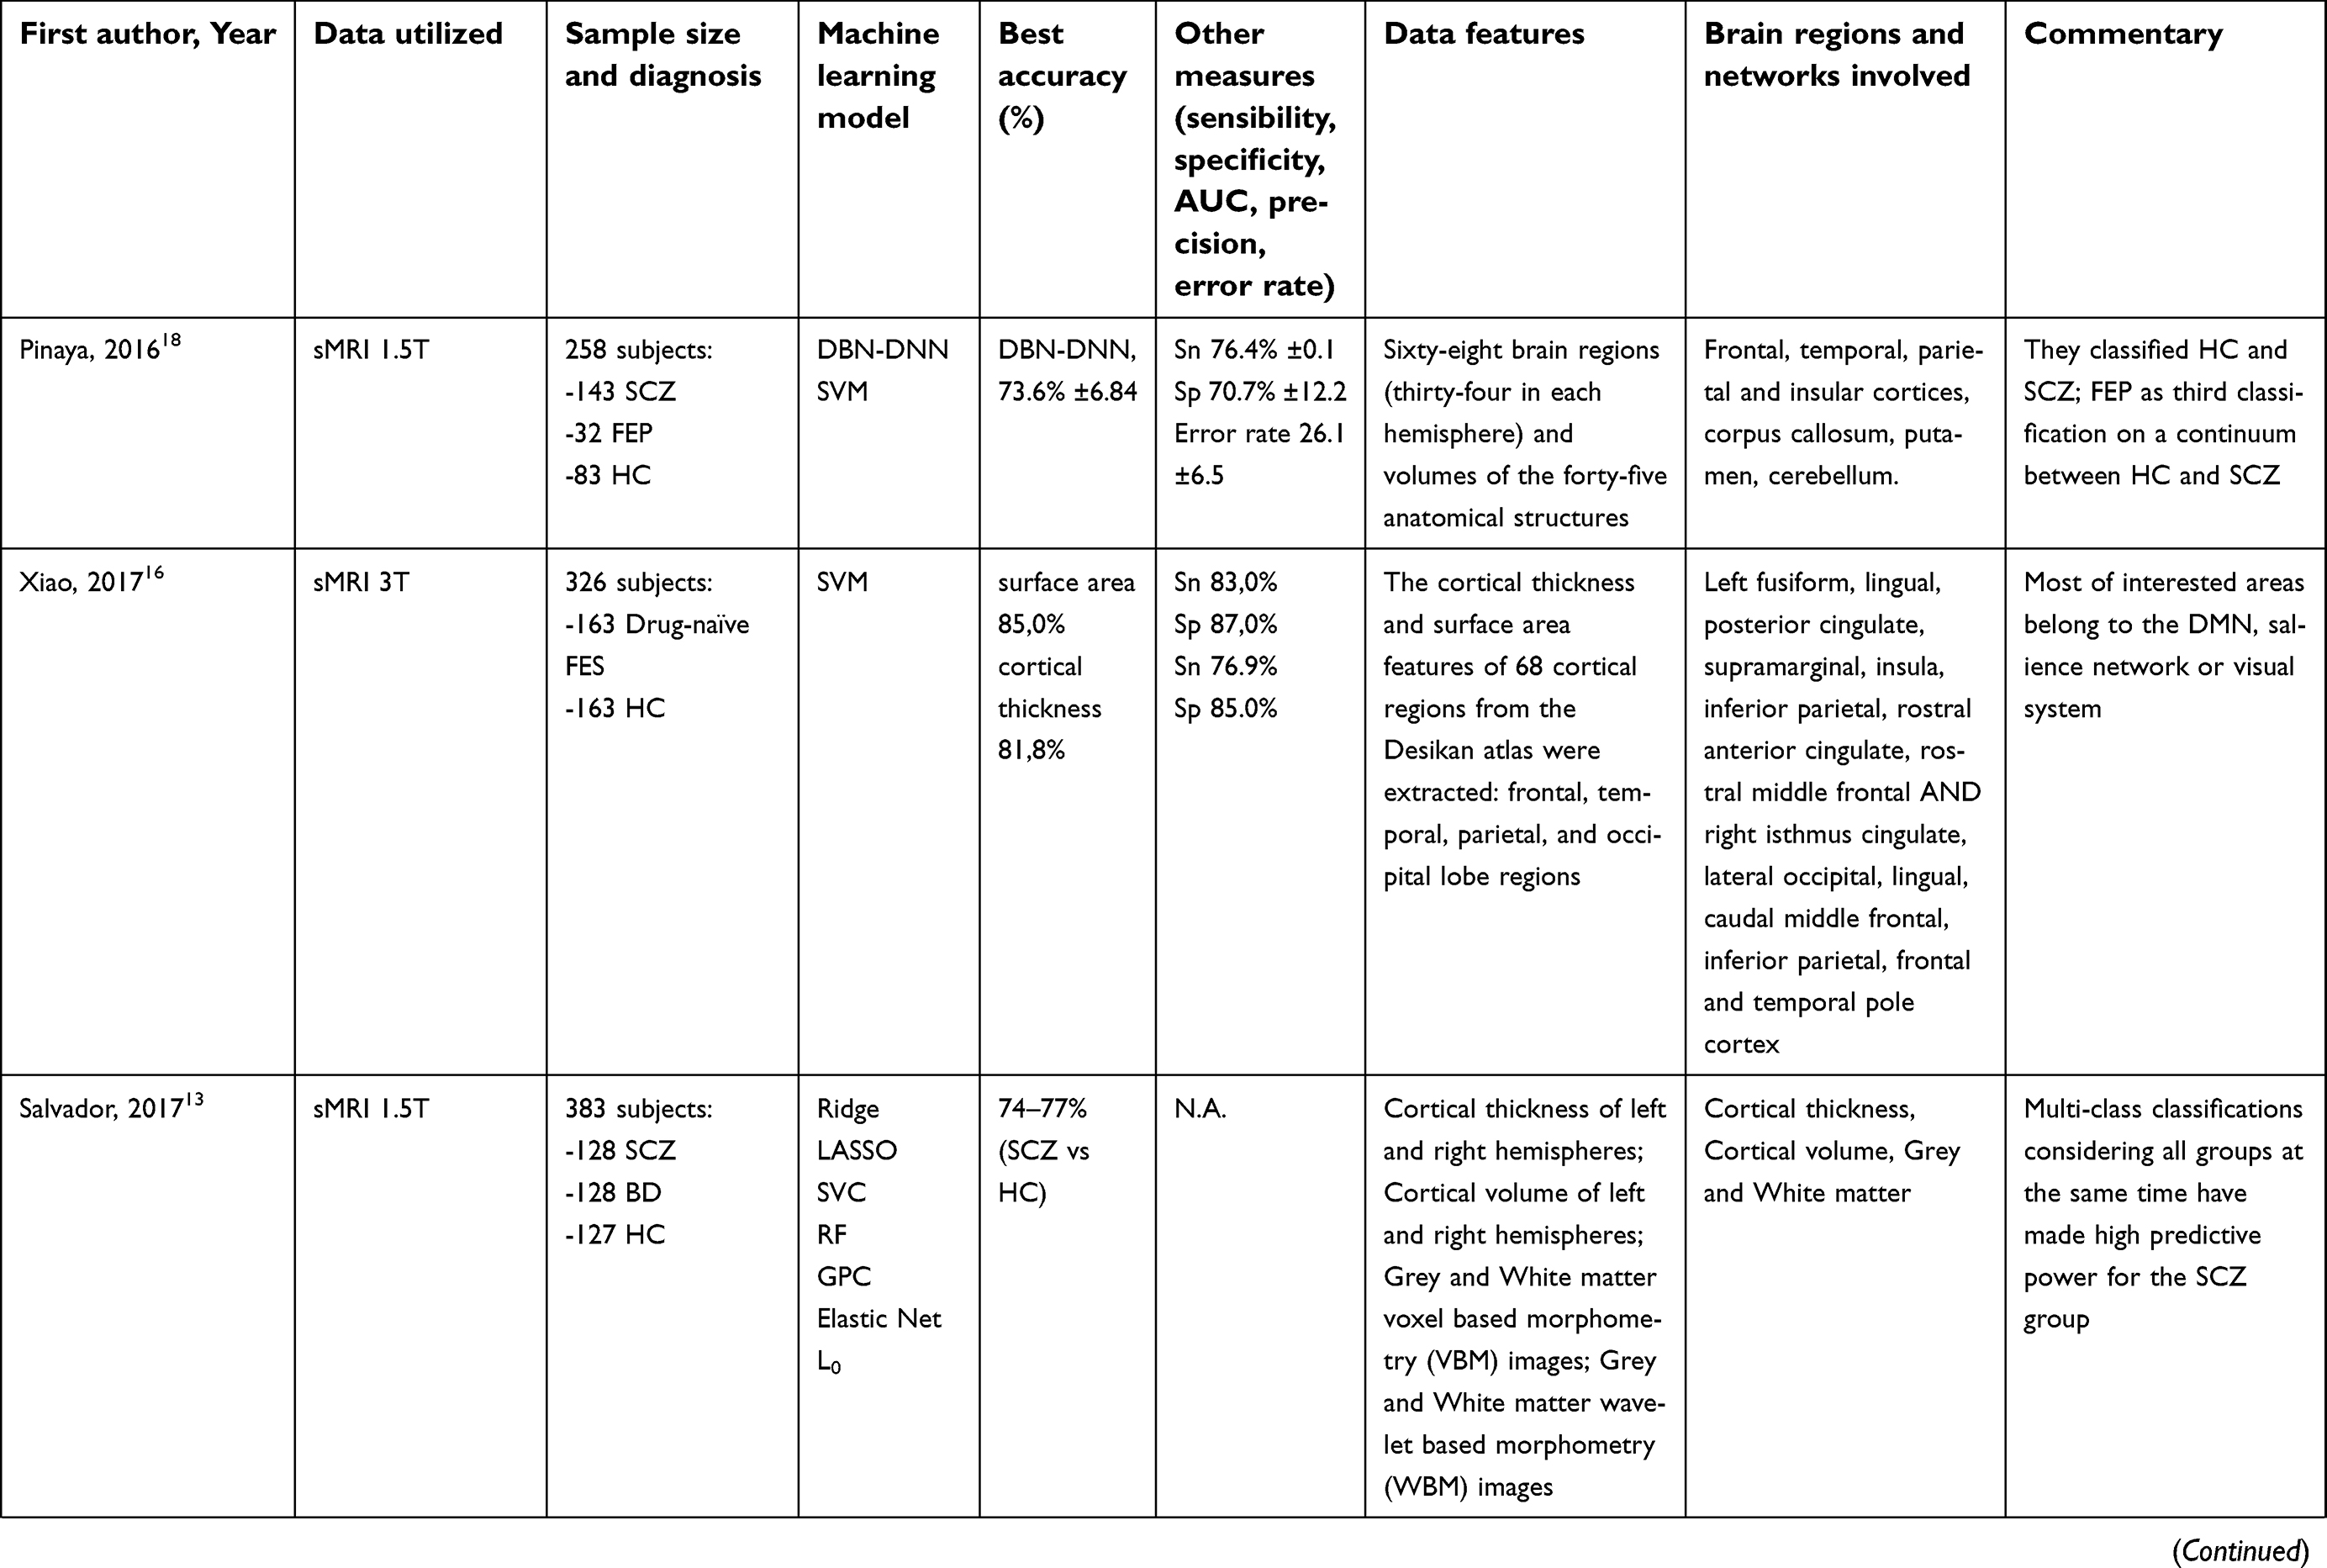
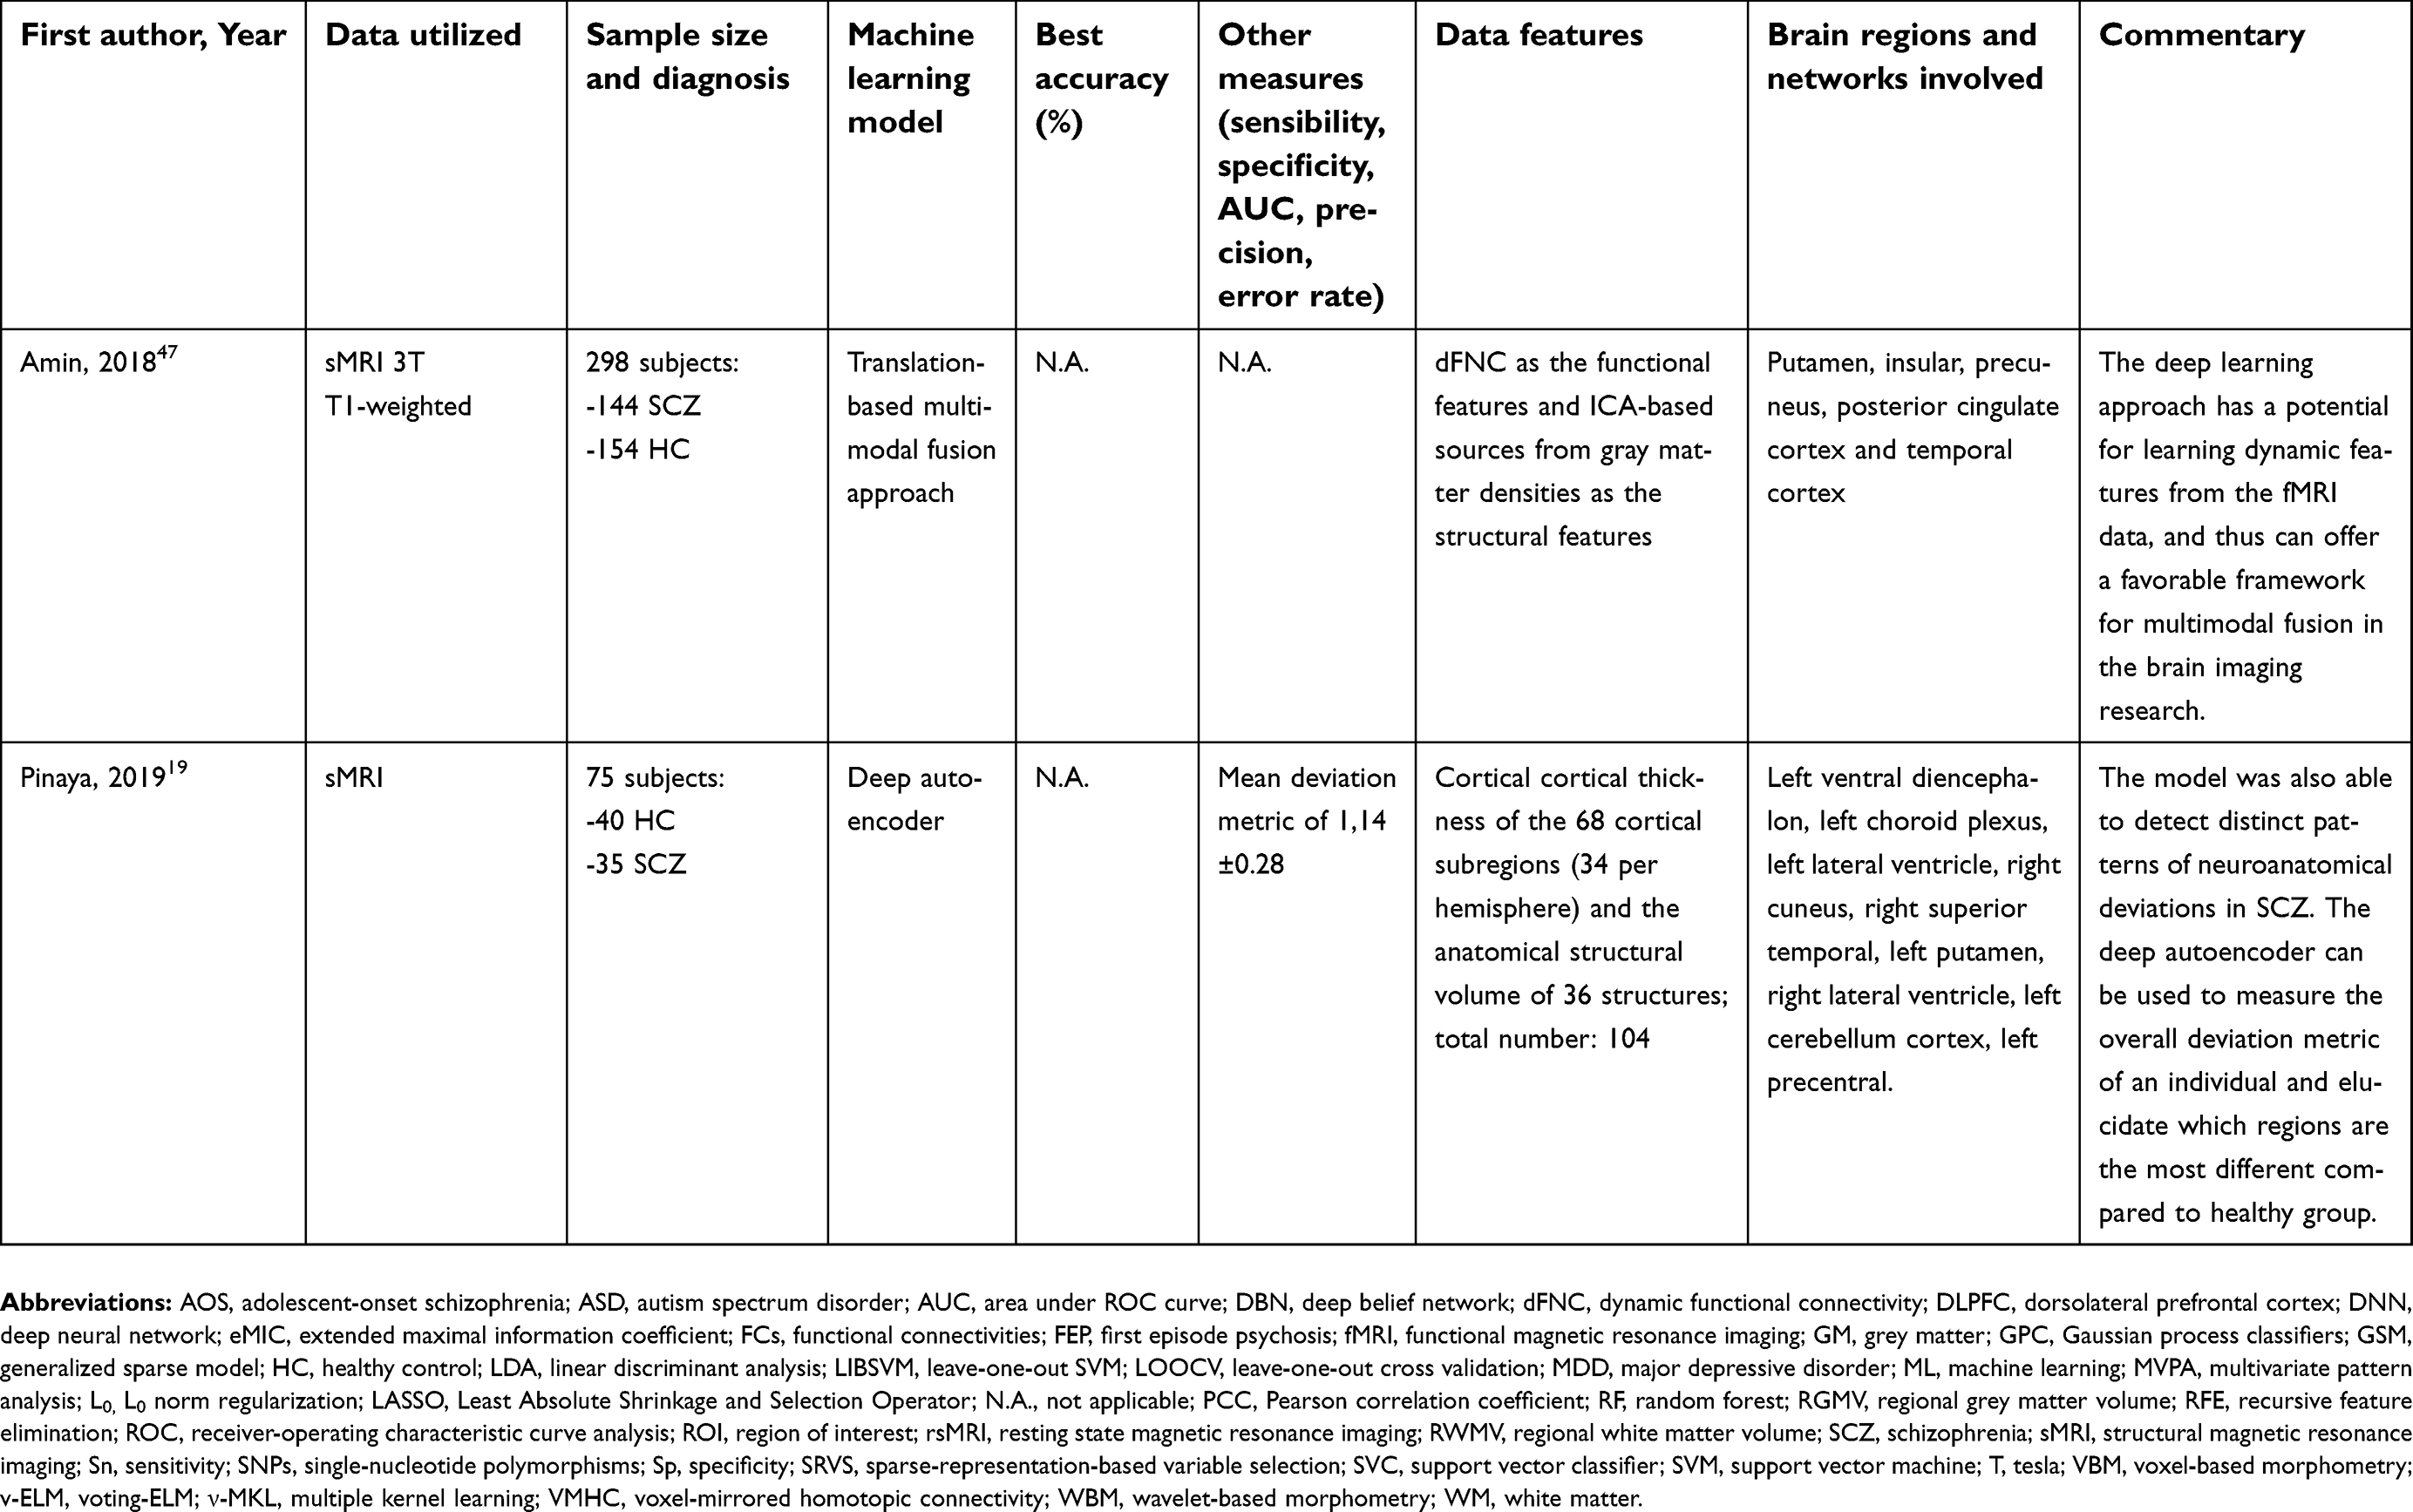
Eight studies used structural magnetic resonance imaging (sMRI) in order to distinguish patients with SCZ or adolescent-onset schizophrenia (AOS) or FES from patients with other psychiatric disorders (eg, bipolar disorder (BD), major depressive disorder (MDD)) or HC (Table 1). In particular, many of these studies focused on differences between grey matter (GM) and white matter (WM).
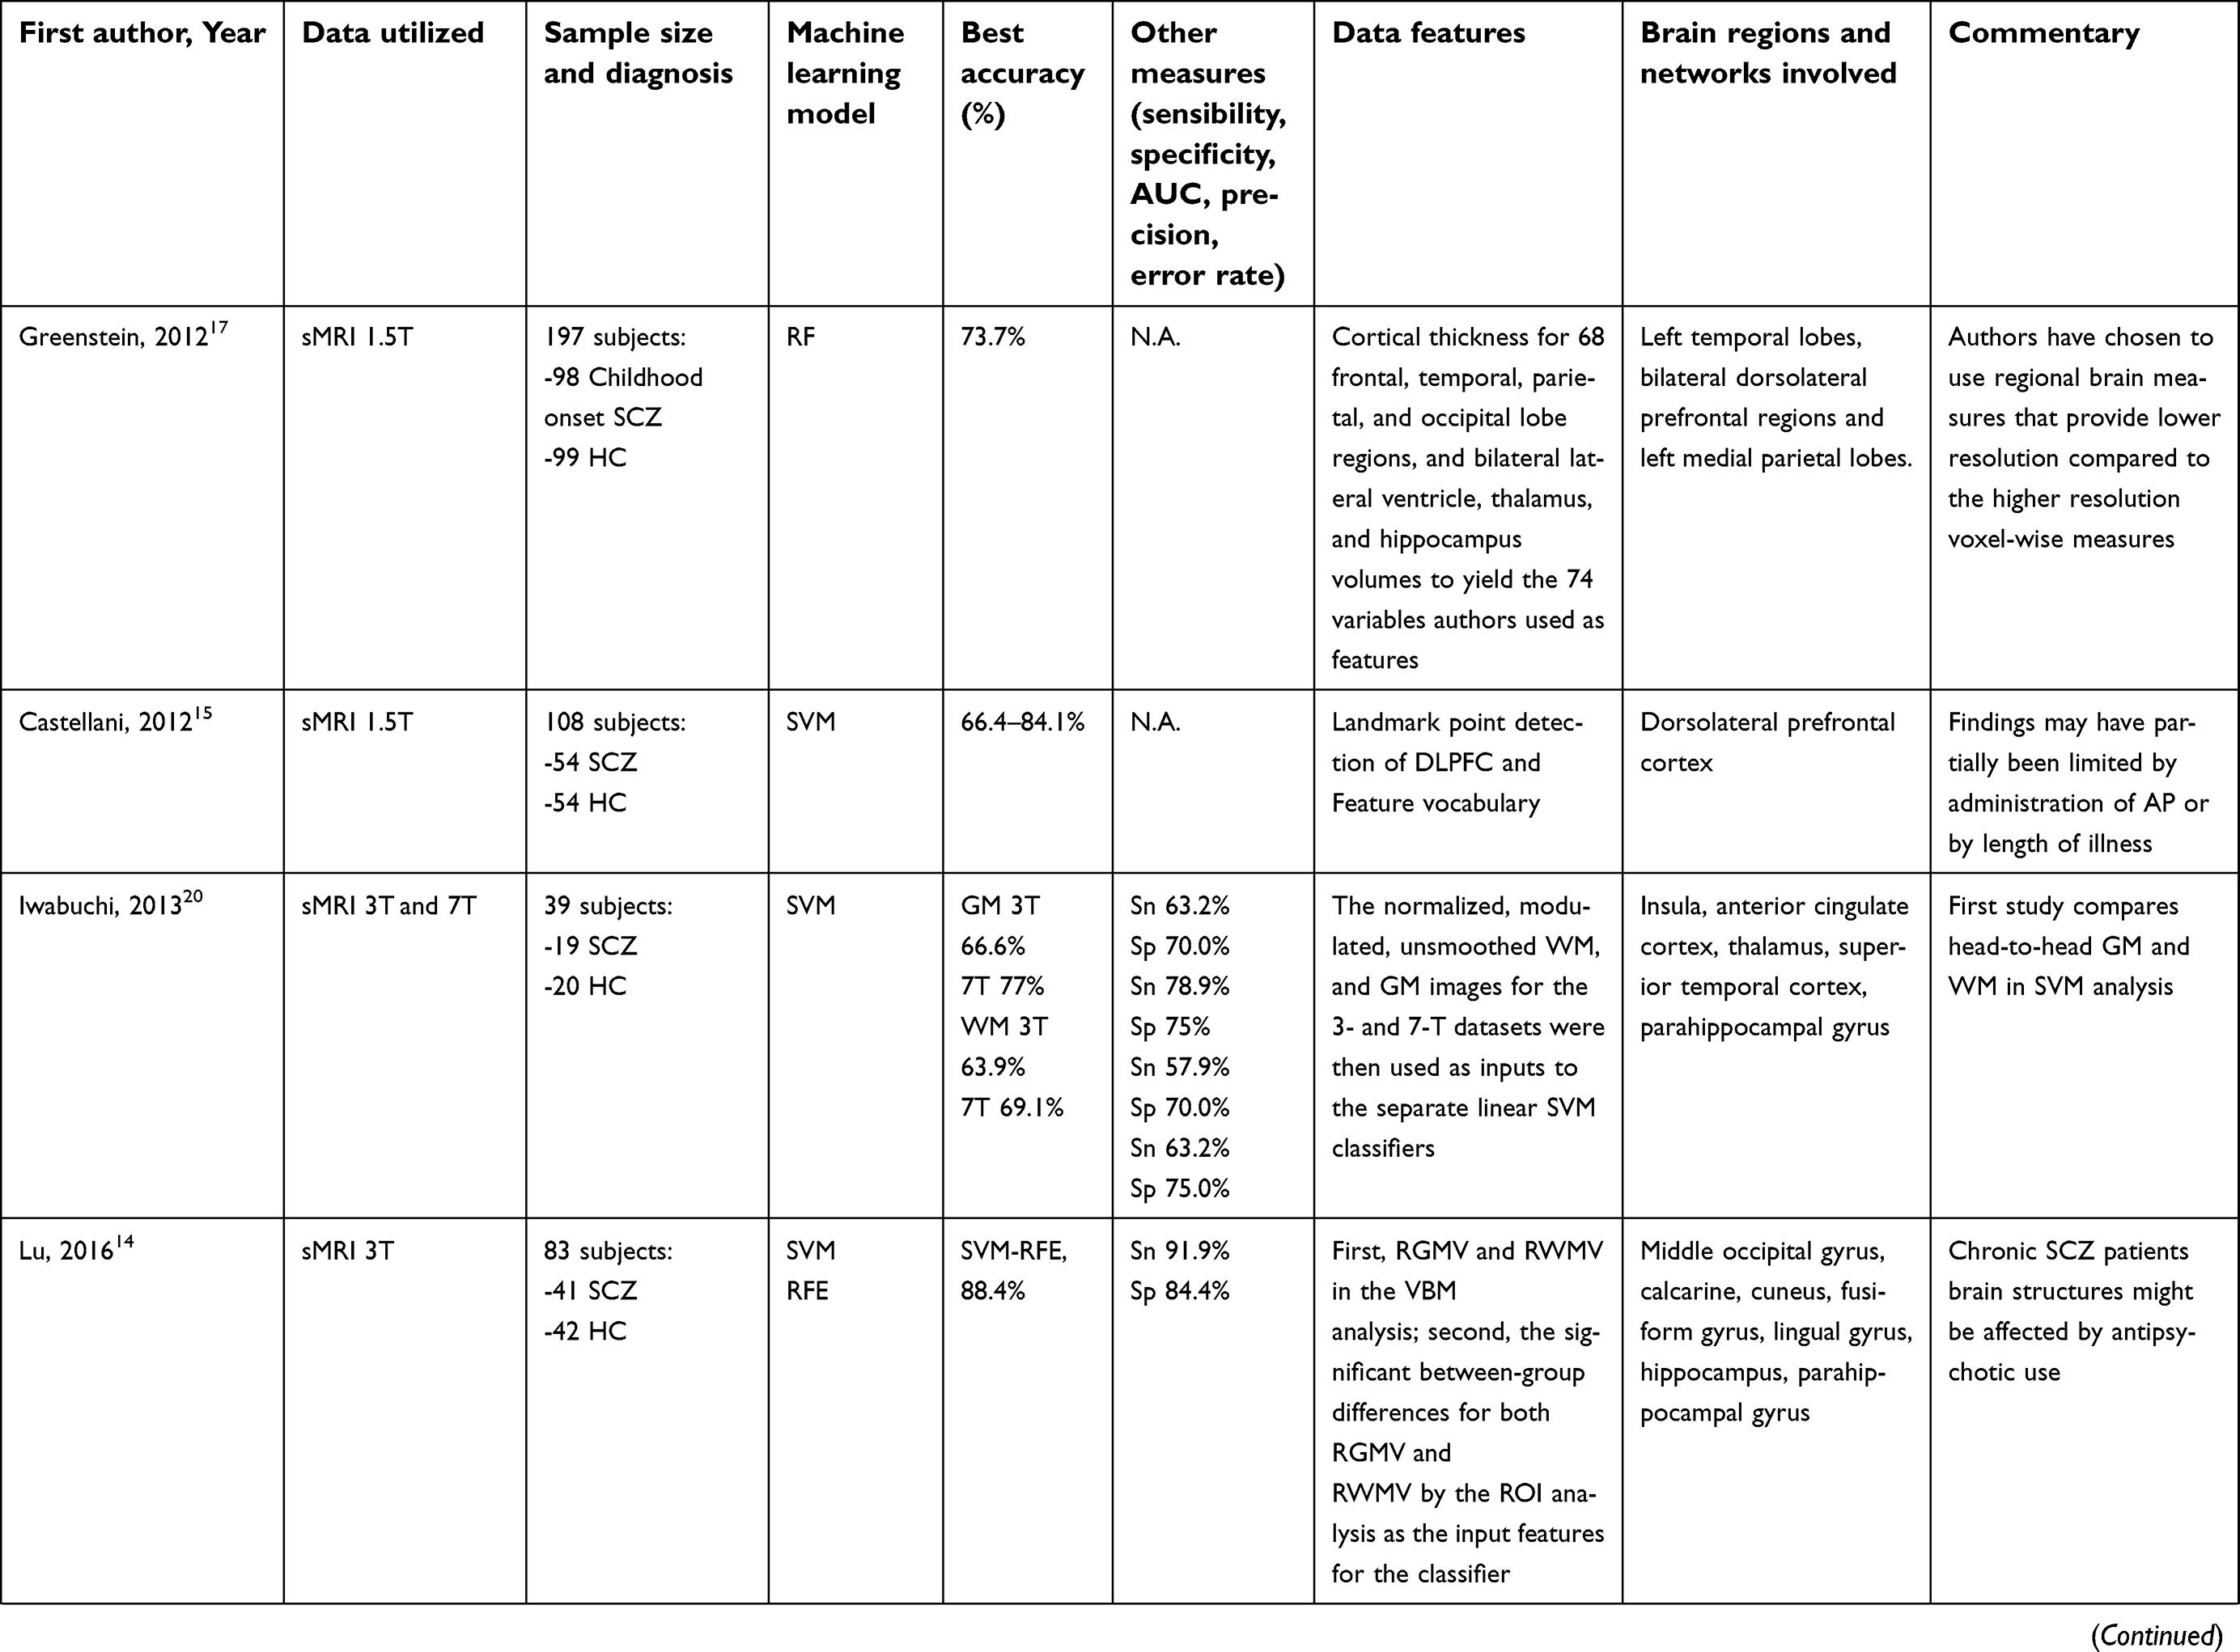 | Table 1 Summary of included studies of machine learning techniques classifying schizophrenia using structural neuroimaging |
 | Table 1 (Continued). |
 | Table 1 (Continued). |
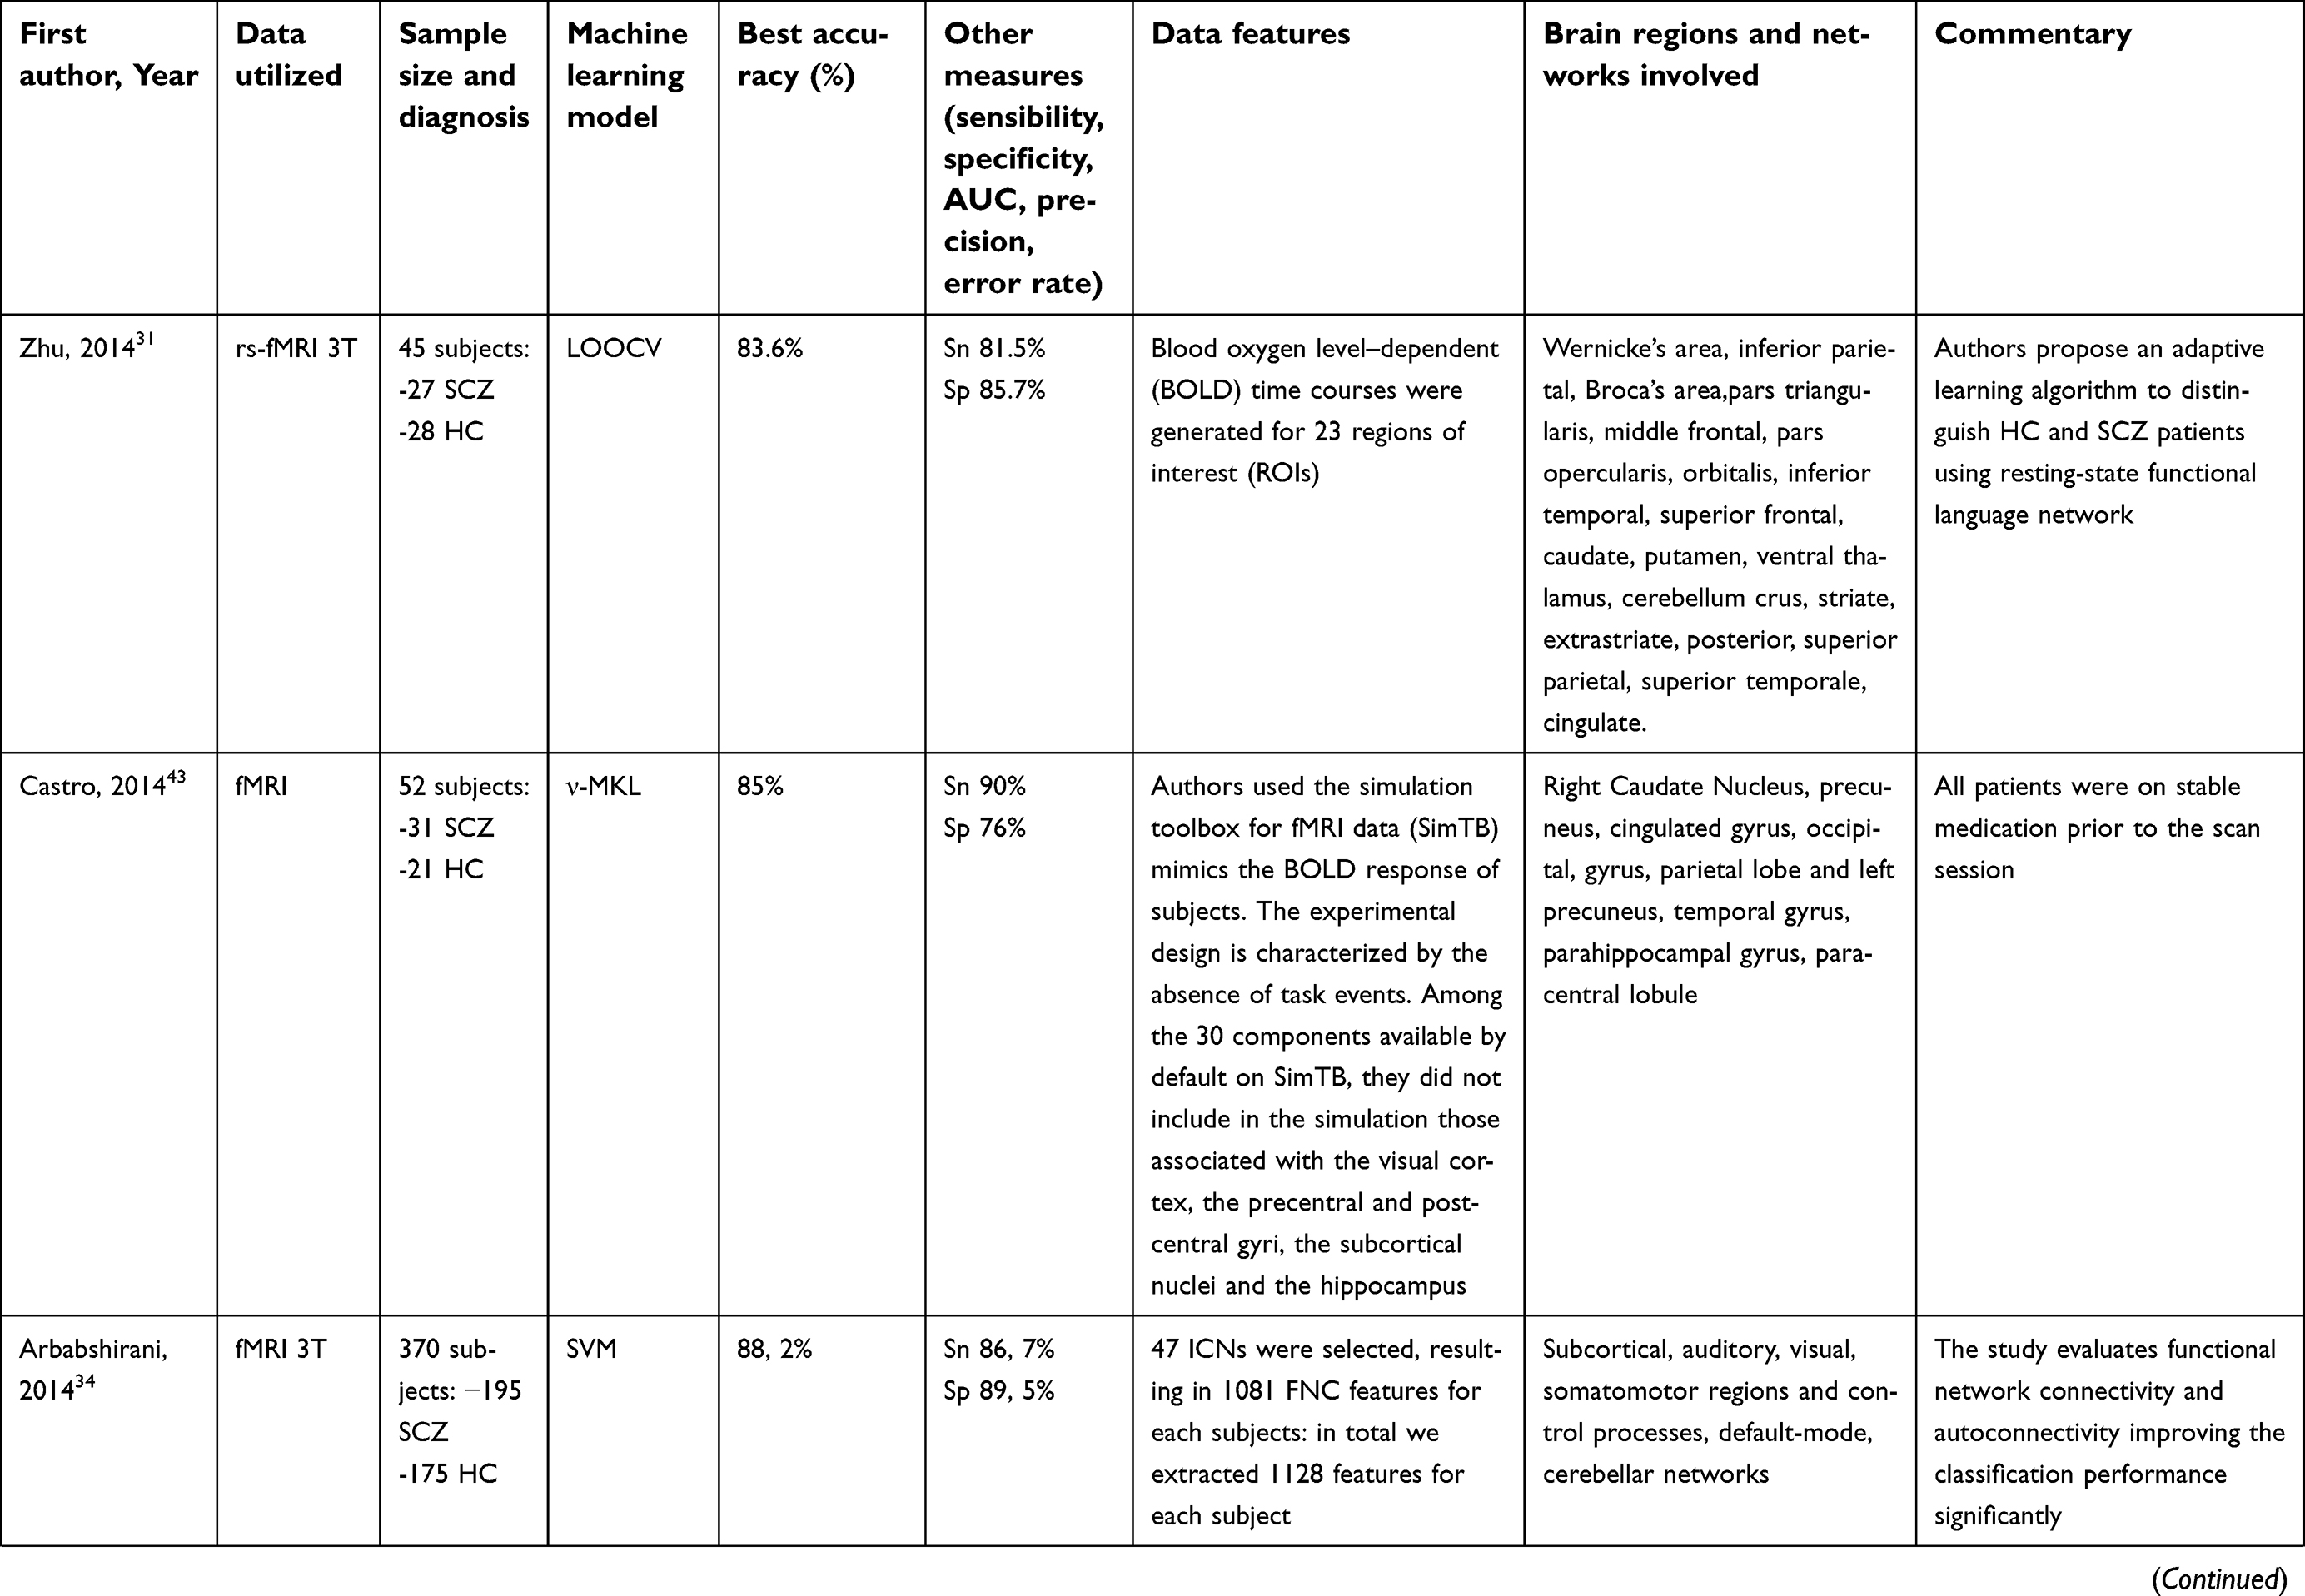
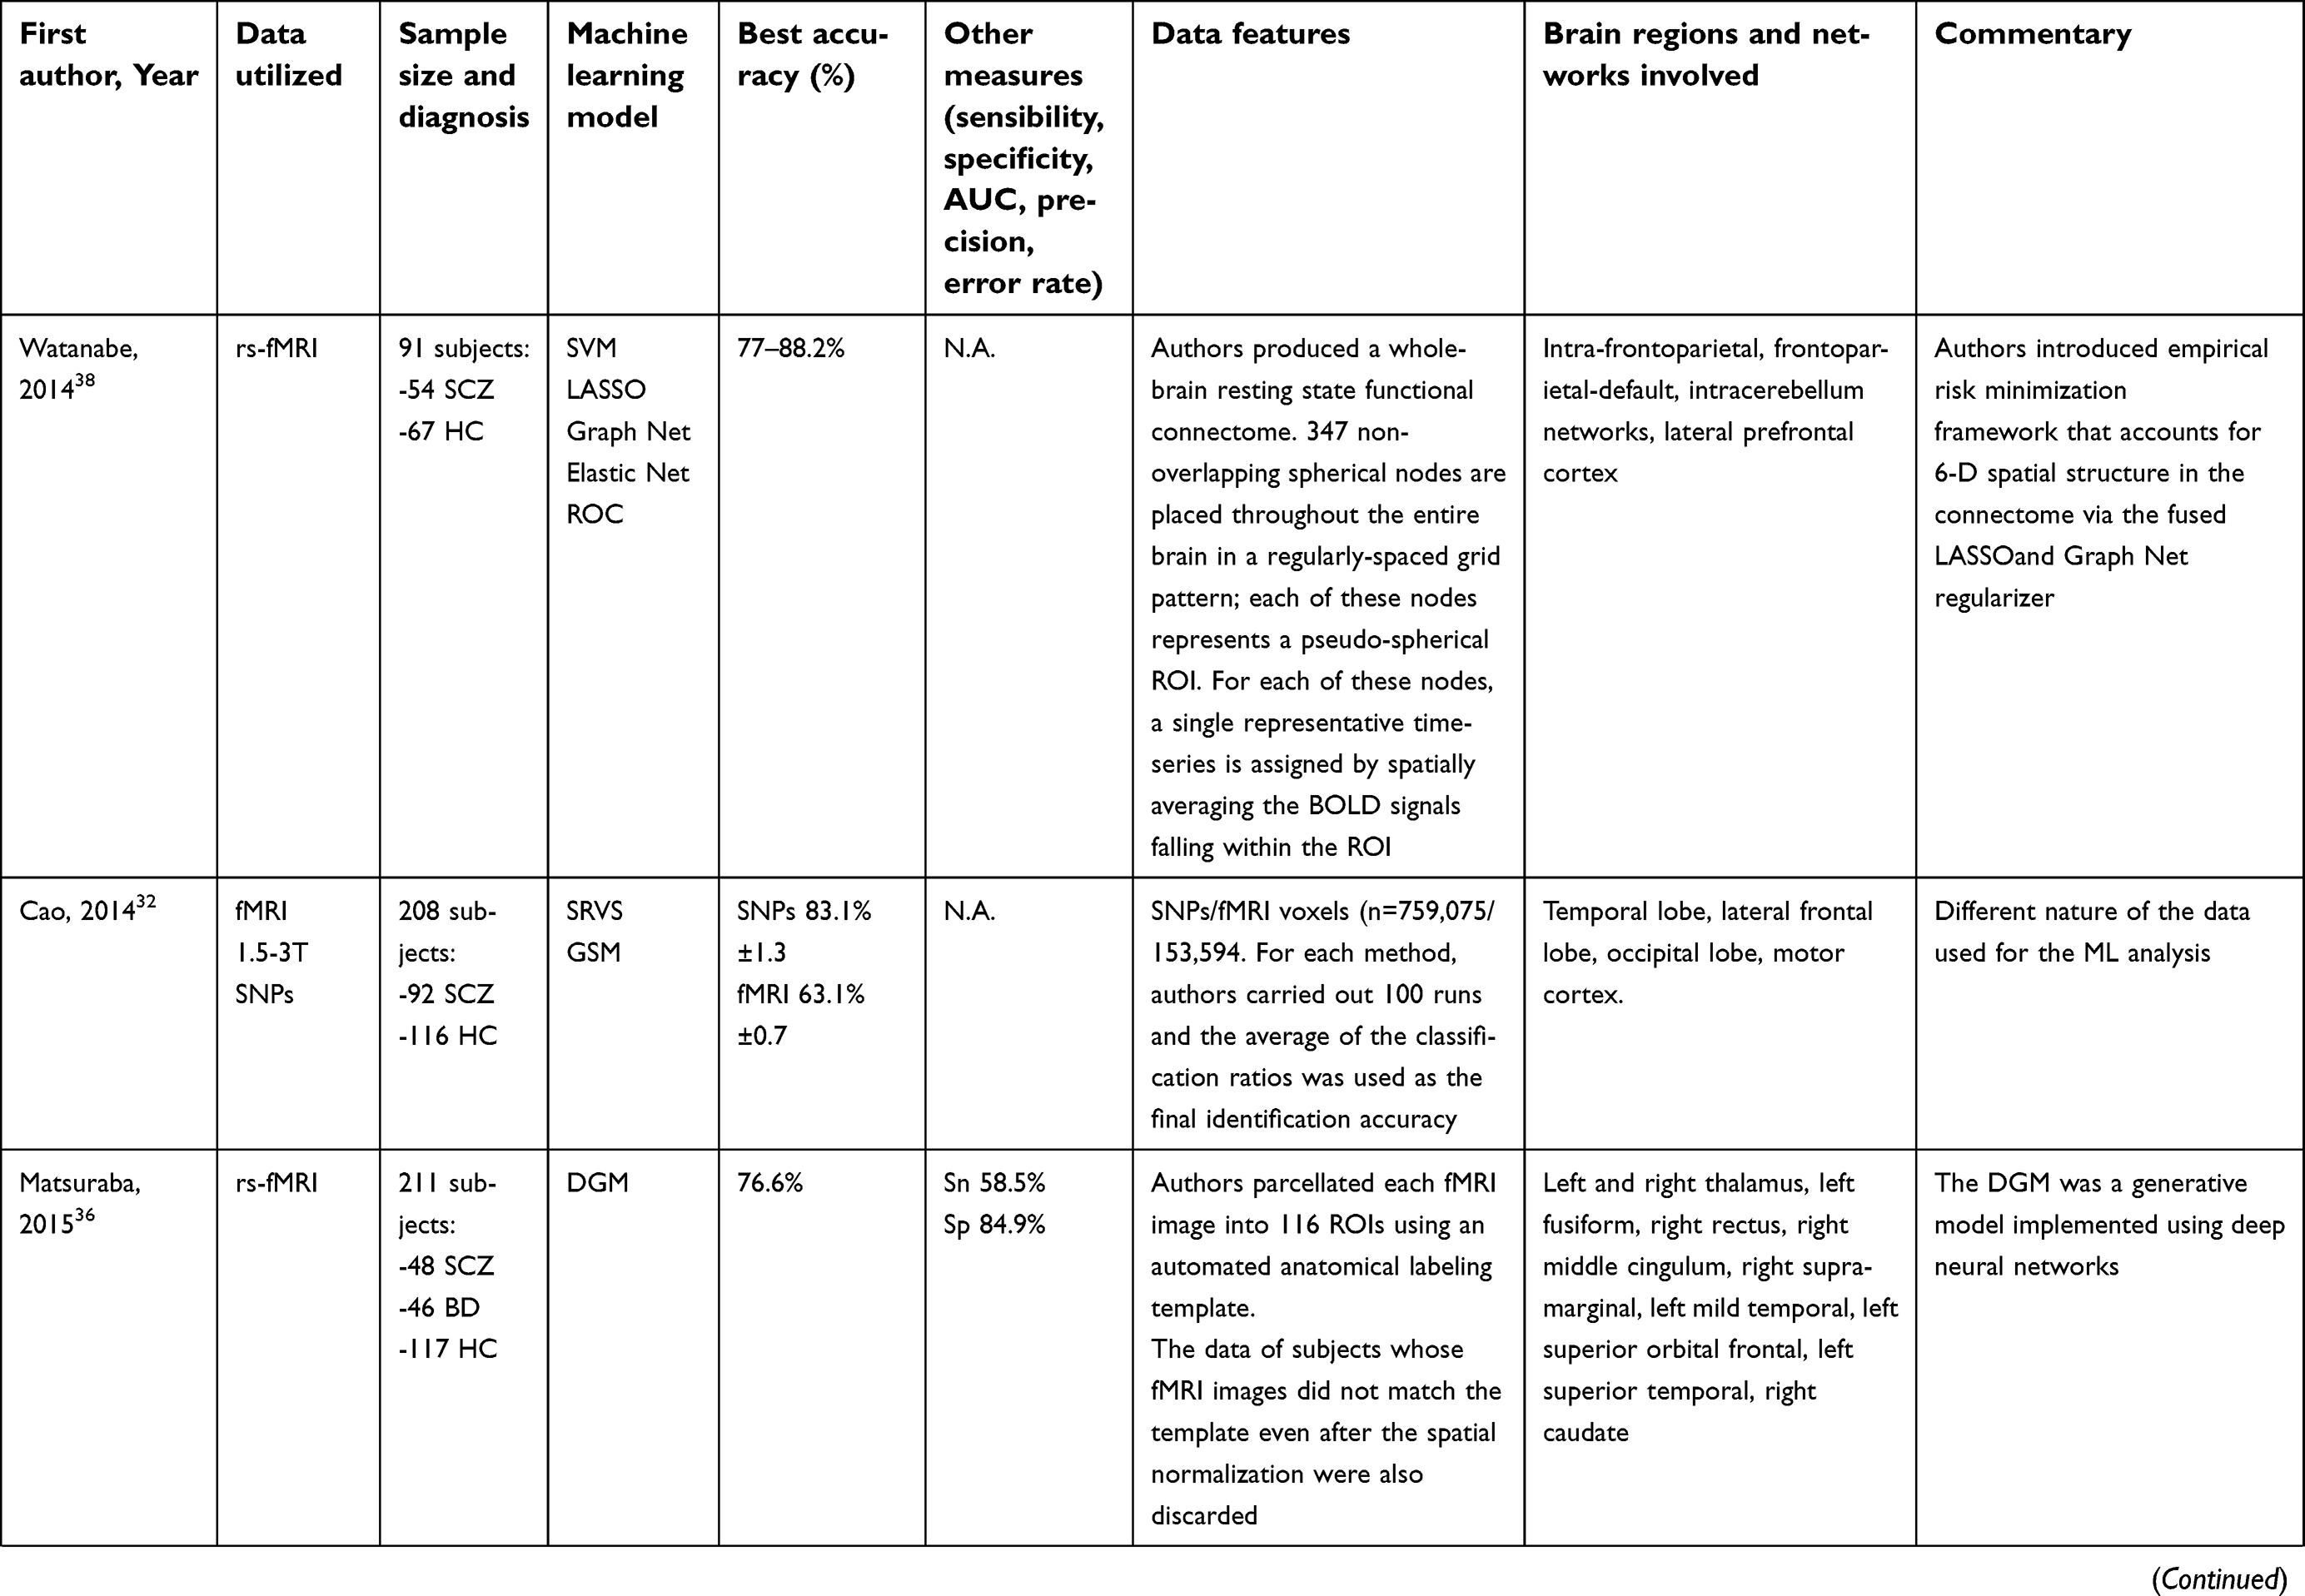
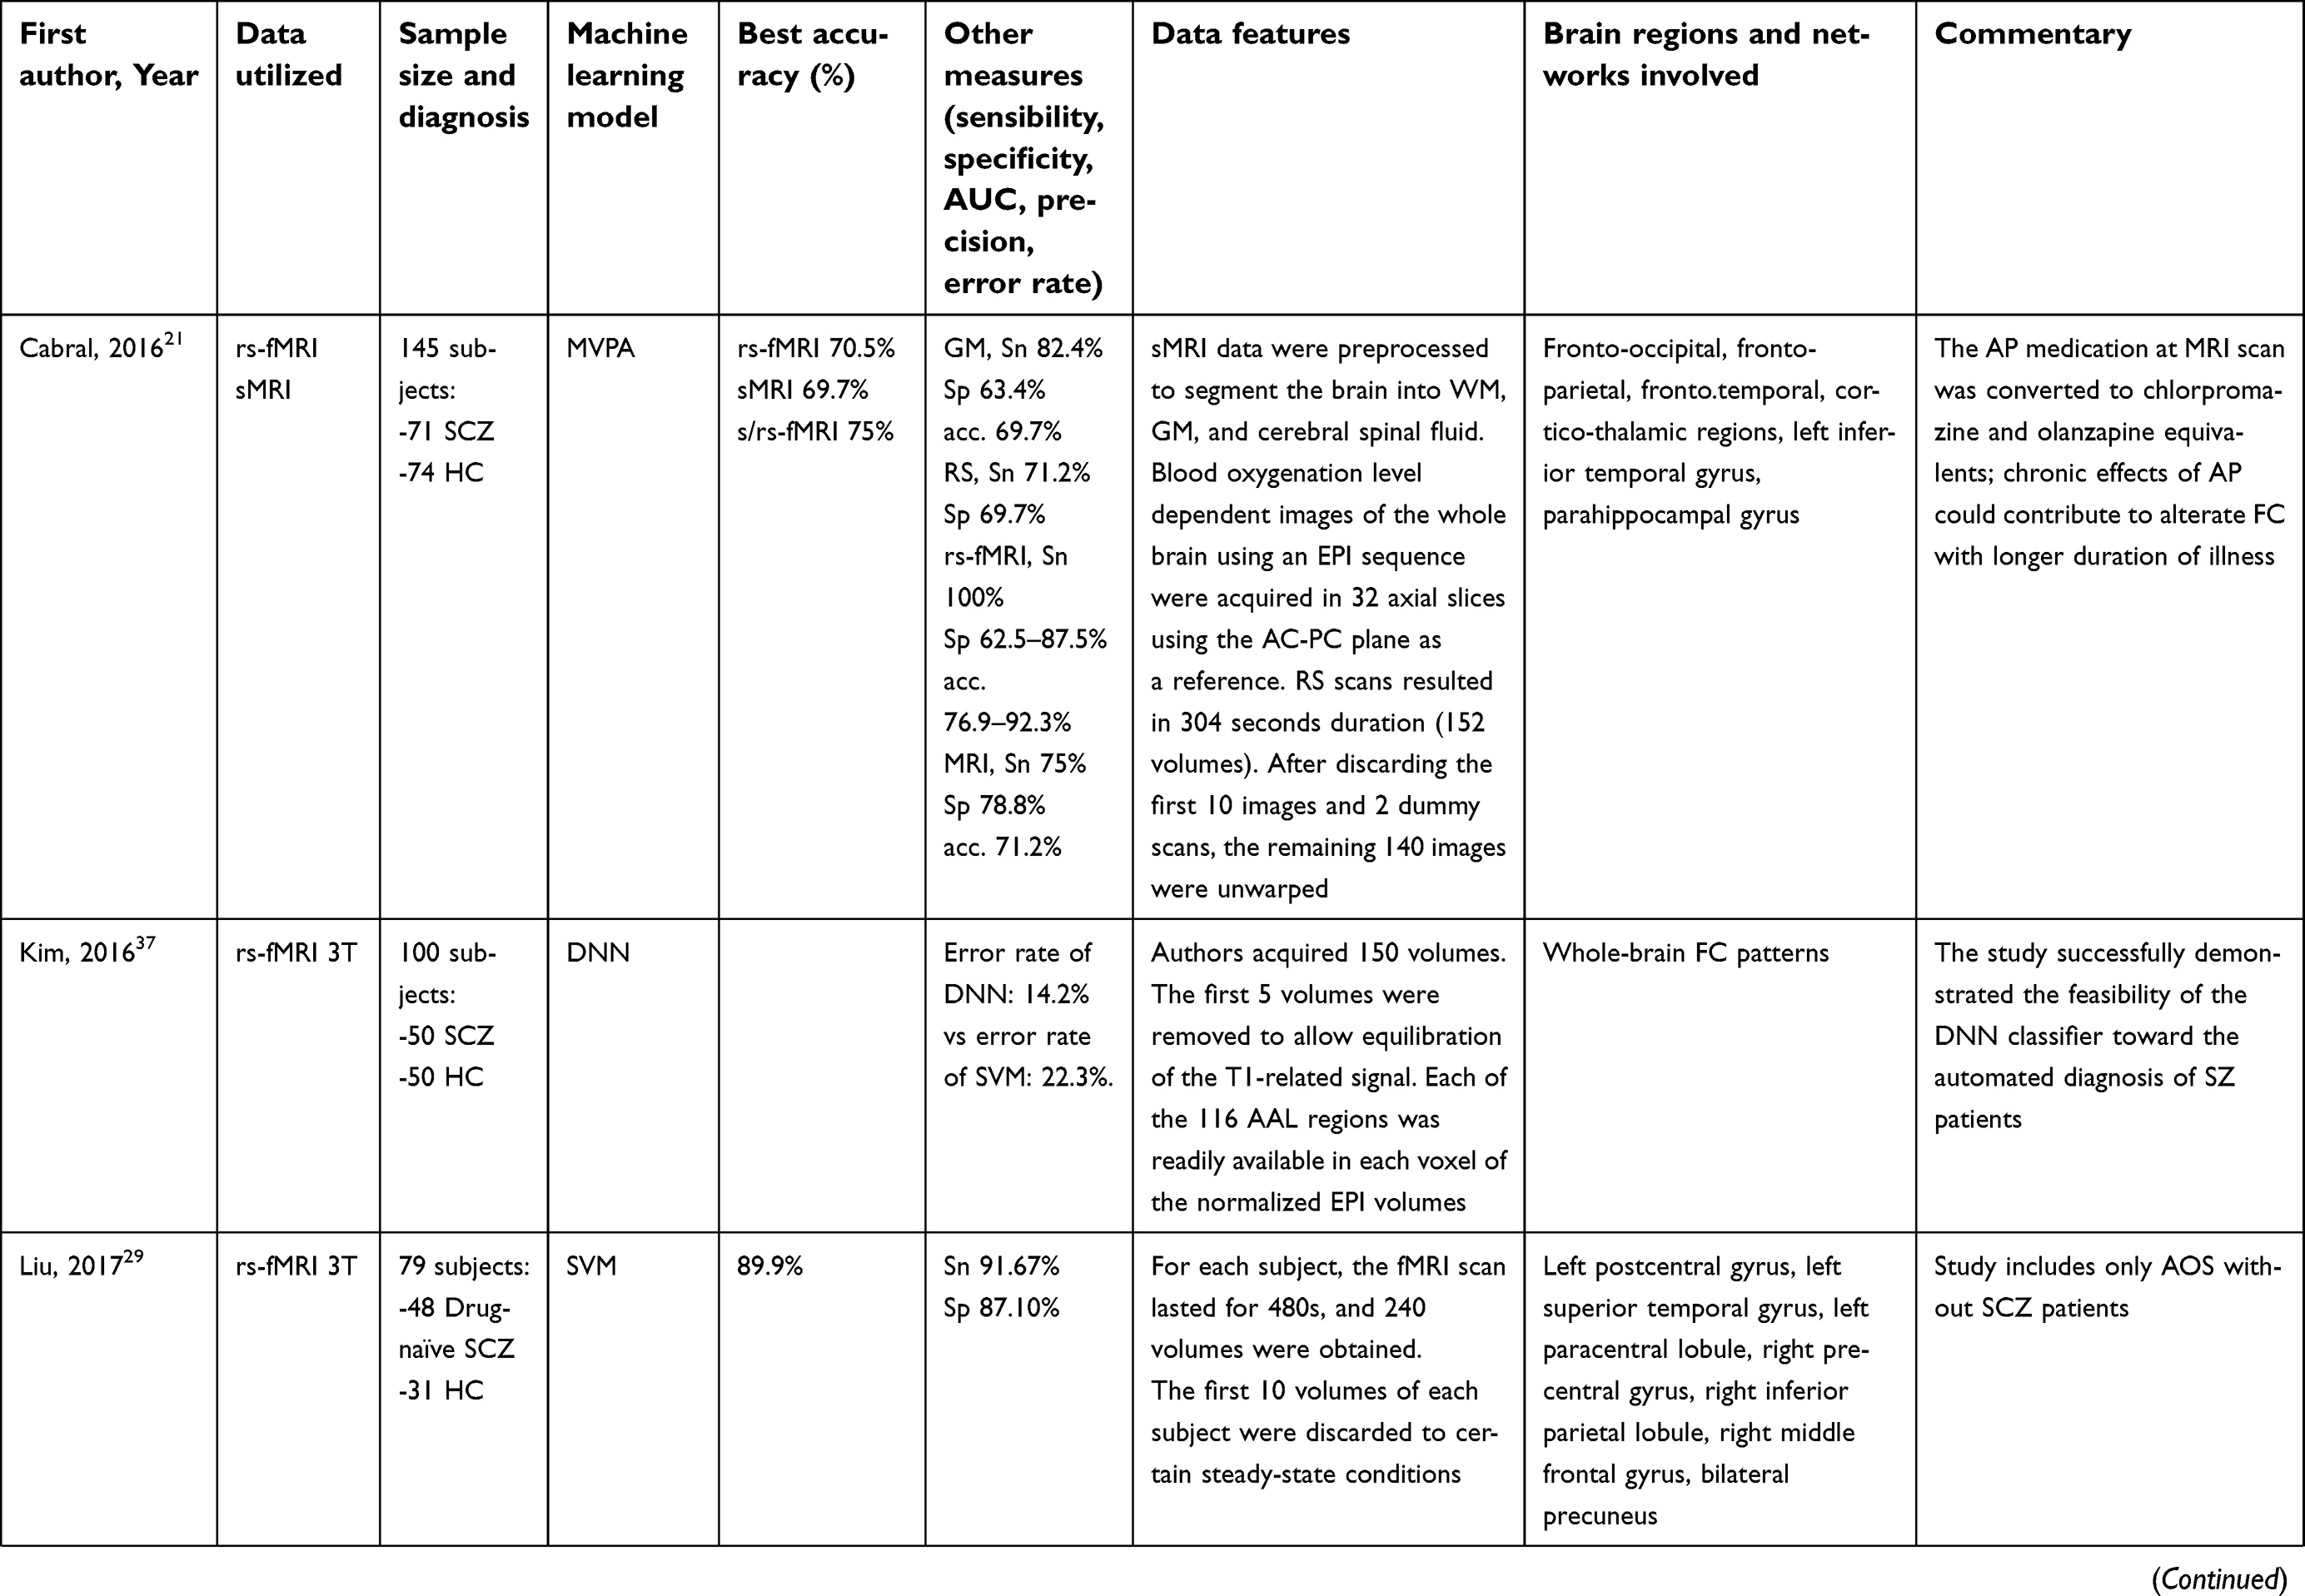
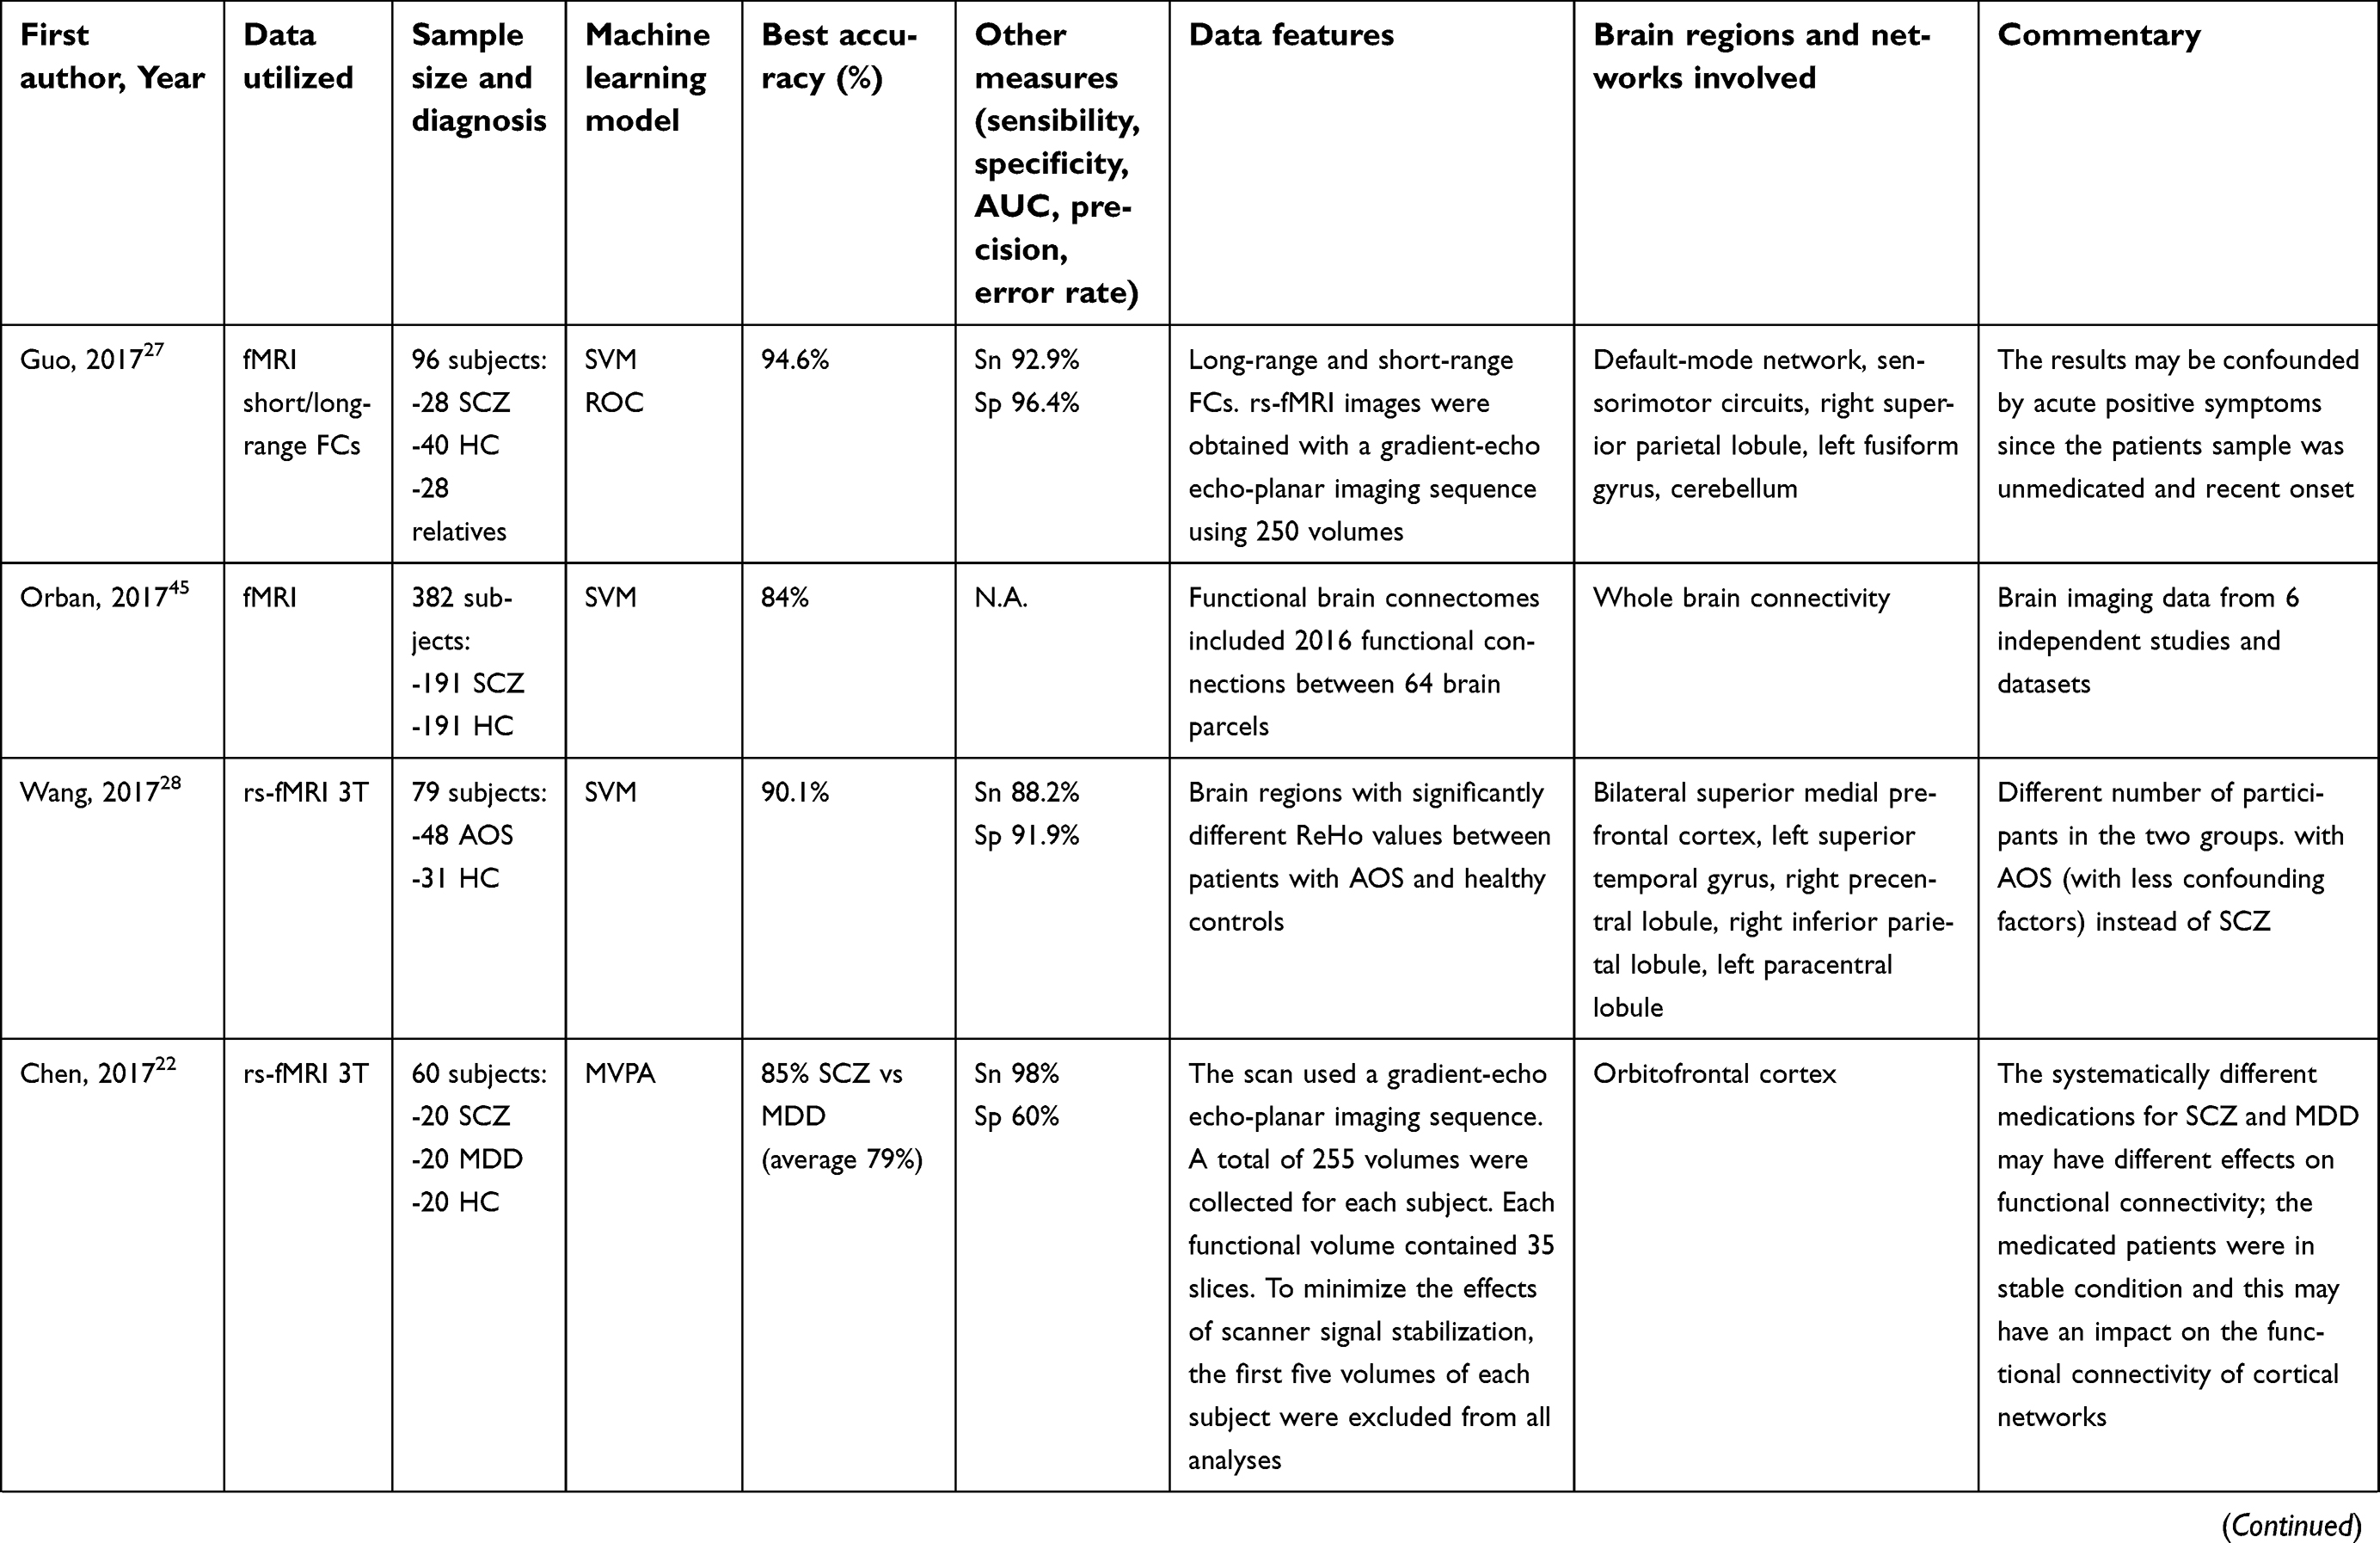
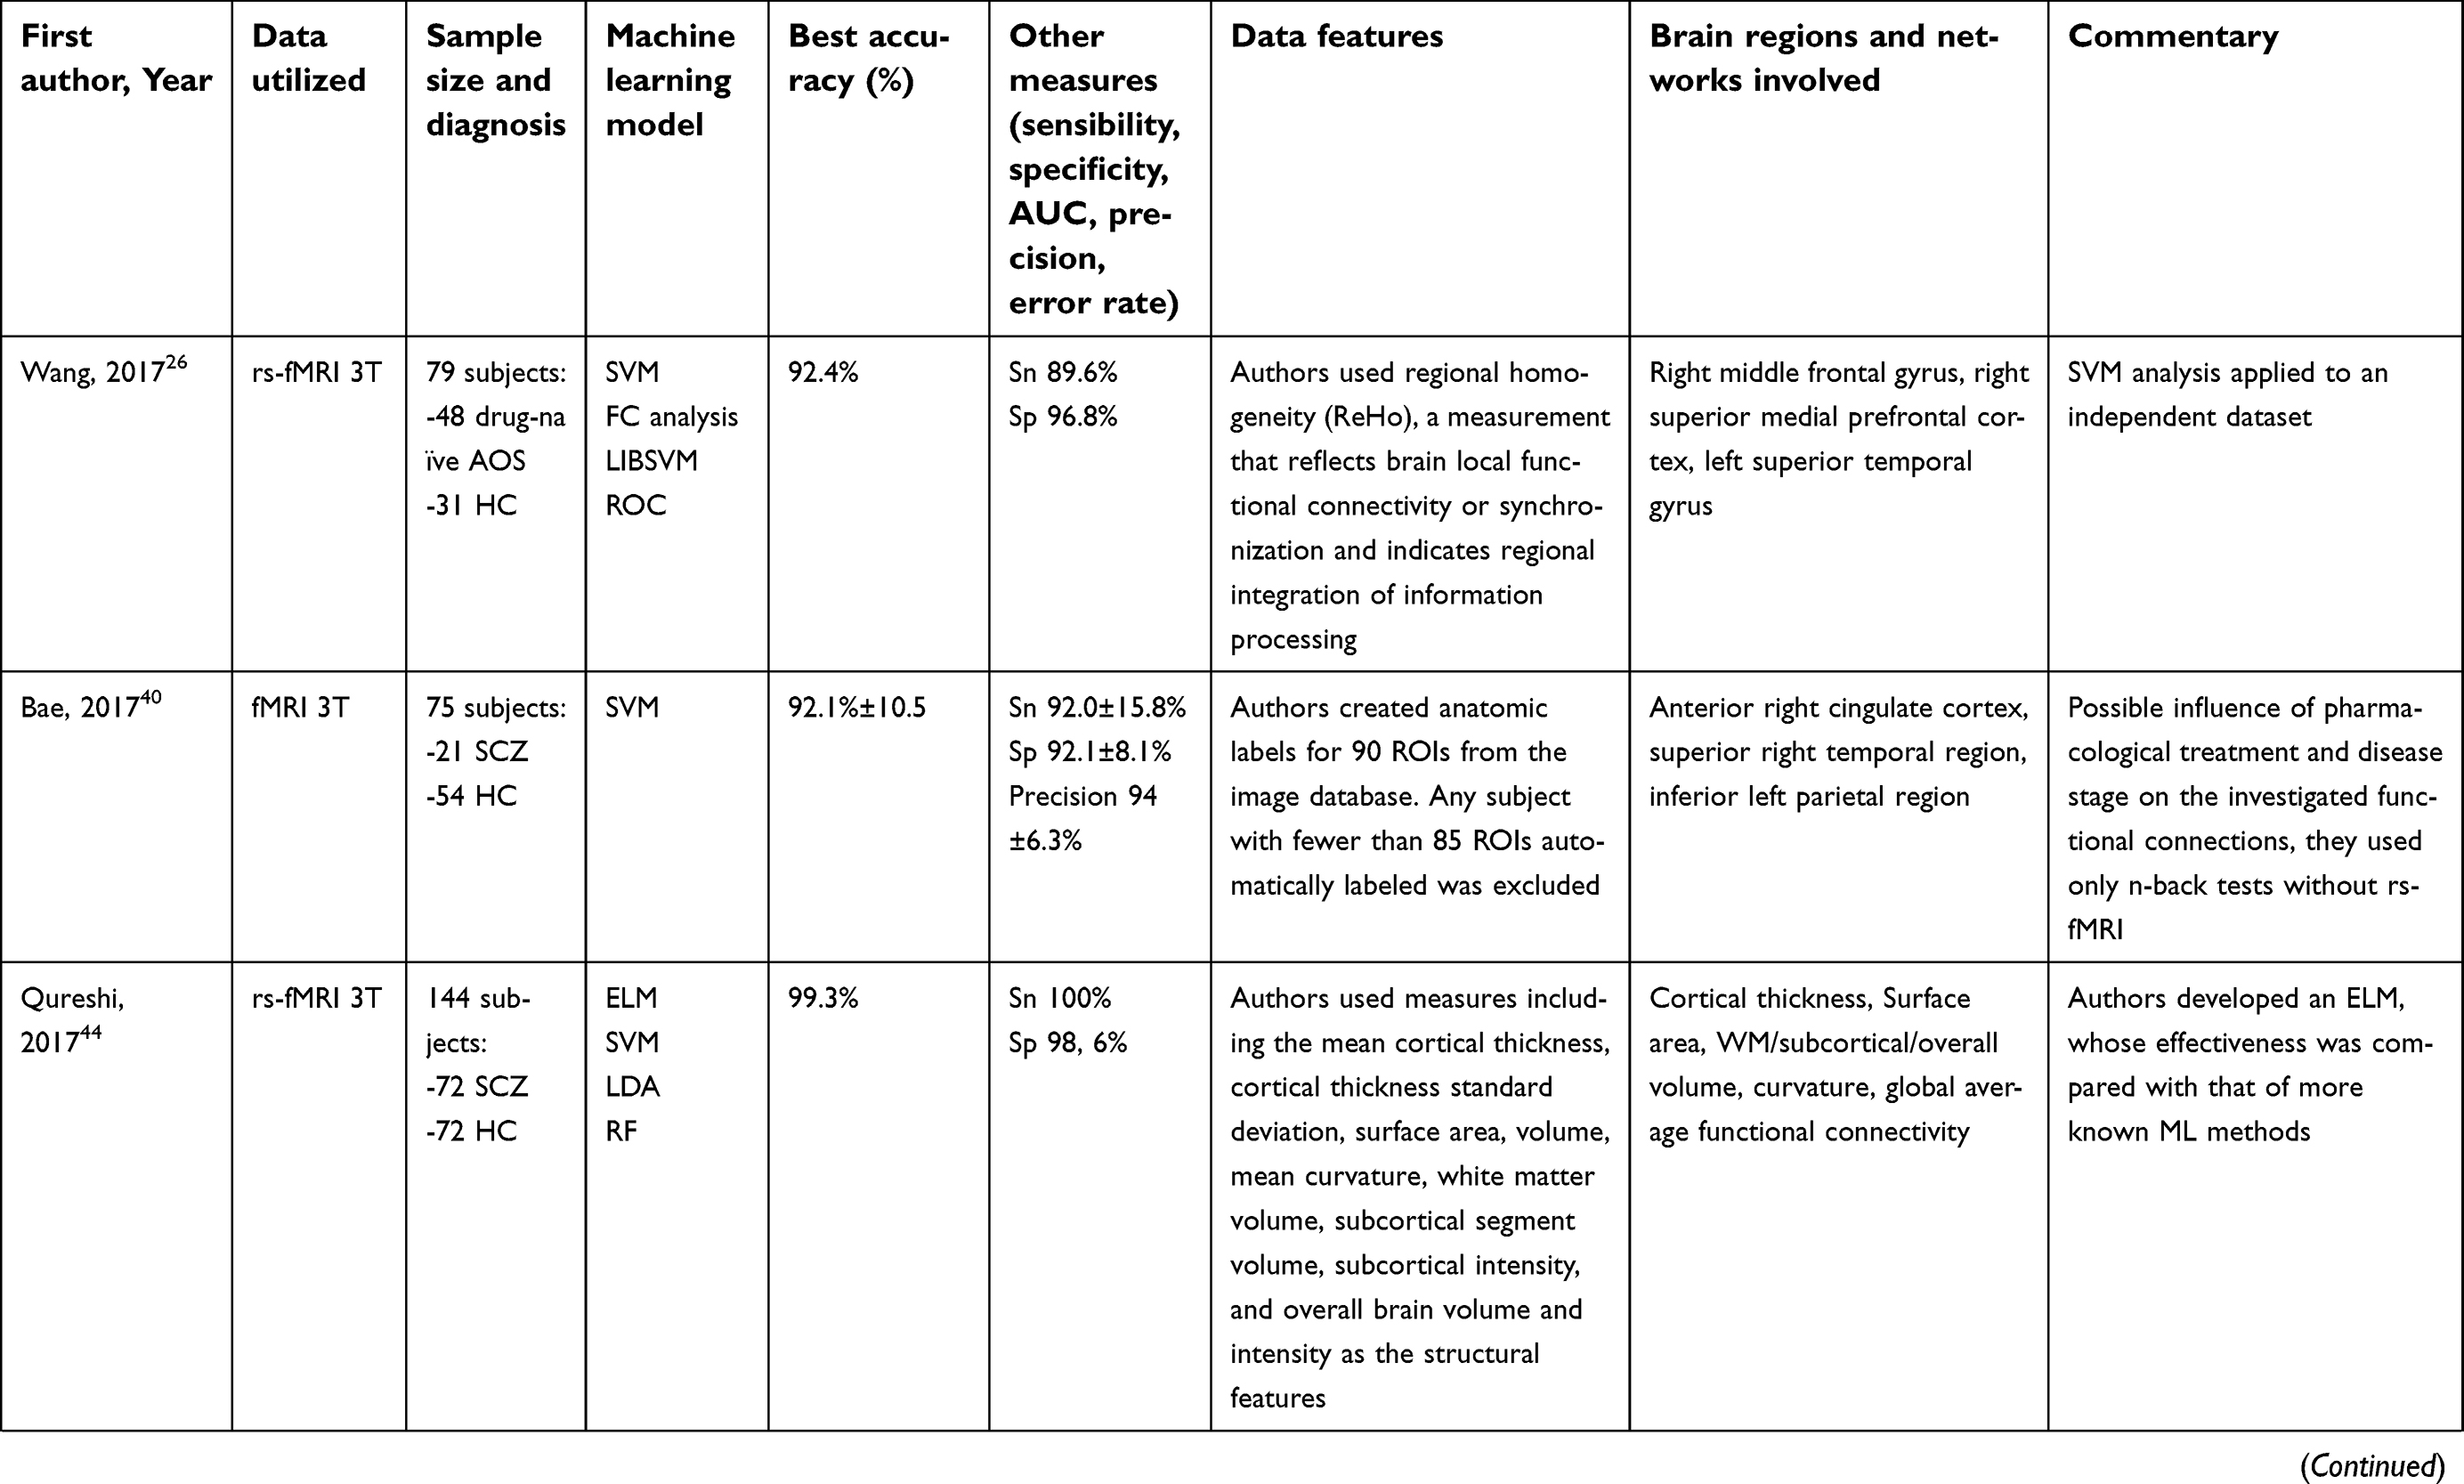
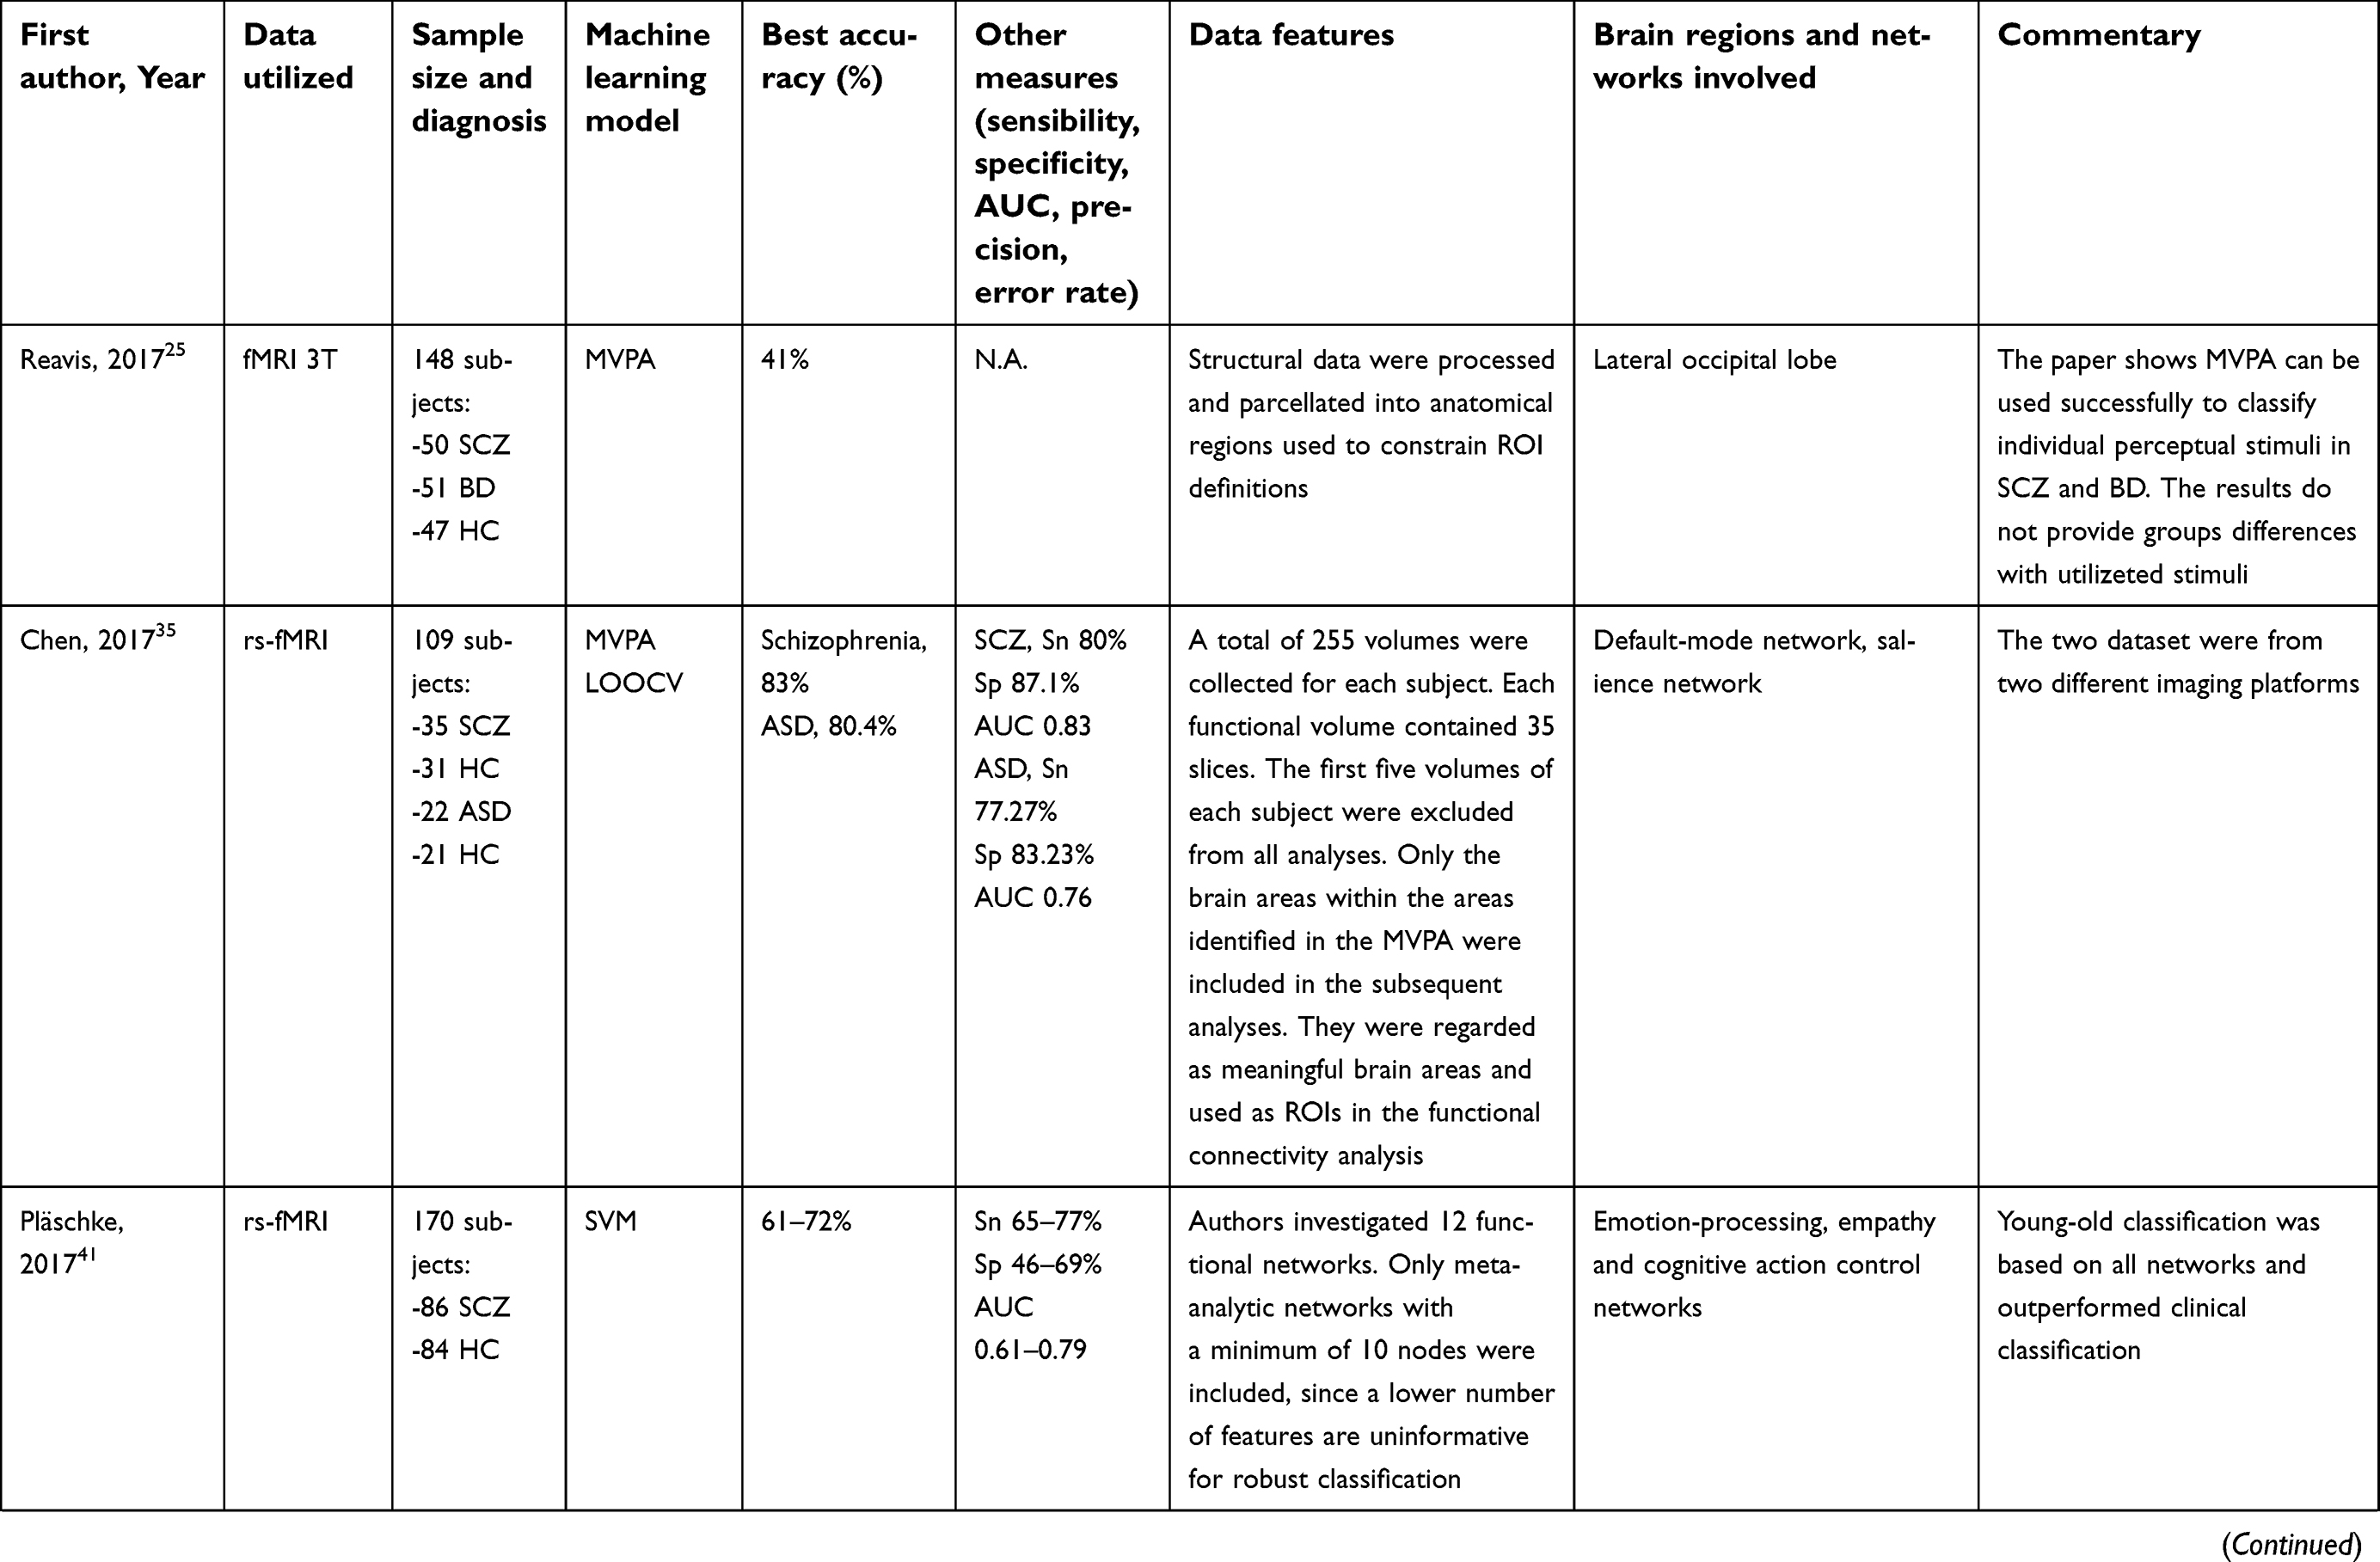
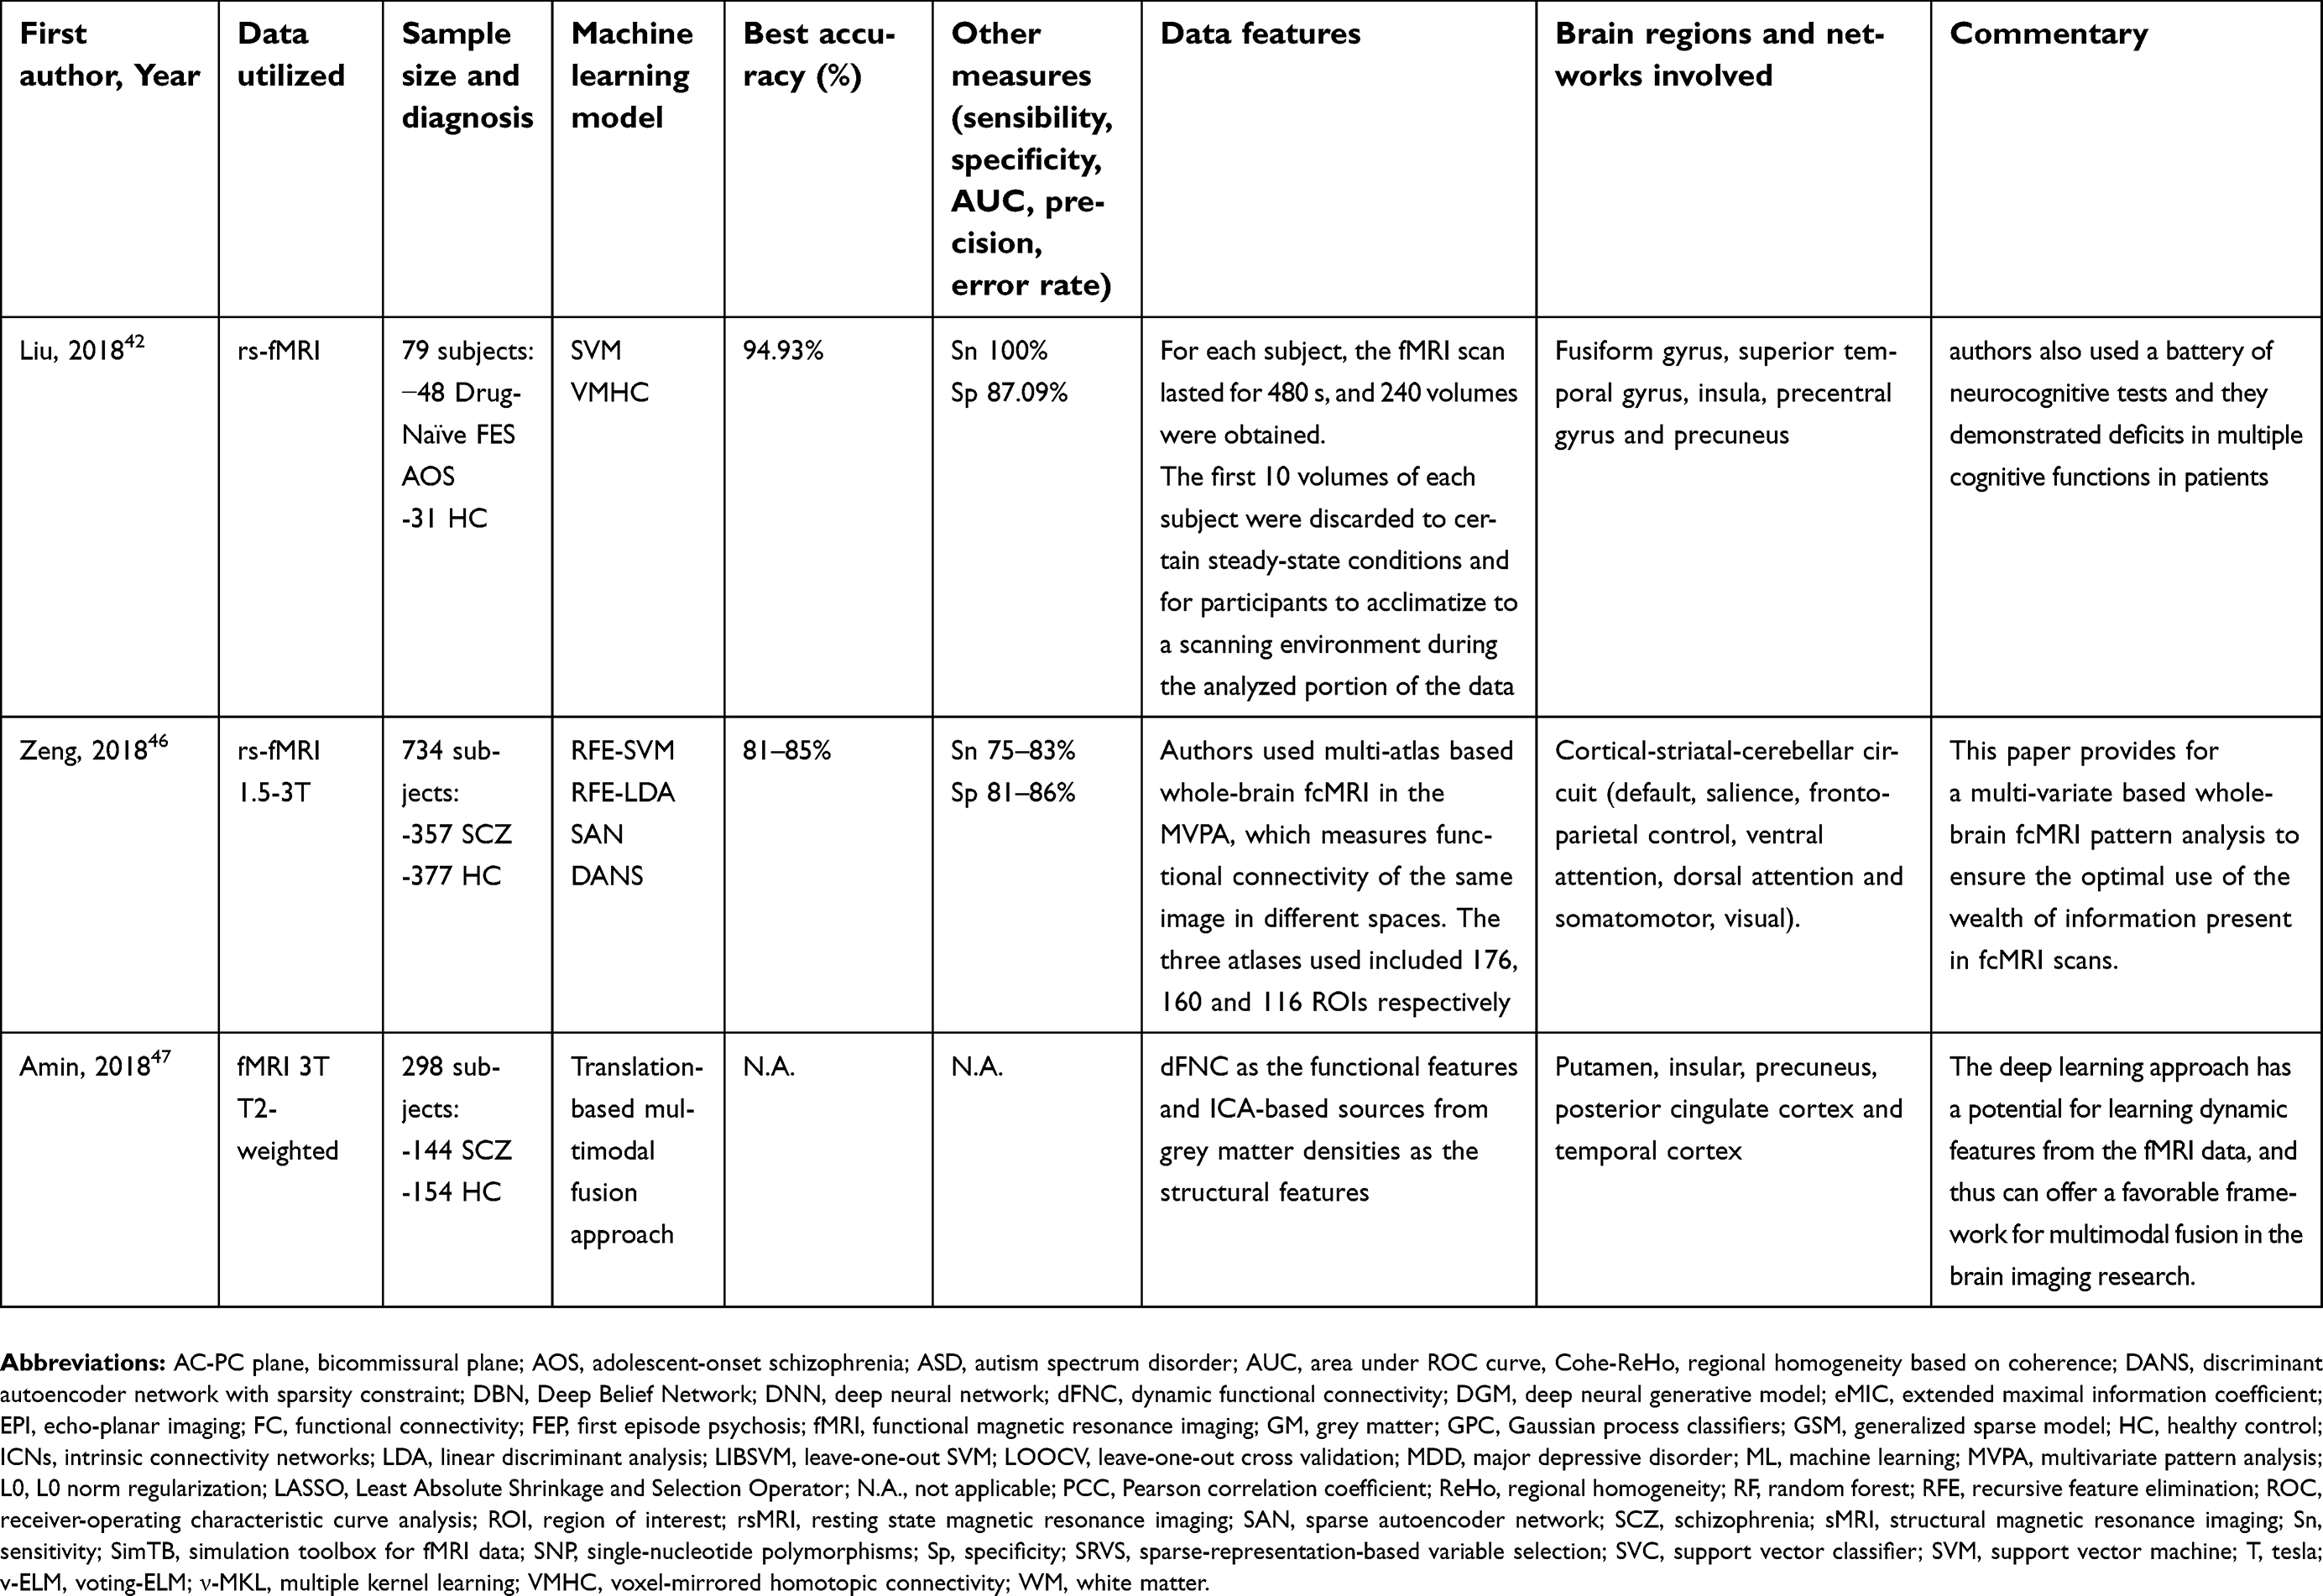
Twenty-six studies used functional magnetic resonance imaging (fMRI) to achieve the same goal (Table 2). They evaluated abnormalities in brain functional connectivity (FC) parameters (regional homogeneity (ReHo), density), networks or the entire functional connectome.
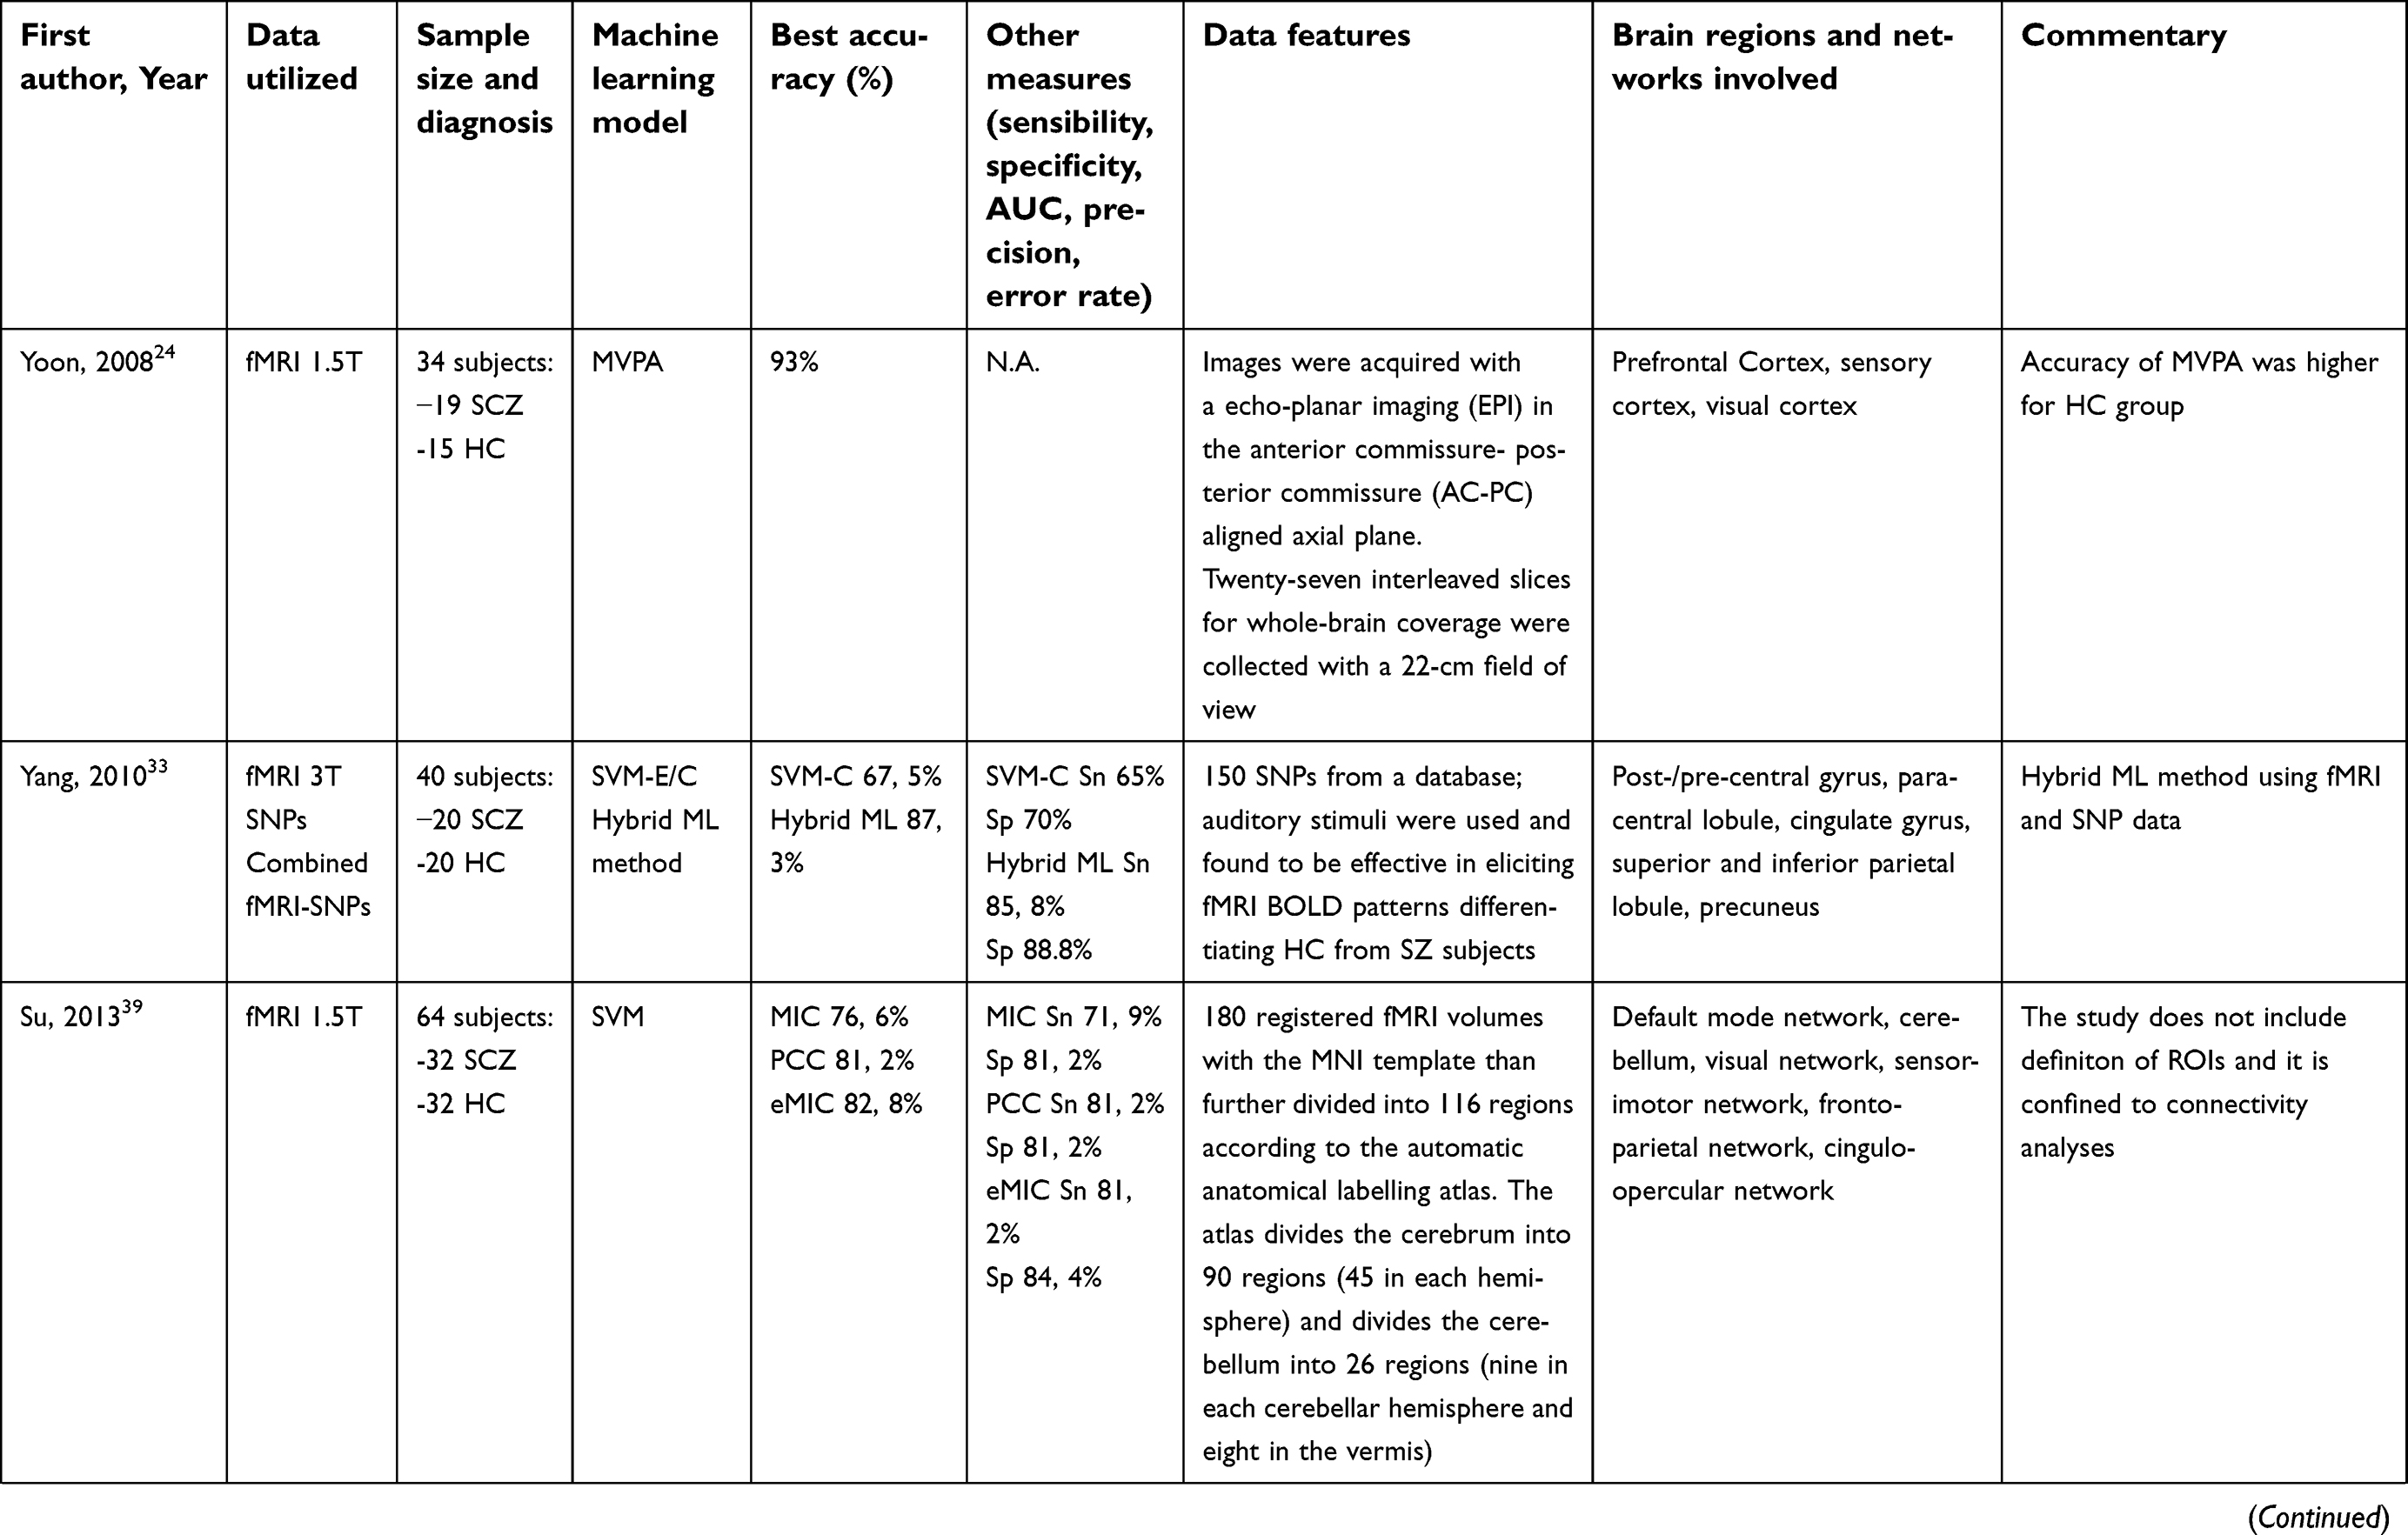 | Table 2 Summary of included studies of Machine Learning techniques classifying Schizophrenia using functional neuroimaging |
 | Table 2 (Continued). |
 | Table 2 (Continued). |
 | Table 2 (Continued). |
 | Table 2 (Continued). |
 | Table 2 (Continued). |
 | Table 2 (Continued). |
 | Table 2 (Continued). |
 | Table 2 (Continued). |
Only one study used both structural and fMRI.
Structural neuroimaging
Salvador et al combined and compared the most common ML methods (ridge, Least Absolute Shrinkage and Selection Operator (LASSO), elastic net and L0norm regularized logistic regression, a support vector classifier, regularized discriminant analysis, RF and a Gaussian process classifier) in a sample of 128 SCZ, 128 BD and 127 HC. They used different features: GM and WM voxel-based morphometry (VBM), vertex-based cortical thickness and volume, set as region of interest (ROI), and volumetric measures and wavelet-based morphometry as inputs for the techniques. VBM is the feature of choice for sMRI and it shows the most accuracy in distinguishing patients from HC, whilst the other ML methods (eg, ridge, LASSO, a support vector classifier, RFs and a Gaussian process classifier) have similar and lower performance levels.13
The grey matter volume (GMV) and WM volume of 41 SCZ patients and 42 HC were compared through a ML method providing both SVM and recursive feature elimination. Important abnormalities in brain structures primarily involved in cognitive functions (eg, memory, emotionality) were identified with 88.4% accuracy (sensitivity 91.9%, specificity 84.4%). The authors concluded with the possibility of identifying specific brain neuroimaging profiles associated with SCZ as a potential biomarker for disease diagnosis.14
The dorsolateral prefrontal cortex (DLPFC) was chosen as the ROI in another study. The ROI-SVM approach was used to classify 54 SCZ patients and 54 HC with accuracy (left side 75%; right side 66.38%). The technique showed better results among females and older subjects, probably due to differences in GM distribution (left side 84.09%, right side 77.27% for females and left side 81.25%, right side 70.83% for seniors). According to the authors, DLPFC can be used as a brain structural marker for the disease, especially in older female chronic patients.15
Patterns of illness-related grey matter changes could be potential biomarker for identifying structural brain alterations in individuals with SCZ. Xiao et al used SVM to analyze cortical thickness and surface area measurements in the differentiation of 163 FES patients and 163 HC. Regions contributing to classification accuracy included the grey matter in default mode network (DMN), central executive network, salience network (SN) and visual network: left fusiform, lingual, posterior cingulate, supramarginal, insula and right isthmus cingulate, lateral occipital, lingual and frontal pole cortex. The accuracy of correct classification of patients and HC was 85.0% for surface area and 81.8% for cortical thickness.16
The RF method with 74 anatomic brain MRI subregions was used to classify 98 childhood-onset SCZ patients and 99 HC. The association of copy number variations and these 74 subregions in the RF produced 74% accuracy. The brain areas specifically involved were the left temporal lobe, bilateral dorsolateral prefrontal region and left medial parietal lobe.17
Pinaya et al developed a new deep learning model, named the Deep Belief Network, used for extrapolating and interpreting features from neuromorphometry data on 83 HC and 143 patients with SCZ. Deep Belief Network accuracy, utilized as SVM was 68.1%, whereas as a classifier it was 73.6%, detecting large differences between classes, especially for frontal, temporal, parietal and insular cortices and the corpus callosum, putamen and cerebellum.18
In a later study, it was proposed an alternative conceptual and practical approach for investigating brain-based disorders that not requires a large number of cases. They used an artificial neural network known as “deep autoencoder” to create a normative model using sMRI data. The model was able to generate different values of total neuroanatomical deviation and distinct patterns of neuroanatomical deviations.19
Finally, pathologic changes both in WM and GM (in bilateral insula, anterior cingulate cortex, thalamus, superior temporal cortex and parahippocampal gyrus) were demonstrated though SVM. Changes were more evident at 7T RMI rather than at 3T RMI; the accuracy was higher with 7T in discriminating patients from controls (77% vs 66%) (20 HC vs 19 SCZ).20
Functional neuroimaging
Cabral et al applied MVPA to both structural and functional magnetic resonance neuroimaging methods on 21 SCZ patients and 74 HC. The resting state fMRI (rs-fMRI) reported similar accuracy to the structural classifier (70.5% vs 69.7%, respectively). The combination of sMRI and rs-fMRI outperformed single MRI modalities by reaching 75% accuracy. Subcortical short-range, in particular interhemispheric connections, were the main aberrant connections identified in SCZ patients. Abnormalities found in the frontotemporal area could explain cognitive impairment (eg, reduced verbal fluency, negative symptoms).21
Chen et al used rs-fMRI to compare three groups (20 SCZ, 20 MDD and 20 HC) through local FC density analysis combined with MVPA. Based on this method, they could differentiate MDD patients from SCZ patients according to the local FC density value in the orbitofrontal cortex; in fact, the connection in the prefrontal cortex was significantly lower in patients with SCZ compared with other groups (accuracy 85%). These findings emphasize the great importance the prefrontal cortex may have in future ML studies attempting to improve the diagnosis of SCZ by differentiating it from other pathological conditions such as MDD. A limitation of the study could be the enrolment of patients who were in a chronic phase and receiving pharmacological treatment, which could alter FC.22
Koch et al reached 93% accuracy in identifying SCZ patients through the MPVA analysis of patterns of anticipation of a monetary reward. They studied the frontal, temporal, occipital and midbrain regions, with a peak in the right pallidum and claimed to predict the severity of the negative symptoms of patients based on ventricular striatal activation patterns. Therefore, they conclude that such ML methods could bring significant benefits to diagnostic classification based on fMRI signal patterns.23
Yoon et al enrolled a sample of 19 SCZ and 15 HC and tried to decode the specific neural networks activated in the recognition and classification of stimuli. Two cycles of stimuli including faces, scenes, objects and scrambled images were presented to participants. Functional MRI data were analyzed through MVPA. The authors’ hypothesis about an alteration in brain connections in SCZ patients was confirmed: patients were less accurate than HC (59% vs 72%. respectively); moreover, the distributed representations of visual objects were compromised in SCZ. In both groups, the accuracy of the classification was significantly correlated with behavioral measures. This impairment was directly correlated with a decrease in performance in the 1-back matching task. Patterns of cortical activity (prefrontal, sensory and visual cortex) are reflected in altered behavior. The authors pointed out that the impairment emerging from fMRI data could reflect the neural abnormalities at the basis of poor performance in the matching task.24
Reavis et al showed four different objects and an outdoor scene to 51 BD patients, 50 SCZ patients and 31 HC during the execution of a fMRI and then performed a MVPA classification analysis to assess the distinctiveness of activity corresponding to the perception of each stimulus in the lateral occipital complex. As the authors did not find differences between groups (accuracy 41%), they hypothesized that if a deficit exists, it is linked to specific categories of objects (not between-group but within-group differences).25
In a recent paper, Wang et al explored long- and short-range functional connectivity (lFC) (sFC) through rs-fMRI in 48 first-episode, drug-naïve AOS patients and 31 HC using SVM. They found abnormalities of lpFC and spFC in some brain networks (both lpFC and spFC increased in the anterior DMN and decreased in the posterior DMN and lpFC only decreased in the SN). They were able to classify patients and controls with high accuracy (up to 92.4%), sensitivity (89.6%) and specificity (96.8%). This study was the first to examine lFC and sFC in the whole brain in first-episode drug-naïve AOS patients through rs-fMRI. The authors concluded that the functional alterations could point to a role of DMN and SN in the neurobiology of SCZ that is already present in patients in the first episode, hence their ability to discriminate AOS patients from HC with great diagnostic accuracy.26
Another paper published by Guo et al27 also examined the role of s-lFCs in fMRI in differentiating patients from HC or their own relatives. Specifically, SCZ patients showed an increase in spFC and lpFC in the DMN, while, unlike in the previous manuscript, they both decreased in sensorimotor circuits. In addition, the combination of spFC values in the right superior parietal lobule and lpFC in the left fusiform cerebellum gyrus was able to differentiate patients from their relatives with an adequate level of sensitivity and specificity. Wang et al enrolled 49 drug-naïve AOS patients and 32 HC to investigate and identify brain abnormalities using ReHo input in SVM analysis through rs-fMRI. The study found that AOS patients showed significantly increased ReHo values in the bilateral superior medial prefrontal cortex and decreased ReHo values in the left superior temporal gyrus, right precentral lobule, right inferior parietal lobule, and left paracentral lobule compared with HC.28
Liu et al used a similar sample with 48 AOS and 31 HC to analyze the coherence regional homogeneity (CoHe-ReHo) through ML methods with rs-fMRI. The Cohe-ReHo value was reduced in the left postcentral gyrus, left superior temporal gyrus, left paracentral lobule, right precentral gyrus, right IPL, right middle frontal gyrus and bilateral praecuneus. It did not appear to increase in any cerebral area in AOS patients compared with HC.29
Chyzhyk et al used the amplitude of low-frequency fluctuations, fractional ALFF, voxel-mirrored homotopic connectivity (VMHC) and ReHo as input data for voting-ELM (v-ELM) (SVM+RF) analysis. The accuracy of this method proved to be close to 90%. The study compared 72 SCZ patients and 75 HC. The anatomic brain regions with major alterations were the inferior temporal gyrus, anterior division of the parahippocampal gyrus, planum polare, temporal fusiform cortex and left and right thalamus.30
Zhu et al developed a new method named the “Adaptive Learning Algorithm” to distinguish 27 SCZ patients from 28 HC using rs-fMRI data. They identified 23 ROI of the resting-state functional language network that are considered important in language comprehension and production (eg, Wernicke’s area, Broca’s area, inferior parietal, inferior temporal). They reached an accuracy of 83.6%, a sensitivity of 81.5% and a specificity of 85.7%.31
Cao et al integrated fMRI data with single-nucleotide polymorphisms (SNPs) in their research with 92 SCZ patients and 116 HC. This type of ML analysis represents a challenge for the future, given the unique nature of the data used. Therefore, the authors have specially developed a new sparse-representation-based variable selection (SRVS) algorithm, which can identify the most significant biomarker elements associated with SCZ. The accuracy obtained by the investigators through the SRVS algorithm was significantly greater than those obtained by the single methods with the traditional statistical methods: SNPs alone can reach an identification accuracy of approximately 83.11%±1.32%, while the accuracy of top fMRI voxels alone was 63.13%±0.74%. This demonstrates the importance of an integrated analysis using biomarkers from different types of biological sources (eg, fMRI, SNP) to improve the capacity to distinguish SCZ patients from HC.32
Yang et al used a hybrid ML model combining fMRI and SNPs data (combined SNP-fMRI) with an accuracy of 87%. The study sample consisted of 20 SCZ patients and 20 HC. They identified 150 SNPs, 15 of which were located in 14 important genes (eg, COMT, DISC1, MTHFR, HTR3B, GAD2, SLC6A4, ABCB1 and ABCC). The brain regions that better classified SCZ patients and HC resulted to be the inferior, middle and medial frontal gyri, cingulate gyrus, superior temporal gyrus and praecuneus.33
Instead, Arbabshirani et al proposed another method to discriminate 195 SCZ from 175 HC that provided extrapolation data from rs-fMRI of two different types of features: functional network connectivity (FNC) to capture the internetwork connectivity pattern and autoconnectivity to capture the temporal connectivity of each brain network. The combination of these features (FNC+autoconnectivity) with the SVM method allowed them to achieve a diagnostic and classification accuracy of 88.21% (83.7% FNC alone and 80.2% autoconnectivity alone), a 86.7% sensitivity (81.4% FNC alone and 78.1% autoconnectivity alone) and an 89.5% specificity (85.9% FNC alone and 82.2% autoconnectivity alone).34
A recent study examined 35 FES teenagers, 31 HC and 22 people with autism spectrum disorder (ASD). The SVM classification showed an accuracy of 83.33% (sensitivity of 80%, specificity 87.1%, AUC 0.83). The authors claimed that shared atypical brain connections in the DMN and SN, useful for distinguishing SCZ patients from HC, were also detected in the ASD group. Such functional connections present in both groups of patients but not in the HC may help us to better understand the pathogenetic and etiological mechanisms of the disorders.35 A ML-based method of diagnosing SCZ using a deep neural generative model (DGM) of rs-fMRI images was proposed by Matsubara et al. The proposed DGM achieved a good diagnostic accuracy (76,6%), sensitivity (58,5%) and specificity (84,9%). It can also measure the contribution weight of each brain region to the diagnosis: right and left thalamus appeared to be the regions that can most accurately differentiate patients from HC.36
Another study successfully demonstrated the feasibility and the minimum error rate of the deep neural networkclassifier toward the automated diagnosis of SCZ patients by using resting-state whole-brain FC patterns as input.37 They found different FC patterns useful for distinguishing SCZ from HC. The whole-brain FC data suggest that such approaches show improved ability to learn hidden patterns in brain imaging data, which may be useful for a better understanding of the neural basis and for developing diagnostic tools for SCZ identifying associated aberrant FC patterns.
Watanabe et al produced a whole-brain resting-state functional connectome. The final dataset included 67 HC and 54 SCZ patients. They assessed three sets of network-to-network connections (intra-frontoparietal, frontoparietal default, intra-cerebellar) as they were considered to be of major importance in the psychopathology of SCZ. The final accuracy rate ranged from 77% of LASSO to 88.2% of LASSO fused. This is one of the first studies to evaluate the entire connectivity of both HC and SCZ patients, identifying major network alterations.38 Su L. et al rebuilt the entire functional brain connectivity of SCZ patients by using fMRI and matched it with that of HC. Pearson correlation coefficient, maximal information coefficient and extended maximal information coefficient resulted in three main FC types. They applied MVPA to discriminate these three types of functional models evaluating the power of nonlinear rather than linear FC in 32 SCZ patients and 32 HC and determined the spatial distribution of brain regions related to symptomatology. They achieved >80% accuracy and found that nonlinear FC was increased in SCZ patients; this shows that this variable has an equal, if not greater, impact on the diagnostic classification of SCZ.39 On the other hand, Bae et al used a fMRI public dataset and extrapolated the FC parameters. The results showed a reduction in the global and local network connectivity in subjects affected by SCZ (n=21) compared with HC (n=54), particularly in the anterior right cingulate cortex, the superior right temporal region and the inferior left parietal region. The accuracy was 92.1% using SVM and 10-fold cross-validation (sensitivity 92%, specificity 92.1%, precision 94%); this suggests important and significant differences regarding the regional brain activity through fMRI in both groups. The aim of their work was to demonstrate that brain connectivity was significantly altered in patients with SCZ compared with HC and that these differences could be efficiently and more easily detected by ML analysis.40
Pläschke et al used SVM classification and distinguished with 68% accuracy (AUC, 0.73) SCZ patients from matched HC basing on resting-state FC. The networks that distinguished patients most accurately from HC were emotional scenes and face processing, empathic processing and cognitive action control. It was the first study that took into account the age of the participants in the classification: classification based on age was excellent based on all networks. Resting-state FC could be used as a marker of functional dysregulation in specific network affected in SCZ; the age, in fact, affects network integrity in a more global way.41
The alteration in FC in different brain region was also studied by Liu et al in a sample of 48 drug-naïve, first-episode, AOS and 31 HC. In order to discriminate patients from controls, they combined the VMHC values in the precentral gyrus and precuneus performing rs-fMRI. They found that patients with AOS showed dysfunctional interhemispheric cooperation within the sensorimotor network. It was correlated with processing speed deficits, indicating that this dysfunction may contribute to cognitive deficits in patients. The SVM analysis showed sensitivity of 100%, specificity of 87.09%, and accuracy of 94.93%.42
Castro et al aimed to develop an improved variant of the algorithm of normal multiple kernel learning (MKL) capable of analyzing a greater variety of brain region patterns to improve the current SCZ diagnosis accuracy. The participants followed a three-stimulus auditory oddball discrimination task, in which two runs of 244 auditory stimuli consisting of standard, target and novel stimuli were presented to the subject. This technique (ν-MKL) is able to find an automatic combination of kernel functions that can be applied to multiple data sources (both magnitude and phase fMRI data) and adds an additional 5% to the accuracy of the standard MKL (85%).43
Qureshi et al developed an extreme learning machine (ELM), whose effectiveness was compared with that of more known ML methods, reaching a maximum accuracy of 99.3%. They enrolled 72 patients with SCZ and 72 HC using a new hybrid weighted function concatenation method to gain the highest precision that maintained a high discriminatory power through the weight of the individual characteristic type. The most interesting data extrapolated from the acquisitions were cortical thickness and surface area, total cerebral volume, WM volume, intensity measures from the cortical parcellation, volume and intensity from sub-cortical parcellation and overall volume of cortex features. Then, a permutation test was performed to evaluate the statistical weight of the results obtained by the new method. The conclusion was that this ELM technique can be used in clinical practice and offers a concrete possibility of helping clinicians to diagnose SCZ.44
The research of Orban et al, with nearly 200 patients and 200 HC, represents one of the largest ML studies on SCZ to date. The authors reported 84% diagnostic accuracy using data from multiple sites, while significantly lower accuracy was achieved with the use of individual sites. In fact, when data from all subjects and sites were gathered together, an association analysis at the level of all components revealed a decrease in connectivity in patients with SCZ. Univariate mass analyses demonstrated a cerebral disconnection through the entire brain with identifiable alterations in over a third of brain connections from cognitive to primary sensory networks.45
In a recent paper, Zeng et al collected data from seven imaging resources (for a total of 357 SCZ patients and 377 controls) using a multi-atlas based whole-brain fcMRI in the multivariate pattern analysis, which measures FC of the same image in different spaces of multiple atlases. This large multi-site fMRI study developed a deep discriminant autoencoder network with sparsity constraint (DANS) network with multi-atlas fcMRI to discriminate SCZ patients from HC. The high accuracy achieved (81–85%) suggests the potential of discriminant deep learning of multi-atlas fcMRI in searching biomarkers to achieve clinical diagnosis of SCZ across multiple independent imaging sites.46
Finally, Amin et al proposed a novel translation-based fusion model that learns “alignments” (or links) between brain structure and function. The authors considered two different imaging views of the same brain like two different languages conveying some common facts that enable finding linkages between dynamic functional connectivity (dFNC) features from fMRI data and static GM patterns from sMRI data. The dFNC states characterized by weakly correlated intrinsic connectivity networks (ICNs) were found to have stronger association with putamen and insular GM pattern, while the dFNC states of profuse strongly correlated ICNs exhibited stronger links with the GM pattern in precuneus, posterior cingulate cortex and temporal cortex.47
Discussion
ML techniques represent a promising approach that could support clinicians in the diagnosis of mental disorders and may be useful in classifying SCZ through MRI. All studies included in the review achieved a minimum accuracy of approximately 60%, most of them between 75% and 90%, with differences between sMRI and fMRI, in favor of the second one (with accuracy peaks above 90%).
SVM is the most used technique, both for sMRI and fMRI, and could reach an accuracy close to 100% if combined with other ML techniques42 and the recent deep learning technique seems to be the most promising technique especially if it is used with structural and functional features together.46,48 Diverse inputs have been used to improve the accuracy of the technique: alterations in GM and WM (especially in sMRI studies), abnormalities in brain FC parameters (such as ReHo or density) and networks or the entire functional connectome. More brain areas have been evaluated, in particular the prefrontal (eg, DLPFC, orbitofrontal cortex), temporal and cingulate cortices, which seem to be the most helpful in predicting the diagnosis of SCZ, and insula that has been shown to have strong connection with aberrant activities in default mode in SCZ patients.
Significantly altered brain connectivity in patients with SCZ compared with HC can be efficiently detected by ML analysis (eg, DMN, visual network, sensorimotor network, frontoparietal network, SN, etc.). An integrated analysis using biomarkers from different types of biological sources (eg, fMRI, SNP) should be considered in order to improve the capacity to distinguish SCZ patients from HC and to facilitate diagnosis.
This systematic review has some limits to consider. Most studies had small sample sizes, and among these, only four of them enrolled drug-naïve patients, while all the others provided information about chronic patients under antipsychotic treatment; the great heterogeneity among the included studies may be a confounding element when interpreting the results. Moreover, no study compared drug-naïve SCZ patients with SCZ patients under treatment using ML methods applied to neuroimaging. This could be an interesting hint for future research. In our systematic review, we only included papers about diagnostic discrimination on the basis of structural and functional neuroimaging features of HC vs SCZ patients, but the possible application of ML techniques should be considered in predicting individuals at risk, response to treatment and cognitive impairment; establishing disease phenotypes and in combining other data (ie, genetic analysis, EEG features, neuropsychological tests, serum biomarkers) to improve the accuracy of diagnosis. The work carried out by Guo et al27 is the only study included in the review that also considered genetic susceptibility by comparing both patients with SCZ and their close relatives with HC; further research could aim at early diagnosis and reduction of confounding factors (eg, environmental risk factors) as far as possible. Another important aspect could be the high impact in terms of accuracy in discriminating chronic from acute patients. However, this application still seems to have too little impact in real life. In fact, it seems clear that it is easier to distinguish patients from HC than to distinguish patients from high-risk groups. Therefore, considering that all studies are based on patients already diagnosed with SCZ, either chronic or at their first episode, such applications still have a limited role in the real clinical field but could be extremely useful in distinguishing high-risk from low-risk patients in the future. The aim will, therefore, be to make ML more sophisticated in order to make not only categorical classifications but also dimensional diagnoses (eg, patients with prodromal symptoms of SCZ from HC).
Conclusion
In conclusion, the application of ML techniques will be useful to automatically classify patients with SCZ on the basis of structural and functional MRI. If systematically included in the diagnostic process of patients with SCZ, these techniques could help physicians to detect patients, even in the early stage of the disorder, conferring an important clinical advantage. We imagine that the greater accuracy demonstrated by the various predictive models illustrated in this systematic review and new models resulting from the integration of multiple ML techniques will be increasingly decisive in the future for the early diagnosis and evaluation of the treatment response and to establish the prognosis of patients with SCZ. To achieve a real benefit for patients, the future challenge is to reach an accurate diagnosis not only through the clinical evaluation but also with the aid of ML algorithms.
Abbreviation list
AOS, adolescent-onset schizophrenia; ASD, autism spectrum disorder; AUC, area under the ROC curve; BD, bipolar disorder; CoHe-ReHo, coherence regional homogeneity; DANS, discriminant autoencoder network with sparsity constraint; FNC, dynamic functional connectivity; DGM, deep neural generative model; DLPFC, dorsolateral prefrontal cortex; DNN, deep neural network; DSM, Diagnostic and Statistical Manual of Mental Disorders; ELM, extreme learning machine ensembles; FC, functional connectivity; FES, first episode Schizophrenia; fMRI, functional magnetic resonance imaging; FNC, functional network connectivity; GM, grey matter; GMV, grey matter Volume; GPC, Gaussian process classifiers; HC, healthy controls; ICNs, intrinsic connectivity networks; L0 norm, L0 norm regularization; LASSO, Least Absolute Shrinkage and Selection Operator; LIBSVM, leave-one-out SVM; LOOCV, leave one out cross validation; MDD, major depressive disorder; ML, machine learning; MRI, Magnetic resonance imaging; MVPA, multivariate pattern analysis; N.A., not available; RFE, recursive feature elimination; ReHo, regional homogeneity; RF, random forest; LDA, linear discriminant analysis; ROC, receiver-operating characteristic curve analysis; rs-fMRI, resting state functional magnetic resonance imaging; ROI, region of interest; RVM, relevance vector machine; SCZ, schizophrenia; SN, salience network; SNPs, single-nucleotide polymorphisms; SRVS, sparse-representation-based variable selection; SVC, support vector classifier; SVM, support vector machine; VBM, voxel-based morfometry; V-ELM, voting-ELM; ν-MKL, multiple kernel learning; WM, white matter.
Author contributions
All authors contributed to data analysis, drafting or revising the article, gave final approval of the version to be published, and agree to be accountable for all aspects of the work.
Disclosure
The authors report no conflicts of interest in this work.
References
1. Owen MJ, Sawa A, Mortensen PB. Schizophrenia. Lancet. 2016;388(10039):86–97. doi:10.1016/S0140-6736(15)01121-6
2. McGrath J, Saha S, Chant D, Welham J. Schizophrenia: a concise overview of incidence, prevalence, and mortality. Epidemiol Rev. 2008;30(1):67–76. doi:10.1093/epirev/mxn001
3. Simeone JC, Ward AJ, Rotella P, Collins J, Windisch R. An evaluation of variation in published estimates of schizophrenia prevalence from 1990─2013: a systematic literature review. BMC Psychiatry. 2015;15(1):193. doi:10.1186/s12888-015-0578-7
4.
5. The ICD-10 classification of mental and behavioural disorders clinical descriptions and diagnostic guidelines. Available from:
6. Kambeitz J, Kambeitz-Ilankovic L, Leucht S, et al. Detecting neuroimaging biomarkers for schizophrenia: a meta-analysis of multivariate pattern recognition studies. Neuropsychopharmacology. 2015;40(7):1742–1751. doi:10.1038/npp.2015.22
7. Wolfers T, Buitelaar JK, Beckmann CF, Franke B, Marquand AF. From estimating activation locality to predicting disorder: A review of pattern recognition for neuroimaging-based psychiatric diagnostics. Neurosci Biobehav Rev. 2015;57:328–349. doi:10.1016/j.neubiorev.2015.08.001
8. Veronese E, Castellani U, Peruzzo D, Bellani M, Brambilla P. Machine learning approaches: from theory to application in schizophrenia. Comput Math Methods Med. 2013;2013:1–12. doi:10.1155/2013/867924
9. Vapnik VN. An overview of statistical learning theory. IEEE Trans Neural Networks. 1999;10(5):988–999. doi:10.1109/72.788640
10. Krystal JH, Murray JD, Chekroud AM, et al. Computational psychiatry and the challenge of schizophrenia. Schizophr Bull. 2017;43(3):473–475. doi:10.1093/schbul/sbx025
11. Liberati A, Altman DG, Tetzlaff J, et al. The PRISMA statement for reporting systematic reviews and meta-analyses of studies that evaluate health care interventions: explanation and elaboration. 2009;21;6(7):e1000100. doi:10.1371/journal.pmed.1000100
12. Jadad AR, Moore RA, Carroll D, et al. Assessing the quality of reports of randomized clinical trials: is blinding necessary? Control Clin Trials. 1996;17(1):1–12. Available from:
13. Salvador R, Radua J, Canales-Rodríguez EJ, et al. Evaluation of machine learning algorithms and structural features for optimal MRI-based diagnostic prediction in psychosis. Hu D, ed. PLoS One. 2017;12(4):e0175683. doi:10.1371/journal.pone.0175683
14. Lu X, Yang Y, Wu F, et al. Discriminative analysis of schizophrenia using support vector machine and recursive feature elimination on structural MRI images. Medicine (Baltimore). 2016;95(30):e3973. doi:10.1097/MD.0000000000003973
15. Castellani U, Rossato E, Murino V, et al. Classification of schizophrenia using feature-based morphometry. J Neural Transm. 2012;119(3):395–404. doi:10.1007/s00702-011-0693-7
16. Xiao Y, Yan Z, Zhao Y, et al. Support vector machine-based classification of first episode drug-naïve schizophrenia patients and healthy controls using structural MRI. Schizophr Res. 2017. doi:10.1016/j.schres.2017.11.037
17. Greenstein D, Malley JD, Weisinger B, Clasen L, Gogtay N. Using multivariate machine learning methods and structural MRI to classify childhood onset schizophrenia and healthy controls. Front Psychiatry. 2012;3. doi:10.3389/fpsyt.2012.00053
18. Pinaya WHL, Gadelha A, Doyle OM, et al. Using deep belief network modelling to characterize differences in brain morphometry in schizophrenia. Sci Rep. 2016;6(1):38897. doi:10.1038/srep38897
19. Pinaya WHL, Mechelli A, Sato JR. Using deep autoencoders to identify abnormal brain structural patterns in neuropsychiatric disorders: a large-scale multi-sample study. Hum Brain Mapp. 2019;40(3):944–954. doi:10.1002/hbm.24423
20. Iwabuchi SJ, Liddle PF, Palaniyappan L. Clinical utility of machine-learning approaches in schizophrenia: improving diagnostic confidence for translational neuroimaging. Front Psychiatry. 2013;4:95. doi:10.3389/fpsyt.2013.00095
21. Cabral C, Kambeitz-Ilankovic L, Kambeitz J, et al. Classifying schizophrenia using multimodal multivariate pattern recognition analysis: evaluating the impact of individual clinical profiles on the neurodiagnostic performance. Schizophr Bull. 2016;42(suppl 1):S110–S117. doi:10.1093/schbul/sbw053
22. Chen X, Liu C, He H, et al. Transdiagnostic differences in the resting-state functional connectivity of the prefrontal cortex in depression and schizophrenia. J Affect Disord. 2017;217:118–124. doi:10.1016/j.jad.2017.04.001
23. Koch SP, Hägele C, Haynes J-D, Heinz A, Schlagenhauf F, Sterzer P. Diagnostic classification of schizophrenia patients on the basis of regional reward-related FMRI signal patterns. Schwarz AJ, ed. PLoS One. 2015;10(3):e0119089. doi:10.1371/journal.pone.0119089
24. Yoon JH, Tamir D, Minzenberg MJ, Ragland JD, Ursu S, Carter CS. Multivariate pattern analysis of functional magnetic resonance imaging data reveals deficits in distributed representations in schizophrenia. Biol Psychiatry. 2008;64(12):1035–1041. doi:10.1016/j.biopsych.2008.07.025
25. Reavis EA, Lee J, Wynn JK, et al. Assessing neural tuning for object perception in schizophrenia and bipolar disorder with multivariate pattern analysis of fMRI data. Neuro Image Clin. 2017;16:491–497. doi:10.1016/j.nicl.2017.08.023
26. Wang S, Zhan Y, Zhang Y, et al. Abnormal long- and short-range functional connectivity in adolescent-onset schizophrenia patients: a resting-state fMRI study. Prog Neuropsychopharmacol Biol Psychiatry. 2017;81:445–451. doi:10.1016/j.pnpbp.2017.08.012
27. Guo W, Liu F, Chen J, et al. Using short-range and long-range functional connectivity to identify schizophrenia with a family-based case-control design. Psychiatry Res. 2017;264:60–67. doi:10.1016/j.pscychresns.2017.04.010
28. Wang S, Zhang Y, Lv L, et al. Abnormal regional homogeneity as a potential imaging biomarker for adolescent-onset schizophrenia: a resting-state fMRI study and support vector machine analysis. Schizophr Res. 2017. doi:10.1016/j.schres.2017.05.038
29. Liu Y, Zhang Y, Lv L, Wu R, Zhao J, Guo W. Abnormal neural activity as a potential biomarker for drug-naive first-episode adolescent-onset schizophrenia with coherence regional homogeneity and support vector machine analyses. Schizophr Res. 2017. doi:10.1016/j.schres.2017.04.028
30. Chyzhyk D, Savio A, Graña M. Computer aided diagnosis of schizophrenia on resting state fMRI data by ensembles of ELM. Neural Netw. 2015;68:23–33. doi:10.1016/j.neunet.2015.04.002
31. Zhu M, Jie N, Jiang T. Automatic classification of schizophrenia using resting-state functional language network via an adaptive learning algorithm. In: aylward S, Hadjiiski LM, eds. Int Soc Opt Photonics. 2014;9035:903522. doi:10.1117/12.2043240
32. Cao H, Duan J, Lin D, Shugart YY, Calhoun V, Wang Y-P. Sparse representation based biomarker selection for schizophrenia with integrated analysis of fMRI and SNPs. Neuroimage. 2014;102(Pt 1):220–228. doi:10.1016/j.neuroimage.2014.01.021
33. Yang H, Liu J, Sui J, Pearlson G, Calhoun VD. A hybrid machine learning method for fusing fMRI and genetic data: combining both improves classification of schizophrenia. Front Hum Neurosci. 2010;4:192. doi:10.3389/fnhum.2010.00192
34. Arbabshirani MR, Castro E, Calhoun VD. Accurate classification of schizophrenia patients based on novel resting-state fMRI features. Conf Proc Annu Int Conf IEEE Eng Med Biol Soc Annu Conf. 2014;2014:6691–6694. doi:10.1109/EMBC.2014.6945163
35. Chen H, Uddin LQ, Duan X, et al. Shared atypical default mode and salience network functional connectivity between autism and schizophrenia. Autism Res. 2017;10(11):1776–1786. doi:10.1002/aur.1834
36. Matsubara T, Tashiro T, Uehara K. Deep neural generative model of functional MRI images for psychiatric disorder diagnosis. IEEE Trans Biomed Eng. 2015;1-1. doi:10.1109/TBME.2019.2895663
37. Kim J, Calhoun VD, Shim E, Lee J-H. Deep neural network with weight sparsity control and pre-training extracts hierarchical features and enhances classification performance: evidence from whole-brain resting-state functional connectivity patterns of schizophrenia. Neuroimage. 2016;124(Pt A):127–146. doi:10.1016/j.neuroimage.2015.05.018
38. Watanabe T, Kessler D, Scott C, Angstadt M, Sripada C. Disease prediction based on functional connectomes using a scalable and spatially-informed support vector machine. Neuroimage. 2014;96:183–202. doi:10.1016/j.neuroimage.2014.03.067
39. Su L, Wang L, Shen H, Feng G, Hu D. Discriminative analysis of non-linear brain connectivity in schizophrenia: an fMRI study. Front Hum Neurosci. 2013;7:702. doi:10.3389/fnhum.2013.00702
40. Bae Y, Kumarasamy K, Ali IM, Korfiatis P, Akkus Z, Erickson BJ. Differences between schizophrenic and normal subjects using network properties from fMRI. J Digit Imaging. 2017. doi:10.1007/s10278-017-0020-4
41. Pläschke RN, Cieslik EC, Müller VI, et al. On the integrity of functional brain networks in schizophrenia, Parkinson’s disease, and advanced age: evidence from connectivity-based single-subject classification. Hum Brain Mapp. 2017;38(12):5845–5858. doi:10.1002/hbm.23763
42. Liu Y, Guo W, Zhang Y, et al. Decreased resting-state interhemispheric functional connectivity correlated with neurocognitive deficits in drug-naive first-episode adolescent-onset schizophrenia. Int J Neuropsychopharmacol. 2018;21(1):33–41. doi:10.1093/ijnp/pyx095
43. Castro E, Gómez-Verdejo V, Martínez-Ramón M, Kiehl KA, Calhoun VD. A multiple kernel learning approach to perform classification of groups from complex-valued fMRI data analysis: application to schizophrenia. Neuroimage. 2014;87:1–17. doi:10.1016/j.neuroimage.2013.10.065
44. Qureshi MNI, Oh J, Cho D, Jo HJ, Lee B. Multimodal discrimination of schizophrenia using hybrid weighted feature concatenation of brain functional connectivity and anatomical features with an extreme learning machine. Front Neuroinform. 2017;11:59. doi:10.3389/fninf.2017.00059
45. Orban P, Dansereau C, Desbois L, et al. Multisite generalizability of schizophrenia diagnosis classification based on functional brain connectivity. Schizophr Res. 2017. doi:10.1016/j.schres.2017.05.027
46. Zeng -L-L, Wang H, Hu P, et al. Multi-site diagnostic classification of schizophrenia using discriminant deep learning with functional connectivity MRI. EBio Med. 2018;30:74–85. doi:10.1016/j.ebiom.2018.03.017
47. Amin MF, Plis SM, Chekroud A, et al. Reading the (functional) writing on the (structural) wall: multimodal fusion of brain structure and function via a deep neural network based translation approach reveals novel impairments in schizophrenia. Neuroimage. 2018;181:734–747. doi:10.1016/j.neuroimage.2018.07.047
48. Plis SM, Hjelm DR, Salakhutdinov R, et al. Deep learning for neuroimaging: a validation study. Front Neurosci. 2014;8. doi:10.3389/fnins.2014.00229
 © 2019 The Author(s). This work is published and licensed by Dove Medical Press Limited. The full terms of this license are available at https://www.dovepress.com/terms.php and incorporate the Creative Commons Attribution - Non Commercial (unported, v3.0) License.
By accessing the work you hereby accept the Terms. Non-commercial uses of the work are permitted without any further permission from Dove Medical Press Limited, provided the work is properly attributed. For permission for commercial use of this work, please see paragraphs 4.2 and 5 of our Terms.
© 2019 The Author(s). This work is published and licensed by Dove Medical Press Limited. The full terms of this license are available at https://www.dovepress.com/terms.php and incorporate the Creative Commons Attribution - Non Commercial (unported, v3.0) License.
By accessing the work you hereby accept the Terms. Non-commercial uses of the work are permitted without any further permission from Dove Medical Press Limited, provided the work is properly attributed. For permission for commercial use of this work, please see paragraphs 4.2 and 5 of our Terms.