Back to Journals » Journal of Hepatocellular Carcinoma » Volume 13
Machine Learning-Based Radiopatho-Clinical Model Integrating Ultrasound Radiomics and Kleiner Score for Prognosis Prediction in NAFLD-Related Hepatocellular Carcinoma
Authors Li CL, Jia Z, Yao ZY ![]() , Cui XT
, Cui XT ![]() , Sun A
, Sun A ![]() , Hao AY, Chen ZY, Chen F, Cao JY, Wang ZS
, Hao AY, Chen ZY, Chen F, Cao JY, Wang ZS ![]()
Received 21 March 2026
Accepted for publication 16 June 2026
Published 19 June 2026 Volume 2026:13 611041
DOI https://doi.org/10.2147/JHC.S611041
Checked for plagiarism Yes
Review by Single anonymous peer review
Peer reviewer comments 5
Editor who approved publication: Dr David Gerber
Chang-Lei Li,1,2,* Zhen Jia,1,2,* Zhi-Yuan Yao,2,3,* Xiao-Tong Cui,1,2 Ao Sun,1,2 Ao-Yun Hao,1,2 Zhong-Yi Chen,2 Fang Chen,2,4 Jing-Yu Cao,1 Zu-Sen Wang1
1Department of Hepatobiliary and Pancreatic Surgery, The Affiliated Hospital of Qingdao University, Qingdao, People’s Republic of China; 2Qingdao Medical College, Qingdao University, Qingdao, Shandong, People’s Republic of China; 3Department of Thoracic Surgery, The Affiliated Hospital of Qingdao University, Qingdao, People’s Republic of China; 4Department of Abdominal Ultrasound, The Affiliated Hospital of Qingdao University, Qingdao, People’s Republic of China
*These authors contributed equally to this work
Correspondence: Zu-Sen Wang, Email [email protected] Jing-Yu Cao, Email [email protected]
Background: Nonalcoholic fatty liver disease (NAFLD) is an increasingly important etiologic factor in hepatocellular carcinoma (HCC), but the prognostic value of liver-background steatosis remains incompletely defined. We developed and internally validated an integrated machine learning model combining ultrasound radiomics, pathological steatosis grading, and clinicopathological variables for postoperative risk stratification in HCC.
Methods: This retrospective study included 639 patients with HCC who underwent curative resection between 2010 and 2023. Radiomic features were extracted from preoperative ultrasound images, and a radiomics signature was generated using LASSO regression. Hepatic steatosis was graded using the Kleiner score, and clinicopathological variables were screened using the Boruta algorithm. A total of 101 machine learning models were developed and compared. Model performance was assessed using the concordance index, time-dependent area under the curve (AUC), Brier score, calibration, decision curve analysis, and SHapley Additive exPlanations.
Results: The random survival forest model showed the best overall performance for predicting overall survival (OS) and recurrence-free survival (RFS). In the validation cohort, the 1-, 3-, and 5-year AUCs were 0.863, 0.794, and 0.804 for OS, and 0.828, 0.811, and 0.823 for RFS, respectively. Brier scores remained below 0.20. Compared with BCLC and CNLC staging systems, the integrated model showed improved discrimination, calibration, and net clinical benefit. SHAP analysis indicated that microvascular invasion, tumor size, AFP, INR, Kleiner score, and Radscore contributed to individualized risk prediction.
Conclusion: This integrated radiopatho-clinical machine learning model showed favorable internal performance for predicting OS and RFS after curative resection. Steatosis-related features may provide complementary prognostic information, supporting individualized postoperative surveillance, although external validation is required.
Keywords: hepatocellular carcinoma, NAFLD, ultrasound radiomics, machine learning, prognosis, recurrence
Introduction
Primary liver cancer (PLC) is the sixth most commonly diagnosed malignancy and the third leading cause of tumor-related mortality.1,2 The World Health Organization (WHO) demonstrates that the death of liver cancer patients is expected to exceed one million by 2030.3,4 Primary liver hepatocellular carcinoma (HCC or LIHC) approximately constitutes 85–90% of all liver malignancies. Chronic liver diseases, especially Hepatitis B virus (HBV) or HCV virus infection, substantially contribute to severe hepatic fibrosis or cirrhosis, elevating the risk of HCC and indicating poor prognosis.5–7 Metabolic dysfunction-associated fatty liver disease (MAFLD)-related hepatocarcinogenesis is a complex process involving lipotoxicity, oxidative stress, mitochondrial dysfunction, chronic low-grade inflammation, insulin resistance, and remodeling of the hepatic microenvironment. These processes may promote genomic instability, vascular invasion, and tumor progression even in the absence of advanced cirrhosis.8–11 Moreover, liver background status in MAFLD-related HCC may provide clinically relevant prognostic information beyond tumor-centered characteristics alone. However, previous studies have reported inconsistent prognostic associations between hepatic steatosis or MAFLD and postoperative outcomes in HCC, ranging from neutral effects on OS and RFS to apparently protective associations with recurrence, while some subgroup analyses suggest worse outcomes in specific metabolic phenotypes such as diabetic MAFLD.12–15
Consequently, radiomics enables the extraction of quantitative information from medical images and has shown value in preoperative diagnosis, histologic assessment, and prognostic prediction, particularly with computed tomography and magnetic resonance imaging.16–19 Recently, Wang et al utilized preoperative contrast-enhanced ultrasound (CEUS) and clinical data to establish a powerful predictive model for pathological grading of HCC.20 Additionally, Li et al combined ultrasomics and circulating tumor cell counts to sufficiently predict early reoccurrence of HCC after radical surgery (C-indexes of 0.933).21 Pathological differentiation grade is the “gold standard” for liver disease diagnosis, while it can only be determined postoperatively and is limited by its invasiveness.22 The Kleiner score is a well-established histopathological system for grading hepatic steatosis severity. In the present study, we considered both NAFLD status and the Kleiner score because they capture related but distinct aspects of liver background: NAFLD status reflects the presence or absence of steatotic liver disease, whereas the Kleiner score provides semiquantitative information on steatosis severity. We hypothesized that this graded pathological information might offer additional prognostic value beyond simple dichotomous classification.23,24 Thus, estimating liver fat percent through integrating ultrasomics and pathology to conduct a prognostic model is effectively instrumental for HCC patients, especially for those with high levels of liver fat.
Current prognostic biomarkers for HCC remain insufficient for reliable individualized risk stratification, clinical decision-making, and accurate postoperative outcome prediction alone.25–30 However, the prognostic significance of ultrasound-derived steatosis-related radiomic features and pathological steatosis indicators has not been systematically evaluated for either overall survival (OS) or recurrence-free survival (RFS) after curative resection. Therefore, the primary aim of this study was to develop and internally validate a machine learning–based radiopatho-clinical model integrating ultrasound radiomics, pathological steatosis assessment by the Kleiner score, and clinicopathological variables for predicting OS and RFS in patients with HCC after curative resection. A secondary objective was to compare candidate machine learning algorithms and identify the optimal model for postoperative risk stratification and prognostic assessment.
Materials and Methods
Patients Cohort
The cohort construction process is shown in Figure 1. We retrospectively reviewed 1140 consecutive patients with HCC who underwent hepatectomy at our institution between 2010 and 2023. HCC was confirmed by postoperative pathology, and all included patients underwent R0 resection with Child-Pugh class A liver function. Patients were excluded if they had incomplete baseline data or insufficient follow-up information for outcome assessment at cohort entry. Patients with allergic diseases, hematologic disorders, or other conditions that could substantially affect leukocyte counts were also excluded. The study was conducted in accordance with the Declaration of Helsinki, and written informed consent was obtained before treatment.
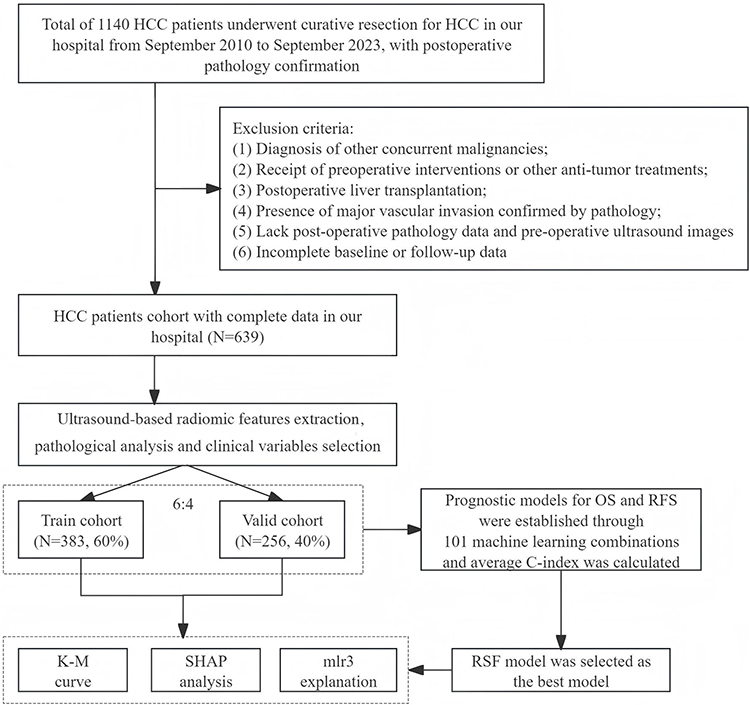 |
Figure 1 Flow chart for patient inclusion and model establishment. Abbreviations: HCC, hepatocellular carcinoma; OS, overall survival; RFS, recurrence-free survival; RSF, random survival forest; KM curve, Kaplan-Meier curve; SHAP, SHapley Additive exPlanations. |
Clinicopathological Variables
All laboratory parameters were obtained from the institutional clinical laboratory system of our hospital as part of routine preoperative assessment. External laboratory reports were not included in the present study. Baseline characteristics of the patients, including date of surgery, sex, age, alpha-fetoprotein (AFP), total albumin (TOALB), total bilirubin (TBIL), direct bilirubin (DBIL), Indirect Bilirubin (IBIL), alanine aminotransferase (ALT), aspartate aminotransferase (AST), gamma glutamyl transferase (GGT), ALPline phosphatase (ALP), ALPline (ALP) hemoglobin count (HB), platelet count (PLT), prothrombin time (PT), international normalized ratio (INR), low density lipoprotein (LDL), high density lipoprotein (HDL), diabetes (blood sugar level), peripheral blood cell counts, lymphocyte, red blood cell percentage (REDP), red blood cell number (REDN), monocyte count (MONO), antithrombin III (AT-III), neutrophil, white blood cell count (WHIT), platelet count (PLAT), uric acid, thrombin time (TT), fibrosis, D-dimer (DD), ascites, intervention therapy, Hepatitis B surface antigen (HBS), Hepatitis B surface antigen S1 (HBS1), core antibody of Hepatitis B (CAB), Hepatitis B e antigen (EAG) and Hepatitis B DNA. Tumor characteristics included the largest tumor diameter (tumor size), tumor number, cirrhosis, microvascular invasion (MVI), capsular invasion, tumor satellite nodules, and tumor differentiation. The value of tumor size was conserved to four grades: <2 cm—“1”; ≥2 cm, <5 cm—“2”, ≥5 cm, <10 cm—“3”, ≥10 cm—“4”. The value of AFP was conserved to grades: <7 ng/mL—“1”; ≥7 ng/mL, <400 cm—“2”, ≥400 ng/mL—“3”. Postoperative pathological biopsy of liver tissue is the gold standard for evaluating hepatic steatosis. NAFLD is defined as the presence of fat droplets accumulating in more than 5% of hepatocytes under low to medium magnification, without lobular inflammation, ballooning, or fibrosis. According to the Kleiner scoring system, hepatic steatosis (based on post-operative pathological confirmation) is categorized as: Grade 0, less than 5% hepatocyte steatosis; Grade 1, 5% to 33% hepatocyte steatosis; Grade 2, more than 33% to 66% hepatocyte steatosis; Grade 3, more than 66% hepatocyte steatosis. To reduce the influence of potential temporal variation in laboratory measurements, several laboratory variables were categorized according to clinically relevant thresholds before analysis.
Follow-Up
All patients were discharged from the hospital and scheduled for uniform follow-up according to our institutional protocol, including outpatient visits every 3 months during the first 2 years after surgery, and every 3–6 months thereafter. Follow-up imaging included ultrasound of the liver, with additional dynamic contrast-enhanced CT or Gd-EOB-DTPA-enhanced MRI performed when indicated by findings on routine surveillance. Additional tests such as chest, pelvic, or lower abdomen CT or PET-CT were conducted if clinically necessary. Tumor recurrence was diagnosed based on at least two imaging studies or liver histopathology. Upon detecting recurrence, treatment options—including surgical resection, local ablation, TACE, radiotherapy, systemic therapy, and supportive care—were selected according to recurrence characteristics. Survival data were collected via clinical follow-up or telephone contact, with follow-up continuing until September 2023. Follow-up began on the date of surgery. OS was defined as the time from the date of HCC diagnosis by CT/MRI until death or the last follow-up date (September 2023); and RFS was defined as the time from this starting point to the first recurrence, first metastasis, death, or last follow-up. Also, only preoperative ultrasound images and corresponding postoperative pathological specimens were used for model development. Post-recurrence treatments such as radiotherapy, local ablation, or transarterial chemoembolization (TACE) and any subsequent imaging after recurrence were not included in feature extraction or model training. Therefore, treatment-induced changes in tumor morphology did not affect the integrated model.
The whole cohort included 639 HCC patients. The median age of the cohort was 59.0 years (IQR: 52.0–66.0). Most patients were male (83.3%). Regarding comorbidities, diabetes and hypertension were present in a subset of patients, and body mass index (BMI) had a median value of 24.5 kg/m2 (IQR: 22.0–27.0). Tumor characteristics included a median tumor size of 3.6 cm (IQR: 2.5–5.0). Microvascular invasion (MVI) was present in approximately 50% of patients, and satellite nodules were observed in 12% of cases. Liver-background features included hepatic steatosis, with 17% of patients showing steatosis. Laboratory characteristics included median values for ALT (28 U/L), AST (29 U/L), total bilirubin (18 μmol/L), albumin (40 g/L), and AFP (32 ng/mL). Viral status indicated that HBsAg-positive patients accounted for 84.7%, and HBV DNA was detectable in 60% of the cohort. HCV positivity was rare in this cohort.
Ultrasound Image Pre-Processing and Feature Selection
In this study, we focus on the non-malignant parts of the ultrasound images, which are also considered the region of interest (ROI). ROI segmentation was carried out by a trained sonographer with more than 5 years of experience (reader 1) and confirmed by another sonographer with more than 10 years of experience (reader 2), both of whom were ignorant of the basic information and pathological findings of each image. The segmentation of ROI was carried out on the Onekey platform, which is an artificial intelligence research platform for medical imaging, on which radiologists can preprocess image data, select features, extract features, build models, and so on. ROIs were manually delineated in the non-malignant liver parenchyma, avoiding major vessels and bile ducts, with standardized ROI size, and independently confirmed by two experienced sonographers blinded to clinical and pathological data. Patients who remained alive without the event of interest at the end of follow-up, or who were lost to follow-up after cohort inclusion, were censored at the date of the last confirmed contact. Only preoperative ultrasound images and postoperative pathological specimens were used to construct the machine learning model. Recurrence and survival outcomes were defined from the date of surgery to the first event (death or recurrence). Imaging and pathological findings obtained after post-recurrence salvage therapies, including re-resection, local ablation, TACE, or radiotherapy, were not included in radiomic feature extraction or model training. Patients who underwent multiple sequential treatments after recurrence were retained in the cohort for follow-up reporting, but these post-treatment data did not contribute to model development.
For radiomic feature extraction from grayscale ultrasound images, this study employed the ITK-SNAP and Pyradiomics toolkit to extract various radiomic features based on the region of interest (ROI), including shape features, first-order statistical features, texture features, and quantitative analysis parameters. Among these, first-order statistical features primarily focus on the distribution of pixel intensity values within the ROI, quantifying image gray-level intensity through calculations of 7 statistical moments: mean, variance, skewness, kurtosis, energy, entropy, and median, reflecting the overall gray-level information of the image. Shape features describe the geometric shape and boundary of the tumor, including the lengths of the short and long axes, as well as the ratio of tumor surface area to volume. Texture features are obtained by calculating 5 common gray-level matrices: gray-level co-occurrence matrix (GLCM), gray-level dependence matrix (GLDM), gray-level run-length matrix (GLRLM), gray-level size zone matrix (GLSZM), and neighboring gray-tone difference matrix (NGTDM). These texture matrices capture local structural information of the image, enabling in-depth quantitative description of tumor heterogeneity, tissue structure, and internal characteristics. In the feature selection step, we eliminated redundant features that exhibited high correlation, which may originate from the same underlying distribution. Among the remaining features, we further focused on those with higher correlation to the target variable, as these features are considered to have significant potential for target identification. Therefore, this study implemented a three-step method to complete feature selection. First, radiomic features were dimensionality-reduced using strict criteria, ensuring that the intraclass correlation coefficient (ICC) within groups exceeded 0.9. Subsequently, Pearson correlation analysis was applied to select features with a correlation coefficient lower than 0.9. The Kruskal–Wallis test was used to identify features with significant differentiation (P < 0.05). To further optimize the feature pool and determine the most relevant features for model construction, LASSO logistic regression was performed using the glmnet package with 10-fold cross-validation. The optimal regularization parameter was selected according to the minimum cross-validation error criterion (lambda.min). Finally, the Radscore of each image was calculated: −1.61159607879271–0.0881588858078856*original_firstorder_Kurtosis+0.00354746749823003*original_firstorder_Median+0.00516877632723055*original_firstorder_Minimum-0.0817288261170648*original_firstorder_Skewness.
Model Construction, Evaluation, and Explanation
As previously described,31,32 this study also utilized 101 machine learning algorithms to develop predictive models, including random survival forest (RSF), elastic net (Enet), Lasso, Ridge, stepwise Cox, CoxBoost, partial least squares regression for Cox (plsRcox), supervised principal components (SuperPC), generalized boosted regression modeling (GBM), and survival support vector machine (survival-SVM). Model performance was evaluated using the concordance index (C-index), integrated cumulative/dynamic area under the curve (C/D AUC), and integrated Brier score. The C-index, which measures model discrimination, indicates practical utility if it exceeds 0.7; higher C-index values are associated with better prediction performance. The Brier score assesses predictive accuracy, with values below 0.20 suggesting practical applicability; lower Brier scores correspond to improved accuracy. Changes in C-index and Brier score over time were visualized using curves. All candidate models were run using the default parameters provided by their respective modeling frameworks, without additional hyperparameter tuning.
No a priori sample size calculation was performed because this was a retrospective prognostic modeling study. Sample adequacy was assessed based on both the events-per-variable (EPV) principle and an approximate post hoc power calculation using the Schoenfeld method for Cox models. The final integrated model included 8 predictors, yielding EPVs of 51.8 for OS and 39.8 for RFS. Under a 2-sided alpha of 0.05 and assuming a balanced binary predictor, the minimum detectable hazard ratio at 80% power was approximately 1.32 for OS and 1.37 for RFS.
To enhance the interpretability of ML models, as previously published papers,31,33 global explanations were provided through time-dependent variable importance, partial dependence survival plots, and aggregated survival SHapley Additive exPlanations (SurvSHAP) plots.34 Subsequently, the focus shifted to localized explanations for individual statistical units, specifically single patients, derived from the examination of SurvSHAP plots. The statistical analyses were conducted using the R version 4.2.3 software.
Statistical Analysis
The normality of continuous variables was evaluated using the Shapiro–Wilk test. For normally distributed variables, intergroup comparisons were conducted using independent samples t-tests; non-normally distributed variables were compared using the Mann–Whitney U-test. In the present dataset, no variable had a missingness rate greater than 20%; therefore, no variable was excluded due to missingness. All covariates were dichotomized, and categorical variables were compared using the chi-square (χ2) test. Kaplan-Meier (K-M) survival curves were constructed to assess OS and RFS, and the Log rank test was used to compare survival distributions between groups. A p-value < 0.05 was considered statistically significant. All statistical analyses and model construction were performed using R software (version 4.3.2).
Results
Workflow of This Study
Figure 1 summarizes the study workflow. Of 1140 patients with HCC initially screened, 639 met the eligibility criteria and were included in the final cohort. For each patient, preoperative ultrasound images and postoperative pathological data were collected. Regions of interest were segmented on ultrasound images, and steatosis-related radiomic features were extracted to generate the Radscore. In parallel, 2 experienced pathologists reviewed the specimens and assigned Kleiner scores. Clinical variables associated with prognosis were screened using the Boruta algorithm, and overlapping predictors for the OS and RFS models were retained. After random division into training and validation sets at a 6:4 ratio, 101 machine-learning approaches were evaluated, and RSF was selected as the optimal model. Risk stratification, SHAP-based interpretation, and time-dependent performance analyses were then performed.
Integration of Pathological, Radiomic, and Clinical Model Establishment
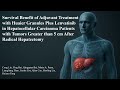
We analyzed radiomic, pathological, and clinical data from 639 patients. Representative pathological sections illustrating mild and severe steatosis according to the Kleiner score are shown in Figure 2A and B, and a representative preoperative ultrasound image from a patient with NAFLD-related HCC is shown in Figure 2C. Figure 2D summarizes the distribution of extracted radiomic features. After feature screening, LASSO was used to derive the radiomics signature (Figure 2E and F), and the final Radscore was calculated using 4 retained features. The Boruta algorithm was applied separately to identify candidate clinicopathological predictors for OS and RFS (Figure 2G and H). Variables classified as confirmed in the endpoint-specific analyses were then compared using a Venn diagram. This procedure yielded 5 shared clinicopathological predictors—MVI, tumor size, INR, AFP, and satellite nodules—which were retained in the final integrated model (Figure 2I). Variables such as AST, ALT, and cirrhosis were not retained because they were not identified as stable shared predictors across both endpoints. Blood sugar, which was used as the dataset variable corresponding to diabetes status, appeared only in the OS-specific candidate set and therefore was not included in the final shared predictor panel. These clinicopathological variables were subsequently integrated with the Radscore, NAFLD status, and Kleiner score to develop 101 machine-learning models. (Figure 2J). The cohort was randomly divided into a training set (60%) and a validation set (40%), and model performance was ranked according to the C-index in both the OS and RFS analyses. Comparative model performance was presented in Figure 2J, which summarizes the mean C-index values of 101 candidate models across four datasets (OS.train, OS.valid, RFS.train, and RFS.valid). In addition, all candidate models were run using the default parameters provided by their respective modeling frameworks, without additional hyperparameter tuning.
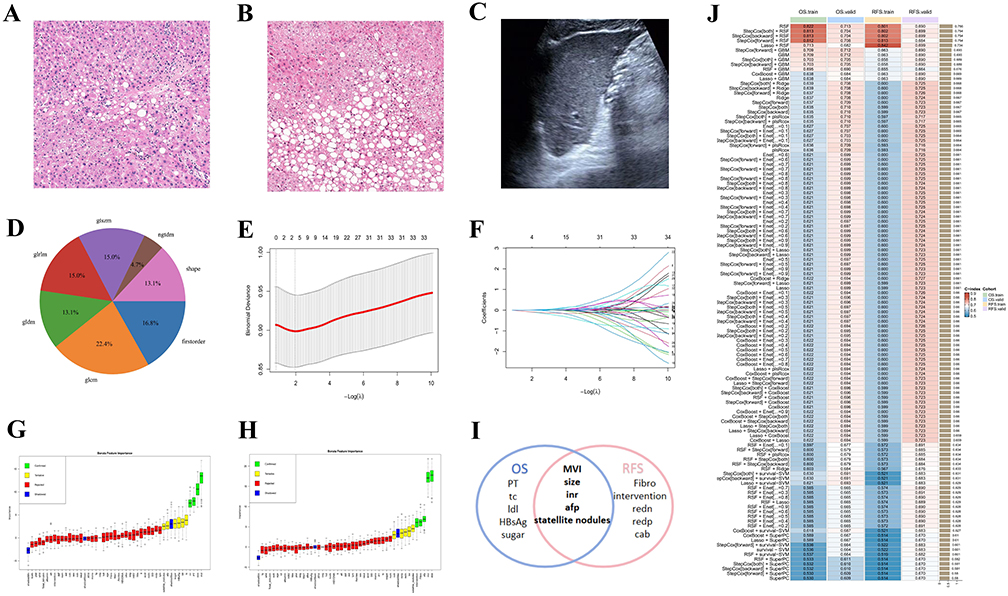 |
Figure 2 The process of selecting the features and variables and the machine learning establishment. (A and B) A representative post-operative pathological section with mild NAFLD (A) and severe NAFLD (B). (C) A representative B-mode ultrasound image of a pre-operative HCC patient with the diagnosis of NAFLD. (D) The distribution of all of the extracted radiomic features. (E and F) The lasso process for radiomics feature selection. (H and I) The Boruta algorithm displays the important variables in OS (G) and RFS (H) cohorts. (I) The “Confirmed” and “Tentative” variables are performed using a Venn diagram, and only five are considered as the vital prognostic indexes. (J) A total of 101 machine learning prognostic models are performed for the train and validation set of OS and RFS cohorts, and RSF is selected as the optimal. |
Risk Stratification and SHAP Analysis of the RSF Model
After model development, risk scores for death and recurrence were calculated for each patient. Using the third quartile as the cutoff, patients in the OS training (Figure 3A), OS validation (Figure 3B), RFS training (Figure 3C), and RFS validation (Figure 3D) cohorts were stratified into low-, intermediate-, and high-risk groups. Kaplan-Meier analysis showed clear separation among the 3 risk groups in all 4 datasets (all P < 0.001). Figure 3E presents the mean SHAP values of the 8 variables included in the RSF model for OS and RFS. The 4 most important predictors were clinical factors, namely MVI, tumor size, AFP, and INR, followed by the Kleiner score, hepatic steatosis status, and the Radscore. Swarm plots further illustrate the distribution of SHAP values for the OS (Figure 3F) and RFS (Figure 3G) models. Representative low- and high-risk cases for OS and RFS are shown in Figure 3H and I, demonstrating that the model-derived risk estimates were consistent with observed follow-up outcomes.
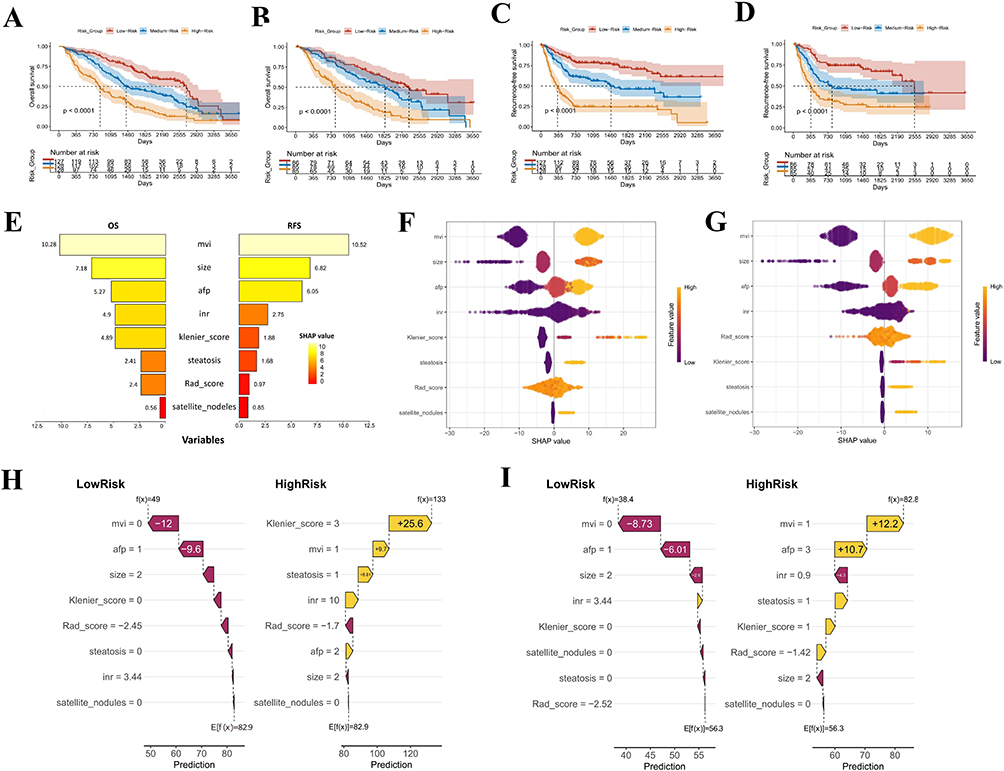 |
Figure 3 Risk stratification and SHAP analysis based on the RSF model. (A and B) Kaplan–Meier (KM) curves for overall survival (OS) stratified by RSF-derived risk groups in the train (A) and valid (B) cohorts. (C and D) KM curves for recurrence-free survival (RFS) stratified by RSF-derived risk groups in the train (C) and valid (D) cohorts. (E) Mean importance of the eight features contributing to the RSF model in OS (E.left) and RFS (E.right), ranked by SHapley Additive exPlanations (SHAP) value. (F and G) Swarm plots show the distribution of SHAP values for each feature of the OS (F) and RFS (G) cohorts. Each dot represents an individual case, colored by the feature value (yellow: high; purple: low), illustrating the impact of each feature on model output. (H and I) Four representative cases through our RSF model SHAP calculation: low risk case in OS (H.left), high risk case in OS (H.right), low risk case in RFS (I.left), and high risk case in RFS (I.right). |
Kaplan-Meier analysis of the entire cohort likewise showed significant separation for both OS (Figure 4A) and RFS (Figure 4B) across the 3 risk groups (both P < 0.001). To further examine the contribution of each variable within each subgroup, we summarized SHAP proportions using donut charts. In the OS model, MVI accounted for the largest SHAP contribution across the low-, intermediate-, and high-risk subgroups (31.4%, 49.5%, and 21.2%, respectively; Figure 4C). AFP also contributed substantially, particularly in the low-risk (19.8%) and high-risk (24.3%) groups. Notably, the Kleiner score showed a larger contribution in the high-risk subgroup (13.9%) than in the low-risk (3.7%) or intermediate-risk (6.5%) subgroup. The Radscore also contributed meaningfully, especially in the low-risk (13.8%) and high-risk (10.2%) groups. A similar pattern was observed for RFS (Figure 4D), with higher SHAP contributions from the Kleiner score and Radscore in the high-risk subgroup than in the low-risk subgroup.
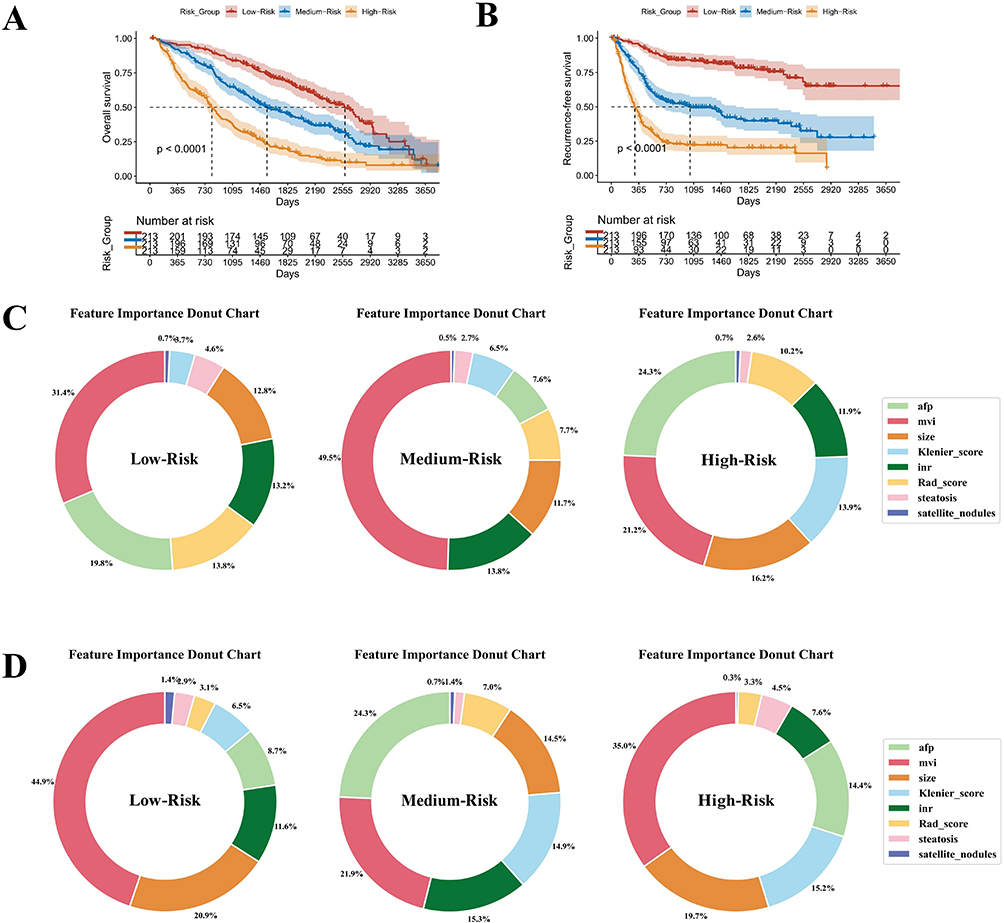 |
Figure 4 Risk stratification and SHAP value exhibition based on the three subgroups. (A and B) Kaplan–Meier (KM) curves for overall survival (OS) (A) and recurrence-free survival (RFS) (B) of all patients. (C) The donut chart shows the SHapley Additive exPlanations (SHAP) proportion of the eight variables in low-risk, medium-risk, and high-risk groups in the OS cohort. (D) The donut chart shows the SHAP proportion of the eight variables in low-risk, medium-risk, and high-risk groups in the RFS cohort. |
We next explored the relationships and potential interactions between radiological or pathological steatosis-related variables and clinical factors. In the overall cohort and in patients without fatty liver, Spearman analysis did not show strong correlations (Figure 5A and C). In contrast, among patients with fatty liver, the Kleiner score showed positive correlations with AFP and MVI, whereas the Radscore showed a weaker association with tumor size (Figure 5B). We then examined these interactions using SHAP-based analyses. In both the OS and RFS models, cases with higher Kleiner scores combined with elevated AFP or the presence of MVI showed higher SHAP values than cases without these features. A similar trend was observed in the fatty liver subgroup (Figure 5D–K). These interaction findings should be interpreted as exploratory. They indicate that steatosis-related variables may modify model-predicted risk in the presence of established tumor-related factors, but they do not establish a causal relationship between hepatic steatosis and postoperative outcomes.
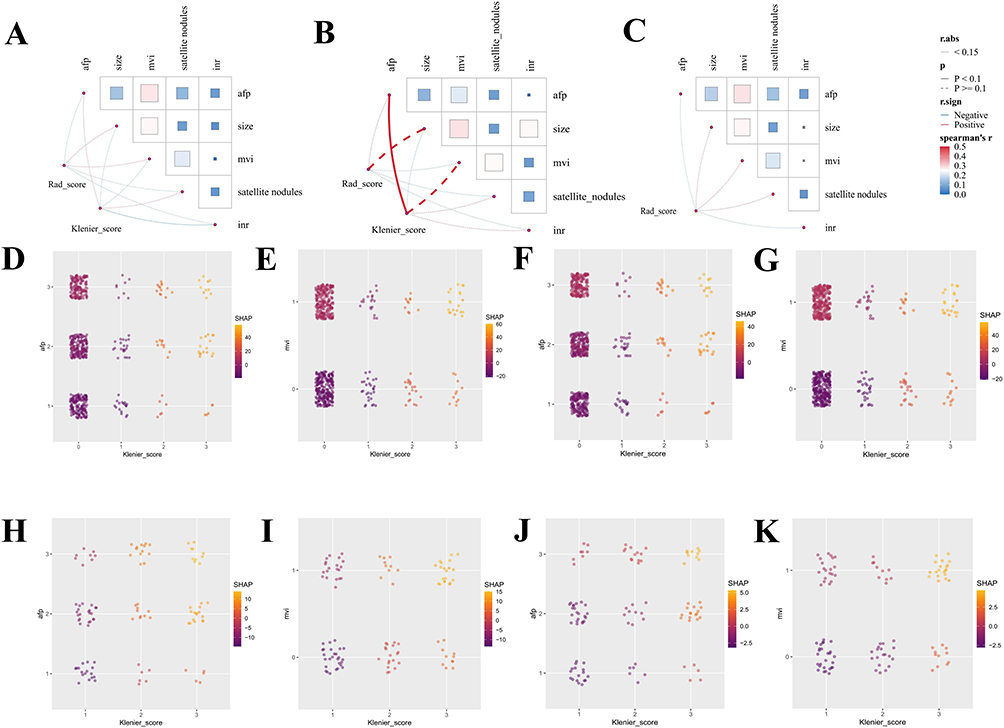 |
Figure 5 Correlation and interaction between patho-radiological features and other clinical variables. (A–C) Spearman correlation results show the relationship between Radscore and Kleiner score and five clinical variables—AFP, size, mvi, satellite nodules, and INR, in all individuals (A), fatty liver individuals (B), and non-fatty liver individuals (C). (D–G) For all individuals, alteration of SHapley Additive exPlanations (SHAP) value displays the interaction between Kleiner score and afp and mvi in the OS cohort (D and E) and RFS cohort (F and G). (H–K) For fatty liver individuals, alteration of SHAP value displays the interaction between Kleiner score and AFP and MVI in the OS cohort (H and I) and the RFS cohort (J and K). |
Performance Evaluation and MLR3 Explanation of the Integrated Model
Decision curve analysis showed that the integrated model provided greater net clinical benefit than the clinical model, the radiopathological model, and the conventional Barcelona Clinic Liver Cancer (BCLC) and China Liver Cancer (CNLC) staging systems for predicting 1-, 3-, and 5-year OS in both the training (Figure 6A–C) and validation (Figure 6D–F) cohorts. Calibration plots also demonstrated good agreement between predicted and observed 3- and 5-year OS in both datasets (Figure 6G–J), indicating favorable calibration of the integrated model.
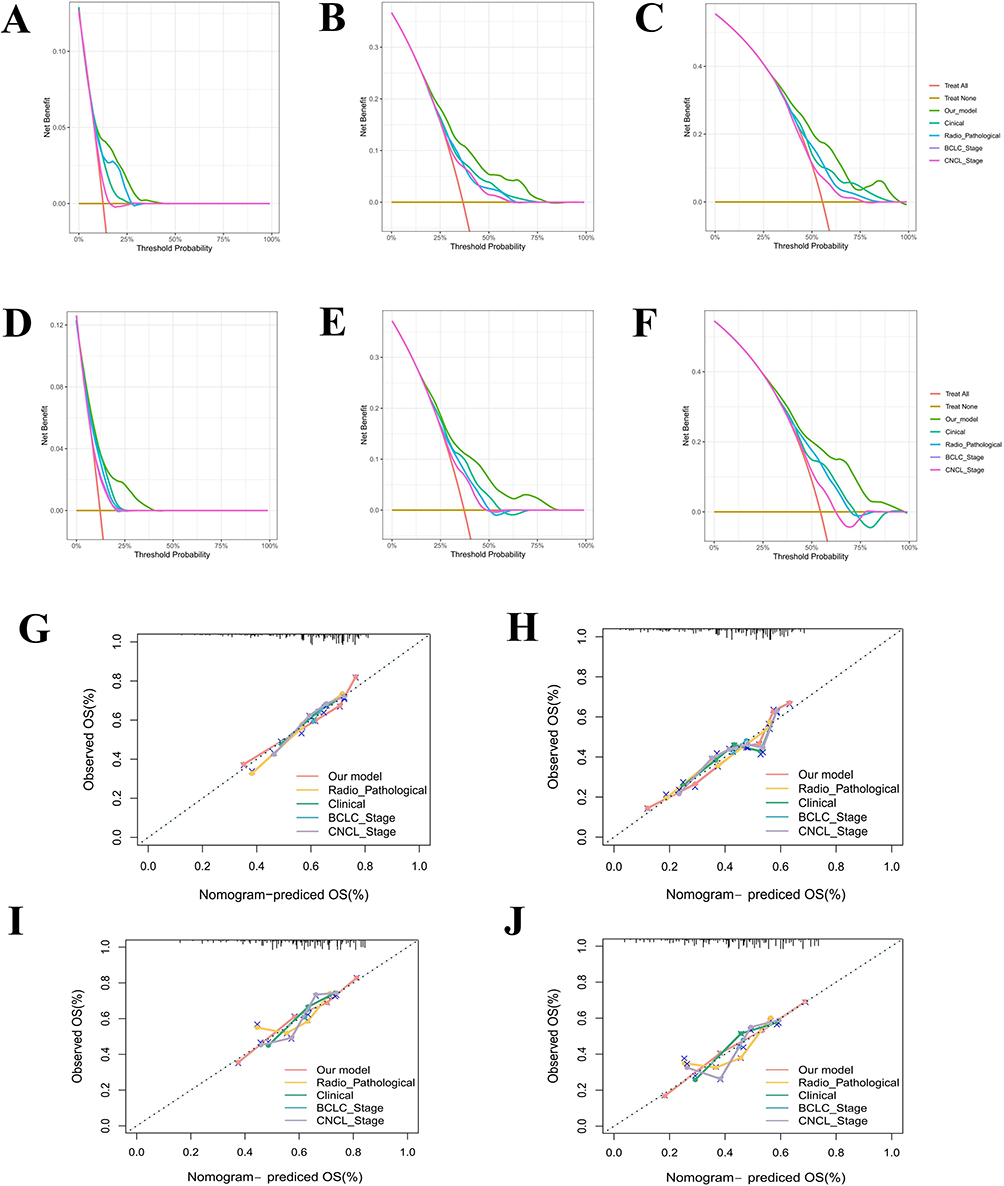 |
Figure 6 Decision curve analysis (DCA) and calibration curves of the predictive model in the OS cohort. (A–F) DCA curves at 1, 3, and 5 years in the train cohort (A–C) and valid cohort (D–F), respectively, showing the difference among our integrative model, radio-pathological model, clinical, BCLC stage, and CNLC stage. (G–J) Calibration curves at 3 and 5 years in the training cohort (G and H) and validation cohort (I and J), showing the difference among the five models. |
Similar findings were observed for RFS. The integrated model yielded higher net benefit than the comparator models for predicting 1-, 3-, and 5-year recurrence in both the training (Figure 7A–C) and validation (Figure 7D–F) cohorts. Calibration curves for 3- and 5-year RFS also showed good agreement between predicted and observed outcomes (Figure 7G–J). Overall, the integrated model outperformed the conventional comparator models in both discrimination and clinical utility.
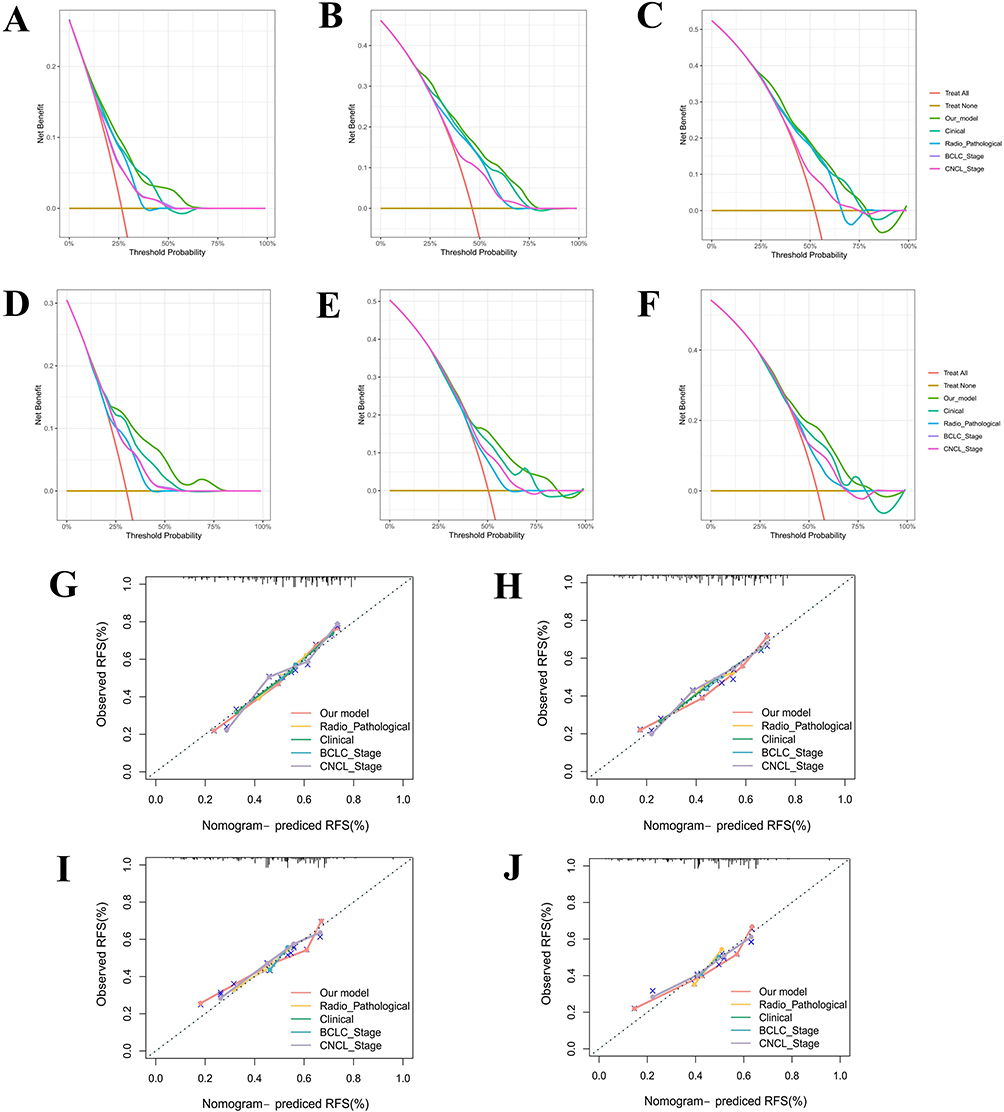 |
Figure 7 Decision curve analysis (DCA) and calibration curves of the predictive model in the RFS cohort. (A–F) DCA curves at 1, 3, and 5 years in the train cohort (A–C) and valid cohort (D–F), respectively, showing the difference among our integrative model, radio-pathological model, clinical, BCLC stage, and CNLC stage. (G–J) Calibration curves at 3 and 5 years in the training cohort (G and H) and validation cohort (I and J), showing the difference among the five models. |
To further characterize model performance over time, we calculated time-dependent Brier scores and cumulative/dynamic AUCs from 1 to 5 years using the mlr3 framework. In both the training and validation sets, the Brier score remained below 0.20, and the cumulative/dynamic AUC was generally above 0.75 for OS (Figure 8A). For OS, the AUCs of the integrated model in the training cohort were 0.827, 0.774, and 0.803 at 1, 3, and 5 years, respectively (Figure 8B), and the corresponding AUCs in the validation cohort were 0.863, 0.794, and 0.804 (Figure 8C). For RFS, the Brier score remained below 0.20, whereas the cumulative/dynamic AUC exceeded 0.65 in the training set and 0.70 in the validation set (Figure 8D). The 1-, 3-, and 5-year AUCs for RFS were 0.780, 0.793, and 0.763 in the training cohort (Figure 8E), and 0.828, 0.811, and 0.823 in the validation cohort (Figure 8F). Although the 1-year OS AUC in the validation cohort was slightly higher than that in the training cohort (0.863 vs 0.827; Figure 8B and C), this difference may reflect random variation arising from a single internal data split. Performance across 3- and 5-year time points remained comparable, and the Brier score was stable, supporting the robustness of the model. For OS, the 1-, 3-, and 5-year AUCs were 0.827, 0.774, and 0.803 in the training cohort and 0.863, 0.794, and 0.804 in the validation cohort. For RFS, the corresponding AUCs were 0.780, 0.793, and 0.763 in the training cohort and 0.828, 0.811, and 0.823 in the validation cohort, with Brier scores remaining below 0.20 in both datasets.
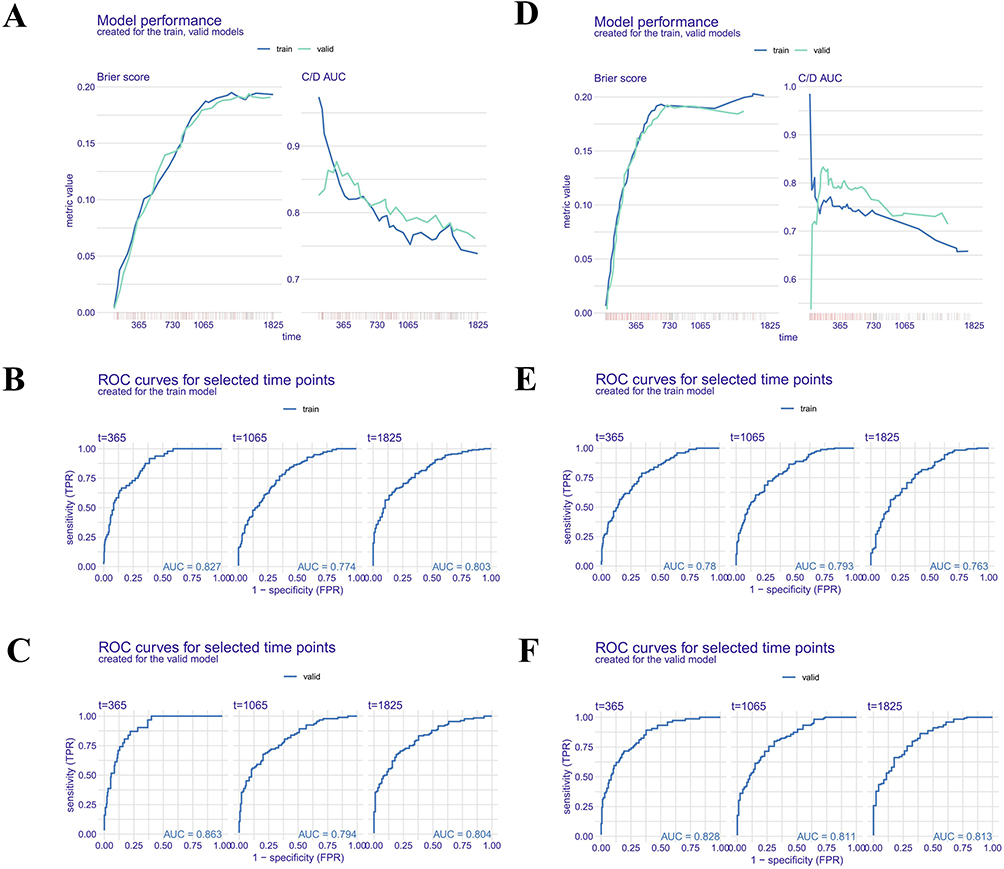 |
Figure 8 Model performance for important time points in OS and RFS cohorts. (A) Time-dependent model performance was estimated for the train and validation sets of the OS cohort, displayed by Brier score and cumulative/dynamic (C and D) AUC metrics. (B and C) Time-dependent ROC and corresponding AUC for OS prediction at 1, 3, and 5 years in the train cohort (B) and valid cohort (C). (D) Time-dependent model performance was estimated for the train and validation set with Brier score and C/D AUC metrics in the RFS cohort (D). (E and F) Time-dependent ROC and corresponding AUC for RFS prediction at 1, 3, and 5 years in the train cohort (E) and valid cohort (F). |
Discussion
NAFLD is recognized as an increasingly important etiologic factor in HCC, and hepatic steatosis may be associated with early histologic changes in the liver.5,8,35 In this study, we developed an integrated prognostic model for HCC after curative resection by combining preoperative ultrasound radiomics, postoperative Kleiner score, and routinely available clinicopathological variables. Notably, among 101 machine-learning strategies, the RSF model showed the best overall performance for both OS and RFS. In the validation cohort, the model achieved stable discrimination at 1, 3, and 5 years and consistently outperformed the Barcelona Clinic Liver Cancer (BCLC) and China Liver Cancer (CNLC) staging systems in decision curve analysis and calibration analyses. Consequently, these findings suggest that incorporating steatosis-related information is associated with improved postoperative risk stratification beyond conventional tumor stage-based approaches.
A notable aspect of the present study is the incorporation of liver-background information into postoperative prognostic assessment. By evaluating 101 machine learning strategies, we identified RSF as the best-performing model for both OS and RFS prediction (Figure 2). Compared with conventional linear models, the RSF algorithm is able to capture complex non-linear relationships and high-dimensional data structures without relying on the proportional hazards assumption.33,36,37 Feature selection using the Boruta algorithm further supported model construction by identifying a subset of confirmed predictors, including MVI, tumor size, and AFP, while reducing the influence of less informative variables.38 To improve model interpretability, we incorporated SHAP and time-dependent variable importance analyses.39–41 This approach provided interpretable estimates of variable contributions at both global and individual patient levels. The favorable predictive performance, reflected by time-dependent AUCs and higher net clinical benefit in DCA, suggests that the integrated machine learning model may improve postoperative risk stratification compared with established staging systems such as BCLC and CNLC. The slightly higher 1-year OS AUC in the validation cohort compared with the training cohort may be attributable to sampling variability due to the single internal split. Overall, time-dependent AUCs and Brier scores confirm that the model provides stable medium-term predictive performance. Also, external validation in independent cohorts is warranted to further assess generalizability.
Furthermore, an important aspect of our study is the integration of ultrasound-based radiomics as a non-invasive correlate of histopathological hepatic steatosis. While the Kleiner scoring system remains the “gold standard” for quantifying liver fat content,23,42 its clinical utility is limited by its invasiveness and potential sampling bias during biopsy. Our Radscore, derived from first-order statistical features including Kurtosis and Skewness, captures subtle alterations in acoustic attenuation and echo-intensity distribution associated with fatty liver.43,44 SHAP analysis indicated a synergy between the Radscore and the Kleiner score, particularly in the high-risk subgroup, suggesting that higher background steatosis may be associated with an increased postoperative risk profile (Figure 4). In the context of the “seed and soil” hypothesis, these findings may reflect a potential link between a lipotoxic and pro-inflammatory hepatic microenvironment related to chronic NAFLD and increased risk of microvascular invasion and early intrahepatic recurrence. However, given the retrospective and observational nature of the present study, these findings should be considered hypothesis-generating rather than evidence of causality.45,46 By integrating preoperative imaging and postoperative pathology, the model provides a comprehensive assessment of liver background, offering clinicians insights into hepatic metabolic status before surgical intervention.
Notably, previous studies have reported inconsistent conclusions regarding the prognostic role of NAFLD or MAFLD in HCC patients undergoing curative resection. Such inconsistency may partly reflect the marked biological and prognostic heterogeneity of HCC, including differences in underlying molecular subtypes and tumor–microenvironment interactions.47 For example, Xiong et al demonstrated that MAFLD was not an independent prognostic factor for overall survival in 576 HCC patients and even showed a protective effect on recurrence-free survival in univariate analysis.15 Likewise, these neutral or apparently protective findings suggest that the prognostic implications of MAFLD/NAFLD may vary according to cohort composition, endpoint definition, and analytical strategy. By contrast, Hamza et al illustrated that MAFLD was linked with increased mortality in female HCC patients, underscoring potential sex-specific heterogeneity.14 Furthermore, Xiong’s subsequent study showed that concurrent MAFLD was associated with a higher incidence of postoperative complications, especially in patients with diabetes.48 Taken together, the available evidence appears mixed rather than uniform. In contrast, our findings suggest that hepatic steatosis, particularly when quantified by the Kleiner score, may contribute to postoperative risk stratification, especially in high-risk subgroups. This discrepancy may be attributable to differences in study design and variable modeling. Unlike conventional analyses that treat NAFLD as a binary variable, our study incorporates quantitative pathological grading and integrates it with radiomic features and machine learning algorithms, thereby capturing the heterogeneous biological effects of hepatic steatosis more comprehensively.
The biological plausibility of these findings is supported by prior work on NAFLD-associated hepatocarcinogenesis. Hepatic steatosis is closely associated with lipotoxicity, oxidative stress, chronic inflammation, and remodeling of the hepatic microenvironment.49–51 MAFLD-related hepatocarcinogenesis is a complex process, which may promote genomic instability, vascular invasion, and tumor progression even in the absence of advanced cirrhosis.51,52 Also, these processes may promote vascular invasion, facilitate intrahepatic dissemination, and increase the likelihood of recurrence after surgery.53–56 Moreover, our SHAP interaction analysis revealed that the prognostic impact of the Kleiner score is amplified in the presence of high AFP levels and microvascular invasion (Figure 5), suggesting a synergistic effect between metabolic dysfunction and tumor aggressiveness. These interaction findings should be interpreted as exploratory and associative, indicating that steatosis-related variables may modify model-predicted risk in the presence of established tumor-aggressive features, without establishing a causal relationship.
Furthermore, from a clinical perspective, this model may have several practical implications. First, ultrasound is widely available and inexpensive, making radiomics-based assessment of liver background potentially applicable in routine preoperative evaluation. Second, the integration of imaging, pathology, and clinical variables enables more refined identification of patients at high risk of death or recurrence after resection. Such patients may be candidates for closer surveillance and more individualized postoperative management. For example, patients classified as high risk may be considered for shorter follow-up intervals, more intensive imaging surveillance, or closer multidisciplinary evaluation for adjuvant treatment eligibility, whereas low-risk patients may avoid unnecessary intensive monitoring. Third, the use of SHAP-based explanations improves transparency and may facilitate clinical acceptance of the model in multidisciplinary decision-making.
Moreover, the integrated machine learning model has several potential applications. First, it enables individualized risk stratification for OS and RFS by combining preoperative ultrasound radiomics, postoperative Kleiner score, and routine clinicopathological variables. High-risk patients identified by the model may benefit from closer surveillance, more intensive follow-up, or consideration of adjuvant therapy, while low-risk patients may require less intensive monitoring. Second, the use of widely available, low-cost, and non-invasive ultrasound facilitates feasible implementation in routine preoperative evaluation. Third, model interpretability using SHAP allows transparent communication of risk factors to clinicians, supporting multidisciplinary decision-making. Finally, potential barriers to clinical adoption include the need for standardized imaging protocols, computational infrastructure, training of staff, and integration into electronic health records. Addressing these factors will be crucial for successful real-world translation of the predictive model.
Several limitations should be acknowledged. This was a retrospective single-center study with a cohort predominantly composed of HBV-related HCC patients, which may limit the generalizability of our findings to NAFLD-predominant populations or other ethnic groups. Although internal validation was performed, external validation in independent multicenter cohorts is needed to confirm model applicability across diverse clinical settings. Ultrasound acquisition and ROI delineation remain operator-dependent, which may affect the reproducibility of radiomic features despite strict ICC-based filtering. Finally, while the current study demonstrates prognostic associations, the mechanistic links between ultrasound-derived radiomic phenotypes, histologic steatosis, and tumor progression remain to be clarified in future translational studies. Consequently, the conclusions are framed as hypothesis-generating, emphasizing the need for prospective validation. In addition, the observation that the 1-year AUC in the validation cohort was slightly higher than that in the training cohort suggests possible sampling-related instability in the internal split. Although this was not accompanied by consistently better validation performance across all time points, it nevertheless underscores the need for external validation in independent cohorts. In addition, although a predefined institutional follow-up schedule was used, incomplete surveillance or missed follow-up visits after cohort inclusion may still have introduced surveillance bias, particularly in the assessment of recurrence-free survival. Also, because the study period spanned more than a decade, temporal variation in laboratory assay platforms, calibration standards, or reference ranges may have introduced measurement heterogeneity. Although laboratory data were obtained from the same institutional system and several variables were categorized to reduce this influence, such bias cannot be completely excluded.
Given the long duration of the study (2010–2023), potential heterogeneity in ultrasound devices and acquisition protocols, as well as in pathological evaluation and treatment strategies, was minimized by adhering to standardized institutional procedures. All preoperative ultrasound images were acquired according to the same imaging protocol and reviewed by two experienced sonographers, while all histopathological slides were scored according to the Kleiner system by two pathologists in consensus. Despite these measures, minor temporal or technical variations cannot be fully excluded and are acknowledged as a limitation of the retrospective design.
Overall, we established an integrated radiopatho-clinical machine learning model for HCC by combining ultrasound radiomics, Kleiner score, and clinicopathological variables. The model showed favorable internal performance for predicting OS and RFS after curative resection and suggested that steatosis-related features may provide complementary prognostic information beyond conventional tumor-centered factors. These findings may support more individualized postoperative surveillance and risk stratification, particularly in patients with NAFLD-related liver background. However, the mechanistic links between hepatic steatosis, radiomic phenotypes, and tumor progression remain to be clarified, and external validation in independent multicenter cohorts is required before broader clinical application.
Abbreviations
HCC, Hepatocellular carcinoma; NAFLD, Nonalcoholic fatty liver disease; OS, Overall survival; RFS, Recurrence-free survival; RSF, Random survival forest; BCLC, Barcelona Clinic Liver Cancer; CNLC, China Liver Cancer; SHAP, SHapley Additive exPlanations; CEUS, Contrast-enhanced ultrasound; ROI, Region of interest; LASSO, Least absolute shrinkage and selection operator; Radscore, Radiomics signature score; ML, Machine learning; Enet, Elastic net; plsRcox, Partial least squares regression for Cox; SuperPC, Supervised principal components; GBM, Generalized boosted regression modeling; survival-SVM, Survival support vector machine; PET-CT, Positron emission tomography-computed tomography; MRI, Magnetic resonance imaging; CT, Computed tomography; K-M, Kaplan-Meier; ICC, Intraclass correlation coefficient; DCA, Decision curve analysis; C-index, Concordance index; AUC, Area under the curve; ALT, Alanine aminotransferase; AST, Aspartate aminotransferase; TBIL, Total bilirubin; DBIL, Direct bilirubin; IBIL, Indirect bilirubin; GGT, Gamma-glutamyl transferase; ALP, ALPline phosphatase; ALP, ALPline hemoglobin count; HB, Hemoglobin; PLT, Platelet count; PLAT, Platelet count (duplicate); PT, Prothrombin time; INR, International normalized ratio; LDL, Low-density lipoprotein; HDL, High-density lipoprotein; AFP, Alpha-fetoprotein; MONO, Monocyte count; AT-III, Antithrombin III; TT, Thrombin time; DD, D-dimer; CAB, Core antibody of Hepatitis B; HBS, Hepatitis B surface antigen; HBS1, Hepatitis B surface antigen S1; EAG, Hepatitis B e antigen.
Data Sharing Statement
Data will be made available on request from the corresponding author.
Ethics Approval and Consent to Participate
The study protocol was approved by the Ethics Committee of the Affiliated Hospital of Qingdao University (No. QYFY WZLL 30019). Written informed consent was obtained from all participants or their immediate family members before treatment.
Acknowledgments
Thank all the authors and participants for their contributions to this study.
Author Contributions
All authors made a significant contribution to the work reported, whether that is in the conception, study design, execution, acquisition of data, analysis and interpretation, or in all these areas; took part in drafting, revising or critically reviewing the article; gave final approval of the version to be published; have agreed on the journal to which the article has been submitted; and agree to be accountable for all aspects of the work.
Funding
This research received no specific grant from any funding agency in the public, commercial, or not-for-profit sectors.
Disclosure
The authors declare no competing interests.
References
1. Rumgay H, Arnold M, Ferlay J, et al. Global burden of primary liver cancer in 2020 and predictions to 2040. J Hepatol. 2022;77(6):1598–17. doi:10.1016/j.jhep.2022.08.021
2. Foerster F, Gairing SJ, Müller L, Galle PR. NAFLD-driven HCC: safety and efficacy of current and emerging treatment options. J Hepatol. 2022;76:446–457. doi:10.1016/j.jhep.2021.09.007
3. Villanueva A. Hepatocellular carcinoma. New Engl J Med. 2019;380:1450–1462. doi:10.1056/NEJMra1713263
4. He W, Peng B, Tang Y, et al. Nomogram to predict survival of patients with recurrence of hepatocellular carcinoma after surgery. Clin Gastroenterol Hepatol. 2018;16:756–764.e710. doi:10.1016/j.cgh.2017.12.002
5. Huang DQ, El-Serag HB, Loomba R. Global epidemiology of NAFLD-related HCC: trends, predictions, risk factors and prevention. Nat Rev Gastroenterol Hepatol. 2021;18:223–238. doi:10.1038/s41575-020-00381-6
6. Sheta E, El-Kalla F, El-Gharib M, et al. Comparison of single-session transarterial chemoembolization combined with microwave ablation or radiofrequency ablation in the treatment of hepatocellular carcinoma: a randomized-controlled study. Eur J Gastroenterol Hepatol. 2016;28:1198–1203. doi:10.1097/meg.0000000000000688
7. Sensi B, Angelico R, Toti L, et al. Mechanism, potential, and concerns of immunotherapy for hepatocellular carcinoma and liver transplantation. Current Mol Pharmacol. 2024;17:e18761429310703. doi:10.2174/0118761429310703240823045808
8. Baiceanu A, Mesdom P, Lagouge M, Foufelle F. Endoplasmic reticulum proteostasis in hepatic steatosis. Nat Rev Endocrinol. 2016;12:710–722. doi:10.1038/nrendo.2016.124
9. Xu Z, Zhu Y, Chen F, et al. Two-step machine learning model enhances identification of high-risk metabolic dysfunction-associated steatotic liver disease. Liver Int. 2026;46:e70491. doi:10.1111/liv.70491
10. Velliou RI, Legaki AI, Nikolakopoulou P, Vlachogiannis NI, Chatzigeorgiou A. Liver endothelial cells in NAFLD and transition to NASH and HCC. Cell Mol Life Sci. 2023;80:314. doi:10.1007/s00018-023-04966-7
11. Khare T, Liu K, Chilambe LO, Khare S. NAFLD and NAFLD related HCC: Emerging treatments and clinical trials. Int J Mol Sci. 2025;26. 10.3390/ijms26010306.
12. Xiong KG, Ke KY, Chen LF, et al. The impact of metabolic dysfunction-associated fatty liver disease on the prognosis of patients with hepatocellular carcinoma after radical resection. Hepat Pancreatic Dis Int. 2023;22:366–372. doi:10.1016/j.hbpd.2022.04.001
13. Liu L, Xie S, Teng YX, et al. Outcomes of liver resection for metabolic dysfunction-associated fatty liver disease or chronic hepatitis B-related HCC. Front Oncol. 2021;11:783339. doi:10.3389/fonc.2021.783339
14. Butt HN, Arshad F, Asad M, et al. Impact of metabolic dysfunction-associated fatty liver disease on the prognosis of patients with hepatocellular carcinoma after radical resection: a retrospective study. Cureus. 2024;16:e75302. doi:10.7759/cureus.75302
15. Xiong KG, Lin TS, Lin QB, Kong JF, Ke KY. Impact of metabolic dysfunction-associated fatty liver disease on survival outcomes in patients undergoing radical resection for hepatitis B virus-related hepatocellular carcinoma. Sci Rep. 2025;15:18027. doi:10.1038/s41598-025-03244-9
16. Lambin P, Rios-Velazquez E, Leijenaar R, et al. Radiomics: extracting more information from medical images using advanced feature analysis. Eur J Cancer. 2012;48:441–446. doi:10.1016/j.ejca.2011.11.036
17. Mao B, Ma J, Duan S, Xia Y, Tao Y, Zhang L. Preoperative classification of primary and metastatic liver cancer via machine learning-based ultrasound radiomics. Eur Radiol. 2021;31:4576–4586. doi:10.1007/s00330-020-07562-6
18. Li Z, Yu J, Li Y, et al. Preoperative radiomics nomogram based on CT image predicts recurrence-free survival after surgical resection of hepatocellular carcinoma. Acad Radiol. 2023;30:1531–1543. doi:10.1016/j.acra.2022.12.039
19. Wang F, Zhan G, Chen QQ, et al. Multitask deep learning for prediction of microvascular invasion and recurrence-free survival in hepatocellular carcinoma based on MRI images. Liver Int. 2024;44:1351–1362. doi:10.1111/liv.15870
20. Wang W, Wu SS, Zhang JC, et al. Preoperative pathological grading of hepatocellular carcinoma using ultrasomics of contrast-enhanced ultrasound. Acad Radiol. 2021;28:1094–1101. doi:10.1016/j.acra.2020.05.033
21. Li W, Zhuang BW, Qiao B, et al. Circulating tumour cell counts and ultrasomics signature-based nomogram for preoperative prediction of early recurrence of hepatocellular carcinoma after radical treatment. Brit J Radiol. 2022;95:20211137. doi:10.1259/bjr.20211137
22. Court CM, Harlander‐Locke MP, Markovic D, et al. Determination of hepatocellular carcinoma grade by needle biopsy is unreliable for liver transplant candidate selection. Liver Transplant. 2017;23:1123–1132. doi:10.1002/lt.24811
23. Kleiner DE, Brunt EM, Van Natta M, et al. Design and validation of a histological scoring system for nonalcoholic fatty liver disease. Hepatology. 2005;41:1313–1321. doi:10.1002/hep.20701
24. Zhu MJ, Song YJ, Rao PL, Gu WY, Xu Y, Xu HX.Therapeutic role of Prunella vulgaris L. polysaccharides in non-alcoholic steatohepatitis and gut dysbiosis. J Integr Med. 2025;23:297–308. doi:10.1016/j.joim.2025.03.002
25. Elhendawy M, Abdul-Baki EA, Abd-Elsalam S, et al. MicroRNA signature in hepatocellular carcinoma patients: identification of potential markers. Mol Biol Rep. 2020;47:4945–4953. doi:10.1007/s11033-020-05521-4
26. Tayob N, Kanwal F, Alsarraj A, Hernaez R, El-Serag HB. The performance of AFP, AFP-3, DCP as biomarkers for detection of hepatocellular carcinoma (HCC): a Phase 3 biomarker study in the United States. Clin Gastroenterol Hepatol. 2023;21:415–423.e414. doi:10.1016/j.cgh.2022.01.047
27. Luo P, Wu S, Yu Y, et al. Current status and perspective biomarkers in AFP negative HCC: towards screening for and diagnosing hepatocellular carcinoma at an earlier stage. Pathol Oncol Res. 2020;26:599–603. doi:10.1007/s12253-019-00585-5
28. Gudivada IP, Amajala KC. Integrative bioinformatics analysis for targeting hub genes in hepatocellular carcinoma treatment. Current Genom. 2025;26:48–80. doi:10.2174/0113892029308243240709073945
29. Xu W, Liao S, Hu Y, Huang Y, Zhou J. Upregulation of miR-3130-5p enhances hepatocellular carcinoma growth by suppressing ferredoxin 1: miR-3130-5p enhances HCC growth via inhibiting FDX1. Current Mol Pharmacol. 2024;17:e18761429358008. doi:10.2174/0118761429358008250305070518
30. Ye W, Wang J, Zheng J, Jiang M, Zhou Y, Wu Z. Association between higher expression of Vav1 in hepatocellular carcinoma and unfavourable clinicopathological features and prognosis. Protein Pept Lett. 2024;31:706–713. doi:10.2174/0109298665330781240830042601
31. Li CL, Yao ZY, Qu C, et al. Machine learning model reveals the risk, prognosis, and drug response of histamine-related signatures in pancreatic cancer. Discover Oncol. 2025;16:155. doi:10.1007/s12672-025-01910-y
32. Qu C, Zeng P, Li C, et al. A machine learning model based on preoperative multiparametric quantitative DWI can effectively predict the survival and recurrence risk of pancreatic ductal adenocarcinoma. Insights Imag. 2025;16:38. doi:10.1186/s13244-025-01915-9
33. Hao A, Li C, Sun R, et al. Predictive value of hepatic steatosis for postoperative recurrence in hepatitis B-related hepatocellular carcinoma: development of a machine learning-based prognostic model. J Hepatocell Carcinoma. 2025;12:2459–2475. doi:10.2147/jhc.S536629
34. Kovalev MS, Utkin LV. A robust algorithm for explaining unreliable machine learning survival models using the Kolmogorov-Smirnov bounds. Neural Networks. 2020;132:1–18. doi:10.1016/j.neunet.2020.08.007
35. Ioannou GN. Epidemiology and risk-stratification of NAFLD-associated HCC. J Hepatol. 2021;75:1476–1484. doi:10.1016/j.jhep.2021.08.012
36. Shao G, Ma Y, Qu C, et al. Machine learning model based on the neutrophil-to-eosinophil ratio predicts the recurrence of hepatocellular carcinoma after surgery. J Hepatocell Carcinoma. 2024;11:679–691. doi:10.2147/jhc.S455612
37. Wu Z, Xiong J, Liu Q, et al. Integrated machine learning and multi-omics identifies a novel molecular signature for improving the prognosis of hepatocellular carcinoma. J Hepatocell Carcinoma. 2026;13:574690. doi:10.2147/jhc.S574690
38. Sun RT, Li CL, Jiang YM, et al. A radiomics-clinical predictive model for difficult laparoscopic cholecystectomy based on preoperative CT imaging: a retrospective single center study. World J Emerg Surg. 2025;20:62. doi:10.1186/s13017-025-00635-1
39. Gadour E, AlQahtani MS. Illuminating the black box: machine learning enhances preoperative prediction in intrahepatic cholangiocarcinoma. World J Gastroenterol. 2025;31(106592). doi:10.3748/wjg.v31.i17.106592
40. Karim MR, Islam T, Shajalal M, et al. Explainable AI for bioinformatics: methods, tools and applications. Briefings Bioinf. 2023;24. doi:10.1093/bib/bbad236
41. Jiao H, Zhang Z. Construction of a preoperative prediction model for TACE resistance in primary hepatocellular carcinoma based on machine learning algorithms. J Hepatocell Carcinoma. 2026;13:590574. doi:10.2147/jhc.S590574
42. Abdurrachim D, Wee A, Soon G, et al. AI-assisted fibrosis scoring in MASH: exploring pathologist decision-making with an SHG-based AI digital pathology tool. JHEP Rep. 2026;8:101752. doi:10.1016/j.jhepr.2026.101752
43. Han X, Gong B, Guo L, et al. B-mode ultrasound based CAD for liver cancers via multi-view privileged information learning. Neural Networks. 2023;164:369–381. doi:10.1016/j.neunet.2023.03.028
44. Meng F, Shi J, Gong B, et al. B-mode ultrasound based diagnosis of liver cancer with CEUS images as privileged information. Ann Int Conf IEEE Eng Med Biol Soc. 2018;2018:3124–3127. doi:10.1109/embc.2018.8513062
45. Loomba R, Friedman SL, Shulman GI. Mechanisms and disease consequences of nonalcoholic fatty liver disease. Cell. 2021;184:2537–2564. doi:10.1016/j.cell.2021.04.015
46. Foglia B, Sutti S, Cannito S, et al. Histidine-rich glycoprotein in metabolic dysfunction-associated steatohepatitis-related disease progression and liver carcinogenesis. Front Immunol. 2024;15:1342404. doi:10.3389/fimmu.2024.1342404
47. Li XJ, Chang L, Mi Y, et al. Integrated-omics analysis defines subtypes of hepatocellular carcinoma based on circadian rhythm. J Integr Med. 2025;23:445–456. doi:10.1016/j.joim.2025.06.003
48. Xiong KG, Ke KY, Kong JF, et al. Metabolic dysfunction-associated fatty liver disease increases the risk of complications after radical resection in patients with hepatocellular carcinoma. World J Surg Oncol. 2024;22:117. doi:10.1186/s12957-024-03385-7
49. Wu Q, Yang Y, Lin S, Geller DA, Yan Y. The microenvironment in the development of MASLD-MASH-HCC and associated therapeutic in MASH-HCC. Front Immunol. 2025;16:1569915. doi:10.3389/fimmu.2025.1569915
50. Zhang X, Coker OO, Chu ES, et al. Dietary cholesterol drives fatty liver-associated liver cancer by modulating gut microbiota and metabolites. Gut. 2021;70:761–774. doi:10.1136/gutjnl-2019-319664
51. Peiseler M, Schwabe R, Hampe J, Kubes P, Heikenwaelder M, Tacke F. Immune mechanisms linking metabolic injury to inflammation and fibrosis in fatty liver disease - novel insights into cellular communication circuits. J Hepatol. 2022;77:1136–1160. doi:10.1016/j.jhep.2022.06.012
52. Fernández-Tussy P, Cardelo MP, Zhang H, et al. miR-33 deletion in hepatocytes attenuates MASLD-MASH-HCC progression. JCI Insight. 2024;9. doi:10.1172/jci.insight.168476
53. Xu Q, Feng M, Ren Y, et al. From NAFLD to HCC: advances in noninvasive diagnosis. Biomed Pharmacothe. 2023;165:115028. doi:10.1016/j.biopha.2023.115028
54. Anstee QM, Reeves HL, Kotsiliti E, Govaere O, Heikenwalder M. From NASH to HCC: current concepts and future challenges. Nat Rev Gastroenterol Hepatol. 2019;16:411–428. doi:10.1038/s41575-019-0145-7
55. Yagi K, Shimada S, Akiyama Y, et al. Loss of SFXN1 mitigates lipotoxicity and predicts poor outcome in non-viral hepatocellular carcinoma. Sci Rep. 2023;13:9449. doi:10.1038/s41598-023-36660-w
56. Xu J, Ji L, Ruan Y, et al. UBQLN1 mediates sorafenib resistance through regulating mitochondrial biogenesis and ROS homeostasis by targeting PGC1β in hepatocellular carcinoma. Signal Transduction Targeted Ther. 2021;6:190. doi:10.1038/s41392-021-00594-4
 © 2026 The Author(s). This work is published and licensed by Dove Medical Press Limited. The
full terms of this license are available at https://www.dovepress.com/terms
and incorporate the Creative Commons Attribution
- Non Commercial (unported, 4.0) License.
By accessing the work you hereby accept the Terms. Non-commercial uses of the work are permitted
without any further permission from Dove Medical Press Limited, provided the work is properly
attributed. For permission for commercial use of this work, please see paragraphs 4.2 and 5 of our Terms.
© 2026 The Author(s). This work is published and licensed by Dove Medical Press Limited. The
full terms of this license are available at https://www.dovepress.com/terms
and incorporate the Creative Commons Attribution
- Non Commercial (unported, 4.0) License.
By accessing the work you hereby accept the Terms. Non-commercial uses of the work are permitted
without any further permission from Dove Medical Press Limited, provided the work is properly
attributed. For permission for commercial use of this work, please see paragraphs 4.2 and 5 of our Terms.
Recommended articles
A Machine Learning Model Based on Health Records for Predicting Recurrence After Microwave Ablation of Hepatocellular Carcinoma
An C, Yang H, Yu X, Han Z, Cheng Z, Liu F, Dou J, Li B, Li Y, Li Y, Yu J, Liang P
Journal of Hepatocellular Carcinoma 2022, 9:671-684
Published Date: 28 July 2022
Prognosis and Personalized Treatment Prediction in Different Mutation-Signature Hepatocellular Carcinoma
Zhang Y, Liu Z, Li J, Li X, Duo M, Weng S, Lv P, Jiang G, Wang C, Li Y, Liu S, Li Z
Journal of Hepatocellular Carcinoma 2023, 10:241-255
Published Date: 15 February 2023
Combined Bone Mineral Density (BMD) and Monocyte-to-Lymphocyte Ratio (MLR) Predicts Recurrence and Prognosis in Hepatocellular Carcinoma Patients Following Liver Resection
He ZJ, Hu T, Zhang ZS, Wang TC, Huang W
Risk Management and Healthcare Policy 2024, 17:2741-2754
Published Date: 9 November 2024
Effect of Narrow-Margin Hepatectomy Combined with Intraoperative Radiotherapy on Long-Term Prognosis of Patients with Centrally Located Hepatocellular Carcinoma: A Propensity Score Matching Analysis
Tao C, Liu L, Hu N, Wang H, Zhang K, Liu Y, Wu F, Wang L, Rong W, Wu J
Journal of Hepatocellular Carcinoma 2025, 12:261-274
Published Date: 15 February 2025
Survival Benefit of Adjuvant Treatment with Huaier Granules Plus Lenvatinib in Hepatocellular Carcinoma Patients with Tumors Greater Than 5 cm After Radical Hepatectomy
Liu C, Bai Y, Bai Q, Parra MA, Zhao L, Zou J, Cao Q, Liu H, Yang H
Journal of Hepatocellular Carcinoma 2025, 12:1495-1507
Published Date: 20 July 2025