Back to Journals » Journal of Inflammation Research » Volume 18
Machine Learning and Mendelian Randomization Identify Six Cell Death-Related Genes Driving Ulcerative Colitis Progression and Treatment Response
Authors Dai L, Zhou W, Li A, Xu X, Yuan B, Zhang Z ![]()
Received 23 April 2025
Accepted for publication 5 September 2025
Published 19 September 2025 Volume 2025:18 Pages 13073—13088
DOI https://doi.org/10.2147/JIR.S536145
Checked for plagiarism Yes
Review by Single anonymous peer review
Peer reviewer comments 2
Editor who approved publication: Dr Fatih Türker
Longfei Dai,1 Weiguo Zhou,1 Along Li,1 Xinjian Xu,1 Bin Yuan,2,3 Zhen Zhang1
1Department of General Surgery, The First Affiliated Hospital of Anhui Medical University, Hefei, Anhui, People’s Republic of China; 2Department of Pharmacology, School of Pharmaceutical Sciences, Anhui Medical University, Hefei, Anhui, People’s Republic of China; 3The First Department of Critical Care Medicine, The Second Affiliated Hospital of Anhui Medical University, Hefei, Anhui, People’s Republic of China
Correspondence: Zhen Zhang, Email [email protected] Bin Yuan, Email [email protected]
Background: The pathogenesis of ulcerative colitis (UC) is thought to involve abnormal regulation of cell death. However, key cell death-related genes (CDGs) that drive disease progression have not been fully characterized. The identification of these CDGs is thought to potentially reveal new therapeutic targets.
Methods: Machine learning (ML) and Mendelian randomization (MR) methods were integrated to identify CDGs with causal effects in UC progression. The validation included immune-related analysis, drug response assessment (infliximab/vedolizumab/golimumab), patient stratification based on consensus clustering, and functional validation.
Results: Six key CDG genes (VNN1, PTGDS, MMP9, IL13RA2, S100A8, and IL1B) were identified by ML. VNN1 and MMP9 were confirmed by MR to be pathogenic risk factors for UC progression. All six genes were significantly associated with immune cell infiltration, pro-inflammatory cytokines, and intestinal barrier dysfunction. Compared with non-responders, the expression of these six CDGs was significantly downregulated in biologic therapy responders. Based on these genes, patients with UC were classified into two groups: the C1 group with severe disease activity and the C2 group with reduced Mayo scores and enhanced treatment sensitivity. Additionally, knocking down VNN1 functionally alleviated intestinal inflammation.
Conclusion: These six genes can be used to assess the severity of UC and predict treatment outcomes.
Keywords: machine learning, Mendelian randomization, cell death, VNN1, ulcerative colitis
Introduction
UC is a chronic inflammatory disease of the colon, prevalent among individuals aged 20 to 40.1 In recent decades, the incidence of UC has increased globally, particularly in developing nations.2,3 The etiology of UC is thought to be multifactorial, resulting from damage to the intestinal epithelial barrier leading to increased permeability, disruption of the homeostatic balance between the host’s mucosal immunity and gut microbiota, dysregulated immune responses, as well as genetic factors.4 If left untreated, UC progresses with the exacerbation of intestinal inflammation, resulting in a gradual expansion of the diseased area from a localized segment of the colon to the entire colon. Chronic, unresolved inflammation continually irritates the intestinal mucosa, precipitating inflammatory polyposis, particularly polyps accompanied by intraepithelial neoplasia, which are prone to malignant transformation into colitis-associated colorectal cancer (CAC).5,6 The treatment of UC includes 5-aminosalicylic acid (5-ASA), glucocorticoids, immunosuppressants, and drug delivery using cell membrane nanomaterials.7,8 5-ASA (mesalazine) is first-line for mild-moderate cases.9,10 Moderate-severe cases should receive thiopurines or anti-adhesion molecule inhibitors. Although pharmacological therapy forms the cornerstone of treatment for ulcerative colitis, approximately 20–30% of patients eventually require surgical intervention.11
Cell death contributes to morphogenesis in developmental processes and postnatal homeostasis by eliminating compromised or obsolete cells, ensuring the maintenance of tissue integrity and functionality.12 Thirteen distinct types of cellular demise have been identified thus far, including apoptosis, pyroptosis, ferroptosis, autophagy, necroptosis,13 cuproptosis,14 parthanatos,15 entotic cell death, netotic cell death, lysosome-dependent cell death,16 alkaliptosis,17 disulfidptosis,18 and oxeiptosis,19 each representing a unique mechanism of cell death. Numerous studies have clearly established a significant causal link between cellular death and UC.20–24 When intestinal epithelial cells (IECs) undergo excessive apoptosis, the epithelial homeostasis is disrupted, facilitating the transportation of harmful metabolites, which subsequently triggers inflammatory responses and contributes to the progression of UC.25 Furthermore, apoptosis can also impact the gut microbiota balance, allowing symbiotic or environmental microorganisms to invade tissues and generate persistent inflammation.26 Hence, it can be inferred that disrupted apoptosis plays an indispensable role in the initiation and progression of UC.
MR was employed in this study to determine that VNN1 and MMP9 are exposure factors for UC onset. MR is a causal inference technique based on genetic variation, which uses genetic variation as an instrumental variable. By satisfying three core assumptions (genetic variation is associated with exposure factors, no confounding factors interfere, and no other pathways influence the outcome), MR reduces bias in observational studies, thereby enabling more reliable causal inference. The VNN1 gene is involved in anti-inflammatory responses and oxidative stress regulation in the intestine and may reduce inflammatory damage by maintaining the integrity of the epithelial barrier. The MMP9 gene encodes matrix metalloproteinases, which can degrade the extracellular matrix, directly destroy the epithelial barrier structure, and recruit neutrophils, exacerbating tissue damage and inflammation spread. Moreover, this study also conducted an immune-related analysis. Immune infiltration analysis (CIBERSORT algorithm) quantifies immune cell types (neutrophils, macrophages) in intestinal tissue, which is critical for UC, as overactivated immune cells directly drive inflammatory damage, barrier disruption, and disease progression. Linking immune characteristics with gene expression can reveal the core pathological mechanisms of UC.
The current study endeavors to employ bioinformatics technology to discern pivotal CDGs that play significant roles in UC, with the intention of furnishing potential therapeutic targets and offering valuable insights into elucidating the mechanisms underlying UC pathogenesis.
Methods
GEO Data Integration and Dysregulated CDGs Identification
Sixteen cohorts containing UC have been downloaded from the GEO database. The cohorts originating from identical platform files (Table S1) have undergone batch effect removal and have been subsequently merged into a novel cohort for analysis. Meanwhile, a compilation of 13 cell death genes sourced from previously published literature has been tabulated in Table S2. Differential genes (DEGs) between the normal and UC groups in the training set were identified based on the filtering criteria of a log|FC| greater than 1.5 and a p-value less than 0.05. These genes subsequently intersected with the aforementioned CDGs. The GENEMINA27 and MetaScape28 databases were used to elucidate the biological pathways associated with the intersecting genes.
Machine Learning Algorithm Constructs UC Diagnostic Model
A comprehensive suite of 134 algorithms was assembled by combining 12 distinct machine learning methodologies, including Lasso, Ridge, Enet, Stepglm, support vector machine (SVM), glmBoost, linear discriminant analysis (LDA), plsRglm, random forest (RF), gradient boosting machine (GBM), extreme gradient boosting (XGBoost), and NaiveBayes.29 From the initial suite of 134 algorithms derived from 12 distinct methodologies, the optimal models were identified as the integrated Lasso+glmBoost, glmBoost, and SVM+glmBoost algorithms based on the highest mean AUC across cross-validation folds. Hyperparameter optimization was performed through 5-fold stratified cross-validation repeated 3 times, with the final parameters configured as follows: learning_rate = 0.01, max_depth = 6, n_estimators = 1000. Model performance was evaluated using 10-fold stratified cross-validation, with dataset partitioning controlled by a fixed random seed (seed = 42) to ensure reproducibility. Performance metrics - including AUC, accuracy, sensitivity, and specificity - were aggregated across all folds. These 113 algorithms were then leveraged to pinpoint the crucial genes among the aforementioned dysregulated CDGs associated with UC. Subsequently, a binary classification prediction model was constructed for diagnosing UC. The predictive accuracy of the models and their variables in identifying UC was evaluated and compared using the AUC values.
The Correlation Between Gene Expression and Therapeutic Drugs for UC
The GSE16879, GSE73661, GSE12251 and GSE92415 cohorts were retrieved from the GEO database. The levels of the above key genes were compared in UC patients before and after treatment with infliximab, vetolizumab and golimumab. The levels of expression of the key genes were also compared between responders and non-responders to the drugs. Besides, the association between the expression levels of the key genes and the Mayo Score was evaluated. Molecular docking analysis predicts the binding capacity and mode of proteins with small molecule ligands. The SDF structure of mesalazine was retrieved from the PubChem database, while protein structures of crucial CDGs were downloaded from the Protein Data Bank (PDB). Through ChembioOffice’s chembio3D module, the mm2 force field of mesalazine was optimized to generate its minimum energy structure, which was then converted to mol2 format. PyMOL (version 2.5.1) was employed to manipulate the mesalazine structure, eliminating solvents and organics. Proteins were subsequently hydrogenated and charged with AutoDockTools to transform them into the pdbqt format required for docking. AutoDock Vina facilitated the docking of proteins and ligands, and PyMOL visually represented the results, highlighting potential binding sites, modes, and interaction forces between mesalazine and the proteins.
Correlation Analysis of Model Genes with Immune Cell Profiles and Inflammatory Markers
Five computational methods for immune infiltration (ssGSEA,30 CIBERSORT,31 MCPcounter,32 xCell,33,34 and EPIC35) were employed to quantify the abundance of various immune cell subsets in UC. Spearman correlation analysis36 was subsequently used to elucidate the associations between the model genes and these immune cell contents. Furthermore, the correlations between the model genes and proinflammatory factors, as well as intestinal permeability proteins, were also investigated. The human single-cell datasets, GSE231993 and GSE214695, were sourced from the GEO database. These datasets underwent rigorous quality control and preprocessing with the “Seurat” package,37 involving the exclusion of low-quality cells and genes, as well as data normalization. Subsequently, principal component analysis (PCA)38 was employed to reduce dimensionality, followed by clustering of the data based on cell types. The “Single R” package39 was then leveraged for cell annotation, facilitating the identification of specific cell clusters. Ultimately, the data were precisely reclustered into distinct cell clusters according to human colon immune cell surface markers sourced from the CellMarker 2.0 database.40
Stratification of UC Patients into Distinct Clusters
Patients with UC were stratified into various clusters through consensus clustering analysis41 based on the expression levels of model genes. Subsequently, comparisons were made across these clusters to identify differences in the expression levels of model genes, proinflammatory genes, gut permeability genes, and immune cell content. GSEA was employed to elucidate the significantly enriched biological pathways within each cluster. Furthermore, the Mayo scores among different clusters and their responsiveness to biologics (infliximab, vedolizumab, and golimumab) were also compared.
MR Analysis
Instrumental variable selection adhered to stringent criteria: (1) genome-wide significance (P<5×10⁻⁸) for exposure-associated SNPs; (2) LD clumping (r2<0.001 within 10,000 kb windows, 1000 Genomes EUR reference); 3) instrument strength requirement (minimum F-statistic > 10, calculated as F=R2×(N−1−K)/(1−R2)×K where R2=proportion of exposure variance explained, N = sample size, K = number of instruments); (4) exclusion of palindromic SNPs (MAF > 0.42). MR assumption verification was systematically conducted: (1) Relevance: Quantified via F-statistics and R2 values; (2) Independence: Confirmed by screening all SNPs in PhenoScanner v2 for associations with confounders; (3) Exclusion restriction: Assessed through MR-Egger intercept test (P>0.05 indicating no horizontal pleiotropy), supplemented by leave-one-out sensitivity analysis.
The MR42 was conducted to ascertain whether the directionality of differential model gene effects aligns with the outcomes derived from the MR approach. The exposure data and gene expression quantitative trait loci (eQTL) data were sourced from GWAS summary data. Meanwhile, the outcome data on UC were obtained from the FinnGen database.43 To sieve consistent results in terms of odds ratio (OR) directionality, five statistical methodologies within the “TwoSampleMR” package44 were employed: MR-Egger, weighted median, inverse variance weighted (IVW), simple mode, and weighted mode. The primary filtering criterion was set as a p-value less than 0.05 for the IVW method. To enhance the robustness and accuracy of the MR analysis, biased single nucleotide polymorphisms (SNPs) were detected and excluded through the MR-PRESSO outlier detection method. Heterogeneity was assessed using both the IVW and MR-Egger tests, with a p-value greater than 0.05 indicating the absence of heterogeneity in the data. Furthermore, the pleiotropic nature of the data was examined via the MR-Egger intercept test, and a p-value above 0.05 suggested no evidence of pleiotropy.
Comparative Analysis of Normal and UC Specimens
The ethical aspect of the study was aptly addressed, with the research protocol receiving due approval from the Biomedical Ethics Committee of Anhui Medical University (Approval number: 20200963). Additionally, this study strictly adhered to the Regulations for the Administration of Laboratory Animals (National Science and Technology Commission of China), the Implementing Rules for the Administration of Medical Laboratory Animals (Ministry of Health of China), and the Institutional Animal Care and Use Guidelines of Anhui Medical University. Ethical approval was granted by the Anhui Medical University Animal Ethics Committee (Approval No. LLSC20250676). The mice used in the study were C57BL/6 mice (GemPharmatech LLC, China), which were fed with 3% dextran sodium sulfate (DSS, YEASEN, China) for 7 days followed by 3 days of distilled water. Both the normal and UC mouse specimens underwent fixation, dehydration, embedding, and sectioning. The tissue sections were then stained with hematoxylin and eosin (Biosharp, China). The immunohistochemical (IHC) analysis entailed tissue antigen retrieval, blocking of endogenous peroxidase (Beyotime, China), goat serum blocking (Beyotime, China), incubation with specific primary and secondary antibodies, a DAB chromogen reaction (Beyotime, China), mounting with neutral resin, and subsequent observation under an upright microscope. Additionally, RNA extraction was performed using Trizol (TAKARA, China), followed by cDNA synthesis. qPCR experiments were conducted, employing GAPDH (Sangon Biotech, China) as an internal reference gene, to evaluate the expression of target genes (Table S3). The VNN1 knockdown sequences were provided by Quanyang Biotechnology in Shanghai, China. The ShVNN1#NC sequence is CCGG-GATTCTCCGAACGTGTCACGT-CTCGAG-ACGTGACACGTTCGGAGAATC-TTTTT, the ShVNN1#1 sequence is CCGG-GGACTCTCTCTACCCATATTT-CTCGAG-AAATATGGGTAGAGAGAGTCC-TTTTT, and the ShVNN1#2 sequence is CCGG-CAGATCAGGGTGCGCATATTA-CTCGAG-TAATATGCGCACCCTGATCTG-TTTTT. The TNFα stimulating factor was obtained from Nearshore Biotech in China.
Statistical Analysis
R 4.3.2 and Strawberry Perl were employed for executing codes and scripts in this study. Statistical analysis was conducted with GraphPad Prism (version 9.0). For datasets meeting the assumptions of normal distribution and homogeneity of variance, comparisons were performed using the T-test; otherwise, non-parametric tests were applied. Statistical significance was defined as P < 0.05, denoted by *** for P < 0.01, and *** or **** for P < 0.001. In high-dimensional correlation analyses (gene-expression vs clinical phenotypes), false discovery rate (FDR) correction was rigorously applied using the Benjamini-Hochberg procedure. All reported correlations met the threshold of q < 0.05 (FDR-adjusted P-value), ensuring ≤5% false positives among significant findings.
The design flowchart of this study is presented in Figure 1.
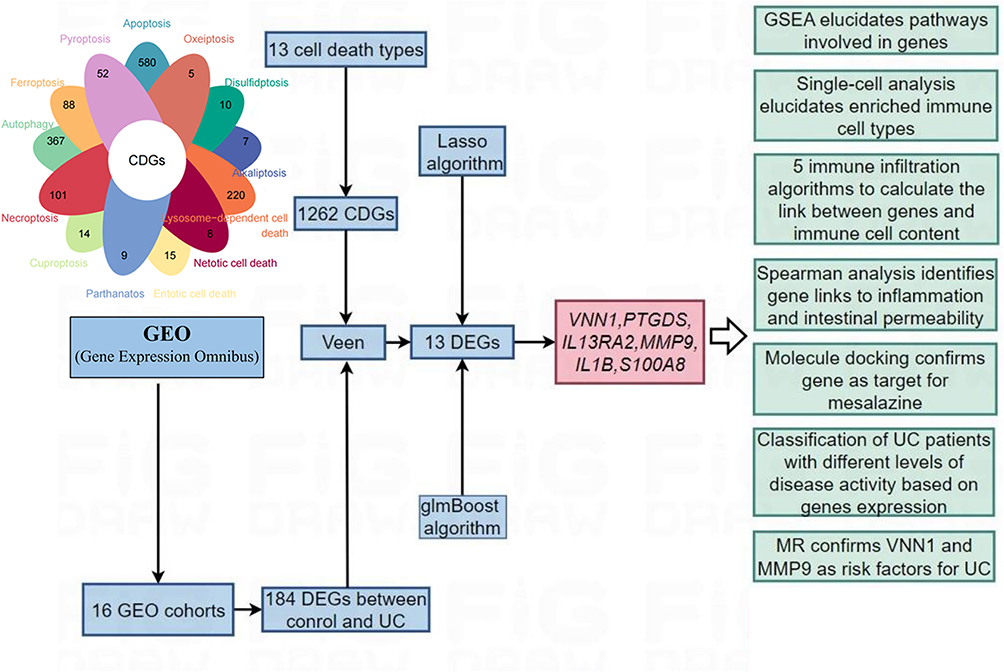 |
Figure 1 Design flowchart of the research. |
Results
Integration of Multi-Platform GEO Cohorts and Differential Gene Analysis
Three GEO datasets derived from platform GPL13158 were integrated to establish Merge1-Cohort following batch effect correction (Figure S1a). Parallel processing was applied to four GPL570 datasets (Merge2-Cohort; Figure S1c), four GPL6244 datasets (Merge3-Cohort; Figure S1e), and three GPL16791 datasets (Merge4-Cohort; Figure S1g). Principal component analysis confirmed effective sample integration across all merged cohorts (Figure S1b, d, f, h).
The demographic composition of normal and UC samples across six cohorts is summarised in Figure 2a. Merge1-Cohort, containing the largest UC sample size (n=743), was designated as the primary training cohort, with remaining cohorts serving as validation sets. Distinct clustering patterns between normal and UC samples in the training set (Figure 2b) supported robust inter-group heterogeneity. Application of stringent filtering criteria (log|FC| > 1.5, P < 0.05; Figure 2c) identified 184 differentially expressed genes (DEGs), comprising 59 downregulated and 125 upregulated genes (Figure 2d). Intersection analysis revealed 13 consensus genes shared between these DEGs and 1262 predefined cell death-associated genes (Figure 2e and f), all demonstrating significant upregulation in UC (Figure 2g). Protein-protein interaction network analysis via GENEMINA identified 20 functionally linked proteins enriched in apoptosis, inflammatory signalling (IL1 pathway), and arachidonic acid metabolism (Figure 2h). Complementary pathway analysis through Metascape further confirmed predominant involvement of these genes in pro-inflammatory cascades, particularly IL17 signalling and NF-κB activation (Figure 2i).
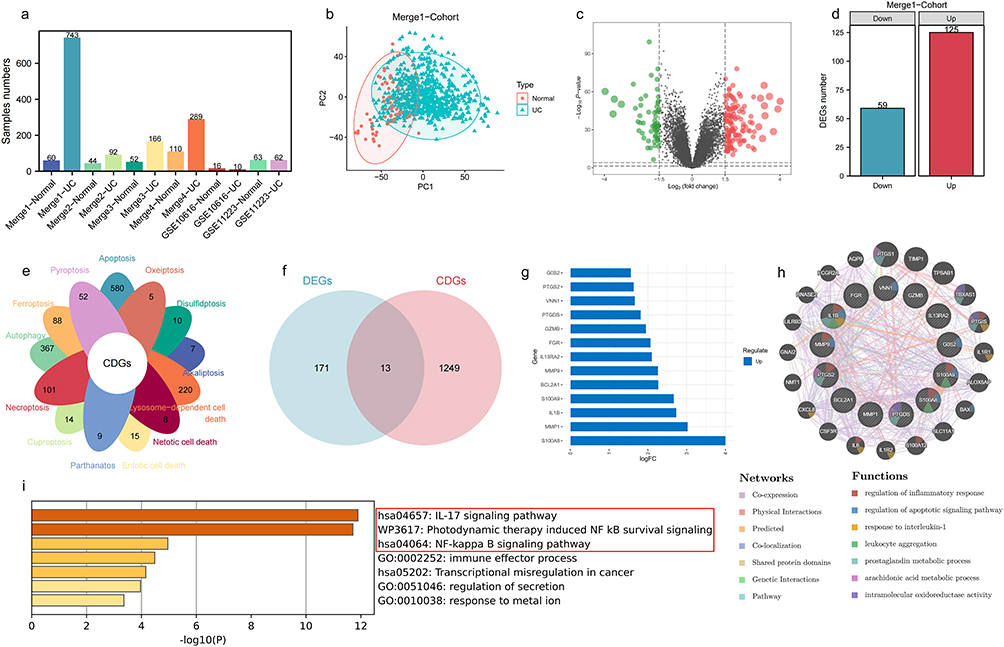 |
Figure 2 Identifying key cell death genes in UC. (a) Statistical information on sample numbers across 6 UC cohorts. (b) Clear separation of normal and UC samples in Merge1-Cohort. (c and d) Selection of 59 down-regulated and 125 up-regulated genes in UC based on log|FC| > 1.5 and P value < 0.05. (e) Statistical information on the number of genes involved in 13 types of cell death. (f) 13 genes common to both differentially expressed genes and cell death genes between normal and UC samples. (g) Significant up-regulation of these 13 genes in UC. (h) Protein-protein interaction (PPI) network of these 13 genes. (i) Biological pathways significantly associated with these 13 genes. Among the top-ranked inflammation-related signaling pathways are the IL-17 signaling pathway and the NF-κB signaling pathway. |
Machine Learning Algorithms for Constructing a UC Diagnostic Model
Machine learning algorithms were employed to further screen the 13 genes mentioned above and construct a UC diagnostic model across 6 cohorts. The highest C-index of 0.928 was achieved by the models built using Lasso+glmBoost, glmBoost, and SVM+glmBoost algorithms (Figure 3a). In addition, there is no superiority or inferiority among these three algorithms in terms of variable selection, as all of them identified 6 genes (Figure 3b). Additionally, these algorithms predicted UC accuracy with AUC values of 0.964, 0.939, 1.000, 0.890, 0.938, and 0.840 across the 6 cohorts. Furthermore, all three algorithms identified 6 key genes—S100A8, MMP9, IL1B, PTGDS, VNN1, and IL13RA2—ranked by their importance. In 5 cohorts, the predictive model’s AUC values for UC accuracy exceeded those obtained from individually diagnosing UC using these 6 model genes (Figure 3b–f). An exception was noted in GSE10616, where its AUC value was only lower than that of IL1B (Figure 3g), possibly due to the smaller sample size of 26 cases in this cohort.
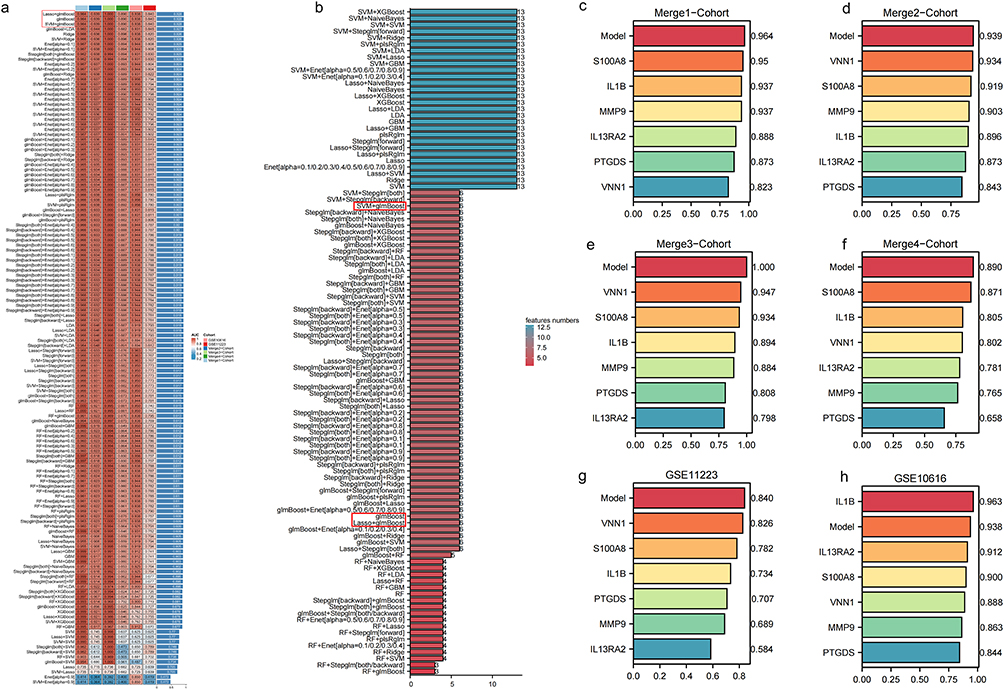 |
Figure 3 Identification and validation of machine learning models and key genes for ulcerative colitis prediction. (a) An AUC heatmap of 134 machine learning ensemble algorithms constructing binary classification prediction models for ulcerative colitis across six cohorts. Among the algorithms, those with the highest C-index values are Lasso+glmBoost, glmBoost, and SVM+glmBoost. (b) The genes identified by each algorithm were sorted based on their quantity. The number of genes identified by Lasso+glmBoost, glmBoost, and SVM+glmBoost was all 6. (c–h) AUC values depicting the diagnostic accuracy of six genes individually selected by the algorithm model across six cohorts. |
Six Model Genes Can Be Used as Tools for UC Severity and Efficacy
The six model genes were significantly up-regulated in the UC group across six cohorts (Figure 4a–f). The infliximab, vetolizumab and golimumab are commonly used drugs for the treatment of UC. It was observed that the expression of the 6 model genes was significantly reduced when these drugs were used to treat UC patients (Figure 4g–j). Additionally, responders in UC patients treated with infliximab, vetolizumab and golimumab exhibited lower expression of the 6 model genes (Figure 4k–o). It means that the 6 model genes may be the targets where infliximab, vetolizumab and golimumab play a role in the treatment of UC. The Mayo score is a tool for assessing the severity of UC and the efficacy of treatment, and the expression levels of the 6 model genes were positively correlated with the Mayo score (Figure 4p and q). It further suggests that the 6 model genes that play a key role in the progression of UC.
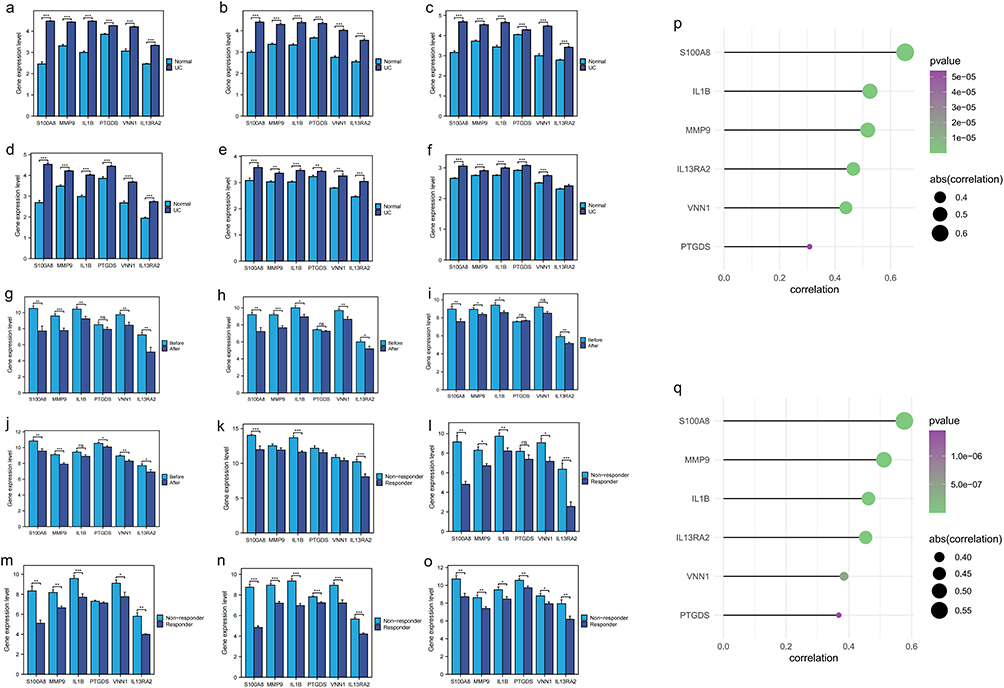 |
Figure 4 The expression of model genes is associated with the development and prognosis of UC. (a–f) The model genes were significantly upregulated in all six UC cohorts, including Merge1-cohort, Merge2-cohort, Merge3-cohort, Merge4-cohort, GSE10616, and GSE11223, respectively. * indicates P < 0.05, ** indicates P < 0.01, *** indicates P < 0.001, and ns indicates no significance. (g–j) In UC patient cohorts (GSE92415, GSE12251, GSE16879, GSE73661), the expression of six model genes was significantly reduced following treatment with infliximab, vedolizumab, and golimumab. * indicates P < 0.05, ** indicates P < 0.01, *** indicates P < 0.001, and ns indicates no significance. (k–o) In UC patients treated with infliximab (GSE12251, GSE16879, GSE73661), vedolizumab (GSE73661), and golimumab (GSE92415), the group showing better therapeutic responses exhibited significantly lower expression levels of six model genes. * indicates P < 0.05, ** indicates P < 0.01, *** indicates P < 0.001, and ns indicates no significance. (p and q) In the GSE73661 and GSE92415 cohorts, the expression levels of the six-model-gene signature showed a significant positive correlation with the Mayo score. |
Molecular Docking Predicted Potential Binding Targets of Mesalazine in UC
Through molecular docking simulations, we analyzed the binding sites between mesalazine (Figure 5a and b) and six candidate core targets. Computational results suggested that mesalazine could bind to all six targets, potentially influencing their protein conformations and functions. This preliminary evidence indicates possible modulation of downstream pathways related to UC inflammation. Molecular docking revealed potential hydrogen bond formation between mesalazine and specific amino acid residues (Figure 5c–h), supporting the hypothetical binding capability between mesalazine and these proteins. Comparative analysis of binding affinities (Table S4) indicated that IL1B, PTGDS, and VNN1 exhibited the strongest predicted binding interactions with mesalazine. These computational findings propose IL1B, PTGDS, and VNN1 as potential primary targets warranting further experimental validation.
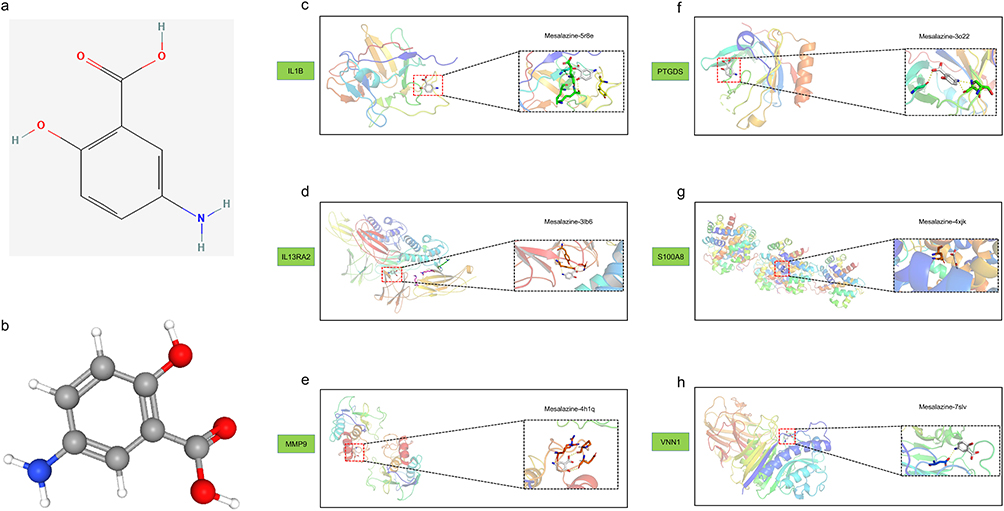 |
Figure 5 Molecular docking was performed between mesalazine and its core targets for anti-ulcerative colitis activity. (a) The two-dimensional structure of mesalazine. (b) The three-dimensional conformation of mesalazine. (c–h) The molecular docking interactions between mesalazine and six genes were analyzed and presented. |
Enrichment of Model Genes in Immune Cell Landscape
Five immune infiltration algorithms were employed to calculate the content of immune cells in training set. Significant differences in immune cell content between the normal and UC groups were observed (Figure 6a). Fibroblasts, neutrophils, M1 macrophages, DCs, mast cells, and Th1 cells were markedly increased in UC, thereby promoting inflammation progression, while M2 macrophages were notably reduced in UC (Figure S2). Additionally, the expression levels of these six genes correlated positively with fibroblasts, DCs, M1 macrophages, mast cells, neutrophils, and Th1 cell content, and negatively with M2 macrophages and Tregs cell content (Figure 6b and c). The data from GSE231993 and GSE214695 cohorts were automatically annotated into different cell types using “Singler”. Considering the low accuracy of automatic annotation, these two cohorts were manually re-annotated into distinct immune cell types based on files from the CellMarker 2.0 database. PTGDS was significantly enriched in fibroblasts, while S100A8 and IL1B were notably enriched in dendritic cells (DCs) and neutrophils, and MMP9 showed significant enrichment in DCs (Figure 6d and e).
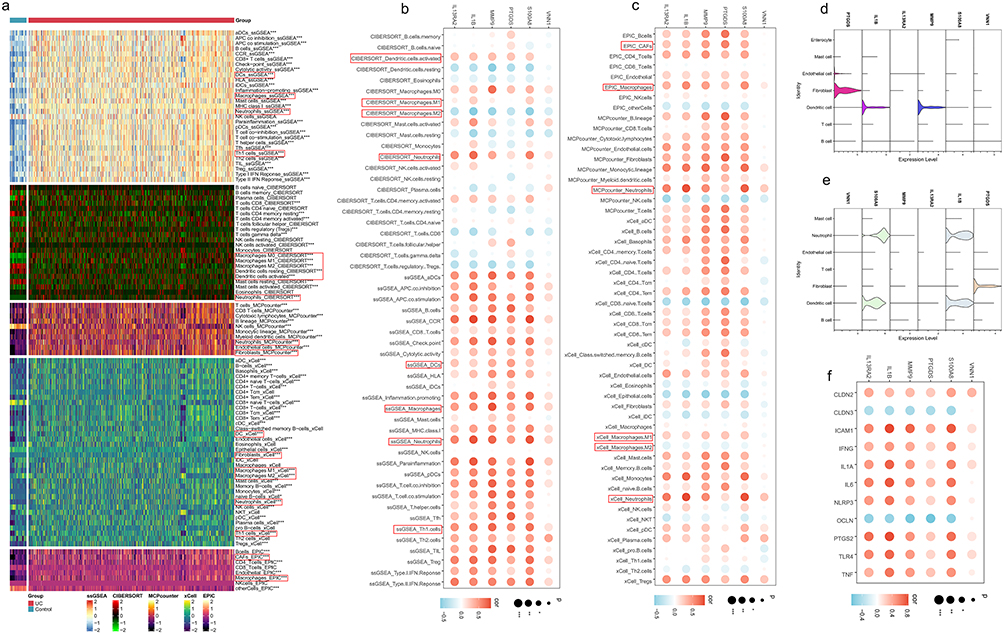 |
Figure 6 Correlation of model gene expression with immune cell infiltration, pro-inflammatory, and intestinal permeability genes. (a) The levels of various immune cells, as calculated by five immune infiltration algorithms, differ significantly between the normal and UC groups. Among them, dendritic cells, macrophages, neutrophils, fibroblasts, and Th1 cells showed significant differences. * indicates P < 0.05, ** indicates P < 0.01, *** indicates P < 0.001, and ns indicates no significance. (b and c) The expression levels of the six model genes are significantly correlated with the levels of inflammation-related immune cells calculated by the five immune infiltration algorithms. The expression levels of these six genes showed a significant negative correlation with anti-inflammatory M2 macrophages, whereas they showed a significant positive correlation with pro-inflammatory neutrophils, M1 macrophages, dendritic cells, fibroblasts, and Th1 cells. * indicates P < 0.05, ** indicates P < 0.01, *** indicates P < 0.001, and ns indicates no significance. (d and e) In the GSE231993 and GSE214695 cohorts, the six model genes were significantly enriched in neutrophils, dendritic cells, and fibroblasts. (f) The expression levels of these six genes are significantly correlated with the expression levels of inflammation-related genes and intestinal permeability genes. * indicates P < 0.05, ** indicates P < 0.01, *** indicates P < 0.001, and ns indicates no significance. |
Furthermore, these six model genes’ expression levels positively correlated with the expression of pro-inflammatory genes (ICAM1, IFNG, IL1A, IL6, NLRP3, PTGS2, TLR4, TNF) (Figure 6f). Moreover, their expression levels were associated with intestinal permeability, showing a positive correlation with CLDN2 expression and a negative correlation with CLDN3 and OCLN expression levels.
UC Patients Were Categorized into C1 Group with Severe Disease Activity and C2 Group with Mild Disease Activity
According to the expression levels of these six model genes, UC patients in training set were stratified into two clusters using consensus clustering analysis (Figure 7a). The UC patients in these two clusters were distinctly separated, demonstrating the accuracy of the classification (Figure 7b). Cluster 1 showed significant up-regulation of these six model genes (Figure 7c). Furthermore, expression levels of nine pro-inflammatory genes were markedly higher in Cluster 1 (Figure 7d). Intestinal permeability genes MUC2, OLCN, CLDN3, and CDH1 were significantly down-regulated in Cluster 1, while CLDN2 and CDH2 showed the opposite trend (Figure 7e). The Mayo scores in the C1 group were significantly higher than those in the C2 group (Figure 7f and g). Furthermore, patients in the C1 group exhibited a lesser therapeutic response to infliximab, vedolizumab, and golimumab treatment compared to those in the C2 group (Figure 7h–l). In Cluster 1, there was significant enrichment of inflammation-related pathways such as the MAPK signaling pathway, MTOR signaling pathway, and Toll-like receptor signaling pathway (Figure 7m). Additionally, there were notable differences in the content of various immune cells between the two clusters (Figure 7n). Cluster 1 exhibited higher levels of fibroblasts, neutrophils, Th1 cells, M1 macrophages, activated DCs, and activated mast cells, whereas Cluster 2 showed higher levels of M2 macrophages (Figure S3).
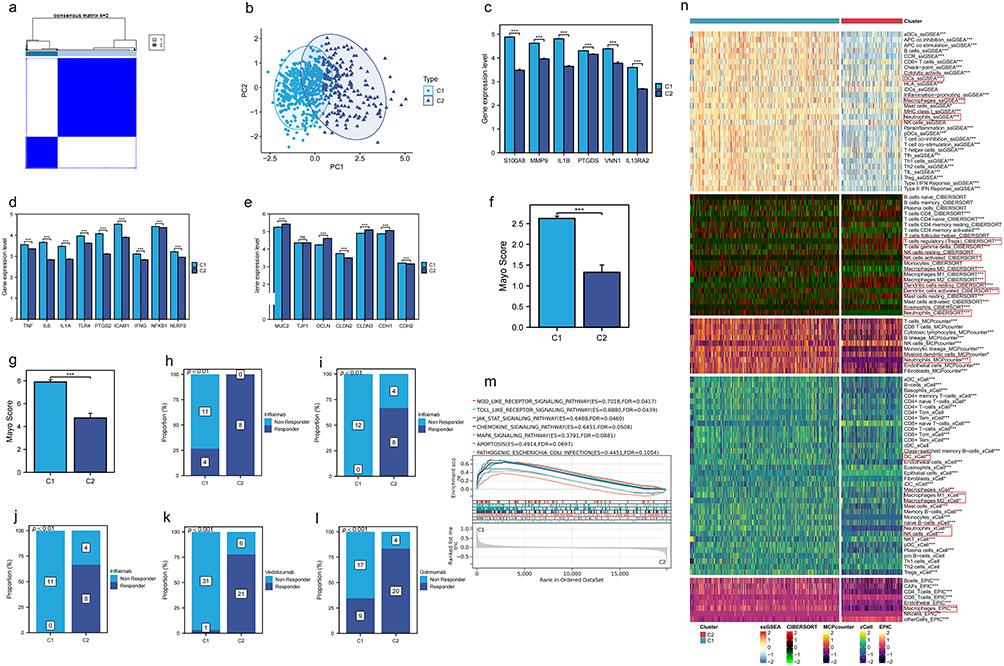 |
Figure 7 Consensus clustering analysis of UC samples based on model gene expression. (a) The UC samples in the Merge1-Cohort were classified into two groups using consensus clustering analysis based on the expression levels of the 6 model genes. (b) UC patients were clearly separated between the two clusters. (c) The 6 model genes were significantly up-regulated in cluster 1. * indicates P < 0.05, ** indicates P < 0.01, *** indicates P < 0.001, and ns indicates no significance. (d) Pro-inflammatory genes exhibited higher expression levels in cluster 1. * indicates P < 0.05, ** indicates P < 0.01, *** indicates P < 0.001, and ns indicates no significance. (e) Intestinal permeability gene expression levels differed significantly between the two clusters. * indicates P < 0.05, ** indicates P < 0.01, *** indicates P < 0.001, and ns indicates no significance. (f and g) In the GSE73661 and GSE92415 cohorts, the Mayo scores in Group C1 were significantly higher. * indicates P < 0.05, ** indicates P < 0.01, *** indicates P < 0.001, and ns indicates no significance. (h–l) In UC patients treated with infliximab (GSE12251, GSE16879, GSE73661), vedolizumab (GSE73661), and golimumab (GSE92415), patients in Group C2 exhibited better treatment outcomes. (m) Biological pathways significantly up-regulated in cluster 1. (n) Multiple immune cell contents calculated by 5 immune infiltration algorithms were significantly different between the two clusters. Cluster 1 is characterized by higher levels of fibroblasts, neutrophils, Th1 cells, M1 macrophages, activated dendritic cells (DCs), and activated mast cells, while Cluster 2 shows higher levels of M2 macrophages. * indicates P < 0.05, ** indicates P < 0.01, *** indicates P < 0.001, and ns indicates no significance. |
MR Reveals MMP9 and VNN1 as Risk Factors for UC
Further confirmation of the causal relationship between MMP9 and VNN1 genes within the model and UC was achieved through MR. As the influence of SNPs on the expression levels of MMP9 and VNN1 intensified, the promotional effect of these gene-associated SNPs on UC, as calculated using five statistical methods, correspondingly augmented (Figure 8a and b). The composite effect sizes for SNPs related to both genes were consistently greater than zero, indicating their status as risk factors for UC (Figure 8c and d). Moreover, the removal of any single SNP associated with either gene and subsequent analysis with the remaining SNPs by MR yielded comparable composite effect sizes, demonstrating minimal undue influence from the exclusion of any individual SNP (Figure 8e and f). The approximate symmetry of points around the IVW line suggests the absence of notable heterogeneity in the study data (Figure 8g and h). In summary, with P-values from the IVW method less than 0.05 and ORs exceeding 1.0, an increased risk of UC was observed in conjunction with heightened expression levels of MMP9 and VNN1 (Figure 8i).
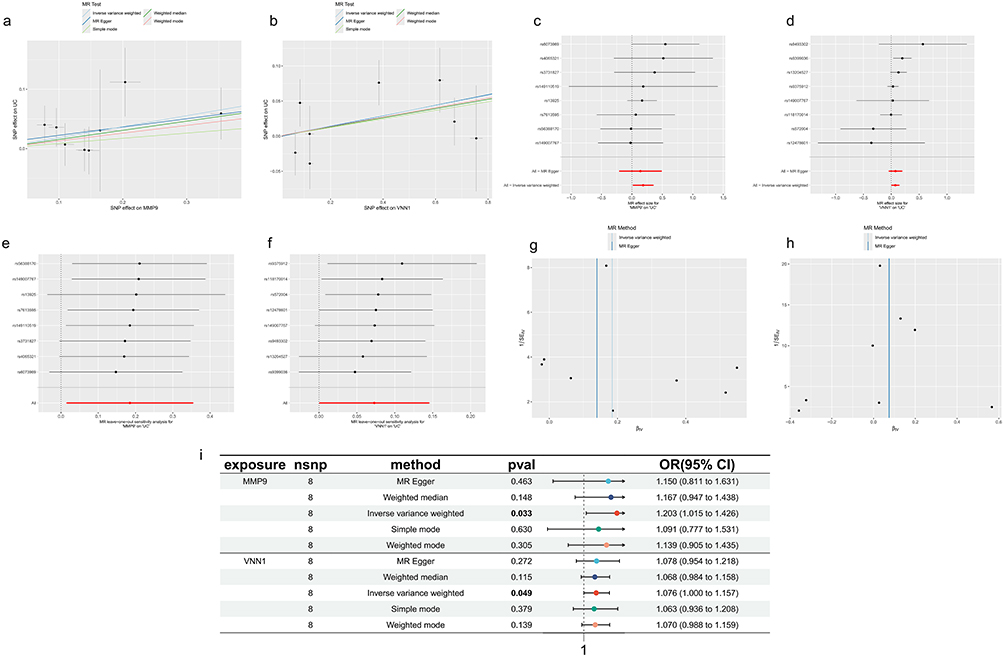 |
Figure 8 Causal relationship between MMP9, VNN1 expression, and UC incidence. (a and b) MMP9 and VNN1 expression levels increase with the incidence of UC. The x-axis represents the effect of SNPs on MMP9 and VNN1 expression levels, and the y-axis represents the effect of SNPs on UC. Black dots represent SNPs, while “+” symbols indicate the range of SNP effect values. (c and d) Forest plots with the y-axis representing SNPs and the x-axis representing effect values. The combined effect value of SNPs is greater than 0. (e and f) Leave-one-out sensitivity analysis, with the dashed vertical line representing an effect value of 0. Effect values remain greater than 0 after removing each SNP. (g and h) Funnel plots showing SNPs symmetrically distributed on either side of the blue vertical line. (i) The IVW method demonstrates a causal relationship between MMP9 and VNN1 expression levels and the incidence of UC, identifying MMP9 and VNN1 as risk factors for UC. Exposure refers to the exposure factor, nSNP indicates the number of SNPs used as instrumental variables, method refers to the Mendelian randomization analysis method, p-value represents the statistical significance (p-val), OR stands for odds ratio, and 95% CI represents the 95% confidence interval. |
Downregulation of VNN1 Ameliorates Intestinal Inflammation
At the mRNA level, the expression levels of these six genes were significantly increased in the colonic tissues of UC mice (Figure 9a–f) (Table S5). Subsequently, VNN1, which have been relatively understudied to date, were selected for further in-depth experimentation. At the protein level, IHC analysis confirmed that the expression of VNN1 proteins was markedly elevated in the colonic tissues of UC mice (Figure 9g). Through lentiviral stable transfection technology, VNN1 was knocked down in NCM460 cells (Figure 9h) (Table S6). After knocking down VNN1, the cells were stimulated with TNFα (100 ng/mL) for 6 hours. Compared to the normal group, the transcription levels of intestinal inflammatory genes (IL1B, CCL2, COX2) were suppressed in the shVNN1 group (Figure 9i–k) (Table S7).
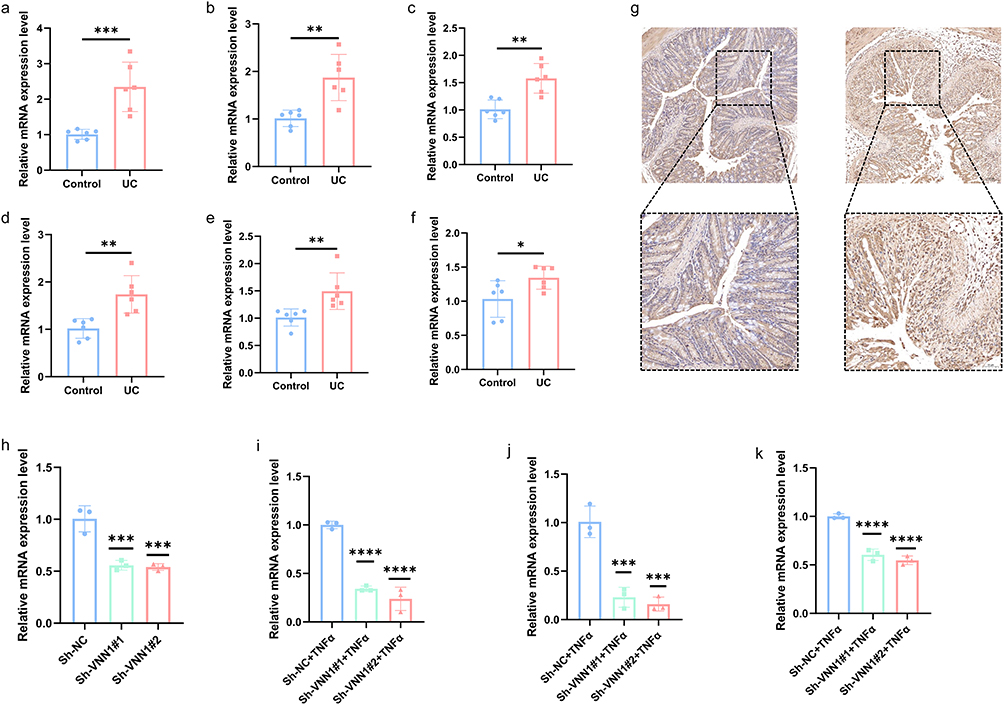 |
Figure 9 The validation of the expression levels of six crucial CDGs was conducted. (a–f) The mRNA expression of these six key CDGs (Il1b, Il32ra2, Mmp9, Ptgds, S100a8, Vnn1) was upregulated in the colonic tissues of UC mice. * indicates P < 0.05, ** indicates P < 0.01, *** indicates P < 0.001, and ns indicates no significance. (g) Immunohistochemical results showed increased VNN1 protein levels in UC mice. (h) VNN1 knockdown was successfully achieved at the mRNA level. * indicates P < 0.05, ** indicates P < 0.01, *** indicates P < 0.001, and ns indicates no significance. (i–k) After knocking down VNN1, the expression levels of the proinflammatory genes IL1B, CCL2, and COX2 were significantly reduced. * indicates P < 0.05, ** indicates P < 0.01, ***or **** indicates P < 0.001, and ns indicates no significance. |
Discussion
The intestinal epithelial cells, as a crucial part of the intestinal barrier, uphold intestinal integrity through tight and adherens junctions.45,46 Abnormal apoptosis disrupts these connections, impairing barrier function and enhancing intestinal permeability. This allows pathogenic microorganisms, toxins, and other harmful substances to penetrate the mucosa more easily, entering tissues and bloodstream, triggering inflammation. The invasion activates gut immune cells like macrophages and dendritic cells, releasing cytokines like IL and TNF, amplifying the inflammatory response.47,48 Chronic inflammation disrupts the balance between damage and repair, fostering the development of ulcerative colitis. Additionally, barrier disruption and inflammation alter the intestinal microenvironment, disrupting gut microbiota balance.49 This dysbiosis, characterized by reduced beneficial and increased harmful bacteria, further exacerbates intestinal inflammation and damage.50 Thus, the identification of genes that induce abnormal apoptosis in intestinal epithelial cells is paramount for the prevention and treatment of UC.
In this research, six pivotal CDGs that contribute to the onset of UC, namely VNN1, MMP9, PTGDS, IL13RA2, S100A8, and IL1B, were identified through the machine learning algorithms. MR analysis confirmed VNN1 and MMP9 as risk factors for UC, with an elevated risk of UC incidence observed in conjunction with increased expression levels of both VNN1 and MMP9. All six of these genes were significantly upregulated in UC tissues. The expression of these six genes was significantly reduced in UC patients receiving infliximab, vituzumab, and golimumab in the treatment. The expression levels of these six genes were significantly and positively correlated with the Mayo score. These six genes can be used as tools to determine the severity and efficacy of UC. Advanced drug delivery systems have the potential to target CDG with mesalazine, a first-line treatment for UC, while ROS-responsive nanocarriers may become a strategy for future precision treatment of UC.51 Furthermore, molecular docking experiments indicated that these six genes may serve as potential therapeutic targets for mesalazine, a first-line treatment for UC. Additionally, UC patients can be precisely stratified into two distinct clusters characterized by varying levels of disease activity based on the expression profiles of these six genes, facilitating the implementation of targeted therapeutic interventions.
UC is an autoimmune inflammatory bowel disease characterized by the immune system erroneously recognizing normal gut microbiota or intestinal tissues as foreign invaders, thereby eliciting a sustained immune response.52 The upregulation of VNN1, MMP9, PTGDS, IL13RA2, S100A8, and IL1B activates various immune cells implicated in this immune reaction, encompassing proinflammatory innate immune cells (neutrophils, DCs, macrophages), proinflammatory adaptive immune cells (Th1 cells), and anti-inflammatory adaptive immune cells (Tregs).53,54 Additionally, these six upregulated genes significantly enhance the release of proinflammatory factors (IFNG, IL1α, IL6, TNFα) by macrophages,55 further intensifying the inflammatory response. Furthermore, they trigger inflammatory reactions by inducing the upregulation of TLR4,56 a member of the Toll-like receptor family associated with inflammation and immune responses, PTGS2,57 a pivotal enzyme in prostaglandin biosynthesis, NLRP3 inflammasome,58 and ICAM-1,59 a member of the immunoglobulin superfamily of adhesion molecules.
The Occludin protein, encoded by OCLN, is a crucial constituent of tight junctions, pivotal in maintaining the barrier function of intestinal epithelial cells. It synergizes with other tight junction proteins, including Claudins and ZO-1 (TJP1),60,61 to establish the physical barrier of the intestine. The upregulation of these six genes results in the reduced expression of Claudin-3 protein,62 encoded by CLDN3, and Occludin protein, whilst enhancing the expression of Claudin-2 protein,63 encoded by CLDN2. This alteration disrupts the integrity of the intestinal barrier, subsequently leading to an increase in intestinal permeability.
While this multi-omics study identified core CDGs in UC pathogenesis, we fully acknowledge inherent limitations of retrospective bioinformatic analyses. Technical confounders (cross-platform batch effects) were mitigated through ComBat harmonization and covariate adjustment for principal components, whereas biological confounders (gut microbiome or medication interference) demonstrated robustness in Mendelian Randomization sensitivity analyses. To precisely resolve cellular origins of CDGs, we conducted deep mining of single-cell transcriptomes by re-analyzing public UC atlases (GSE213993/GSE214695). Preliminary mapping revealed significant enrichment of these genes in neutrophils and dendritic cell subsets. Furthermore, CIBERSORTx deconvolution confirmed strong positive correlations between CDG expression and immune cell abundances. This integrated framework will provide cellular-resolution evidence for CDG pathogenic mechanisms.
In summary, VNN1, MMP9, PTGDS, IL13RA2, S100A8, and IL1B are key CDGs in UC. Among them, the upregulated VNN1 in UC promotes inflammatory progression.
Conclusion
VNN1, MMP9, PTGDS, IL13RA2, S100A8, and IL1B constitute a core set of CDGs implicated in UC pathogenesis, where their upregulation correlates with inflammatory responses and intestinal barrier dysfunction. These genes were significantly downregulated in UC patients responsive to biologic therapies (infliximab, vedolizumab, golimumab), supporting their candidacy as predictive biomarkers for treatment efficacy stratification. Computational evidence suggests potential targeting by mesalazine, though functional validation through in vitro binding assays and transcriptomic profiling remains essential. Notably, VNN1 demonstrated pronounced anti-inflammatory effects upon downregulation in preclinical models, while MMP9, PTGDS, and IL1B exhibited equally critical roles in primary analyses. Clinical stratification based on the six-gene signature revealed two distinct UC subtypes: the C1 subgroup (high gene expression) exhibited severe disease activity and diminished biologic responsiveness, while the C2 subgroup (low gene expression) correlated with mild symptoms and favorable treatment outcomes. This framework demonstrates actionable potential for guiding biologic therapy selection but requires prospective validation in multi-center cohorts prior to clinical implementation.
Data Sharing Statement
The datasets analysed during the current study are available in the GEO repository [https://www.ncbi.nlm.nih.gov/geo/].
Ethical Approval
The ethical aspect of the study was aptly addressed, with the research protocol receiving due approval from the Biomedical Ethics Committee of Anhui Medical University (Approval number: 20200963).
Although this study involves research using human data, it qualifies for exemption from formal approval according to Chinese national legislation. Specifically, Article 32 (Items 1 and 2) of the Measures for Ethical Review of Life Science and Medical Research Involving Human Subjects (issued by the National Health Commission of China on February 18, 2023) stipulates that ethical review may be exempted for research involving human information/data or biological samples under the following conditions, provided that the research: (1) does not cause harm to individuals; (2) does not involve sensitive personal information or commercial interests, and aims to reduce unnecessary burdens on researchers and facilitate human-related research.
Acknowledgments
Acknowledgments to the Biomedical Ethics Committee of Anhui Medical University, GEO database (https://www.ncbi.nlm.nih.gov/geo/), Metascape database (https://metascape.org/gp/index.html#/main/step1), GENEMINA database (http://genemania.org/), CellMarker2.0 database (http://bio-bigdata.hrbmu.edu.cn/CellMarker/index.html), PubChem database (https://pubchem.ncbi.nlm.nih.gov/), Protein Data Bank (PDB) (https://www.rcsb.org/), GWAS summary data (https://gwas.mrcieu.ac.uk/), and the FinnGen database (https://www.finngen.fi/en/access_results).
Disclosure
The authors declare no competing interests in this work.
References
1. Voelker R. What is ulcerative colitis? JAMA. 2024;331(8):716. doi:10.1001/jama.2023.23814
2. da Silva BC, Lyra AC, Rocha R, Santana GO. Epidemiology, demographic characteristics and prognostic predictors of ulcerative colitis. World J Gastroenterol. 2014;20(28):9458–9467. doi:10.3748/wjg.v20.i28.9458
3. Le Berre C, Honap S, Peyrin-Biroulet L. Ulcerative colitis. Lancet. 2023;402(10401):571–584. doi:10.1016/S0140-6736(23)00966-2
4. Ordás I, Eckmann L, Talamini M, Baumgart DC, Sandborn WJ. Ulcerative colitis. Lancet. 2012;380(9853):1606–1619. doi:10.1016/S0140-6736(12)60150-0
5. Yashiro M. Ulcerative colitis-associated colorectal cancer. World J Gastroenterol. 2014;20(44):16389–16397. doi:10.3748/wjg.v20.i44.16389
6. Shah SC, Itzkowitz SH. Colorectal cancer in inflammatory bowel disease: mechanisms and management. Gastroenterology. 2022;162(3):715–730.e713. doi:10.1053/j.gastro.2021.10.035
7. Ungaro R, Mehandru S, Allen PB, Peyrin-Biroulet L, Colombel JF. Ulcerative colitis. Lancet. 2017;389(10080):1756–1770. doi:10.1016/S0140-6736(16)32126-2
8. Lei P, Yu H, Ma J, et al. Cell membrane nanomaterials composed of phospholipids and glycoproteins for drug delivery in inflammatory bowel disease: a review. Int J Biol Macromol. 2023;249:126000. doi:10.1016/j.ijbiomac.2023.126000
9. Ko CW, Singh S, Feuerstein JD, Falck-Ytter C, Falck-Ytter Y, Cross RK. AGA clinical practice guidelines on the management of mild-to-moderate ulcerative colitis. Gastroenterology. 2019;156(3):748–764. doi:10.1053/j.gastro.2018.12.009
10. Cross R, Ko CW, Singh S. Mild-to-moderate ulcerative colitis guideline. Gastroenterology. 2019;156(3):768. doi:10.1053/j.gastro.2019.01.037
11. Feuerstein JD, Moss AC, Farraye FA. Ulcerative Colitis. Mayo Clin Proc. 2019;94(7):1357–1373. doi:10.1016/j.mayocp.2019.01.018
12. Newton K, Strasser A, Kayagaki N, Dixit VM. Cell death. Cell. 2024;187(2):235–256. doi:10.1016/j.cell.2023.11.044
13. Bertheloot D, Latz E, Franklin BS. Necroptosis, pyroptosis and apoptosis: an intricate game of cell death. Cell Mol Immunol. 2021;18(5):1106–1121. doi:10.1038/s41423-020-00630-3
14. Chen L, Min J, Wang F. Copper homeostasis and cuproptosis in health and disease. Signal Transduct Target Ther. 2022;7(1):378. doi:10.1038/s41392-022-01229-y
15. Zheng D, Liu J, Piao H, Zhu Z, Wei R, Liu K. ROS-triggered endothelial cell death mechanisms: focus on pyroptosis, parthanatos, and ferroptosis. Front Immunol. 2022;13:1039241. doi:10.3389/fimmu.2022.1039241
16. Galluzzi L, Vitale I, Aaronson SA, et al. Molecular mechanisms of cell death: recommendations of the nomenclature committee on cell death 2018. Cell Death Differ. 2018;25(3):486–541. doi:10.1038/s41418-017-0012-4
17. Chen F, Kang R, Liu J, Tang D. Mechanisms of alkaliptosis. Front Cell Dev Biol. 2023;11:1213995. doi:10.3389/fcell.2023.1213995
18. Liu X, Zhuang L, Gan B. Disulfidptosis: disulfide stress-induced cell death. Trends Cell Biol. 2024;34(4):327–337. doi:10.1016/j.tcb.2023.07.009
19. Holze C, Michaudel C, Mackowiak C, et al. Oxeiptosis, a ROS-induced caspase-independent apoptosis-like cell-death pathway. Nat Immunol. 2018;19(2):130–140. doi:10.1038/s41590-017-0013-y
20. Huang F, Zhang S, Li X, Huang Y, He S, Luo L. STAT3-mediated ferroptosis is involved in ulcerative colitis. Free Radic Biol Med. 2022;188:375–385. doi:10.1016/j.freeradbiomed.2022.06.242
21. Chen Y, Yan W, Chen Y, et al. SLC6A14 facilitates epithelial cell ferroptosis via the C/EBPβ-PAK6 axis in ulcerative colitis. Cell Mol Life Sci. 2022;79(11):563. doi:10.1007/s00018-022-04594-7
22. Kuo WT, Shen L, Zuo L, et al. Inflammation-induced occludin downregulation limits epithelial apoptosis by suppressing caspase-3 expression. Gastroenterology. 2019;157(5):1323–1337. doi:10.1053/j.gastro.2019.07.058
23. Larabi A, Barnich N, Nguyen HTT. New insights into the interplay between autophagy, gut microbiota and inflammatory responses in IBD. Autophagy. 2020;16(1):38–51. doi:10.1080/15548627.2019.1635384
24. Foerster EG, Mukherjee T, Cabral-Fernandes L, Rocha JDB, Girardin SE, Philpott DJ. How autophagy controls the intestinal epithelial barrier. Autophagy. 2022;18(1):86–103. doi:10.1080/15548627.2021.1909406
25. Yang WJ, Han FH, Gu YP, et al. TGR5 agonist inhibits intestinal epithelial cell apoptosis via cAMP/PKA/c-FLIP/JNK signaling pathway and ameliorates dextran sulfate sodium-induced ulcerative colitis. Acta Pharmacol Sin. 2023;44(8):1649–1664. doi:10.1038/s41401-023-01081-y
26. Wan Y, Yang L, Jiang S, Qian D, Duan J. Excessive apoptosis in ulcerative colitis: crosstalk between apoptosis, ROS, ER stress, and intestinal homeostasis. Inflamm Bowel Dis. 2022;28(4):639–648. doi:10.1093/ibd/izab277
27. Franz M, Rodriguez H, Lopes C, et al. GeneMANIA update 2018. Nucleic Acids Res. 2018;46(W1):W60–w64. doi:10.1093/nar/gky311
28. Zhou Y, Zhou B, Pache L, et al. Metascape provides a biologist-oriented resource for the analysis of systems-level datasets. Nat Commun. 2019;10(1):1523. doi:10.1038/s41467-019-09234-6
29. Zhang Z. Naïve Bayes classification in R. Ann Transl Med. 2016;4(12):241. doi:10.21037/atm.2016.03.38
30. Huang J, Zhang J, Wang F, Zhang B, Tang X. Comprehensive analysis of cuproptosis-related genes in immune infiltration and diagnosis in ulcerative colitis. Front Immunol. 2022;13:1008146. doi:10.3389/fimmu.2022.1008146
31. Chen B, Khodadoust MS, Liu CL, Newman AM, Alizadeh AA. Profiling tumor infiltrating immune cells with CIBERSORT. Methods Mol Biol. 2018;1711:243–259.
32. Becht E, Giraldo NA, Lacroix L, et al. Estimating the population abundance of tissue-infiltrating immune and stromal cell populations using gene expression. Genome Biol. 2016;17(1):218. doi:10.1186/s13059-016-1070-5
33. Aran D. Cell-type enrichment analysis of bulk transcriptomes using xCell. Methods Mol Biol. 2020;2120:263–276.
34. Aran D, Hu Z, Butte AJ. xCell: digitally portraying the tissue cellular heterogeneity landscape. Genome Biol. 2017;18(1):220. doi:10.1186/s13059-017-1349-1
35. Racle J, Gfeller D. EPIC: a tool to estimate the proportions of different cell types from bulk gene expression data. Methods Mol Biol. 2020;2120:233–248.
36. Schober P, Boer C, Schwarte LA. Correlation coefficients: appropriate use and interpretation. Anesth Analg. 2018;126(5):1763–1768. doi:10.1213/ANE.0000000000002864
37. Butler A, Hoffman P, Smibert P, Papalexi E, Satija R. Integrating single-cell transcriptomic data across different conditions, technologies, and species. Nat Biotechnol. 2018;36(5):411–420. doi:10.1038/nbt.4096
38. Mi JX, Zhang YN, Lai Z, Li W, Zhou L, Zhong F. Principal component analysis based on nuclear norm minimization. Neural Netwk. 2019;118:1–16. doi:10.1016/j.neunet.2019.05.020
39. Huang Q, Liu Y, Du Y, Garmire LX. Evaluation of cell type annotation R packages on single-cell RNA-seq data. Genomics Proteomics Bioinf. 2021;19(2):267–281. doi:10.1016/j.gpb.2020.07.004
40. Hu C, Li T, Xu Y, et al. CellMarker 2.0: an updated database of manually curated cell markers in human/mouse and web tools based on scRNA-seq data. Nucleic Acids Res. 2023;51(D1):D870–d876. doi:10.1093/nar/gkac947
41. Li J, Xie L, Xie Y, Wang F. Bregmannian consensus clustering for cancer subtypes analysis. Comput Methods Programs Biomed. 2020;189:105337. doi:10.1016/j.cmpb.2020.105337
42. Birney E. Mendelian Randomization. Cold Spring Harb Perspect Med. 2022;12(4). doi:10.1101/cshperspect.a041302
43. Luo J, Xu Z, Noordam R, van Heemst D, Li-Gao R. Depression and inflammatory bowel disease: a bidirectional two-sample Mendelian randomization study. J Crohns Colitis. 2022;16(4):633–642. doi:10.1093/ecco-jcc/jjab191
44. Zhou H, Zhang Y, Liu J, et al. Education and lung cancer: a Mendelian randomization study. Int J Epidemiol. 2019;48(3):743–750. doi:10.1093/ije/dyz121
45. Abdel-Hamed AR, Ghattas MH, Mesbah NM, Saleh SM, Abo-Elmatty DM. Association of interleukin-1A insertion/deletion gene polymorphism and possible high risk factors with non-alcoholic fatty liver disease in Egyptian patients. Arch Physiol Biochem. 2017;123(5):330–333. doi:10.1080/13813455.2017.1339717
46. Yokote A, Imazu N, Umeno J, et al. Ferroptosis in the colon epithelial cells as a therapeutic target for ulcerative colitis. J Gastroenterol. 2023;58(9):868–882. doi:10.1007/s00535-023-02016-4
47. Wu J, Xu X, Duan J, et al. EFHD2 suppresses intestinal inflammation by blocking intestinal epithelial cell TNFR1 internalization and cell death. Nat Commun. 2024;15(1):1282. doi:10.1038/s41467-024-45539-x
48. Cao L, Tan Q, Zhu R, Ye L, Shi G, Yuan Z. LncRNA MIR4435-2HG suppression regulates macrophage M1/M2 polarization and reduces intestinal inflammation in mice with ulcerative colitis. Cytokine. 2023;170:156338. doi:10.1016/j.cyto.2023.156338
49. Shen ZH, Zhu CX, Quan YS, et al. Relationship between intestinal microbiota and ulcerative colitis: mechanisms and clinical application of probiotics and fecal microbiota transplantation. World J Gastroenterol. 2018;24(1):5–14. doi:10.3748/wjg.v24.i1.5
50. Wang QW, Jia DJ, He JM, et al. Lactobacillus intestinalis primes epithelial cells to suppress colitis-related Th17 response by host-microbe retinoic acid biosynthesis. Adv Sci. 2023;10(36):e2303457. doi:10.1002/advs.202303457
51. Wan X, Zhang C, Lei P, et al. Precision therapeutics for inflammatory bowel disease: advancing ROS-responsive nanoparticles for targeted and multifunctional drug delivery. J Mater Chem B. 2025;13(10):3245–3269. doi:10.1039/D4TB02868F
52. Krugliak Cleveland N, Torres J, Rubin DT. What does disease progression look like in ulcerative colitis, and how might it be prevented? Gastroenterology. 2022;162(5):1396–1408. doi:10.1053/j.gastro.2022.01.023
53. Saez A, Gomez-Bris R, Herrero-Fernandez B, Mingorance C, Rius C, Gonzalez-Granado JM. Innate lymphoid cells in intestinal homeostasis and inflammatory bowel disease. Int J Mol Sci. 2021;22(14):7618. doi:10.3390/ijms22147618
54. Letizia M, Wang YH, Kaufmann U, et al. Store-operated calcium entry controls innate and adaptive immune cell function in inflammatory bowel disease. EMBO Mol Med. 2022;14(9):e15687. doi:10.15252/emmm.202215687
55. Dharmasiri S, Garrido-Martin EM, Harris RJ, et al. Human intestinal macrophages are involved in the pathology of both ulcerative colitis and crohn disease. Inflamm Bowel Dis. 2021;27(10):1641–1652. doi:10.1093/ibd/izab029
56. Coutinho-Wolino KS, Almeida PP, Mafra D, Stockler-Pinto MB. Bioactive compounds modulating Toll-like 4 receptor (TLR4)-mediated inflammation: pathways involved and future perspectives. Nutr Res. 2022;107:96–116. doi:10.1016/j.nutres.2022.09.001
57. Meriwether D, Jones AE, Ashby JW, et al. Macrophage COX2 mediates efferocytosis, resolution reprogramming, and intestinal epithelial repair. Cell Mol Gastroenterol Hepatol. 2022;13(4):1095–1120. doi:10.1016/j.jcmgh.2022.01.002
58. Fu J, Wu H. Structural mechanisms of NLRP3 inflammasome assembly and activation. Annu Rev Immunol. 2023;41(1):301–316. doi:10.1146/annurev-immunol-081022-021207
59. Bui TM, Wiesolek HL, Sumagin R. ICAM-1: a master regulator of cellular responses in inflammation, injury resolution, and tumorigenesis. J Leukoc Biol. 2020;108(3):787–799. doi:10.1002/JLB.2MR0220-549R
60. Kuo WT, Odenwald MA, Turner JR, Zuo L. Tight junction proteins occludin and ZO-1 as regulators of epithelial proliferation and survival. Ann N Y Acad Sci. 2022;1514(1):21–33. doi:10.1111/nyas.14798
61. Kuo WT, Zuo L, Odenwald MA, et al. The tight junction protein ZO-1 r. Gastroenterology. 2021;161(6):1924–1939. doi:10.1053/j.gastro.2021.08.047
62. Ganapathy AS, Saha K, Wang A, et al. Alpha-tocopherylquinone differentially modulates claudins to enhance intestinal epithelial tight junction barrier via AhR and Nrf2 pathways. Cell Rep. 2023;42(7):112705. doi:10.1016/j.celrep.2023.112705
63. Ahmad R, Kumar B, Thapa I, et al. Claudin-2 protects against colitis-associated cancer by promoting colitis-associated mucosal healing. J Clin Invest. 2023;133(23). doi:10.1172/JCI170771
 © 2025 The Author(s). This work is published and licensed by Dove Medical Press Limited. The
full terms of this license are available at https://www.dovepress.com/terms
and incorporate the Creative Commons Attribution
- Non Commercial (unported, 4.0) License.
By accessing the work you hereby accept the Terms. Non-commercial uses of the work are permitted
without any further permission from Dove Medical Press Limited, provided the work is properly
attributed. For permission for commercial use of this work, please see paragraphs 4.2 and 5 of our Terms.
© 2025 The Author(s). This work is published and licensed by Dove Medical Press Limited. The
full terms of this license are available at https://www.dovepress.com/terms
and incorporate the Creative Commons Attribution
- Non Commercial (unported, 4.0) License.
By accessing the work you hereby accept the Terms. Non-commercial uses of the work are permitted
without any further permission from Dove Medical Press Limited, provided the work is properly
attributed. For permission for commercial use of this work, please see paragraphs 4.2 and 5 of our Terms.