Back to Journals » Journal of Inflammation Research » Volume 15
m6A Regulator-Mediated Methylation Modification Patterns and Characterisation of Tumour Microenvironment Infiltration in Non-Small Cell Lung Cancer
Authors Fan Y ![]() , Zhou Y, Lou M, Li X
, Zhou Y, Lou M, Li X ![]() , Zhu X, Yuan K
, Zhu X, Yuan K
Received 3 January 2022
Accepted for publication 9 March 2022
Published 23 March 2022 Volume 2022:15 Pages 1969—1989
DOI https://doi.org/10.2147/JIR.S356841
Checked for plagiarism Yes
Review by Single anonymous peer review
Peer reviewer comments 3
Editor who approved publication: Professor Ning Quan
Yongfei Fan,1 Yong Zhou,1 Ming Lou,1 Xinwei Li,2 Xudong Zhu,1 Kai Yuan1,3
1Department of Thoracic Surgery, The Affiliated Changzhou No. 2 People’s Hospital of Nanjing Medical University, Changzhou, People’s Republic of China; 2Department of Gastroenterology, Affiliated Cancer Hospital of Bengbu Medical College, Bengbu, People’s Republic of China; 3Heart and Lung Disease Laboratory, The Affiliated Changzhou No. 2 People’s Hospital of Nanjing Medical University, Changzhou, People’s Republic of China
Correspondence: Kai Yuan, Department of Thoracic Surgery, The Affiliated Changzhou No. 2 People’s Hospital of Nanjing Medical University, No. 29 Xinglong Lane, Changzhou, 213003, Jiangsu Province, People’s Republic of China, Tel +86-13915890721, Email [email protected]
Purpose: The role of RNA N6-methyladenosine (m6A) modification in the progression of multiple tumours and the tumour microenvironment (TME) has been progressively demonstrated and promises a new direction for tumour therapy. However, there have been no reports on systematic analyses of RNA m6A modification in TME in non-small cell lung cancer (NSCLC).
Patients and Methods: In this study, we used unsupervised cluster analysis to identify three m6A modification patterns of 28 m6A regulators and three m6A gene signature subgroups of commonly differentially expressed genes (co-DEGs) in the three m6A modification patterns. Quantifying these subtypes using the ssGSEA and ESTIMATE algorithms to characterise the tumour immune microenvironment (TIME) in NSCLC. Based on the principal component analysis (PCA), we used co-DEGs to construct m6A scores to analyse the characteristics of m6A modifications in individual patients and assessed the practical clinical utility of m6A scores using a nomogram for survival prediction.
Results: A total of 28 m6A regulators in 1210 NSCLC samples were mainly enriched in RNA modification and metabolic biological processes. The three following m6A modification patterns were identified based on the role of the 28 m6A regulators in TME: immune inflammation, immune evasion and immune desert. The m6A scores calculated based on co-DEGs in these modification patterns were significantly positively correlated with immune infiltration and significantly negatively correlated with tumour mutational burden (TMB). Survival was significantly better in the high-m6A-score group than in the low-m6A-score group, and the m6A score could be used as an independent favourable prognostic factor. In addition, assessment of both immune checkpoint inhibitors (ICIs) and immunophenoscore (IPS) revealed a better immunotherapeutic effect in the high-m6A-score group.
Conclusion: The modification characteristics of 28 m6A regulators in the TIME of NSCLC were analysed from a comprehensive to an individual basis, which may facilitate the development of more effective clinical immunotherapeutic strategies.
Keywords: immunophenotype, immunotherapy, m6A modification, non-small cell lung cancer, tumour microenvironment
Graphical Abstract:

Introduction
RNA modification is an important part of epigenetics and plays an important role in regulating cellular processes in addition to gene and protein modification.1 To date, approximately 160 modifications have been identified in messenger RNAs (mRNAs), long non-coding RNAs (lncRNAs) and microRNAs (miRNAs),2 including N1-methyladenosine (m1A), N7-methyladenosine (m7A), 5-methylcytosine (m5A) and N6-methyladenosine (m6A).3,4 Identified for the first time in the 1970s,5 m6A is the predominant and most abundant form of internal modification in mRNAs and lncRNAs in many eukaryotes, which accounts for 80% of RNA methylation modifications.6,7 It has been demonstrated that methylation modifications in the 5ʹUTR region of mRNA play an important role in mRNA splicing, editing, stability, degradation and polyadenylation in most eukaryotes,8 whereas methylation modifications in the 3ʹUTR region contribute to mRNA translocation outside the nucleus, translation initiation and maintenance of mRNA structural stability with polyA-binding proteins.9,10 M6A methylation modifications have been reported to be reversible,11 involving a combination of methylation transferases (writers), demethylases (erasers) and methylated reading proteins (readers). The m6A writers include YMETTL3, METTL14, METTL5, RBM15, RBM15B, VIRMA, WTAP, ZC3H13, CBLL1 and ZCCHC4. Their primary role is to form a complex that catalyses the m6A modification of adenosine on mRNA. The m6A erasers, including FTO and ALKHB5, mainly serve to demethylate bases that have undergone m6A modification. The primary role of the m6A readers, including YTHDF1, YTHDF2, YTHDF3, YTHDC1, YTHDC2, HNRNPA2B1, HNRNPC, FMR1, EIF3A, IGF2BP1, IGF2BP2, IGF2BP3, ELAVL1, G3BP1, G3BP2 and PRRC2A, is to enhance the translation and reduce the abundance of target RNAs.12,13 Increasing evidence suggests that m6A modifications are involved in important biological processes and are dynamically regulated in several physiological and pathological processes, such as malignancy progression,14,15 abnormal immune regulation16–18 and cardiovascular diseases.19,20 Therefore, a comprehensive understanding of the expression perturbations and genetic variation of potential m6A regulators in the context of cancer heterogeneity may facilitate the identification of therapeutic targets based on RNA methylation.
Lung cancer is one of the five most common cancers in the world and has the highest mortality rate of all cancers, with more than 2 million new cases and more than 1.76 million deaths worldwide each year.21 NSCLC and small cell lung cancer are two subtypes of lung cancer, and NSCLC accounts for approximately 85% of new cases each year.22 Surgical resection remains the primary treatment for early-stage NSCLC. Screening with low-dose spiral computed tomography (CT) has revealed significant results in the early diagnosis of lung cancer;23 however, the 5-year survival rates remain suboptimal owing to high rates of recurrence and metastasis. In addition to traditional surgical therapy, radiotherapy, chemotherapy, mutation gene-targeting therapy and immunotherapy by targeting ICIs such as cytotoxic T lymphocyte-associated antigen-4 (CTLA-4), programmed death receptor-1 (PD-1) and programmed death receptor-1 ligand (PD-L1) have greatly improved the long-term survival of patients with NSCLC and have achieved promising results in patients with advanced metastases.24–26 Immunotherapy relies on the immune function of the body to kill tumour cells by activating the immune system. The TME is a complex integrated system mainly composed of tumour cells, stromal cells, inflammatory cells, vascular system and extracellular matrix components, which can be divided into TIME dominated by immune cells and non-TIME dominated by fibroblasts. Studies have demonstrated that a suppressive microenvironment or a lack of antigen stimulation/co-stimulation of immune cells, especially T cells, may contribute to tumour growth and immune escape within TME.27–29 In addition, according to the composition of different TIME, it can be divided into “immune inflammation”, “immune evasion” and “immune desert”.30–32 Therefore, assessing immune infiltration based on the characteristics of TME is key to predicting responses to existing ICIs and developing new immunotherapeutic strategies.
Several studies have demonstrated a strong correlation between TME and m6A modifications, especially in immune cell infiltration.33,34 ALKBH5 modulates the therapeutic response of anti-PD-1 by regulating lactate and inhibiting the accumulation of immune cells in TIME, thereby reducing the outcome of immunotherapy in melanoma, colorectal cancer and potentially other cancers.35 FTO enhances protein expression by regulating the m6A modification of JUNB and CEBPB genes, thereby promoting tumour glycolysis and inhibiting T cell effects.36 Similarly, the role of m6A modifications in TME has been successively reported in lung cancer. In NSCLC, circNDUFB2 is involved in the degradation of IGF2BPs, activation of anti-tumour immunity and cellular immune responses by regulating protein ubiquitination and degradation.37 NSCLC tissues with high expression of YTHDF1 and YTHDF2 had significantly higher lymphocyte subpopulations in the stroma, and patients had a better prognosis.38 In addition, Li et al developed an m6A scoring scheme, which positively correlated with PD-L1 expression and reflected the role of TME in the prognosis of patients with lung adenocarcinoma.39
However, a few studies have reported on the role of m6A modifications in the TME of NSCLC. In this study, we comprehensively assessed m6A modification patterns in NSCLC and correlated the characteristics of immune cell infiltration in TME. Using an unsupervised clustering approach, we identified three different m6A modification patterns and defined m6A modification pattern-associated co-DEGs. We found that different m6A modification patterns were accompanied by different immune cell infiltration characteristics. In addition, we constructed an m6A scoring scheme to quantify each m6A modification and predict the prognosis of patients with NSCLC based on this scheme.
Materials and Methods
Acquisition and Collation of Open Datasets
We obtained a total of 1244 NSCLC samples with gene transcription and clinical information from The Cancer Genome Atlas (TCGA) (tumour = 1037; normal = 108) (https://portal.gdc.cancer.gov/) and Gene Expression Omnibus (GEO) (tumour = 197; GSE37745) (https://www.ncbi.nlm.nih.gov/geo/) databases. The fragments per kilobase of transcript per million mapped reads (FPKM) format of RNA-sequencing data in TCGA database was converted to the transcripts per kilobase million (TPM) format using the “limma” package, and data in the GSE37745 dataset of the GEO microarray sequencing platform (Affymetrix HG-U133 plus 2.0) were normalised using the “affy” and “simpleaffy” packages. Subsequently, the “SVA” R package was used to eliminate batch effects and merge them into a gene expression matrix (TCGA-GEO, tumour = 1210) based on TCGA and GEO datasets. Furthermore, clinical data from TCGA and GEO with missing follow-up time and survival time less than 30 days were removed to exclude interventions for non-tumorigenic factors (clinical TGCA-GEO = 1196). Genomic mutation data from TCGA including somatic mutations and copy number variations (CNVs) were downloaded from the UCSC Xena database (https://xena.ucsc.edu/). The “Rcircos” package was used to visualise the CNVs of 28 m6A regulators on human chromosomes. The “maftools” package was used to calculate the tumour mutational burden (TMB) in NSCLC samples, including non-synonymous mutations such as frameshift, inflame, missense, nonsense and splice site mutations. Survival analysis was performed using both Cox and Kaplan–Meier (KM) methods, and a P-value < 0.05 was considered significant (Log rank test). Finally, the “igraph” R package was used to visualise 28 machine-modulated prognostic interaction networks.
Unsupervised Clustering for 28 m6A Regulators
Unsupervised cluster analysis was performed based on the expression of 28 m6A regulators using the “ConsenseClusterPlus” package to obtain different m6A modification patterns and categorise them into different modification subtypes. Clustering algorithms—a subset of unsupervised pattern recognition or machine-learning algorithms—identify patterns in a dataset. In genomic studies, this is often described as identifying “clusters” of genes with similar expression patterns. Briefly, unsupervised pattern recognition (clustering) explicitly identifies the underlying patterns inherent in a dataset.40,41 In addition, the number of clusters and their stability were determined using the consensus clustering algorithm. The conditions for cluster screening were as follows: 1) strong association of intra-typical samples and weak association of inter-typical samples and 2) the sample amount of each topology should not be too small.
Oncological Characteristics of Three m6A Modification Patterns
The Hallmarker consensus pathway gene set downloaded from MSigDB (http://www.gsea-msigdb.org/gsea/login.jsp) was subjected to gene set variation analysis (GSVA). GSVA is a non-parametric, unsupervised algorithm that evaluates the enrichment of different metabolic pathways between samples by converting the expression matrix of genes between samples into the expression matrix of gene sets between samples.42 GSVA was performed using the “GSVA” package to assess the enrichment of relevant pathways in three m6A modification patterns.
Stromal cells are thought to play an important role in tumour growth, disease progression and drug resistance.43 Estimation of stromal and immune cells in malignant tumour tissues using expression data (ESTIMATE) was performed using transcriptional profiles of cancer samples to evaluate the number of tumour cells, infiltrating immune cell and stromal cells, and the “estimateScore” function was used to calculate the tumour purity, immune cell score and stromal cell score of all samples. In addition, the expression levels of PD-L1 (CD274) in three modification patterns were calculated to determine the effects of immunotherapy.
Single-sample gene set enrichment analysis (ssGSEA) was used to assess the gene sets of immune cells and functions in three m6A modification patterns using the “GSVA” package. The rank value of each gene was calculated from each immune cell or functional expression profile, and the bio-similarity of infiltrating immune cells was estimated using multidimensional scaling and the Gaussian fitting model. A P-value < 0.05 was considered statistically significant.
Identification of Differentially Expressed Genes (DEGs) Among Three m6A Modification Patterns
To identify DEGs associated with m6A modifications in three m6A modification patterns, we assessed the DEGs of NSCLC samples in different patterns using the “limma” R package. A P-value < 0.001 was considered screening condition for DEGs. Venn diagrams were drawn using the “VennDiagram” R package to visualise commonly differentially expressed genes (co-DEGs) in three m6A modification patterns. Metascape (http://metascape.org/gp/index.html) was used to visualise the clusters of these co-DEGs with similar functions, reveal intra- and inter-cluster correlations and annotate gene ontology (GO).44 The co-DEGs were subjected to unsupervised clustering analysis to obtain different transcriptional phenotypes, and the “limma” package was used to analyse the differential expression of 28 m6A regulators in these phenotypes. Finally, survival differences between these phenotypes were compared using KM analysis (Log rank test, P-value < 0.05).
Construction of the m6A Scoring Program
In order to analysis the m6A modification characteristics of individual NSCLC patients, we constructed an m6A scoring program to assess the characteristics of m6A modification in individual patients. Univariate Cox prognostic analysis was performed on the co-DEGs of three m6A modification patterns to identify genes with significant prognostic impact for further analysis. Subsequently, we performed PCA and extracted principal components 1 and 2 as signature scores. PCA offered the advantage of focussing the score on the set with the largest number of well-correlated (or anticorrelated) genes while down-weighting contributions from genes that did not correlate with other members of the set.45 Eventually, we adopted a formula similar to that reported in previous studies to define the m6A score:46–48

In the formula, i is the expression of co-DEGs in three m6A modification patterns.
Prognostic Analysis Based on m6A Scoring
To explore the correlation between m6A scoring and prognosis of patients with NSCLC, we used the “survminer” package to classify m6A scores into the high- (n = 217) and low-score (n = 940) groups and plot KM survival curves (Log rank test, P-value < 0.05). Clinical parameters (age, sex and stage) and m6A scoring were included in univariate and multivariate Cox analyses, and a P-value < 0.05 satisfied the condition of independent prognosis. In addition, the “rms” R package was used to build a nomogram scoring system. This system develops scoring criteria based on the magnitude of the regression coefficients of all independent variables and gives each independent variable a score for each value considered. A total score can be calculated for each patient, and subsequently, the probability of occurrence of outcomes for each patient is calculated using a conversion function between the scores and the probability of occurrence of outcomes.49 Finally, calibration curves were plotted to assess the accuracy of the model in predicting 1-, 3- and 5-year survival rates. If the r model prediction curve coincided with the reference line, the predicted value was considered equal to the actual value; if the model prediction curve was above the reference line, the predicted value was greater than the actual value; if the model prediction curve was below the reference line, the predicted value was lower than the actual value.
Statistical Analysis
Statistical analyses were performed using the R software, version 4.1.1. For quantitative data in the article data analysis, statistical significance of normally distributed variables was estimated using the Student’s t-test, and non-normally distributed variables were analysed using the Wilcoxon rank-sum test. The Log rank test was used to compare data between two groups, and the Kruskal–Wallis test was performed to compare data between more than two groups. The “survival” package was used to categorise samples into groups, and the “survminer” package was used for KM survival analysis and Cox proportional risk model construction. A P-value < 0.05 was considered statistically significant, and the Benjamini–Hochberg method was used to control the false discovery rate (FDR) while testing multiple hypotheses.
Results
Landscape of Genetic Variation of m6A Regulators in NSCLC
We searched the PubMed online website to screen for regulatory genes of m6A RNA methylation and eventually found 28 m6A regulators that have been demonstrated to be closely associated with cancer (Table 1). These regulators included 10 “writers” (CBLL1, METTL14, METTL3, METTL5, RBM15, RBM15B, VIRMA, WTAP, ZCCHC4 and ZC3H13), 17 “readers” (EIF3A, G3BP1, ELAVL1, FMR1, HNRNPA2B1, HNRNPC, IGF2BP1, IGF2BP2, IGF2BP3, LRPPRC, PRRC2A, YTHDC1, YTHDC2, YTHDF1, YTHDF2 and YTHDF3) and 2 “erasers” (ALKBH5 and FTO). These m6A regulators play a critical role in the biological cell cycle, recognising, removing and adding m6A modification sites and affecting important biological processes such as RNA splicing, RNA translation and RNA degradation (Figure 1A). Metascape analysis of the 28 m6A regulators revealed that they performed an essential function in the modification and metabolism of RNA (Figure 1A; Supplementary Figure 1A). Furthermore, we analysed the incidence of somatic mutations and CNVs of the 28 m6A regulators in NSCLC. Of the 1052 samples, 275 (26.14%) had genetic alterations in m6A regulators, mainly in the form of frameshift deletion, nonsense and missense mutations. Among these genes, ZC3H13 had the highest mutation frequency, whereas METTL3, METTL5 and VIRMA did not harbour any mutations (Figure 1B). In addition, CNVs were prevalent in the 28 m6A regulators. Regulatory genes predominantly had amplified copy numbers, with the copy number amplification being most frequent in IGF2BP2, whereas YTHDF2, ELAVL1, ZC3H13, METTL14, RBM15, YTHDC2, METTL16 and RBM15B had copy number deletions (Figure 1C). The “Rcircos” package was used to mark the location of CNVs in the 28 m6A regulators on chromosomes (Figure 1D). Furthermore, a comparison of the expression of the 28 m6A regulatory genes in NSCLC and normal tissues indicated that CBLL1, METTL3, RBM15, VIRMA, EIF3A, ELAVL1, HNRNPA2B1, HNRNPC, IGF2BP1, IGF2BP2, IGF2BP3, LRPPRC, PRRC2A, RBMX, YTHDF1 and YTHDF2 were significantly upregulated and METTL14, METTL16, ZC3H13, ELAVL1 and FTO were significantly downregulated in NSCLC (Figure 1E). This finding was similar to the CNV results, implying that genetic variation may affect the expression of m6A regulators in patients with NSCLC. Based on the expression of these 28 m6A regulatory genes, NSCLC samples could be distinguished from normal samples in TCGA dataset using PCA (Figure 1F). It was found that the 28 m6A regulatory genes were predominantly positively co-expressed in NSCLC, with the strongest positive correlation observed between YTHDF3 and VIRMA, followed by YTHDC2 and RBM15, and the strongest negative correlation observed between WTAP and RBM15B, FTO and RBM15, and IGF2BP2 and ZCCHC4 (Supplementary Figure 1B). These results revealed that the genomic and transcriptomic landscapes of m6A regulators were significantly different and associated between NSCLC and normal samples. Therefore, changes in the expression of m6A regulators and genetic variation play a crucial role in regulating the development and progression of NSCLC.
 |
Table 1 The Descriptions of 28 m6A Regulators |
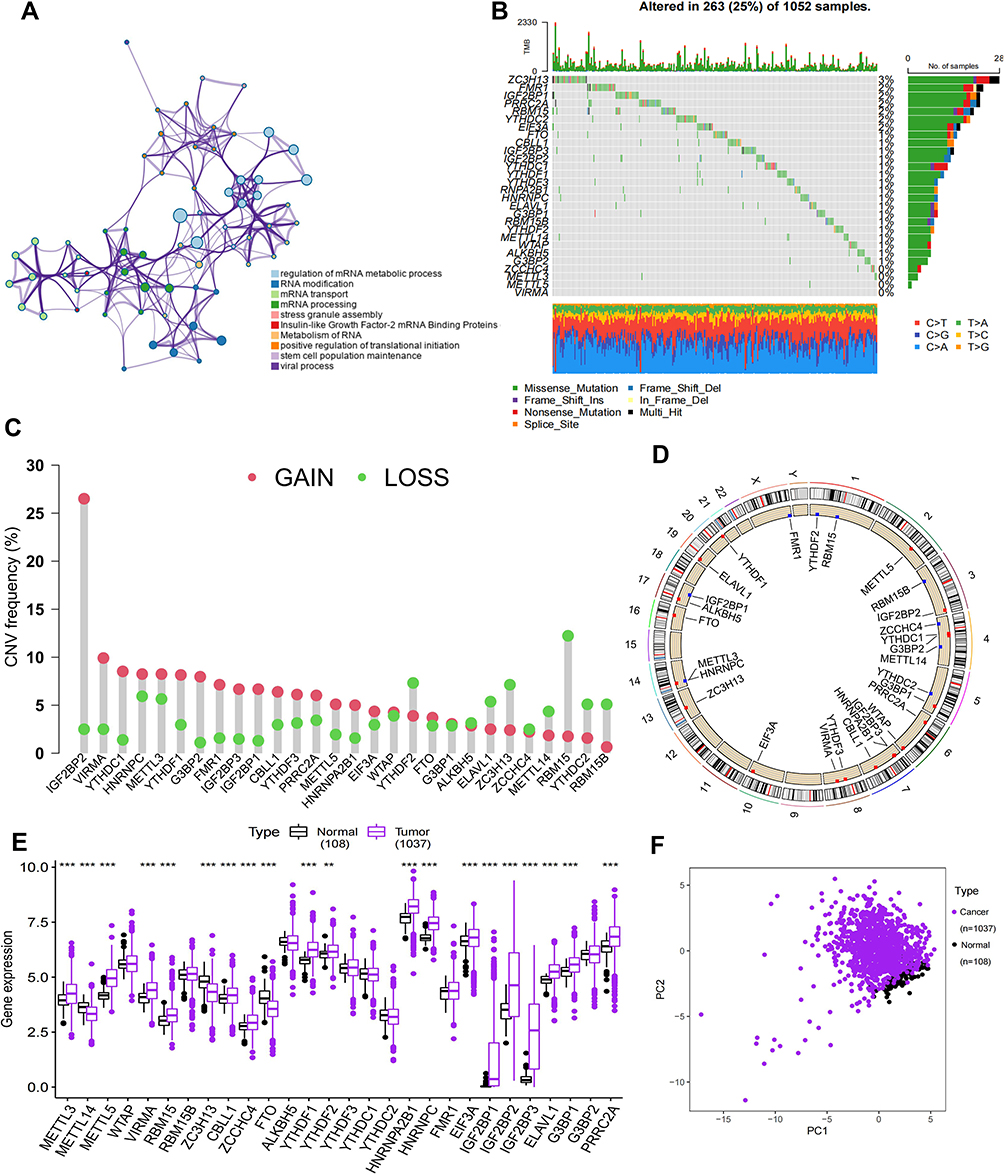 |
Figure 1 Gene alteration characteristics of 28 m6A regulators in NSCLC. (A) Metascape enrichment networks visualize functionally similar clusters and reveal intra- and inter-cluster correlations. Each color corresponds to a function. (B) Gene alterations in the m6A regulator were present in 263 (25%) of 1052 NSCLC patients. The genes on the left are the 28 regulators, the numbers on the right indicate the frequency of mutations in each regulator, the type of mutation is shown below, and each column in the middle represents each patient. (C) CNV mutation frequencies for 28 m6A regulators in NSCLC. Red represents deletion frequencies and blue represents amplification frequencies. (D) Position of 28 m6A regulators of CNV alteration on chromosomes. (E) Differential expression of 28 m6A regulators between normal and NSCLC samples in the TCGA database. (F) PCA of 28 m6A regulators in TCGA dataset can distinguish tumour and normal samples. **p value < 0.01; ***p value < 0.001. |
Identification of m6A Methylation Modification Patterns Mediated by 28 the Regulators
A majority of the 28 m6A regulators were identified as prognostic risk factors based on Cox survival analysis, and Cox and KM survival analyses revealed that G3BP1, HNRNPC, IGF2BP1, METTL3, METTL5 and VIRMA were significantly associated with prognosis (Table 2). Furthermore, the interaction network of m6A regulatory genes described a comprehensive landscape of gene interactions, gene connectivity and their prognostic significance in NSCLC (Figure 2A). A significant correlation was observed not only among m6A regulators of the same functional class but also among regulators of different classes. In addition, we found a significantly negative prognostic correlation between IGF2BP2 and ZCCHC4, which is consistent with the result in Supplementary Figure 1B; however, other regulatory genes exhibited a significantly positive correlation with each other. We speculated that such interactions may play a key role in the formation of different m6A modification patterns and may be associated with the pathogenesis and progression of cancer.
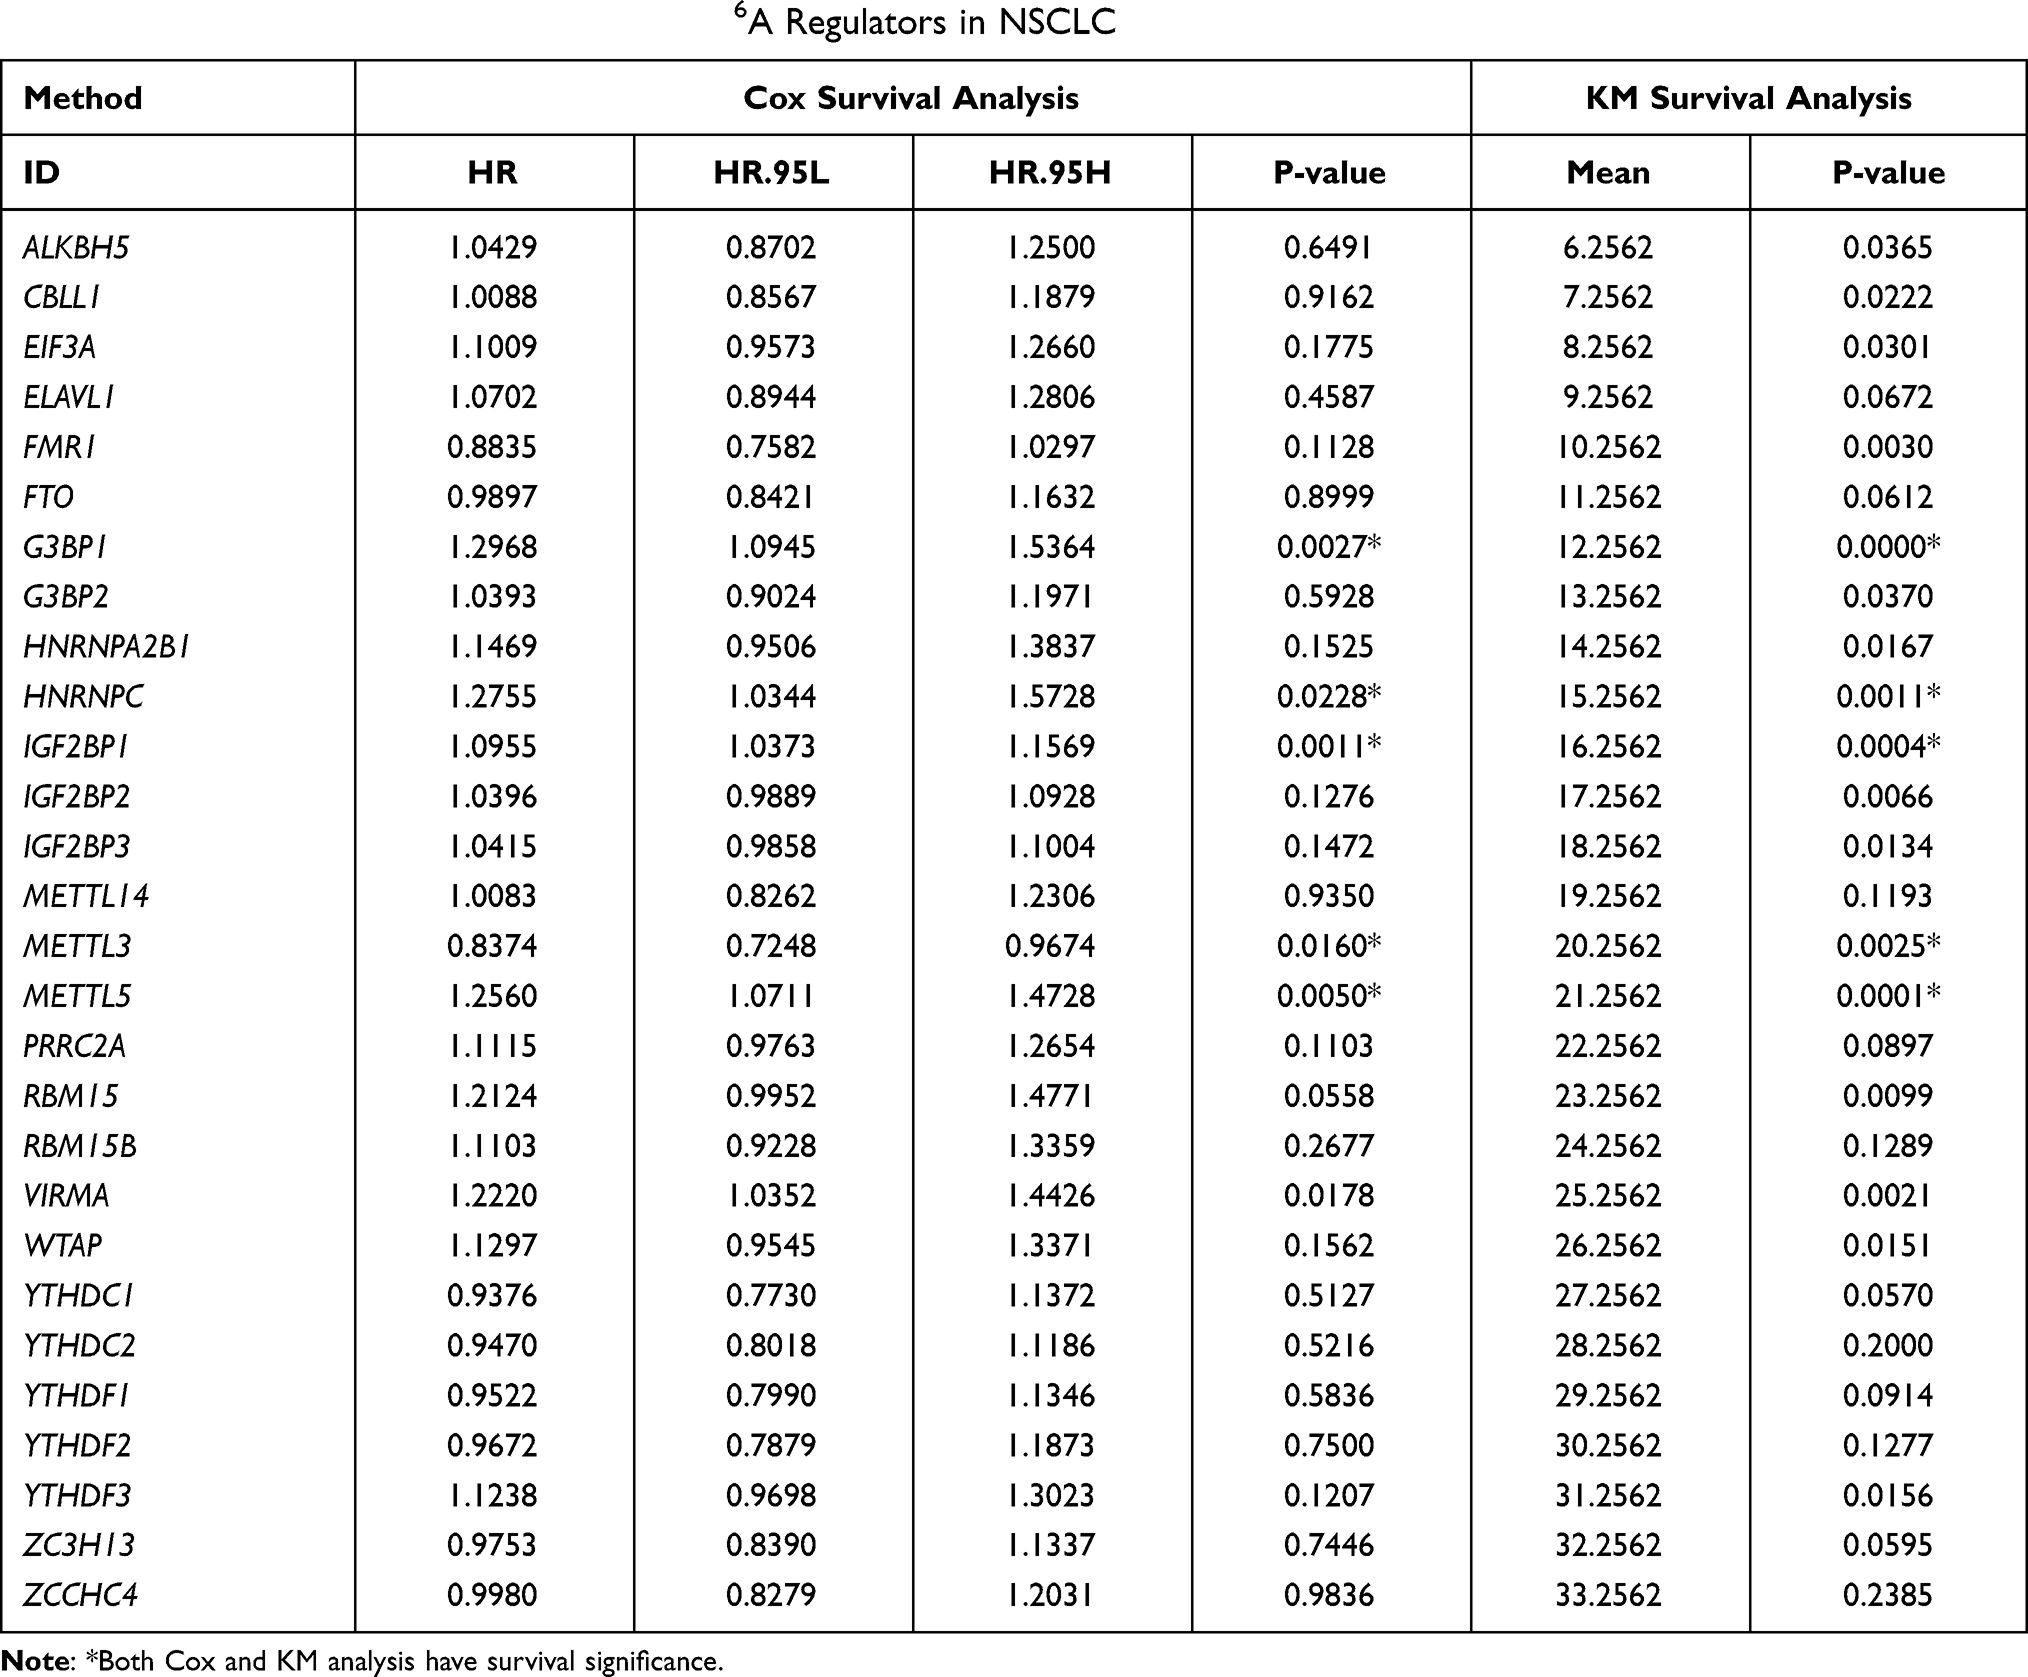 |
Table 2 Cox and KM Survival Analysis of 28 m6A Regulators in NSCLC |
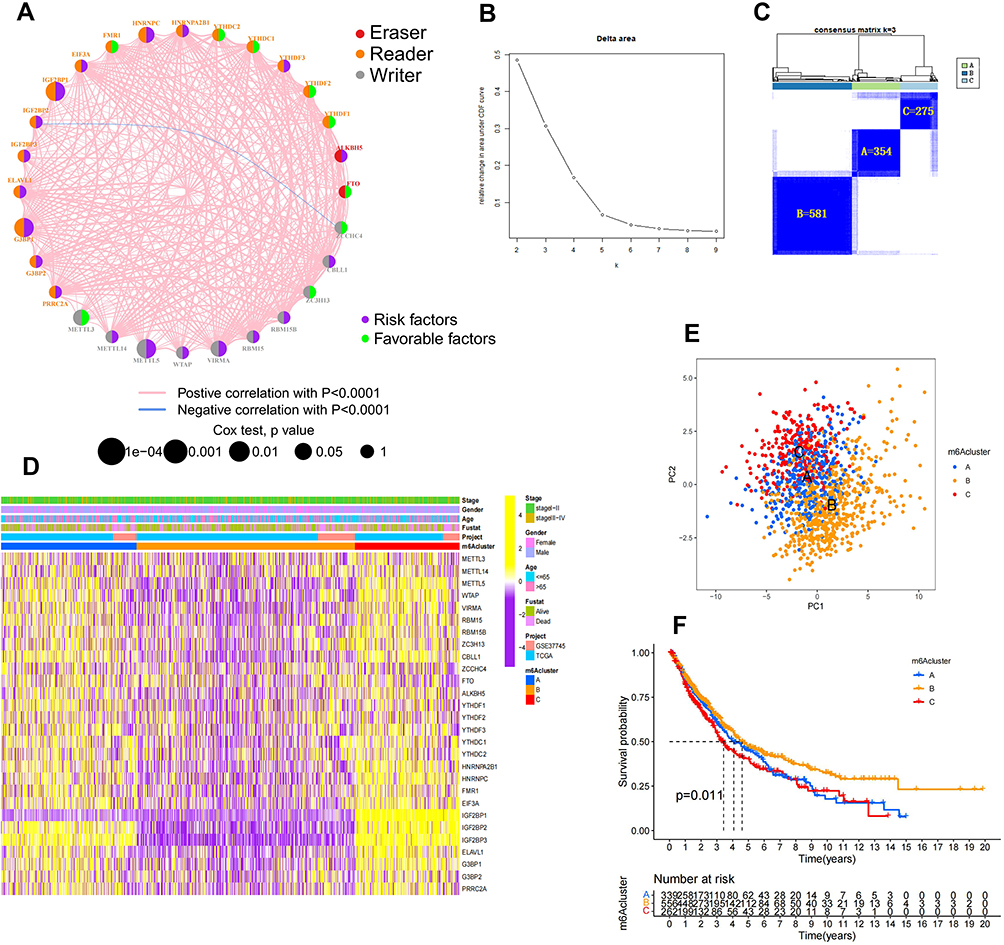 |
Figure 2 Unsupervised clustering for 28 m6A regulators. (A) Interaction network between 28 m6A regulators in NSCLC. The circle in red represents the m6A “eraser” regulators, orange represents the “reader” regulators, and gray represents the “writer” regulators; the purple represents the risk factors, and the green represents the favorable factors. Larger circles indicate a more significant prognostic correlation for Cox risk analysis. The pink line between moderators represents a significant positive correlation, while blue represents a significant negative correlation. (B and C) Results of unsupervised clustering analysis. (D) Heathmap of expression of 28 m6A regulators in NSCLC clinical information samples and three m6A modification patterns. (E) Significant differences among the transcriptomes of the different modification patterns in the transcriptome profiles analysis of the three m6A modification patterns by using PCA. (F) KM survival differential analysis of three m6A modification patterns (p value < 0.05). |
Furthermore, we used consensus clustering analysis to stratify samples with qualitatively different m6A modification patterns based on the expression of the 28 m6A regulators. Three different modification patterns were eventually identified using unsupervised clustering for m6ACluster-A (n = 354), m6ACluster-B (n = 581) and m6ACluster-C (n = 275) (Figure 2B and C; Supplementary Figure 2A). The heatmap of the distribution of clinicopathological factors and the three modification patterns of the 28 m6A regulators indicated that m6ACluster-B samples exhibited low expression in NSCLC, whereas m6ACluster-A and m6ACluster-C exhibited high expression. Of these genes, IGF2BP2 and IGF2BP3 were significantly upregulated in the m6ACluster-A and m6ACluster-C modification patterns and downregulated in the m6ACluster-B modification pattern. Moreover, unlike other regulatory genes, IGF2BP1 was downregulated in m6ACluster-A (Figure 2D). PCA revealed significant differences among the transcriptomes of different modification patterns (Figure 2E). In addition, survival analysis suggested that m6ACluster-B had the best prognosis, whereas m6ACluster-A and m6ACluster-C were associated with the worst prognosis (Figure 2F). This finding implied that the pattern of highly expressed m6A regulators in NSCLC may be associated with a poor prognosis.
Characterisation of the m6A Modification Patterns Based on Distinct Immune Landscapes
To explore the biological behaviour of the three m6A modification patterns, we performed GSVA on the Hallmarker pathway gene sets. The results revealed that the m6ACluster-B modification pattern was significantly enriched in immune activation pathways such as interferon α/γ response, IL2/IL6 signalling and allograft rejection and stromal signalling pathways such as epithelial–mesenchymal transition (EMT), transforming growth factor beta (TGF-β) and angiogenesis. The m6ACluster-C modification pattern was mainly enriched in oncogenic pathways such as the P53 pathway, PI3K–AKT–MTOR signalling and MYC targeting and in genetic stability processes such as DNA repair. Furthermore, we found that some pathways enriched in m6ACluster-C not only play a role in tumour progression but are also involved in cellular stromal activities, such as hedgehog signalling and the WNT β-linked protein signalling pathway. Interestingly, the m6ACluster-A modification pattern was enriched in oncogenic pathways, stromal signalling and immune activation, which also became the focus of our study. In addition, heatmap ESTIMATE scoring exhibited that immune cell and stromal scores of NSCLC samples were higher in the m6ACluster-B modification pattern, whereas tumour purity scores were the highest in the m6ACluster-C modification pattern (Figure 3A). Subsequently, we constructed a heatmap of immune cell infiltration and immune function enrichment using ssGSEA to compare the immune status of patients with NSCLC in the three m6A modification patterns. We observed that anti-tumour immune cells and immune functions were upregulated and most abundant in the m6ACluster-B modification pattern, whereas they were downregulated in the m6ACluster-C modification pattern. As demonstrated in Figure 3A, the m6ACluster-A modification pattern was present in a larger number of samples with upregulated immune cells and immune functions (Supplementary Figure 3A). Further quantitative analysis revealed that the three m6A modification patterns were significantly different in these immune gene sets, and the degree of immune infiltration was higher in the m6ACluster-C modification pattern (Figure 3B). However, the m6ACluster-A modification pattern did not offer a significant survival advantage compared with the m6ACluster-C modification pattern. Studies have demonstrated that the immune-exclusive tumour phenotype is characterised by a large number of immune cells that are retained in the stroma surrounding the nest of tumour cells without penetrating their substance.32 We speculated that the enriched stromal component of the m6ACluster-A modification pattern inhibited effective antitumour immune responses. Quantification of ESTIMATE scores in the three m6A modification patterns revealed that m6ACluster-B had the highest immune cell and stromal scores, and the scores of m6ACluster-C were lower than those of m6ACluster-A, while the opposite phenomenon was observed in tumour purity (Figure 3C–E). This finding implied that the m6ACluster-A and m6ACluster-C modification patterns contained more non-tumour components. Stromal activation in the tumour microenvironment is thought to be responsible for T cell suppression. Stromal activation in TME is considered responsible for T cell suppression. Studies have demonstrated that a suppressive microenvironment or a lack of antigen stimulation/co-stimulation of immune cells, especially T cells, may contribute to tumour growth and immune escape within TME.27–29 Furthermore, the enrichment levels of mesenchymal signalling pathways such as EMT, angiogenesis, TGF-β and Notch pathways in the three modification patterns were evaluated, and the results revealed that the stromal component was more abundant in the m6ACluster-A modification pattern than in the m6ACluster-C modification pattern, whereas T cell co-stimulation, T cell co-inhibition and the number of T helper and CD8+ T cells were decreased in both modification patterns (Figure 3B and F). Therefore, this finding suggested that m6ACluster-A was characterised by an immunosuppressive state that inhibited the antitumour effects of immune cells through stromal activation. Currently, PD-L1 is a landmark discovery in lung cancer immunotherapy, and its expression level in patients is an important assessment indicator to predict the response to anti-PD-1/L1 therapy.50,51 Evaluation of PD-L1 expression levels in the three modification patterns revealed that the expression levels were the highest in m6ACluster-A, indicating a better immunotherapeutic effect (Figure 3G). Based on these findings, we identified three m6A modification patterns with distinct immune infiltration profiles. m6ACluster-B is considered an immune-inflamed phenotype characterized by immune activation and massive immune cell infiltration; m6ACluster-A is considered an immune-excluded phenotype characterized by stromal activation and weakened immune cell infiltration; and m6ACluster-C is considered an immune-desert phenotype characterized by immunosuppression.
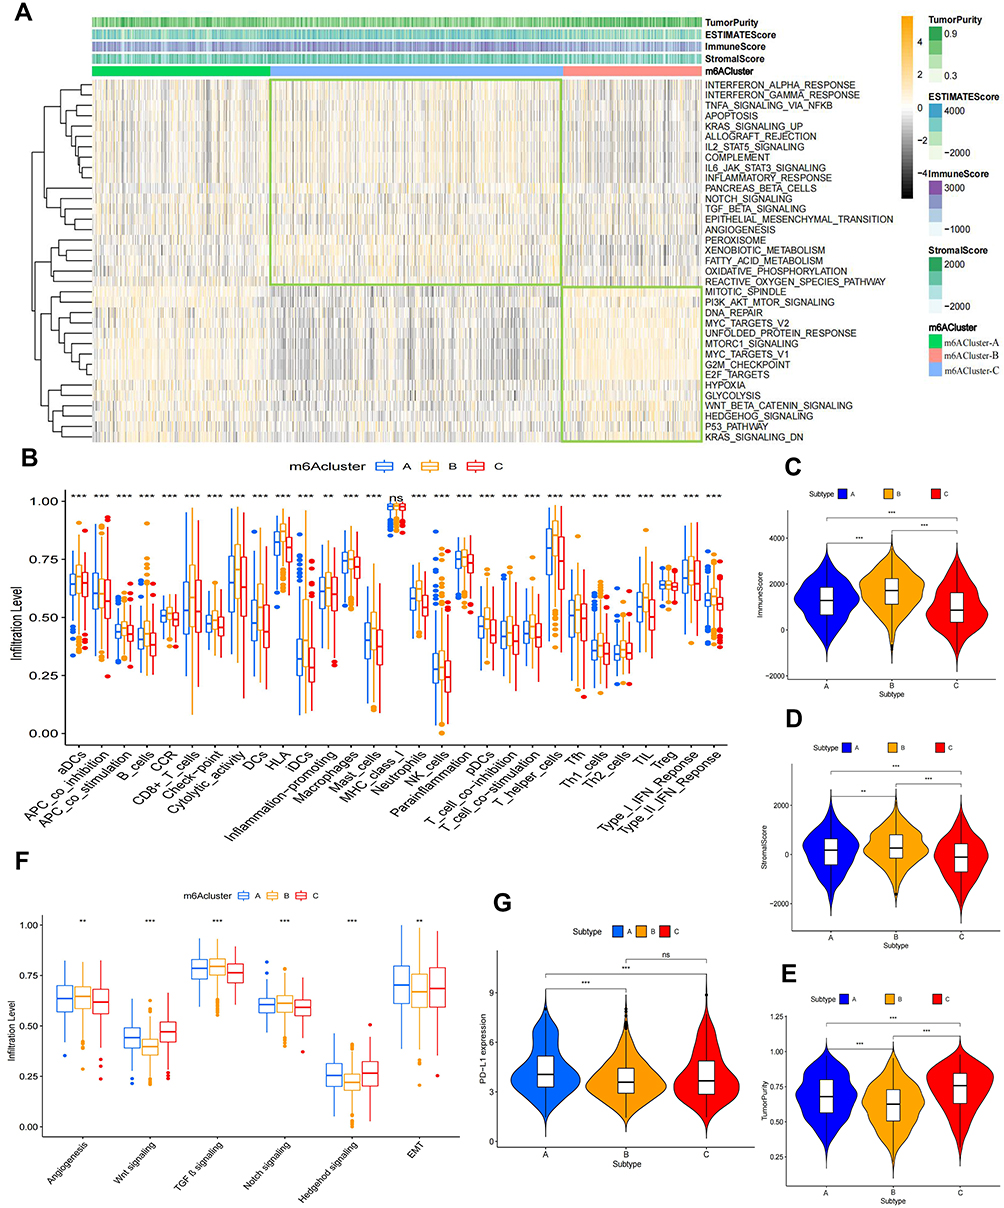 |
Figure 3 TME characteristics in the three m6A modification patterns. (A) GSVA enrichment analysis and ESTIMATE scoring heatmap of three m6A modification patterns in the Hallmark pathway gene set. The Orange colour in GSVA enrichment analysis represents high expression of the sample and the black colour represents low expression of the sample. (B) Comparison of immune cells and immune function in three m6A modification patterns by the ssGSEA method. The ESTIMATE algorithm was used to score (C) immune cells, (D) stromal cells and (E) tumour purity in three m6A-modified patterns samples. (F) Differential analysis of three m6A modification patterns in the stromal signaling pathways. (G) Differential expression analysis of PD-L1 in three m6A modification patterns. **p value < 0.01; ***p value < 0.001. |
Pearson correlation analysis was used to analyze the relationship between the 28 m6A regulators and these immune cells and functions. We found a predominantly significant negative correlation between the regulators and immune cells and functions. The regulators METTL5, HNRNPC, IGF2BP1 and VIRMA (KIAA1429), which were associated with poor prognosis and exhibited a significantly negative correlation with immune cells and functions, were the main focus of this study (Supplementary Figure 3B). As demonstrated in Supplementary Figure 1B, a significantly positive correlation was observed among these four regulators, and protein interaction analysis by using STRING website (https://cn.string-db.org/) revealed a strong correlation between VIRMA and HNRNPC (interaction score > 0.70) (Supplementary Figure 3C). In addition, ESTIMATE evaluation suggested that the immune scores in the high-expression group of VIRMA and HNRNPC were significantly lower than those in the low-expression group (Supplementary Figure 3D and E). Therefore, we hypothesised that VIRMA and HNRNPC synergistically mediated methylation modifications and inhibited intra-tumour immune cell infiltration in NSCLC.
DEGs Associated with the m6A Modification Patterns
Based on the three m6A modification patterns classified by the consistent clustering algorithm for the expression of the 28 m6A regulators described above, we gained a preliminary understanding of the characteristics of m6A regulators in NSCLC, however, the potential genetic alterations and expression perturbations of these patterns in NSCLC remain unclear. For further investigation of the oncogenic characteristics of the three m6A modification patterns, we analysed the potential changes in m6A-related transcript expression in NSCLC. Using the empirical Bayesian approach,52 1850 DEGs were found to be commonly expressed among the three m6A modification patterns (Figure 4A). Enrichment analysis of these co-DEGs using Metascape revealed that these genes were mainly enriched in biological functions such as cell cycle, DNA and RNA modification and tumourigenesis. (Figure 4D and E). This finding provided further evidence that these co-DEGs possessed the characteristics of m6A regulators (Figure 1A) and can be considered as m6A gene signatures. Subsequently, these genes were subjected to unsupervised clustering analysis to obtain three transcriptional phenotypes, and the patient samples were divided into three m6A gene signature subgroups (geneCluster-A, geneCluster-B and geneCluster-C) based on the three phenotypes (Figure 4B and C; Supplementary Figure 2B). The heatmap of the three m6A gene signature subgroups revealed that patient samples were most enriched in immune cells and functions in geneCluster-B and least enriched in immune cells and functions in geneCluster-C. (Figure 4F). In addition, differential expression analysis of the 28 m6A regulators in the three m6A gene signature subgroups demonstrated that geneCluster-B exhibited significantly low expression, whereas geneCluster-C exhibited significantly high expression (Figure 4G). This finding is consistent with the results of the expression analysis of m6A methylation modification patterns (Figure 2D). In addition, survival analysis revealed that the prognosis of geneCluster-B was better than that of geneCluster-A and geneCluster-C (Figure 4H), which further supported our previous conclusion that high expression of m6A regulators in m6A modification patterns is associated with a poorer prognosis.
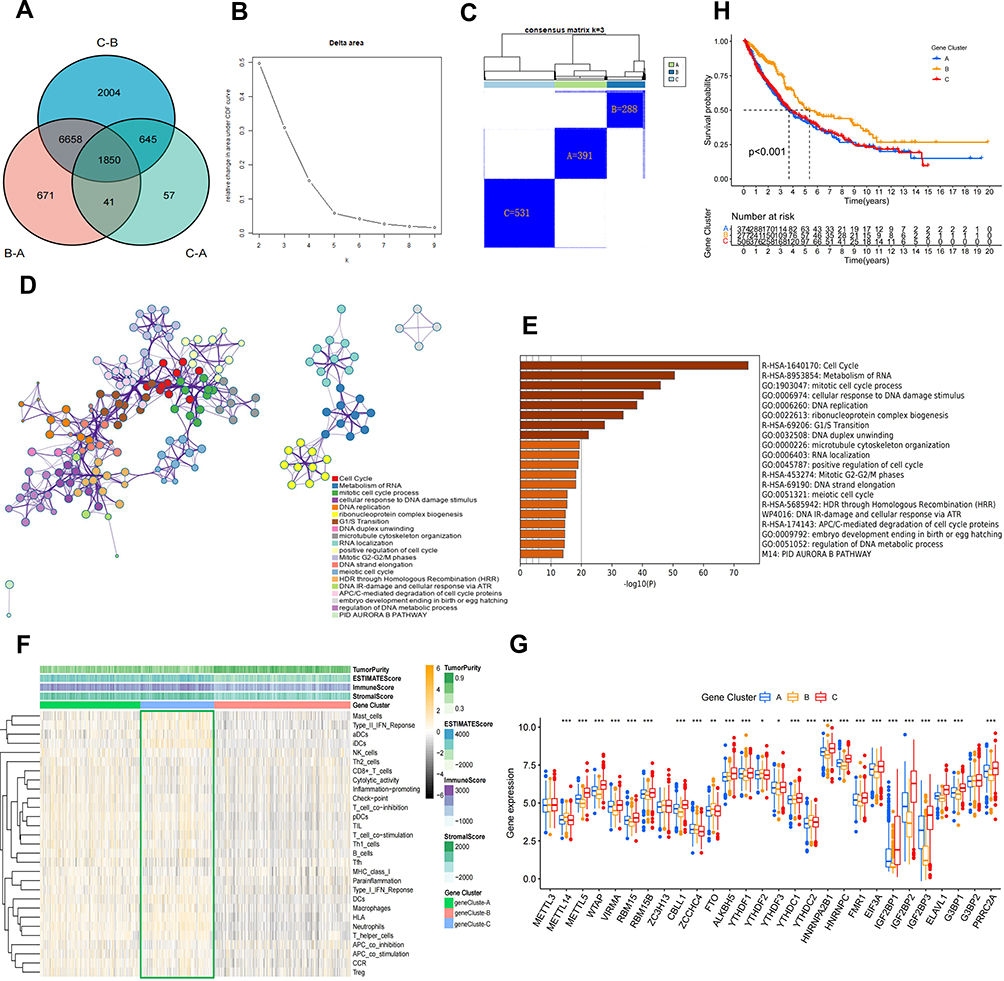 |
Figure 4 Identification of co-DEGs in three m6A modification patterns. (A) Venn diagram showing the co-DEGs in the three m6A modification patterns. (B and C) Results of unsupervised clustering analysis of co-DEGs. (D) Metascape enrichment networks visualize functionally similar clusters and reveal intra- and inter-cluster correlations in co-DEGs. Each color corresponds to a function. (E) The X-axis represents the number of genes enriched, the darker the band the more significant the functional enrichment. (F) Heatmap of three m6A gene signature subgroups enriched in ESTIMATE score, immune cells and function. (G) Expression of 28 regulators in three m6A gene signature subgroups. (H) KM survival differential analysis of three m6A gene signature subgroups (p value<0.05). *p value < 0.05; **p value < 0.01; ***p value < 0.001. |
Construction of the m6A Scoring Program and Assessment of Its Clinical Relevance
Analyses mentioned above provided an overview of the characteristics of the 28 m6A regulators in NSCLC; however, the role of m6A methylation modification patterns in individual patients with NSCLC remains unknown. Therefore, we adopted an m6A scoring scheme based on the co-DEGs of the three m6A modification patterns to quantify m6A modifications in individual NSCLC patients. The framework of constructing the m6A scoring scheme is demonstrated in the alluvial diagram in Figure 5A. The three m6A modification patterns and m6A gene signature subgroups had the highest m6A scores in m6ACluster-B and geneCluster-B, whereas m6ACluster-C and geneCluster-C had the lowest scores (Figure 5B and C). This finding suggested that the high-m6A-score group may be associated with immune activation, whereas the low-m6A-score group may be associated with immunosuppression. Spearman correlation analysis revealed that the m6A score had a significantly positive correlation with T cell activation, immune checkpoint and stromal pathways and a significantly negative correlation with genetic stability and oncogenic pathways (Figure 5D). In addition, a significantly positive correlation was observed between immune cell scores and m6A scores (r = 0.620; P-value < 0.001) (Figure 5E), and the number of immune cells was significantly higher and immune functions were significantly enhanced in the high-score group (cut-off = 15.72) compared with the low-score group (P-value < 0.05) (Figure 5F).
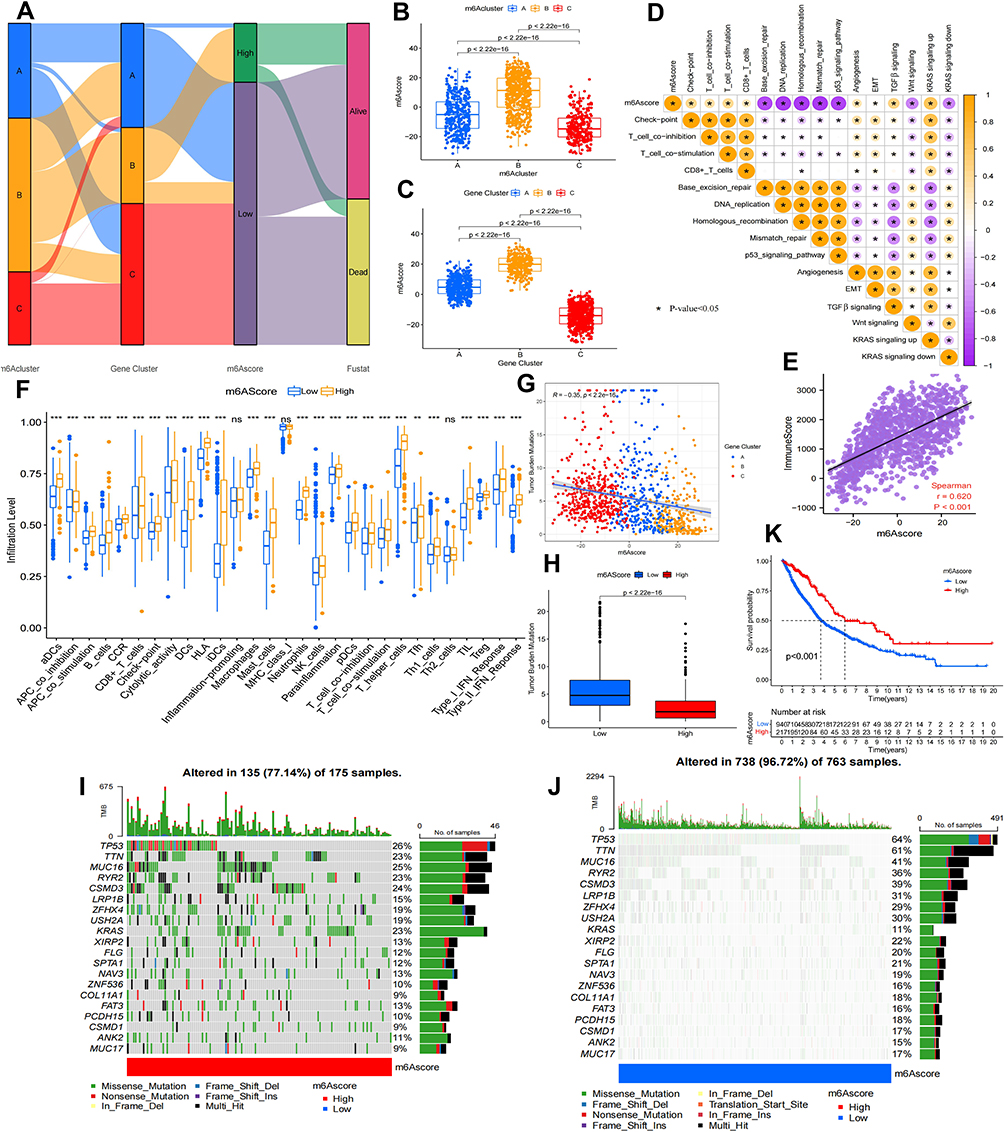 |
Figure 5 Construction of m6A scoring program and analysis of their clinical characteristics. (A) Alluvial diagram displaying the relationship among three m6A modification patterns, three m6A gene signature subgroups, m6A score and survival status. Differences of m6A scores among the three m6A modification patterns (B) and three m6A gene signature subgroups (C) (Kruskal–Wallis test, p value<0.05). (D) Correlation analysis of m6A score with immunity, gene repair, mesenchymal signaling and oncogenic pathways. Orange represents positive correlation, purple represents negative correlation. (E) Spearman correlation analysis between m6A score and immune score (p value<0.05). (F) Differential analysis between two groups with high and low m6A scores in immune cells and immune function. (G) Correlation analysis of TMB and m6A score. (H) Differential analysis of TMB between high and low m6A score groups. Mutation statistics of NSCLC samples in m6A score high (I) and low score groups (J). The upper barplot showed TML, the right bar plot showed the mutation frequency of each gene in separate m6A score groups. (K) Kaplan-Meier curve showing survival differences between high and low m6A score groups (Log rank test, p value< 0.05). *p value < 0.05; **p value < 0.01; ***p value < 0.001. |
Studies have demonstrated an association between somatic mutations in tumour genomes and immunotherapeutic responses, suggesting that tumours with somatic mutations produce new tumour antigens that subsequently stimulate an effective immune response.53,54 Therefore, we evaluated the somatic mutation burden in NSCLC samples, and the results revealed that the m6A score had a significantly negative correlation with TMB (R = −0.35, P < 0.05), and geneCluster-C had the highest TMB, whereas geneCluster-B had the lowest TMB (Figure 5G). This finding implied that the high-TMB group in the three m6A gene signature subgroups was associated with immunosuppression or immune evasion, whereas the low-TMB group was associated with immune activation. Furthermore, TMB was significantly higher in the low-m6A-score group than in the high-m6A-score group (Figure 5H). Subsequently, the analysis of significantly mutated genes (SMG) in the high- and low-m6A-score subgroups revealed that mutations were found in 77.14% of the samples (135/175) in the high- m6A-score subgroups, with the highest mutation frequency observed in TP53 (26%), followed by MUC16 (25%) and CSMD3 (24%) (Figure 5I). In addition, mutations were found in 96.72% of the samples (738/763) in the low-m6A-score subgroups, with the highest mutation frequency observed in TP53 (64%), followed by TTN (61%), CSMD3 (39%) and RYR2 (36%) (Figure 5J).
Eventually, we assessed the significance of m6A scores in terms of prognosis. KM survival analysis revealed that the high-m6A-score group had significantly better survival than that of the low-score group (P-value < 0.001, Figure 5K). To further assess the actual clinical effectiveness, we combined m6A scores with clinical variables for univariate and multivariate Cox analyses. The results of univariate Cox analysis indicated that age (HR = 1.012, P-value < 0.016) and tumour stage (HR = 1.404, P-value < 0.001) were prognosis-related risk factors, and the m6A score (HR = 0.989, P-value < 0.001) was a survival-related favourable factor (Figure 6A). In addition, multivariate Cox analysis revealed that age (HR = 1.014, P-value < 0.006) and tumour stage (HR = 1.406, P-value < 0.001) might serve as independent prognostic risk factors, and the m6A score (HR = 0.991, P-value < 0.002) could be used as an independent prognosis-related favourable factor (Figure 6B). In order to predict the survival rate of patients with NSCLC, we constructed a nomogram survival prediction scheme (Figure 6C). Each clinical factor in the nomogram corresponded to a score, and all scores were added to obtain a total score, which predicted the survival rate of patients at 1, 3 and 5 years. In addition, we plotted calibration curves for the predicted 1-, 3- and 5-year survival rates, and the results revealed that the survival prediction curve of the model coincided with the reference curve, implying that the model exhibited high accuracy in survival prediction (Figure 6D). These results allow us to comprehensively understand the impact of high and low m6A scores on genomic alterations and reveal potentially complex interactions between individual somatic mutations and m6A modifications.
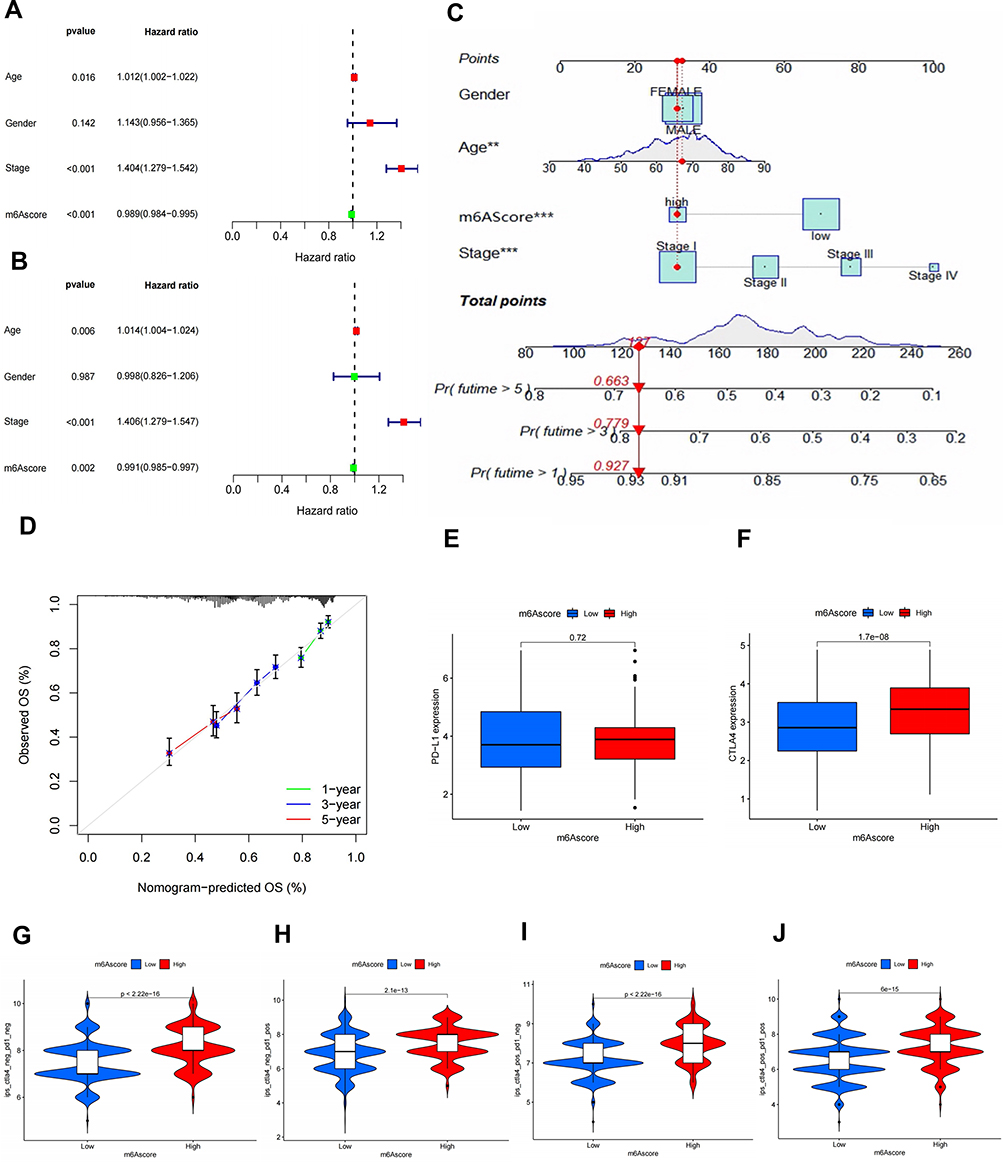 |
Figure 6 Assessment of m6A score survival prediction benefit and effectiveness of immunotherapy. Univariate (A) and multivariate Cox (B) analysis of m6A score in combination with clinical parameters (age, gender and stage). (C) Construction of nomogram scoring system to predict patient survival at 1-, 3- and 5- years. Each clinical factor in the nomogram system corresponds to a score, and all scores are summed to obtain a total point, which can predict the survival rate of patients at 1-, 3- and 5- years. The red point represents the stage of the clinical factor corresponding to the example sample, and the red italicized numbers represent the total score and 1-, 3-, and 5-year survival rates corresponding to this sample. (D) Plotting 1-, 3- and 5-year predicted calibration curves in the nomogram system. Expression levels of PD-L1 (E) and CTLA-4 (F) in m6A high and low score groups (p value<0.05). (G) The difference of IPS between high and low m6A score groups with CTLA4 (-)/PD1 (-). (H) The difference of IPS between high and low m6A score groups with CTLA4 (-)/PD1 (+). (I) The difference of IPS between high and low m6A score groups with CTLA4 (+)/PD1 (-). (J) The difference of IPS between high and low m6A score groups with CTLA4 (+)/PD1 (+). |
Assessment of m6A Scoring for Immunotherapeutic Efficacy in NSCLC
PD-L1, a landmark discovery in tumour immunotherapy, is one of the most established markers for assessing immunotherapeutic efficacy, and CTLA-4/PD-1 inhibitors are currently the representative ICIs.50,51 In addition, the newly identified predictor IPS is widely used and strongly recommended for the assessment of immune response. IPS is a favourable factor to predict the efficacy of anti-CTLA-4 and anti-PD-1 regimens, which can quantify the determinants of tumour immunogenicity and reveal the characteristics of the tumour immune landscape.55 We found that the expression of PD-L1 (P-value = 0.72) (Figure 6E) and CTLA-4 (P-value < 0.05) (Figure 6F) was higher in the high-m6A-score group than in the low-m6A-score group. In addition, IPS was higher in the high-m6A-score group for individual anti-PD-1/CTLA-4 therapy and combination therapy in the Cancer Immunome Atlas website (TCIA) (https://tcia.at/home) (Figure 6G–J). Therefore, these results consistently demonstrate that immunotherapeutic efficacy is better in the high-m6A-score group than in the low-m6A-score group.
Discussion
m6A methylation is the most prevalent form of mRNA modification and plays a critical role in the regulation of gene expression at the post-transcriptional level.7,56 Several studies have reported on the involvement of m6A methylation modifications in various biological functions, including cell cycle, inflammation, oncology and immunity.57,58 Moreover, abnormal m6A gene alterations leading to different characteristics of TME play an important role in tumour progression. Although epigenetic regulation of each m6A regulator in the TME of NSCLC has been progressively described,37,39 studies on the overall TME of NSCLC mediated by intact m6A regulators have not been reported. Therefore, the present study provides an overview of the interaction between m6A RNA methylation and the TME of NSCLC in terms of m6A modification and guides more precise clinical therapeutic strategies.
TME plays an important role in immunotherapeutic efficacy.59 Hegde et al classified three immune phenotypes according to the different characteristics of TIME, namely “immune infiltrative”, “immune rejection” and “immune desert”.31 Immunoinflammatory tumours are characterised by the presence of tumour-infiltrating lymphocytes, high density of IFNγ-producing CD8+ T cells, tumour cells expressing PD-L1, possible genomic instability and the presence of a pre-existing anti-tumour immune response. In TME, tumour cells express PD-L1 and are sensitive to ICIs.31,60 This phenotype is consistent with the pattern of m6A Cluster-B modification in the present study. Immune rejection of tumours is characterised by high expression of EMT/TGF-β signalling and T cell suppression.61 TGFβ1 can induce extracellular mesenchymal gene expression, resulting in a reactive stroma and dense extracellular mesenchyme forming a barrier that prevents infiltration of immune cells within the tumour, leading to a repulsed infiltrative phenotype with peritumoral or mesenchymal T-cell localisation.62 PD-L1 is highly expressed in mesenchymal pro-fibroblastic tumours; however, immune-exclusion tumours tend to respond poorly to ICIs.31 The m6ACluster-A modification pattern in this study is consistent with this phenotype. The immune desert phenotype is characterised by a lack of immune infiltration of tumour cells and involvement of the WNT/β-catenin signalling pathway.31,63 In addition, this phenotype responds poorly to single-agent ICIs and is consistent with the m6ACluster-C modification pattern in this study. Therefore, scholars have proposed TME as a therapeutic target.64 The three immunophenotypes of TME provide a clear understanding of the state of TIME in NSCLC, allowing for the development of appropriate treatment protocols to help guide and improve the effectiveness of immunotherapy in NSCLC.
In this study, co-DEGs in the three m6A modification patterns were significantly enriched in RNA metabolism and modification, which is consistent with the enrichment of functions of m6A regulators. In addition, clustering analysis of the co-DEGs of the three m6A gene signature subgroups and clustering analysis of the 28 m6A regulators of the three m6A modification patterns revealed highly similar results in terms of sample expression and prognosis, suggesting that these co-DEGs can be considered m6A modification gene signatures. To further explore the m6A modification characteristics of patients with NSCLC to more precisely guide patient treatment strategies, we established an m6A scoring scheme using these co-DEGs. The m6A scores in the three m6A modification patterns and three m6A gene signature subgroups exhibited consistency, which further confirmed our previous hypothesis. Interestingly, we found that m6A scores were significantly negatively correlated with TMB and positively correlated with immune infiltration. Furthermore, m6A scores exhibited a significantly negative correlation with DNA repair, chromosomal homologous recombination and the P53 signalling pathway. Among various types of mutations, nonsynonymous mutations alter the amino acid coding sequence, resulting in the expression of abnormal proteins by tumour cells. These abnormal proteins, if degraded to short peptides (antigenic epitopes) in tumour cells or APCs, bind with high affinity to MHC class I or II molecules and are presented as complexes on the cell surface, where they are recognised as “non-self” by T cells, causing T cell activation and the consequent tumour T cells are then attacked and cleared by effector T cells. This abnormal protein that causes T cell activation is called a “neoantigen”.65,66 Therefore, theoretically, the higher the TMB, the higher the production of neoantigens, which will eventually be recognised by T cells, and the greater the immunocidal activity at the tumour site.66,67 However, this study demonstrated the opposite phenomenon, with a significantly lower level of T cell infiltration in the low-m6A-score group than in the high-m6A-score group. Studies have reported that a 10/1-megabase (Mb) mutation usually corresponds to 150 nonsynonymous mutations in the coding region of the tumour genome.68 Only 10% of these non-synonymous mutations produce mutant peptides that bind with high affinity to the MHC.32 Of these, 1% are recognised by the T cells of patients,69 which indicated that 150 nonsynonymous mutations may eventually produce only 1–2 neoantigens. In addition, some neoantigens have an immune advantage and may be ignored by the immune system.68 Martin et al reported that there are more than 100 mutations in tumour suppressor genes, with p53 being one of them, which cause cancer by evading surveillance of the immune system.70 In addition, Figure 5G reveals that the high-TMB group was mainly enriched in the geneCluster-C signature genes, which is similar to the analysis of m6ACluster-C and represents a decrease in immune infiltration, whereas the low-TMB group was mainly enriched in the geneCluster-B signature genes, which is similar to the analysis of m6ACluster-A and represents an increase in immune infiltration. Overall, these findings concur well with the hypothesis proposed in this study.
Finally, we assessed the association between prognosis and m6A scores in NSCLC. KM survival analysis revealed significantly better survival in the high-m6A-score group than in the low-m6A-score group, whereas multivariate Cox analysis confirmed that the m6A score can be used as a favourable prognostic factor for patients with NSCLC independently of clinical factors (age, gender and stage). Furthermore, to assess the practical clinical application and guide clinical precision treatment, we incorporated the m6A score and clinical factors into a nomogram to predict patient survival at 1, 3 and 5 years. Currently, Nomogram is widely used as prognostic models in oncology and medicine. With the ability to generate an individual probability of a clinical event by integrating diverse prognostic and determinant variables, nomograms meet the desire for biologically and clinically integrated models and fulfil the drive towards personalised medicine.49,71 In addition, the calibration curves had a good overlap with the 1-, 3- and 5-year prediction curves, implying high accuracy of the nomogram for predicting survival. PD-L1 is one of the well-established markers for predicting the efficacy of clinical immunotherapy and has shown remarkable results, particularly in lung cancer.72 We further assessed the effect of immunotherapy between the high- and low-m6A-score groups, and consistent with previous analyses, the expression of PD-L1/CTLA-4 was higher in the high-m6A-score group than in the low-m6A-score group, implying that the high-m6A-score group had better therapeutic efficacy. In addition, IPS prediction presented consistent results, with the immunotherapeutic efficacy being better in the high-m6A-score group than in the low-m6A-score group, regardless of the presence or absence of PD-1/CTLA-4 expression.
In this study, we comprehensively assessed m6A modification patterns based on 28 m6A regulators in 1210 NSCLC samples and systematically correlated these modification patterns with the characteristics of TME cell infiltration. The results of comprehensive analyses suggest that dysregulation of RNA methylation is an important basis for understanding tumour progression and immune regulation in NSCLC. Therefore, systematic analysis of m6A methylation modification patterns in patients with NSCLC can help to guide precise clinical therapy and improve patient survival outcomes.
Abbreviations
m6A, N6-methyladenosine; TME, tumour microenvironment; NSCLC, non-small cell lung cancer; co-DEGs, commonly differentially expressed genes; TIME, tumour immune microenvironment; PCA, principal component analysis; TMB, tumour mutational burden; ICI, immune checkpoint inhibitors; IPS, immunophenoscore; mRNA, messenger RNA; lncRNA, long non-coding RNA; miRNA, microRNA; m1A, N1-methyladenosine; m7A, N7-methyladenosine; m5A, 5-methylcytosine; CT, computed tomography; CTLA-4, cytotoxic T lymphocyte-associated antigen-4; PD-1, programmed death receptor-1; PD-L1, programmed death receptor-1 ligand; TCGA, The Cancer Genome Atlas; GEO, Gene Expression Omnibus; FPKM, fragments per kilobase of transcript per million mapped reads; TPM, transcripts per kilobase million; CNV, copy number variation; TMB, tumour mutational burden; KM, Kaplan–Meier; GSVA, gene set variation analysis; ESTIMATE, estimation of stromal and immune cells in malignant tumour tissues using expression data; ssGSEA, single-sample gene set enrichment analysis; DEGs, differentially expressed genes; GO, gene ontology; FDR, false discovery rate; EMT, epithelial–mesenchymal transition; TGF-β, transforming growth factor beta; Mb, megabase; TCIA, The Cancer Immunome Atlas.
Data Sharing Statement
This study analysed clinical data obtained from publicly available online datasets. TCGA: https://portal.gdc.cancer.gov/; GEO: https://www.ncbi.nlm.nih.gov/geo/; UCSC Xena: https://xena.ucsc.edu/; STRING: https://cn.string-db.org/; MSigDB: http://www.gseamsigdb.org/gsea/login.jsp; Metascape: http://metascape.org/gp/index.html; TCIA: https://tcia.at/home.
Ethical Statement
This study was reviewed and approved by the Research Ethics Committee of The Affiliated Changzhou No. 2 People’s Hospital of Nanjing Medical University. Informed consent was obtained and made publicly available for all patients at the time of inclusion in the public database. All specimens were processed and anonymized according to ethical and legal standards. TCGA, GEO, UCSC Xena, STRING, MSigDB and TCIA are public databases that were used for data collection. The patients involved in the databases have provided ethical approval. Users can download relevant data and publish relevant articles for free for the purpose of research. Therefore, there are no ethical issues and other conflicts of interest in this study because it is based on open-resource data.
Acknowledgments
We appreciate the platforms and datasets from TCGA, GEO, UCSC Xena, STRING, MSigDB and TCIA.
Author Contributions
All authors made a significant contribution to the work reported, whether that is in the conception, study design, execution, acquisition of data, analysis and interpretation, or in all these areas; took part in drafting, revising or critically reviewing the article; gave final approval of the version to be published; have agreed on the journal to which the article has been submitted; and agree to be accountable for all aspects of the work.
Funding
This study was supported by the following funds: “333 Project” of Jiangsu Province (Grant number: BRA2020157). 333 High-Level Talent Training Project (Grant number: 2022-2). “Six One Project,” Research Projects of High-level Medical Personnel of Jiangsu Province (Grant number: LGY2019025). High-level Talent Selection and Training Project of the 16th Batch of “Six Talent Peak” in Jiangsu Province (Grant number: WSN-245). Medical Scientific Research Foundation of Jiangsu Commission of Health (Grant number: H2018083). Jiangsu Provincial Medical Youth Talent (Jiangsu Health Scientific Education 2017 no.3). High-Level Medical Talents Training Project (Grant number: 2016CZBJ042).
Disclosure
The authors declare that the research was conducted in the absence of any commercial or financial relationships that could be construed as a potential conflict of interest.
References
1. Barbieri I, Kouzarides T. Role of RNA modifications in cancer. Nat Rev Cancer. 2020;20(6):303–322. doi:10.1038/s41568-020-0253-2
2. Boccaletto P, Machnicka MA, Purta E, et al. MODOMICS: a database of RNA modification pathways. 2017 update. Nucleic Acids Res. 2018;46(D1):D303–d307. doi:10.1093/nar/gkx1030
3. Zhao LY, Song J, Liu Y, Song CX, Yi C. Mapping the epigenetic modifications of DNA and RNA. Protein Cell. 2020;11(11):792–808. doi:10.1007/s13238-020-00733-7
4. Zheng HX, Zhang XS, Sui N. Advances in the profiling of N(6)-methyladenosine (m(6)A) modifications. Biotechnol Adv. 2020;45:107656. doi:10.1016/j.biotechadv.2020.107656
5. Desrosiers R, Friderici K, Rottman F. Identification of methylated nucleosides in messenger RNA from Novikoff hepatoma cells. Proc Natl Acad Sci U S A. 1974;71(10):3971–3975. doi:10.1073/pnas.71.10.3971
6. Alarcón CR, Lee H, Goodarzi H, Halberg N, Tavazoie SF. N6-methyladenosine marks primary microRNAs for processing. Nature. 2015;519(7544):482–485. doi:10.1038/nature14281
7. Zhao BS, Roundtree IA, He C. Post-transcriptional gene regulation by mRNA modifications. Nat Rev Mol Cell Biol. 2017;18(1):31–42. doi:10.1038/nrm.2016.132
8. Zhou J, Wan J, Gao X, Zhang X, Jaffrey SR, Qian SB. Dynamic m(6)A mRNA methylation directs translational control of heat shock response. Nature. 2015;526(7574):591–594. doi:10.1038/nature15377
9. Elkon R, Ugalde AP, Agami R. Alternative cleavage and polyadenylation: extent, regulation and function. Nat Rev Genet. 2013;14(7):496–506. doi:10.1038/nrg3482
10. Tian B, Manley JL. Alternative polyadenylation of mRNA precursors. Nat Rev Mol Cell Biol. 2017;18(1):18–30. doi:10.1038/nrm.2016.116
11. Yang Y, Hsu PJ, Chen YS, Yang YG. Dynamic transcriptomic m(6)A decoration: writers, erasers, readers and functions in RNA metabolism. Cell Res. 2018;28(6):616–624. doi:10.1038/s41422-018-0040-8
12. Zaccara S, Ries RJ, Jaffrey SR. Reading, writing and erasing mRNA methylation. Nat Rev Mol Cell Biol. 2019;20(10):608–624. doi:10.1038/s41580-019-0168-5
13. Shi H, Wei J, He C. Where, when, and how: context-dependent functions of RNA methylation writers, readers, and erasers. Mol Cell. 2019;74(4):640–650. doi:10.1016/j.molcel.2019.04.025
14. Huang H, Weng H, Chen J. m(6)A modification in coding and non-coding RNAs: roles and therapeutic implications in cancer. Cancer Cell. 2020;37(3):270–288. doi:10.1016/j.ccell.2020.02.004
15. Yi YC, Chen XY, Zhang J, Zhu JS. Novel insights into the interplay between m(6)A modification and noncoding RNAs in cancer. Mol Cancer. 2020;19(1):121. doi:10.1186/s12943-020-01233-2
16. Su R, Dong L, Li Y, et al. Targeting FTO suppresses cancer stem cell maintenance and immune evasion. Cancer Cell. 2020;38(1):79–96.e11. doi:10.1016/j.ccell.2020.04.017
17. Zhang B, Wu Q, Li B, Wang D, Wang L, Zhou YL. m(6)A regulator-mediated methylation modification patterns and tumour microenvironment infiltration characterization in gastric cancer. Mol Cancer. 2020;19(1):53. doi:10.1186/s12943-020-01170-0
18. Han D, Liu J, Chen C, et al. Anti-tumour immunity controlled through mRNA m(6)A methylation and YTHDF1 in dendritic cells. Nature. 2019;566(7743):270–274. doi:10.1038/s41586-019-0916-x
19. Wu S, Zhang S, Wu X, Zhou X. m(6)A RNA methylation in cardiovascular diseases. Mol Ther. 2020;28(10):2111–2119. doi:10.1016/j.ymthe.2020.08.010
20. Mathiyalagan P, Adamiak M, Mayourian J, et al. FTO-dependent N(6)-methyladenosine regulates cardiac function during remodeling and repair. Circulation. 2019;139(4):518–532. doi:10.1161/CIRCULATIONAHA.118.033794
21. Bray F, Ferlay J, Soerjomataram I, Siegel RL, Torre LA, Jemal A. Global cancer statistics 2018: GLOBOCAN estimates of incidence and mortality worldwide for 36 cancers in 185 countries. CA Cancer J Clin. 2018;68(6):394–424. doi:10.3322/caac.21492
22. Molina JR, Yang P, Cassivi SD, Schild SE, Adjei AA. Non-small cell lung cancer: epidemiology, risk factors, treatment, and survivorship. Mayo Clin Proc. 2008;83(5):584–594. doi:10.1016/S0025-6196(11)60735-0
23. Aberle DR, Adams AM, Berg CD, et al. Reduced lung-cancer mortality with low-dose computed tomographic screening. N Engl J Med. 2011;365(5):395–409.
24. Doroshow DB, Sanmamed MF, Hastings K, et al. Immunotherapy in non-small cell lung cancer: facts and hopes. Clin Cancer Res. 2019;25(15):4592–4602. doi:10.1158/1078-0432.CCR-18-1538
25. Herbst RS, Morgensztern D, Boshoff C. The biology and management of non-small cell lung cancer. Nature. 2018;553(7689):446–454. doi:10.1038/nature25183
26. Arbour KC, Riely GJ. Systemic therapy for locally advanced and metastatic non-small cell lung cancer: a review. JAMA. 2019;322(8):764–774. doi:10.1001/jama.2019.11058
27. Lei X, Lei Y, Li JK, et al. Immune cells within the tumour microenvironment: biological functions and roles in cancer immunotherapy. Cancer Lett. 2020;470:126–133. doi:10.1016/j.canlet.2019.11.009
28. Osipov A, Saung MT, Zheng L, Murphy AG. Small molecule immunomodulation: the tumour microenvironment and overcoming immune escape. J Immunother Cancer. 2019;7(1):224. doi:10.1186/s40425-019-0667-0
29. O’Donnell JS, Teng MWL, Smyth MJ. Cancer immunoediting and resistance to T cell-based immunotherapy. Nat Rev Clin Oncol. 2019;16(3):151–167. doi:10.1038/s41571-018-0142-8
30. Camus M, Tosolini M, Mlecnik B, et al. Coordination of intratumoural immune reaction and human colorectal cancer recurrence. Cancer Res. 2009;69(6):2685–2693. doi:10.1158/0008-5472.CAN-08-2654
31. Hegde PS, Karanikas V, Evers S. The where, the when, and the how of immune monitoring for cancer immunotherapies in the era of checkpoint inhibition. Clin Cancer Res. 2016;22(8):1865–1874. doi:10.1158/1078-0432.CCR-15-1507
32. Chen DS, Mellman I. Elements of cancer immunity and the cancer-immune set point. Nature. 2017;541(7637):321–330. doi:10.1038/nature21349
33. Zhang Z, Zhang C, Luo Y, et al. RNA N(6) -methyladenosine modification in the lethal teamwork of cancer stem cells and the tumour immune microenvironment: current landscape and therapeutic potential. Clin Transl Med. 2021;11(9):e525. doi:10.1186/s12967-021-03188-4
34. Gu Y, Wu X, Zhang J, et al. The evolving landscape of N(6)-methyladenosine modification in the tumour microenvironment. Mol Ther. 2021;29(5):1703–1715. doi:10.1016/j.ymthe.2021.04.009
35. Li N, Kang Y, Wang L, et al. ALKBH5 regulates anti-PD-1 therapy response by modulating lactate and suppressive immune cell accumulation in tumour microenvironment. Proc Natl Acad Sci U S A. 2020;117(33):20159–20170. doi:10.1073/pnas.1918986117
36. Liu Y, Liang G, Xu H, et al. Tumours exploit FTO-mediated regulation of glycolytic metabolism to evade immune surveillance. Cell Metab. 2021;33(6):1221–1233.e1211. doi:10.1016/j.cmet.2021.04.001
37. Li B, Zhu L, Lu C, et al. circNDUFB2 inhibits non-small cell lung cancer progression via destabilizing IGF2BPs and activating anti-tumour immunity. Nat Commun. 2021;12(1):295. doi:10.1038/s41467-020-20527-z
38. Tsuchiya K, Yoshimura K, Inoue Y, et al. YTHDF1 and YTHDF2 are associated with better patient survival and an inflamed tumour-immune microenvironment in non-small-cell lung cancer. Oncoimmunology. 2021;10(1):1962656. doi:10.1080/2162402X.2021.1962656
39. Li Y, Gu J, Xu F, et al. Molecular characterization, biological function, tumour microenvironment association and clinical significance of m6A regulators in lung adenocarcinoma. Brief Bioinform. 2021;22(4):bbaa225.
40. Boutros PC, Okey AB. Unsupervised pattern recognition: an introduction to the whys and wherefores of clustering microarray data. Brief Bioinform. 2005;6(4):331–343. doi:10.1093/bib/6.4.331
41. Miller DJ, Wang Y, Kesidis G. Emergent unsupervised clustering paradigms with potential application to bioinformatics. Front Biosci. 2008;13:677–690. doi:10.2741/2711
42. Hänzelmann S, Castelo R, Guinney J. GSVA: gene set variation analysis for microarray and RNA-seq data. BMC Bioinform. 2013;14:7. doi:10.1186/1471-2105-14-7
43. Quail DF, Joyce JA. Microenvironmental regulation of tumour progression and metastasis. Nat Med. 2013;19(11):1423–1437. doi:10.1038/nm.3394
44. Zhou Y, Zhou B, Pache L, et al. Metascape provides a biologist-oriented resource for the analysis of systems-level datasets. Nat Commun. 2019;10(1):1523. doi:10.1038/s41467-019-09234-6
45. Ringnér M. What is principal component analysis? Nat Biotechnol. 2008;26(3):303–304. doi:10.1038/nbt0308-303
46. Sotiriou C, Wirapati P, Loi S, et al. Gene expression profiling in breast cancer: understanding the molecular basis of histologic grade to improve prognosis. J Natl Cancer Inst. 2006;98(4):262–272. doi:10.1093/jnci/djj052
47. Chong W, Shang L, Liu J, et al. m(6)A regulator-based methylation modification patterns characterized by distinct tumour microenvironment immune profiles in colon cancer. Theranostics. 2021;11(5):2201–2217. doi:10.7150/thno.52717
48. Zeng D, Li M, Zhou R, et al. Tumour microenvironment characterization in gastric cancer identifies prognostic and immunotherapeutically relevant gene signatures. Cancer Immunol Res. 2019;7(5):737–750. doi:10.1158/2326-6066.CIR-18-0436
49. Iasonos A, Schrag D, Raj GV, Panageas KS. How to build and interpret a nomogram for cancer prognosis. J Clin Oncol. 2008;26(8):1364–1370. doi:10.1200/JCO.2007.12.9791
50. Sun C, Mezzadra R, Schumacher TN. Regulation and function of the PD-L1 checkpoint. Immunity. 2018;48(3):434–452. doi:10.1016/j.immuni.2018.03.014
51. Chen H, Yang M, Wang Q, Song F, Li X, Chen K. The new identified biomarkers determine sensitivity to immune check-point blockade therapies in melanoma. Oncoimmunology. 2019;8(8):1608132. doi:10.1080/2162402X.2019.1608132
52. Rosales RA, Drummond RD, Valieris R, Dias-Neto E, da Silva IT. signeR: an empirical Bayesian approach to mutational signature discovery. Bioinformatics. 2017;33(1):8–16. doi:10.1093/bioinformatics/btw572
53. Srivastava PK. Neoepitopes of cancers: looking back, looking ahead. Cancer Immunol Res. 2015;3(9):969–977. doi:10.1158/2326-6066.CIR-15-0134
54. Prehn RT, Main JM. Immunity to methylcholanthrene-induced sarcomas. J Natl Cancer Inst. 1957;18(6):769–778.
55. Charoentong P, Finotello F, Angelova M, et al. Pan-cancer immunogenomic analyses reveal genotype-immunophenotype relationships and predictors of response to checkpoint blockade. Cell Rep. 2017;18(1):248–262. doi:10.1016/j.celrep.2016.12.019
56. He C. Grand challenge commentary: RNA epigenetics? Nat Chem Biol. 2010;6(12):863–865. doi:10.1038/nchembio.482
57. He L, Li H, Wu A, Peng Y, Shu G, Yin G. Functions of N6-methyladenosine and its role in cancer. Mol Cancer. 2019;18(1):176. doi:10.1186/s12943-019-1109-9
58. Chen XY, Zhang J, Zhu JS. The role of m(6)A RNA methylation in human cancer. Mol Cancer. 2019;18(1):103. doi:10.1186/s12943-019-1033-z
59. Gasser S, Lim LHK, Cheung FSG. The role of the tumour microenvironment in immunotherapy. Endocr Relat Cancer. 2017;24(12):T283–t295. doi:10.1530/ERC-17-0146
60. Gajewski TF. The next hurdle in cancer immunotherapy: overcoming the non-T-cell-inflamed tumour microenvironment. Semin Oncol. 2015;42(4):663–671. doi:10.1053/j.seminoncol.2015.05.011
61. Vinay DS, Ryan EP, Pawelec G, et al. Immune evasion in cancer: mechanistic basis and therapeutic strategies. Semin Cancer Biol. 2015;35(Suppl):S185–s198. doi:10.1016/j.semcancer.2015.03.004
62. Tauriello DVF, Palomo-Ponce S, Stork D, et al. TGFβ drives immune evasion in genetically reconstituted colon cancer metastasis. Nature. 2018;554(7693):538–543. doi:10.1038/nature25492
63. Kim JM, Chen DS. Immune escape to PD-L1/PD-1 blockade: seven steps to success (or failure). Ann Oncol. 2016;27(8):1492–1504. doi:10.1093/annonc/mdw217
64. Pitt JM, Marabelle A, Eggermont A, Soria JC, Kroemer G, Zitvogel L. Targeting the tumour microenvironment: removing obstruction to anticancer immune responses and immunotherapy. Ann Oncol. 2016;27(8):1482–1492. doi:10.1093/annonc/mdw168
65. Yarchoan M, Johnson BA, Lutz ER, Laheru DA, Jaffee EM. Targeting neoantigens to augment antitumour immunity. Nat Rev Cancer. 2017;17(4):209–222.
66. Ballhausen A, Przybilla MJ, Jendrusch M, et al. The shared frameshift mutation landscape of microsatellite-unstable cancers suggests immunoediting during tumour evolution. Nat Commun. 2020;11(1):4740. doi:10.1038/s41467-020-18514-5
67. Rooney MS, Shukla SA, Wu CJ, Getz G, Hacohen N. Molecular and genetic properties of tumours associated with local immune cytolytic activity. Cell. 2015;160(1–2):48–61. doi:10.1016/j.cell.2014.12.033
68. Schumacher TN, Schreiber RD. Neoantigens in cancer immunotherapy. Science. 2015;348(6230):69–74. doi:10.1126/science.aaa4971
69. Navarro-González JF, Mora-Fernández C, Muros de Fuentes M, García-Pérez J. Inflammatory molecules and pathways in the pathogenesis of diabetic nephropathy. Nat Rev Nephrol. 2011;7(6):327–340. doi:10.1038/nrneph.2011.51
70. Martin TD, Patel RS, Cook DR, et al. The adaptive immune system is a major driver of selection for tumour suppressor gene inactivation. Science. 2021;373(6561):1327–1335. doi:10.1126/science.abg5784
71. Balachandran VP, Gonen M, Smith JJ, DeMatteo RP. Nomograms in oncology: more than meets the eye. Lancet Oncol. 2015;16(4):e173–e180. doi:10.1016/S1470-2045(14)71116-7
72. Yi M, Jiao D, Xu H, et al. Biomarkers for predicting efficacy of PD-1/PD-L1 inhibitors. Mol Cancer. 2018;17(1):129. doi:10.1186/s12943-018-0864-3
 © 2022 The Author(s). This work is published and licensed by Dove Medical Press Limited. The
full terms of this license are available at https://www.dovepress.com/terms
and incorporate the Creative Commons Attribution
- Non Commercial (unported, 3.0) License.
By accessing the work you hereby accept the Terms. Non-commercial uses of the work are permitted
without any further permission from Dove Medical Press Limited, provided the work is properly
attributed. For permission for commercial use of this work, please see paragraphs 4.2 and 5 of our Terms.
© 2022 The Author(s). This work is published and licensed by Dove Medical Press Limited. The
full terms of this license are available at https://www.dovepress.com/terms
and incorporate the Creative Commons Attribution
- Non Commercial (unported, 3.0) License.
By accessing the work you hereby accept the Terms. Non-commercial uses of the work are permitted
without any further permission from Dove Medical Press Limited, provided the work is properly
attributed. For permission for commercial use of this work, please see paragraphs 4.2 and 5 of our Terms.