Back to Journals » International Journal of Nanomedicine » Volume 17
M1 Macrophage-Derived Sonoresponsive Nanoparticles for Sonodynamic Anticancer Therapy
Authors Chen S, Wang J, Liao H, Tang K, Xu Y, Wang L ![]() , Niu C
, Niu C ![]()
Received 7 July 2022
Accepted for publication 3 October 2022
Published 10 October 2022 Volume 2022:17 Pages 4725—4741
DOI https://doi.org/10.2147/IJN.S381170
Checked for plagiarism Yes
Review by Single anonymous peer review
Peer reviewer comments 2
Editor who approved publication: Prof. Dr. Anderson Oliveira Lobo
Sijie Chen,1,2 Jiahao Wang,3– 6 Haiqin Liao,1,2 Kui Tang,1,2 Yan Xu,1,2 Long Wang,3– 6 Chengcheng Niu1,2
1Department of Ultrasound Diagnosis, The Second Xiangya Hospital, Central South University, Changsha, 410011, People’s Republic of China; 2Research Center of Ultrasonography, The Second Xiangya Hospital, Central South University, Changsha, 410011, People’s Republic of China; 3Department of Orthopedics, Xiangya Hospital, Central South University, Changsha, 410008, People’s Republic of China; 4Hunan Engineering Research Center of Biomedical Metal and Ceramic Implants, Xiangya Hospital, Central South University, Changsha, People’s Republic of China; 5National Clinical Research Center for Geriatric Disorders, Xiangya Hospital, Central South University, Changsha, People’s Republic of China; 6Hunan Key Laboratary of Aging Biology, Xiangya Hospital, Central South University, Changsha, People’s Republic of China
Correspondence: Chengcheng Niu, Department of Ultrasound Diagnosis and Research Center of Ultrasonography, the Second Xiangya Hospital, Central South University, Changsha, People’s Republic of China, 410011, Email [email protected]
Background: Many nanocarriers currently developed have potential in tumor targeting, but there are still several limitations to their applications in clinical treatment. It is crucial to explore novel nanocarriers with higher biocompatibility and targeting efficiency to overcome the barriers of the tumor microenvironment to penetrate deeply into the tumor.
Methods: In this work, we designed multilayer sonoresponsive M1/IR780@PLGA nanoparticles, which can actively target tumor tissues, and repolarize M2 macrophages in the tumor microenvironment into M1 macrophages to stimulate antitumor immune effects. When the nanoparticles reach the tumor site, ultrasound (US) irradiation is applied to the tumor site, and the sonosensitizer consumes oxygen and generates ROS, thereby triggering local tumor cell death.
Results: The M1/IR780@PLGA nanoparticle-based antitumor sonodynamic therapy (SDT) significantly inhibited tumor growth, triggered a great number of M2 tumor-associated macrophages to convert into M1 macrophages in the tumor microenvironment and promoted dendritic cell maturation to activate the antitumor immune response.
Conclusion: M1/IR780@PLGA nanoparticles potentiate antitumoral efficacy through SDT and antitumor immune responses by activating dendritic cells maturation and M1 macrophage repolarization in the tumor microenvironment.
Keywords: M1 macrophage, sonodynamic therapy, antitumor therapy, reactive oxygen species, tumor microenvironment
Introduction
In view of the high morbidity and fatality rate of cancer, people are constantly looking for more ideal treatments to overcome it, such as immunotherapy, photodynamic therapy (PDT), and SDT, and certain achievements have been made.1–6 With the development of nanotechnology and nanomedicine, cancer nanomedicine is considered one of the few strategies that could revolutionize cancer treatment.7–9
Although many nanocarriers currently developed have potential in tumor targeting, there are still many limitations to their applications in clinical treatment. First, most nanocarriers have low biocompatibility and are easily cleared by the immune system quickly, resulting in limited antitumor effects due to the low absorption rate of tumor cells.10,11 Second, the high intratumor interstitial hydraulic pressure may become another obstacle to the successful penetration and accumulation of nanocarriers in solid tumors. Interstitial fluid pressure is much higher in the central region of solid tumors due to excessive vascular leakage and defective lymphatic circulation.12 Third, toxicity is one of the main problems of nanocarriers as tumor-targeted therapies. For unmodified naked nanocarriers, the drugs and other molecules loaded in them are prone to leak prematurely before reaching the target, resulting in unnecessary toxic side effects. Therefore, it is crucial to explore novel nanocarriers with higher biocompatibility and targeting efficiency to overcome the barriers of the tumor microenvironment to penetrate deep into the tumor.
Exosomes are extracellular vesicles encapsulated by nanoscale lipid bilayers secreted by various types of cells, with low immunogenicity, low toxicity and high biocompatibility, which can transport proteins, lipids and nucleic acids between cells, have a natural affinity for target cells and are considered to be good nanocarriers.13 Multiple protein families on the surface of exosomes determine the targeting specificity of exosomes.14 Compared with liposomes of the same size, the ability of exosomes to target tumor cells is significantly enhanced (greater than 10-fold), which is likely due to the specific ligand-receptor interaction in the receptor cells and the superior endocytosis of exosomes compared to that of liposomes.15 However, due to the low production of exosomes released by cells and the complicated exosome engineering required for differentiation and purification, some investigators have suggested the use of nanovesicles as a replacement for exosomes. Nanovesicles are prepared by continuous extrusion of cells; they have a similar cell membrane and size to exosomes but are generated at higher yields and are richer in protein and RNA.16,17 Tumor-associated macrophages in the tumor microenvironment have been found to play an important role in determining tumor nanoparticle uptake and intratumoral distribution.18 Different subsets of tumor-associated macrophages may play different roles in tumor development. The majority of newly recruited monocytes are induced by intratumoral cytokines to differentiate from proinflammatory and tumor-suppressive M1-type cells to anti-inflammatory M2-type cells. M2 macrophages release multiple anti-inflammatory cytokines (IL-4, IL-10, and IL-13) that promote tumor growth and aggravate disease progression by inhibiting the activity of cytotoxic T cells.19 Some scholars have found that M1-type macrophage-derived nanovesicles can target tumor tissues and repolarize M2-type tumor-associated macrophages into M1-type macrophages, which then secrete proinflammatory factors and stimulate antitumor immune effects.20 Therefore, as nanocarriers, M1 macrophage-derived nanovesicles can effectively target the tumor microenvironment, induce the repolarization of M2 macrophages into M1 macrophages, and activate the immune system to generate an antitumor immune response, thereby activating antitumor immune responses to inhibit tumor growth.
SDT is an emerging tumor treatment strategy that was developed on the basis of PDT and has superior tissue penetration to make its application range wider than that of PDT.21,22 It uses US irradiation to trigger the reaction between sonosensitizers in tumors and oxygen to generate reactive oxygen species (ROS), which leads to tumor cell apoptosis, causes acute inflammation, and stimulates antitumor immune responses.23,24 Our previous study found that utilizing lipid-soluble IR780 as a sensitizer and encapsulating it in a polymer shell (poly lactide-co-glycolide acid, PLGA) for SDT effectively inhibited tumor growth through increased ROS generation.25
Thus, we designed multilayer sonoresponsive M1/IR780@PLGA nanoparticles with PLGA as the shell to load IR780 and encapsulate it inside the M1-type macrophage-derived nanovesicles to ensure sufficient IR780 loading in the nanocarriers and prevent premature leakage before reaching the tumor site. With modified M1-type macrophage-derived nanovesicles, the nanoparticles can actively target tumor tissues, and repolarize M2 tumor-associated macrophages in the tumor microenvironment into M1 macrophages to stimulate antitumor immune effects. When the nanoparticles reach the tumor site, US irradiation is applied to the tumor site, and the sonosensitizer consumes oxygen and generates ROS, thereby triggering local cell death (Scheme 1). Compared with previous cell membrane biomimetic strategies, the M1 macrophage-derived nanoparticles preserve the various components, especially RNA, in the nanoparticles to the greatest extent during preparation.26–30 However, to our knowledge, few reports have reported the use of PLGA-based drug-loaded M1 macrophage-derived biomimetic nanoparticles for tumor treatment research. Herein, we discuss how M1/IR780@PLGA nanoparticles potentiate antitumoral efficacy through SDT and antitumor immune responses by activating dendritic cell maturation and M1 macrophage repolarization in the tumor microenvironment.
 |
Scheme 1 Schematic illustration of the M1/IR780@PLGA nanoparticles for antitumor SDT and subsequent converting M2 tumor-associated macrophages to the M1 type, activating dendritic cells mature and leading to a strong antitumor immunity effect. |
Materials and Methods
Materials
IR780 iodide, PLGA, and polyvinyl alcohol (PVA) were provided by Sigma Aldrich (St. Louis, MO, USA). The singlet oxygen sensor green (SOSG) probe, LPS, INF-γ, cell-counting kit-8 (CCK-8), calcein AM, 4, 6-diamidino-2-phenylindole (DAPI) and pyridine iodide (PI) were obtained from Beyotime Biotechnology (Shanghai, China). Dulbecco’s modified Eagle’s medium (DMEM), fetal bovine serum (FBS), and penicillin/streptomycin were purchased from Gibco (Grand Island, NY). The ROS assay kit was purchased from Beijing Boxbio Science & Technology Co., Ltd. CD86, CD80, CD206, and CD11c monoclonal antibodies were purchased from Biolegend (San Diego, CA, USA). RAW 264.7 and 4T1 cell lines were obtained from Second Xiangya Hospital of Central South University (Changsha, China). All other reagents were of analytical grade and were used without further purification. All animal experiments were approved by the Ethics Committee of the Second Xiangya Hospital of Central South University and conducted in accordance with the guidelines of the Department of Laboratory Animals of Central South University.
Preparation and Characterization of M1/IR780@PLGA Nanoparticles
First, IR780@PLGA nanoparticles were developed according to our previous studies.25,27,28,31–34 PLGA (50 mg) and IR780 (1 mg) were completely dissolved in 2 mL of chloroform. Then, 10 mL of PVA solution (cold, 4% w/v) was added, and the mixture was emulsified for 2 min with an ultrasonic processor (Sonics, VCX150, USA). Next, 20 mL of deionized water was added, the mixture was stirred for 3 h, and then the fabricated IR780@PLGA nanoparticles were washed with deionized water 3 times.
Second, the RAW264.7 macrophage cell line was cultured in DMEM supplemented with 10% (v/v) FBS and 1% (v/v) penicillin/streptomycin, and 100 ng/mL lipopolysaccharide (LPS) was added to induce differentiation into M1 macrophages. To determine the successful induction of M0 macrophages into M1 macrophages, CD86 on membranes was evaluated by flow cytometry analysis, and the expression of M1 macrophage associated genes (CD86, TNF-α and iNOS) was analyzed by real-time polymerase chain reaction (RT-PCR).35,36 The primer sequences are listed in Supporting Information: Table S1. Then, M1 macrophage-derived nanovesicles were obtained by extrusion using a mini-extruder (Avanti Polar Lipids) with pore sizes of 1 μm and 400 nm.20 Third, 1 mL of IR780@PLGA nanoparticles (1 mg/mL) mixed with the M1 macrophage-derived vesicles was sonicated for 30s to complete the multilayer assembly, and the collected M1/IR780@PLGA nanoparticles were redispersed in 1×PBS after removing the excess M1 macrophage vesicles by centrifugation.
The structures of the M1/IR780@PLGA nanoparticles and M1 macrophage-derived nanonvesicles were examined by transmission electron microscopy (TEM, Hitachi H-7600). The size distributions and zeta potentials of the M1/IR780@PLGA nanoparticles and IR780@PLGA nanoparticles were tested by a dynamic light scattering (DLS) analyzer (Malvern Nano ZS, UK). To confirm the spatial colocalization of M1 macrophage-derived vesicles (DiO-labeled green fluorescence) and IR780@PLGA nanoparticles (DiI-labeled red fluorescence), colocalization fluorescence images of M1/IR780@PLGA nanoparticles were obtained by confocal laser scanning microscopy (CLSM, Carl Zeiss, LSM 510 META). The stability of the M1/IR780@PLGA nanoparticles was measured in 1 × PBS or in 10% FBS with DLS over 7 days. The presence of IR780 in the M1/IR780@PLGA nanoparticles was determined by a UV-Vis-NIR spectrophotometer (Cary 5000, USA). IR780 loading was calculated according to the following equation:31


Measurement of ROS Generation in vitro
The production of 1O2 was measured using SOSG as a fluorescent probe, and time-dependent or nanoparticle concentration-dependent ROS generation of M1/IR780@PLGA nanoparticles was detected. First, 100 µL of M1/IR780@PLGA nanoparticle (0.05 mg/mL) solution and 1 µL of SOSG (2.5 mM) were mixed in a quartz cuvette. A low-frequency US transducer (WED-100, WELLD Medical Electronics, China) was used to irradicate the solution to produce 1O2 (1 MHz, 2 W/cm2, 40% duty cycle) for 0, 20, 40, 60, 80, or 100s, and then the fluorescence spectra of SOSG were acquired on a fluorescence spectrometer with an excitation wavelength of 504 nm. Second, different concentrations (0.2, 0.4, 0.6, 0.8 or 1.0 mg/mL) of M1/IR780@PLGA nanoparticle solution and 1 µL of SOSG (2.5 mM) were mixed in a quartz cuvette. The low-frequency US transducer was used to irradiate the solution to produce 1O2 (1 MHz, 2 W/cm2, 40% duty cycle) for 5s, and then the fluorescence spectra of SOSG were acquired on a fluorescence spectrometer with an excitation wavelength of 504 nm.
Cellular ROS Generation
The mouse breast cancer 4T1 cell line was cultured in 1640 medium supplemented with 10% (v/v) FBS and 1% (v/v) penicillin/streptomycin. The cells were divided into six groups: 1) PBS group, 2) US group, 3) IR780@PLGA group, 4) M1/IR780@PLGA group, 5) IR780@PLGA+US and 6) M1/IR780@PLGA+US group. The concentration of IR780 in the IR780@PLGA and M1/IR780@PLGA nanoparticles was 0.05 mg/mL. The cells were washed and incubated with the ROS assay kit DCFH-DA probe for 40 min to detect intracellular 1O2 generation, and in Groups 2, 5 and 6, the cells were irradiated by a low-frequency US transducer (1 MHz, 1 W/cm2, 40% duty cycle, 30s on and 30s off) for four on/off cycles. Then, intracellular ROS generation after different treatments was visualized by fluorescence microscopy, and quantitative analysis of the fluorescence area was performed.
Intracellular Uptake
For the intracellular uptake experiment, 4T1 cells were incubated with M1/IR780@PLGA or IR780@PLGA nanoparticles for 4 h. The red fluorescent probe DiI was used to label IR780@PLGA nanoparticles, and the green fluorescent probe DiO was used to label M1 nanovesicles; thus, the M1/IR780@PLGA nanoparticles could emit both red and green fluorescence. After incubation with nanoparticles for 4 h, the cells were washed with PBS to remove the unphagocytosed nanoparticles, stained with the blue fluorescent probe DAPI, and then visualized by confocal laser scanning microscopy (CLSM, Carl Zeiss, LSM 510 META).
Cell Viability Assay
Different dosages (0, 5, 10, 100, 500, 1000 and 2000 µg/mL, 0.1 mL per well) of M1/IR780@PLGA nanoparticle suspensions were added to human umbilical vein endothelial cells (HUVECs) and 4T1 cells for 24 h of coincubation, respectively. The corresponding US groups of different dosages received US irradiation by a low-frequency US transducer (1 MHz, 1 W/cm2, 40% duty cycle, 30s on and 30s off) for four on/off cycles. The cell viabilities were calculated using CCK-8 assays.
Apoptosis Assay
To verify the SDT efficacy of M1/IR780@PLGA nanoparticles in cells, 4T1 cells were randomly divided into six groups: 1) PBS group, 2) US group, 3) IR780@PLGA group, 4) M1/IR780@PLGA group, 5) IR780@PLGA+US group and 6) M1/IR780@PLGA+US group. The cells were treated with IR780@PLGA and M1/IR780@PLGA nanoparticles at 1000 µg/mL, and the cells in groups 2, 5 and 6 were irradiated by a low-frequency US transducer (1 MHz, 1 W/cm2, 40% duty cycle, 30s on and 30s off) for four on/off cycles. Then, the cells were stained with calcein AM to identify live cells and propidium iodide (PI) to identify dead cells and imaged by CLSM.
Animal Model
Female BALB/c mice (20 g, 5 weeks old) were obtained from the Medical Experimental Animal Center of Second Xiangya Hospital (Changsha, China). A total of 1×10⁶ 4T1 cells were subcutaneously injected into the right flanks of the mice to establish a breast tumor model. The tumor volume reached approximately 100 mm3 after one week, and the tumor model was successfully established.
In vivo Fluorescence Imaging of Biodistribution
Ten tumor-bearing mice were randomly divided into 2 groups (n = 5): 1) M1/IR780@PLGA nanoparticles and 2) IR780@PLGA nanoparticles, and each mouse was injected with 200 μL of M1/IR780@PLGA nanoparticles or IR780@PLGA nanoparticles (10 mg/mL) via the tail vein according to group assignment. The in vivo fluorescence images of the tumors were obtained at different time points (4 h, 12 h, 24 h, 48 h and 72 h). Then, the tumors and major organs were imaged for ex vivo fluorescence at 72 h, and the average in vivo and ex vivo fluorescence intensities were calculated.
To further identify the location of the nanoparticles, hydrophilic nanocarbon was encapsulated in the M1/IR780@PLGA nanoparticles or IR780@PLGA nanoparticles to label them for TEM examination because the high electron density of nanocarbon makes it easily detectable After 72 h, the tumor tissues in the two groups were detected by TEM to verify their distribution in tumor cells.
In vivo Antitumor Effect and Activated Antitumor Immune Response
To evaluate the antitumor SDT efficacy of M1/IR780@PLGA nanoparticles, tumor-bearing mice were randomly divided into six groups (n = 5): 1) Saline group, 2) US group, 3) IR780@PLGA group, 4) M1/IR780@PLGA group, 5) IR780@PLGA+US group and 6) M1/IR780@PLGA+US group. The IR780@PLGA and M1/IR780@PLGA nanoparticles (200 µL, 10 mg/mL) were injected via the tail vein at 0 and 3 days, and the US irradiation (1 MHz, 2.0 W/cm2, 30s on and 30s off for four on/off cycles) was performed at 1 and 4 days, respectively. The tumor volumes of each mouse were measured every three days for 21 days, and body weight was measured every seven days. Twenty-one days after treatment, the tumor tissues were harvested and stained with hematoxylin and eosin (H&E), and immunofluorescence histology was performed to examine the immune microenvironment (CD86 and CD206) of the tumor tissues by qualitatively and quantitatively estimating the M1 or M2 macrophages.
To evaluate the immune responses induced by antitumor SDT, the spleen of each mouse was harvested and stained with anti-CD80-PE, anti-CD86-APC and anti-CD11c-FITC antibodies according to the manufacturer’s protocols37 and then analyzed by flow cytometry.
Safety Assessment of M1/IR780@PLGA Nanoparticles
To assess of the biological toxicity of the developed M1/IR780@PLGA nanoparticles, mice were treated with different treatments as described above. Three healthy mice were used as controls. Serum biochemistry assays were carried out at 21 days after the different treatments and included measurement of alanine aminotransferase (ALT), aspartate aminotransferase (AST), urea nitrogen (UREA) and creatinine (CREA). After sacrifice at the final time point, the major organs were harvested for H&E staining to assess the histological changes.
Statistical Analysis
All data are presented as the means ± standard deviation (SD), One-way ANOVA and Student’s t-test were used to analyze the data. A value of *p <0.05 was considered statistically significant.
Results and Discussion
Preparation and Characterization of M1/IR780@PLGA Nanoparticles
M1/IR780@PLGA nanoparticles were facilely synthesized via a single emulsion evaporation using the well-established “top-down” method27 (Figure 1A). M1 macrophages were induced by the addition of 100 ng/mL LPS. To identify M1 repolarized macrophages, the RNA expression levels of CD86, TNF-α and iNOS and CD86 fluorescence expression were evaluated by RT-PCR analysis and flow cytometry analysis, respectively. As shown in Figure 1B, the expression level of CD86 in M1 macrophages was almost 2-fold that in M0 macrophages, the expression level of TNF-α in M1 macrophages was almost 5-fold that in M0 macrophages, and the expression level of iNOS in M1 macrophages was more than 600-fold that in M0 macrophages, which means that M1 macrophages were successfully repolarized from M0 macrophages. As shown in Figure 1C and D, more than 80% of the M1 repolarized macrophages expressed CD86, while only 10% of the M0 macrophages expressed of CD86, which indicates that most of the M1 macrophages were successfully repolarized from M0 macrophages. The developed M1/IR780@PLGA nanoparticles showed an obvious absorption peak at a wavelength of 800 nm in the UV-vis-NIR absorption spectra, which confirmed the existence of IR780 and indicated that the M1/IR780@PLGA nanoparticles could be used as a good sonodynamic agent (Figure S1, Supporting Information).25,34 The standard curve of IR780 was calculated, the encapsulation efficiency of IR780 was 45.91% and the loading efficiency of IR780 was 3.06% (Figure S2, Supporting Information). After M1 macrophage membrane coating, the average diameter of the M1/IR780@PLGA nanoparticles changed from 235 to 250 nm, and the surface zeta potential of the M1/IR780@PLGA nanoparticles changed from −8.4 to −12.3 mV (Figure 1E). The structures of the IR780@PLGA nanoparticles, M1 macrophage nanovesicles and M1/IR780@PLGA nanoparticles were observed by TEM examination. As shown in Figure 1F, the M1/IR780@PLGA nanoparticles showed core–shell structures with the M1 macrophage membrane as the outer shell, and the thickness was approximately 15 mm, which was consistent with the size distribution. To further confirm the structure of the M1/IR780@PLGA nanoparticles, the DiI red fluorescence-labeled IR780@PLGA nanoparticles and DiO green fluorescence-labeled M1 macrophage nanovesicles were colocalized in the M1/IR780@PLGA nanoparticles in the CLSM image (Figure 1G), indicating that the M1 macrophage nanovesicles were successfully coated on the IR780@PLGA nanoparticles, which was consistent with the TEM results. Furthermore, insubstantial changes in the size and zeta potential of the M1/IR780@PLGA nanoparticles were monitored by DLS over 7 days in PBS and 10% FBS, suggesting that the M1/IR780@PLGA nanoparticles have excellent colloidal stability for in vivo study (Figures S3 and S4, Supporting Information).
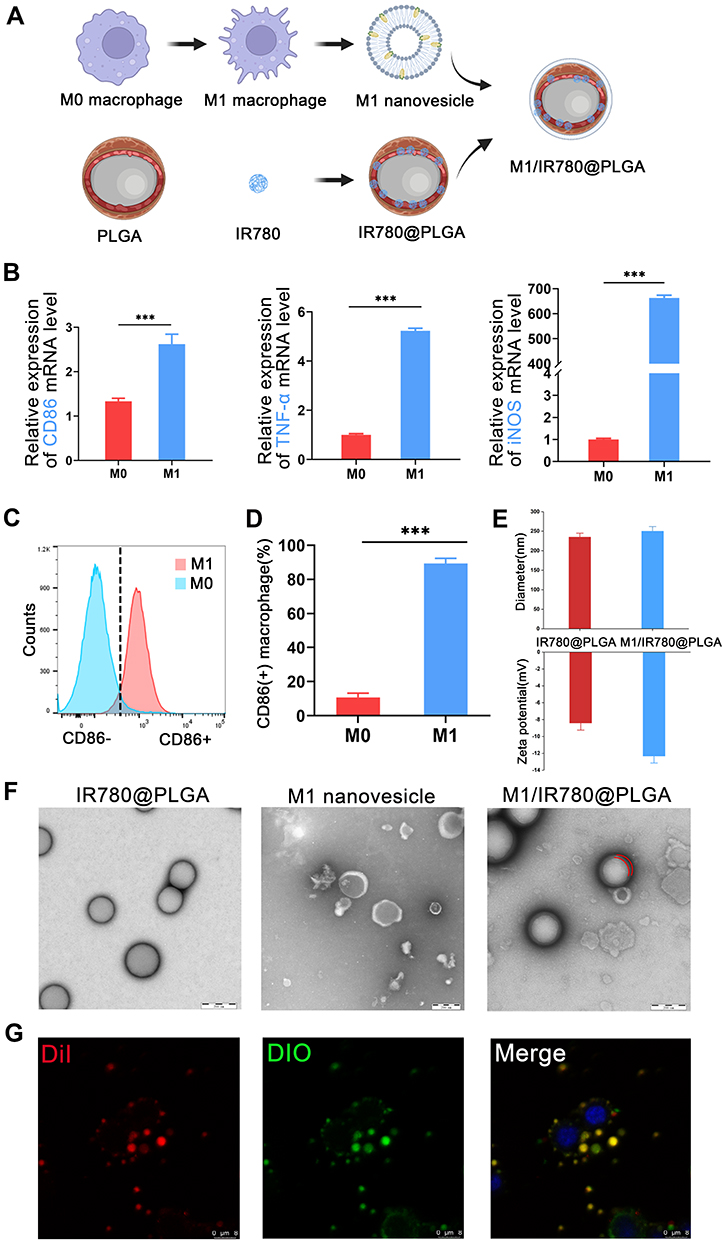 |
Figure 1 Characterization of M1/IR780@PLGA nanoparticles. (A) Schematic illustration of the preparation of M1/IR780@PLGA nanoparticles. (B) Induction of macrophage switching from M0 to M1 by LPS, RNA expression levels of CD86, TNF-α and iNOS in macrophages determined by quantitative real-time polymerase chain reaction. (C and D) Definition of M1 polarized macrophages by flow cytometry (C) and quantification results (D). (E) Size and zeta distributions of IR780@PLGA nanoparticles and M1/IR780@PLGA nanoparticles. (F) The TEM image of IR780@PLGA nanoparticles, M1 nanovesicles and M2/IR780@PLGA nanoparticles (Scale bar: 100 nm). (G) Typical confocal images of RAW264.7 incubated with M1/IR780@PLGA nanoparticles, DiI-labeled IR780@PLGA nanoparticles (red) and DiO-labeled M1 nanovesicle (green). Scale bar, 10 µm. Statistical significances were calculated via Student’s t-test, ***P < 0.001. |
Vitro and Cellular ROS Generation
SOSG was applied to measure 1O2 generation. As shown in Figure 2A, the fluorescence intensity of the SOSG solution containing M1/IR780@PLGA nanoparticles (0.05 mg/mL) increased drastically with prolonged US irradiation (1 MHz, 2 W/cm2, 40% duty cycle). The fluorescence intensity of SOSG increased more than 2-fold within 100s. As shown in Figure 2B, the fluorescence intensity of the SOSG solution containing different M1/IR780@PLGA nanoparticles changed significantly with increasing concentrations of nanoparticles. The fluorescence intensity of SOSG at 1.0 mg/mL was more than 2-fold that at 0.2 mg/mL. These results indicated that the M1/IR780@PLGA nanoparticles could be used as a good sonosensitizer with time-dependent and nanoparticle concentration-dependent ROS generation.
 |
Figure 2 (A) Time-dependent ROS generation of M1/IR780@PLGA nanoparticles detected by SOSG at a fixed IR780 concentration of 0.05 mg/mL for 0, 20, 40, 60, 80 and 100s. (B) Concentration-dependent ROS generation of M1/IR780@PLGA nanoparticles (0.2, 0.4, 0.6, 0.8 and 1.0 mg/mL) detected by SOSG. (C) Intracellular ROS generation after different treatments visualized by fluorescence microscope and (D) quantitative analysis of fluorescence area. Scale bar 50 µm. Statistical significances were calculated via one-way ANOVA, ***P < 0.001, ns means no statistical significance. (E) CLSM images of intracellular uptake of M1/IR780@PLGA nanoparticles and IR780@PLGA nanoparticles by 4T1 cells and (F) quantitative analysis of fluorescence intensity. DiI-labeled IR780@PLGA nanoparticles showed red fluorescence, DiO-labeled M1 nanovesicles showed green fluorescence and DAPI-labeled nucleus showed blue fluorescence. Scale bar 5 µm. |
Then, DCFH-DA fluorescence was applied to measure intracellular ROS after different treatments. As shown in Figure 2C and D, 4T1 cells treated with PBS, US irradiation, IR780@PLGA or M1/IR780@PLGA nanoparticles alone emitted negligible fluorescence. In contrast, cells treated with IR780@PLGA or M1/IR780@PLGA nanoparticles showed bright green fluorescence after US irradiation (1 MHz, 1 W/cm2, 40% duty cycle, 30s on and 30s off) for four on/off cycles, indicating that cellular ROS can only be generated when both IR780@PLGA or M1/IR780@PLGA nanoparticles and US irradiation are present, and the M1 nanovesicle coating does not affect ROS production.
Intracellular Uptake
To track the intracellular localization of M1/IR780@PLGA nanoparticles, DiI was used to label IR780@PLGA nanoparticles, DiO was used to label M1 macrophage nanovesicles, and DAPI was used to label 4T1 cells. As shown in Figure 2E and F, after incubation with M1/IR780@PLGA or IR@PLGA nanoparticles for 4 h, the red fluorescence of DiI-labeled nanoparticles was obviously detected in 4T1 cells in the two groups, while the green fluorescence of DiO-labeled M1 macrophage nanovesicles was observed only in the M1/IR780@PLGA group because the M1 macrophage nanovesicles were successfully coated on the IR780@PLGA nanoparticles. In contrast, the red fluorescence of DiI-labeled M1/IR780@PLGA nanoparticles in 4T1 cells was higher than that of IR780@PLGA nanoparticles, which proved that the M1 macrophage nanovesicles coating further enhanced the accumulation of nanoparticles in 4T1 cells.
Cell Viability and Apoptosis Assay
The cytotoxicity of different concentrations of M1/IR780@PLGA nanoparticles was assessed by CCK-8 assays. As shown in Figure 3A and B, in the absence of US irradiation, the harmful effect of M1/IR780@PLGA nanoparticles at any concentration was negligible in both HUVECs and 4T1 cells. When exposed to US irradiation, the 4T1 cell viability started to be inhibited by M1/IR780@PLGA nanoparticles at 5 μg/mL and was inhibited by more than 90% at concentrations of 1000 μg/mL and 2000 μg/mL.
 |
Figure 3 Cytotoxicity and apoptosis assays of M1/IR780@PLGA nanoparticles. Cell viabilities of HUVEC (A) and 4T1 cells (B) after various treatments. Data are expressed as means SD (n = 3). Statistical significances were calculated via Student’s t-test, *P < 0.05. (C) Relative quantitative and (D) CLSM images analysis of Calcein AM/PI co-stained 4T1 cells after various treatments (live and dead cells are stained green and red, respectively). Data are expressed as means SD (n = 3). Statistical significances were calculated via one-way ANOVA, ***P < 0.001, ns means no statistical significance. |
To verify the SDT efficacy of M1/IR780@PLGA nanoparticles in cells, apoptosis was evaluated by calcein AM/PI assays. 4T1 cells under different treatments were stained with calcein AM to identify live cells and PI to identify dead cells. As shown in Figure 3C and D, 4T1 cells treated with IR780@PLGA and M1/IR780@PLGA nanoparticles displayed evident red fluorescence after US irradiation (1 MHz, 1 W/cm2, 40% duty cycle, 30s on and 30s off) for four on/off cycles, which almost resulted in more than 90% tumor cell death, while 4T1 cells treated with other treatments emitted green fluorescence, and only little red fluorescence was observed. These results indicated that SDT significantly killed tumor cells when both IR780@PLGA and M1/IR780@PLGA nanoparticles and US irradiation were present, similar to the results of the cellular ROS generation assay.
In vivo Fluorescence Imaging of Biodistribution
To assess the tumor targeting ability and biodistribution of the nanoparticles in vivo, the fluorescence intensities of M1/IR780@PLGA and IR780@PLGA nanoparticles were measured at different time points. As shown in Figure 4A and B, the fluorescence intensities of the tumors injected with M1/IR780@PLGA nanoparticles were higher than those injected with IR780@PLGA nanoparticles at all time points, and the fluorescence intensities of tumors peaked at 24 h in both groups, which may indicate the targeting ability of M1 macrophage-derived nanovesicles to the tumor tissue. Then, the fluorescence intensities in both groups gradually decreased, but the fluorescence intensity of tumors injected with M1/IR780@PLGA nanoparticles was even higher at 72 h than that of tumors injected with IR780@PLGA nanoparticles at 48 h. At 72 h, the tumors and major organs were harvested and imaged. As shown in Figure 4C and D, the fluorescence intensity of the tumor in the M1/IR780@PLGA nanoparticle group was significantly higher than that in the IR780@PLGA nanoparticle group, and the fluorescence intensity of the liver in the M1/IR780@PLGA nanoparticle group was obviously lower than that in the IR780@PLGA nanoparticle group. This indicates that the M1 macrophage-derived nanovesicle coating effectively reduced the reticuloendothelial system (RES) uptake of the nanoparticles and efficiently prolonged blood circulation to enhance the enhanced permeability and retention (EPR) effect in tumors, which was consistent with other studies on the cell membrane coating technique.27,28
 |
Figure 4 In vivo tumor targeting and circulation prolonging ability of M1/IR780@PLGA nanoparticles. (A) In vivo fluorescence imaging and (B) intensities of tumor-bearing mice at 4, 12, 24, 48, 72h after intravenous injection of M1/IR780@PLGA nanoparticles or IR780@PLGA nanoparticles. (C) Averaged ex vivo NIR fluorescence intensities at 72h and (D) NIR fluorescence images of major organs. (E) TEM images of tumor tissue at 72h, the red arrows indicated the nanocarbon labeled nanoparticles. Data are expressed as means SD (n = 3). Statistical significances were calculated via Student’s t-test, *P < 0.05, ***P< 0.001. |
To further identify the location of nanoparticles in tumor cells, nanocarbon-labeled M1/IR780@PLGA nanoparticles or nanocarbon-labeled IR780@PLGA nanoparticles were used for TEM examination (Figure S5, Supporting Information). The nanocarbon-labeled nanoparticles showed a uniform shape and were evenly distributed. After 72 h, the tumor tissues in the two groups were harvested and detected by TEM. As shown in Figure 4E, many nanocarbon-labeled nanoparticles were observed in the M1/IR780@PLGA nanoparticle group, and fewer nanocarbon- labeled nanoparticles were observed in the IR780@PLGA nanoparticle group, which was also consistent with the results of the in vivo and ex vivo fluorescence imaging studies.
In vivo Antitumor Effect and Activated Antitumor Immune Response
Inspired by the excellent in vitro antitumor efficacy and the remarkable fluorescence imaging results indicating the tumor targeting ability, the in vivo antitumor effects of SDT were evaluated. The time schedule for in vivo treatment is shown in Figure 5A. As shown in Figure 5B–D, after different treatments for 21 days, the tumor volumes of mice treated with M1/IR780@PLGA nanoparticles under US irradiation increased approximated 2-fold compared to the initial tumor volumes, which was smaller than the increase in tumor volume observed in the group treated with IR780@PLGA nanoparticles and US irradiation. In regards to antitumor efficacy in the M1/IR780@PLGA nanoparticles alone group, the tumor volumes of the mice were increased approximately 4-fold compared to the initial tumor volumes and were smaller than those of the IR780@PLGA nanoparticles alone group, which had a slight tumor inhibition effect. We speculated that this might be due to the immunomodulatory effects of the tumor microenvironment caused by M1 nanovesicles. In contrast, the tumor volumes of mice treated with saline or US irradiation were increased more than 5-fold over the initial tumor volumes. These results indicated that the antitumor SDT significantly inhibited tumor growth when the M1/IR780@PLGA nanoparticles were exposed to US irradiation. In addition, the body weight curves showed no obvious weight loss among these groups after different treatments (Figure S6, Supporting Information). Furthermore, H&E staining analysis proved that tumor cells were extensively damaged with coagulative necrosis in the M1/IR780@PLGA + US group; this also existed in the IR780@PLGA + US group, but the extent was lower. In the M1/IR780@PLGA group, only small patch of coagulative necrosis was observed. The cells in the other groups were not notably damaged (Figure 5E).
 |
Figure 5 The antitumor effect of M1/IR780@PLGA nanoparticles. (A) Schematic illustration of the time schedule for in vivo treatment of tumor-bearing mice. (B) The photographs of tumor-bearing mice before and after different treatments at 7, 14 and 21 days. (C) Tumor growth curve and (D) average tumor weight of mice after different treatments. Data are expressed as means SD (n = 5). Statistical significances were calculated via one-way ANOVA, *P < 0.05, ***P < 0.001. (E) H&E staining of tumor tissue slices after different treatments, scale bar = 100 μm. |
Then, immunofluorescence staining of tumor tissues showed the levels of CD86 and CD206 in the different groups. CD86 was labeled with red fluorescence, and as shown in Figure 6A and B, the level of CD86 was high in the IR780@PLGA + US group, but it was the highest in the M1/IR780@PLGA + US group, indicating that the most M1 macrophages existed in the M1/IR780@PLGA + US group, and a small amount of CD86 red fluorescence appeared in the M1/IR780@PLGA group, which was due to the immunomodulatory effect of M1 nanovesicles, and was consistent with our previous hypothesis. In addition, CD86 was rarely expressed in the saline, US irradiation or IR780@PLGA nanoparticles alone groups. In contrast, green fluorescence-labeled CD206 was lowest in the M1/IR780@PLGA + US group and was only 0.5-fold higher than that in the IR780@PLGA + US group (Figure 6C), but was highly expressed in the saline, US irradiation and IR780@PLGA nanoparticles alone groups. Moreover, the expression of CD206 in the M1/IR780@PLGA group was more obvious than that in the IR780@PLGA group, indicating that M1 vesicles repolarized M2 macrophages into M1 macrophages in tumor tissue. The expression of CD206 in the M1/IR780@PLGA + US group was only 0.25- to 0.3-fold higher than that in the saline groups, indicating that M2 macrophages were the least abundant in the M1/IR780@PLGA + US group. These results demonstrated that many M2 tumor-associated macrophages were converted to M1 macrophages in the tumor microenvironment in the M1/IR780@PLGA + US group due to SDT efficacy.
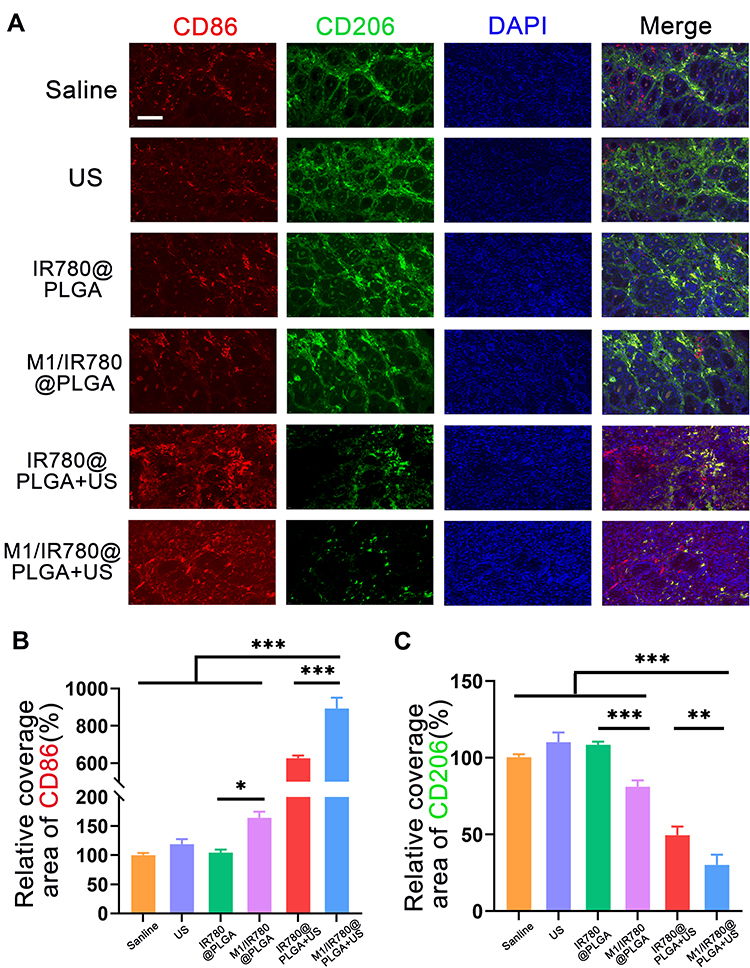 |
Figure 6 The immunofluorescence analysis. (A) Representative immunofluorescence images showing CD86 and CD206 in different groups. Scale bar: 100 μm. (B) The relative quantification of CD86 and (C) CD206 after different treatments. Data are expressed as means SD (n = 5). Statistical significances were calculated via one-way ANOVA, * P < 0.05, **P < 0.01, ***P < 0.001. |
To evaluate the immune responses induced by antitumor SDT, dendritic cells in spleens were studied on day 21. As shown in Figure 7A and B, the volume of spleens in the M1/IR780@PLGA + US group was smaller than that in the other groups. Furthermore, as shown in Figure 7C and D, the percentage of mature dendritic cells (CD11c+ CD80+ CD86+) was much higher in the M1/IR780@PLGA + US group than in the other groups. Interestingly, the volume of spleens in the M1/IR780@PLGA nanoparticles alone group was only 0.5-fold that of the saline or US irradiation group. Correspondingly, the percentage of mature dendritic cells in the M1/IR780@PLGA nanoparticles alone group was 49.0%, which was obviously higher than that of in the IR780@PLGA nanoparticles group. Moreover, the percentage of mature dendritic cells in the IR780@PLGA + US group was slightly lower than that of the M1/IR780@PLGA + US group. These results demonstrated that the M1/IR780@PLGA nanoparticles possessed the ability to stimulate antitumor immune responses to a certain degree. To a certain extent, M1 vesicles can reprogram the tumor-promoting M2 type into the tumor-suppressing M1 type. When combined with US irradiation, the antitumor immune responses triggered by M1/IR780@PLGA nanoparticles could be further improved with more mature dendritic cell generation.
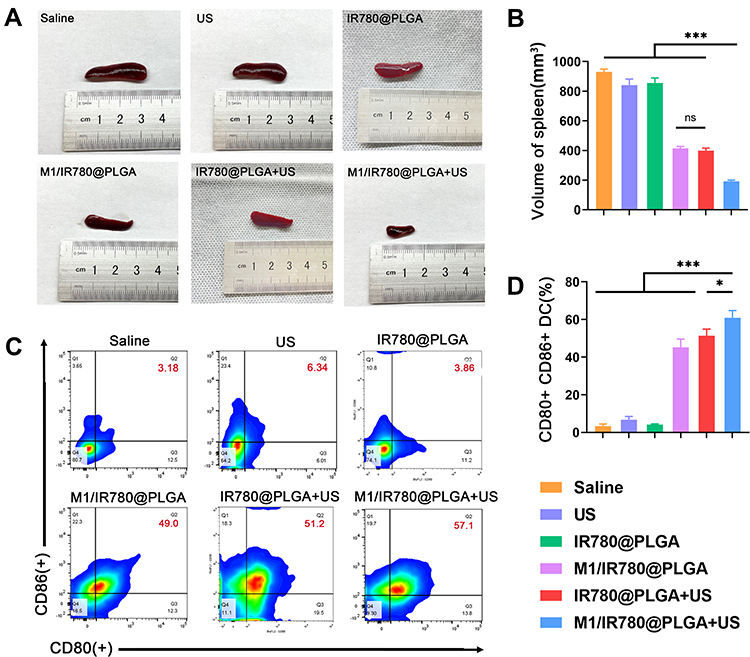 |
Figure 7 (A) General photographs and (B) volume of spleens obtained from mice in different treatment groups. (C) Quantification of CD80 and CD86 expression and (D) representative FACS plots on dendritic cells gated by CD11c+ cells. Data are expressed as means SD (n = 5). Statistical significances were calculated via one-way ANOVA, * P < 0.05, ***P < 0.001, ns means no statistical significance. |
Safety Assessment of M1/IR780@PLGA Nanoparticles
To assess of the biological toxicity of the developed M1/IR780@PLGA nanoparticles, serum biochemistry assays were performed at 21 days after the different treatments, and no significant difference was seen between the different groups (Figure 8A). In addition, the major organs were harvested for H&E staining, which showed no noticeable organ damage in the different treatment groups (Figure 8B), indicating that the M1/IR780@PLGA nanoparticles have negligible toxic side effects in vivo.
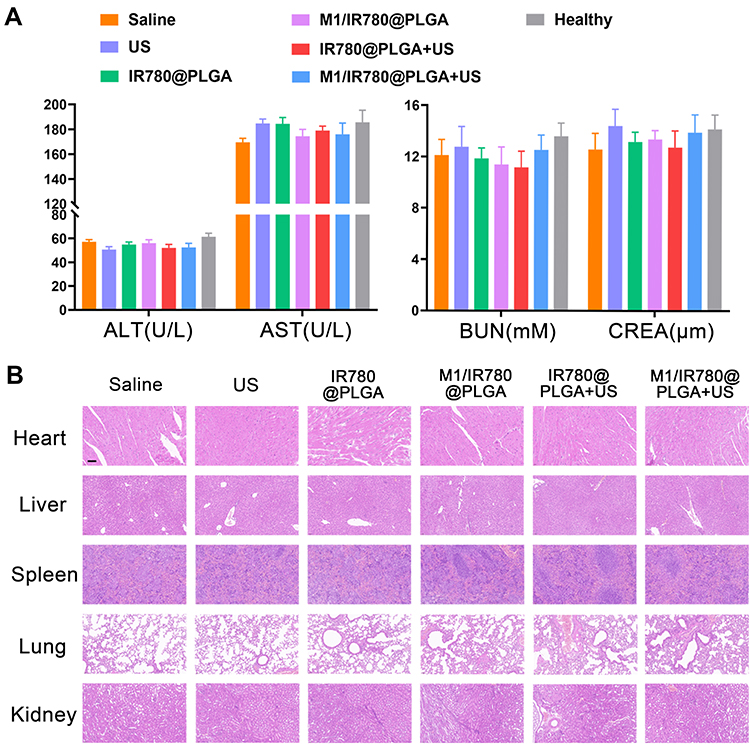 |
Figure 8 Safety assessment of M1/IR780@PLGA nanoparticles. (A) Serum biochemistry assays including ALT, AST, BUN and CREA were assessed at 21 days after different treatment, the healthy mice were used as control. (B) H&E staining images of heart, liver, spleen, lung and kidney at day 21 after different treatments. Scale bar: 100 μm. |
Conclusion
In conclusion, we developed multilayer sonoresponsive M1/IR780@PLGA nanoparticles modified with M1-type macrophage-derived nanovesicles, which can actively target tumor tissues, inhibit tumor growth by SDT, trigger many M2 macrophages to convert into M1 macrophages in the tumor microenvironment and promote dendritic cell maturation to activate the antitumor immune response. Thus, this therapeutic bionic nanosystem targeting the tumor microenvironment has great potential for future clinical applications.
Acknowledgments
This project was funded by the National Natural Science Foundation of China (81974267), Science and Technology Innovation Program of Hunan Province (2021RC3033), Hunan Provincial Natural Science Foundation of China (2022JJ30827) and Natural Science Foundation of Hunan Provincial Health Commission (A202309026329).
Author Contributions
All authors made substantial contributions to conception and design, acquisition of data, or analysis and interpretation of data; took part in drafting the article or revising it critically for important intellectual content; agreed to submit to the current journal; gave final approval of the version to be published; and agree to be accountable for all aspects of the work.
Disclosure
All authors have no conflicts of interest to disclose.
References
1. Castano AP, Mroz P, Hamblin MR. Photodynamic therapy and anti-tumour immunity. Nat Rev Cancer. 2006;6(7):535–545. doi:10.1038/nrc1894
2. Kasturi SP, Skountzou I, Albrecht RA, et al. Programming the magnitude and persistence of antibody responses with innate immunity. Nature. 2011;470(7335):543–547. doi:10.1038/nature09737
3. Pardoll DM. The blockade of immune checkpoints in cancer immunotherapy. Nat Rev Cancer. 2012;12(4):252–264. doi:10.1038/nrc3239
4. Zhou F, Wu S, Song S, Chen WR, Resasco DE, Xing D. Antitumor immunologically modified carbon nanotubes for photothermal therapy. Biomaterials. 2012;33(11):3235–3242.
5. Yue C, Liu P, Zheng M, et al. IR-780 dye loaded tumor targeting theranostic nanoparticles for NIR imaging and photothermal therapy. Biomaterials. 2013;34(28):6853–6861.
6. Chu KF, Dupuy DE. Thermal ablation of tumours: biological mechanisms and advances in therapy. Nat Rev Cancer. 2014;14(3):199–208.
7. Allen TM, Cullis PR. Drug delivery systems: entering the mainstream. Science. 2004;303(5665):1818–1822.
8. Yoo JW, Irvine DJ, Discher DE, Mitragotri S. Bio-inspired, bioengineered and biomimetic drug delivery carriers. Nat Rev Drug Discov. 2011;10(7):521–535.
9. Fang RH, Hu CM, Luk BT, et al. Cancer cell membrane-coated nanoparticles for anticancer vaccination and drug delivery. Nano Lett. 2014;14(4):2181–2188.
10. Salvati A, Pitek AS, Monopoli MP, et al. Transferrin-functionalized nanoparticles lose their targeting capabilities when a biomolecule Corona adsorbs on the surface. Nat Nanotechnol. 2013;8(2):137–143. doi:10.1038/nnano.2012.237
11. Fleischer CC, Payne CK. Nanoparticle-cell interactions: molecular structure of the protein Corona and cellular outcomes. Acc Chem Res. 2014;47(8):2651–2659. doi:10.1021/ar500190q
12. Heldin CH, Rubin K, Pietras K, Ostman A. High interstitial fluid pressure - an obstacle in cancer therapy. Nat Rev Cancer. 2004;4(10):806–813. doi:10.1038/nrc1456
13. Zhang M, Zang X, Wang M, et al. Exosome-based nanocarriers as bio-inspired and versatile vehicles for drug delivery: recent advances and challenges. J Mater Chem B. 2019;7(15):2421–2433. doi:10.1039/C9TB00170K
14. van Niel G, D’Angelo G, Raposo G. Shedding light on the cell biology of extracellular vesicles. Nat Rev Mol Cell Biol. 2018;19(4):213–228. doi:10.1038/nrm.2017.125
15. Smyth TJ, Redzic JS, Graner MW, Anchordoquy TJ. Examination of the specificity of tumor cell derived exosomes with tumor cells in vitro. Biochim Biophys Acta. 2014;1838(11):2954–2965. doi:10.1016/j.bbamem.2014.07.026
16. Sabu C, Rejo C, Kotta S, Pramod K. Bioinspired and biomimetic systems for advanced drug and gene delivery. J Control Release. 2018;287:142–155. doi:10.1016/j.jconrel.2018.08.033
17. Jang SC, Kim OY, Yoon CM, et al. Bioinspired exosome-mimetic nanovesicles for targeted delivery of chemotherapeutics to malignant tumors. ACS Nano. 2013;7(9):7698–7710. doi:10.1021/nn402232g
18. Miller MA, Zheng YR, Gadde S, et al. Tumour-associated macrophages act as a slow-release reservoir of nano-therapeutic Pt(IV) pro-drug. Nat Commun. 2015;6:8692. doi:10.1038/ncomms9692
19. Zheng P, Luo Q, Wang W, et al. Tumor-associated macrophages-derived exosomes promote the migration of gastric cancer cells by transfer of functional Apolipoprotein E. Cell Death Dis. 2018;9(4):434. doi:10.1038/s41419-018-0465-5
20. Choo YW, Kang M, Kim HY, et al. M1 macrophage-derived nanovesicles potentiate the anticancer efficacy of immune checkpoint inhibitors. ACS Nano. 2018;12(9):8977–8993. doi:10.1021/acsnano.8b02446
21. Zhou H, Sun J, Wu J, Wei H, Zhou X. Biodegradable nanosonosensitizers with the multiple modulation of tumor microenvironment for enhanced sonodynamic therapy. Int J Nanomedicine. 2021;16:2633–2646. doi:10.2147/IJN.S297571
22. Wang X, Wu M, Li H, et al. Enhancing penetration ability of semiconducting polymer nanoparticles for sonodynamic therapy of large solid tumor. Adv Sci. 2022;9(6):2104125. doi:10.1002/advs.202104125
23. Qian X, Zheng Y, Chen Y. Micro/nanoparticle-augmented sonodynamic therapy (SDT): breaking the depth shallow of photoactivation. Adv Mater. 2016;28(37):8097–8129. doi:10.1002/adma.201602012
24. Li Y, Zhou Q, Deng Z, et al. IR-780 dye as a sonosensitizer for sonodynamic therapy of breast tumor. Sci Rep. 2016;6:25968. doi:10.1038/srep25968
25. Huang B, Chen S, Pei W, et al. Oxygen-sufficient nanoplatform for chemo-sonodynamic therapy of hypoxic tumors. Front Chem. 2020;8:358. doi:10.3389/fchem.2020.00358
26. Hu CMJ. Nanoparticle biointerfacing by platelet membrane cloaking. Nature. 2015;526:118–121. doi:10.1038/nature15373
27. Wang L, Chen S, Pei W, Huang B, Niu C. Magnetically targeted erythrocyte membrane coated nanosystem for synergistic photothermal/chemotherapy of cancer. J Mater Chem B. 2020;8(18):4132–4142. doi:10.1039/D0TB00364F
28. Pei W, Huang B, Chen S, Wang L, Xu Y, Niu C. Platelet-mimicking drug delivery nanoparticles for enhanced chemo-photothermal therapy of breast cancer. Int J Nanomedicine. 2020;15:10151–10167. doi:10.2147/IJN.S285952
29. Zhou J, Niu C, Huang B, et al. Platelet membrane biomimetic nanoparticles combined with UTMD to improve the stability of atherosclerotic plaques. Front Chem. 2022;10. doi:10.3389/fchem.2022.868063
30. Zhang QZ, Dehaini D, Zhang Y, et al. Neutrophil membrane-coated nanoparticles inhibit synovial inflammation and alleviate joint damage in inflammatory arthritis. Nat Nanotechnol. 2018;13(12):1182. doi:10.1038/s41565-018-0254-4
31. Wang L, Chen SJ, Zhu Y, et al. Triple-modal imaging-guided chemo-photothermal synergistic therapy for breast cancer with magnetically targeted phase-shifted nanoparticles. Acs Appl Mater Inter. 2018;10(49):42102–42114.
32. Chen S, Huang B, Pei W, et al. Magnetically targeted nanoparticles for imaging-guided photothermal therapy of cancer. RSC Adv. 2019;9(65):38154–38164.
33. Chen S, Huang B, Pei W, Wang L, Xu Y, Niu C. Mitochondria-targeting oxygen-sufficient perfluorocarbon nanoparticles for imaging-guided tumor phototherapy. Int J Nanomedicine. 2020;15:8641–8658.
34. Huang B, Wang L, Tang K, et al. IR780 based sonotherapeutic nanoparticles to combat multidrug-resistant bacterial infections. Front Chem. 2022;10:840598.
35. Wang Y, Lin YX, Qiao SL, et al. Polymeric nanoparticles promote macrophage reversal from M2 to M1 phenotypes in the tumor microenvironment. Biomaterials. 2017;112:153–163.
36. Wang P, Wang H, Huang Q, et al. Exosomes from M1-polarized macrophages enhance paclitaxel antitumor activity by activating macrophages-mediated inflammation. Theranostics. 2019;9(6):1714–1727.
37. Chen Q, Xu L, Liang C, Wang C, Peng R, Liu Z. Photothermal therapy with immune-adjuvant nanoparticles together with checkpoint blockade for effective cancer immunotherapy. Nat Commun. 2016;7:13193.
 © 2022 The Author(s). This work is published and licensed by Dove Medical Press Limited. The
full terms of this license are available at https://www.dovepress.com/terms
and incorporate the Creative Commons Attribution
- Non Commercial (unported, 3.0) License.
By accessing the work you hereby accept the Terms. Non-commercial uses of the work are permitted
without any further permission from Dove Medical Press Limited, provided the work is properly
attributed. For permission for commercial use of this work, please see paragraphs 4.2 and 5 of our Terms.
© 2022 The Author(s). This work is published and licensed by Dove Medical Press Limited. The
full terms of this license are available at https://www.dovepress.com/terms
and incorporate the Creative Commons Attribution
- Non Commercial (unported, 3.0) License.
By accessing the work you hereby accept the Terms. Non-commercial uses of the work are permitted
without any further permission from Dove Medical Press Limited, provided the work is properly
attributed. For permission for commercial use of this work, please see paragraphs 4.2 and 5 of our Terms.
Recommended articles
Enhanced Sonodynamic Therapy via Au Nanoclusters Deposited on TiO2 Nanosheets
Huang L, Wei L, Li D, Zhang W, Liu L
International Journal of Nanomedicine 2025, 20:6121-6131
Published Date: 14 May 2025
Exploring the Potential Role of Manganese-Based Zeolitic Imidazolate Framework Nanoparticles in Cancer Therapy: In vitro Studies Using Lung Cancer Cells
Ivasiv V, Neves IC, Baltazar F, Moreira JN, Bañobre López M, Larios J, Duruz J, Balog S, Vanhecke D, Lee WS, Keshavan S, Petri-Fink A, Rothen-Rutishauser B
International Journal of Nanomedicine 2026, 21:578869
Published Date: 20 March 2026
Synergistic Sono-Chemodynamic Therapy of Renal Cell Carcinoma Using HKUST-1@TiO2 Heterojunctions
Zheng S, Li C, Chen J, Zhang K, Cui X, Li R, Weng Z
International Journal of Nanomedicine 2026, 21:588980
Published Date: 21 April 2026
An E3 Aptamer-Modified T Cell-Derived Exosomal Nanoplatform for Codelivery of Astragaloside IV and PESV: Enhancing Prostate Cancer Therapy Through Immune Modulation with Implications for Clinical Translation
Zhang Q, Liu C, Wu S, Zhong N, Qiu J, Fu W, You X
International Journal of Nanomedicine 2026, 21:614400
Published Date: 9 July 2026