Back to Journals » Diabetes, Metabolic Syndrome and Obesity » Volume 15
Lysophosphatidylcholine (17:0) Improves HFD-Induced Hyperglycemia & Insulin Resistance: A Mechanistic Mice Model Study
Authors Bao L, Zhang Y, Yan S, Yan D, Jiang D
Received 29 April 2022
Accepted for publication 5 September 2022
Published 15 November 2022 Volume 2022:15 Pages 3511—3517
DOI https://doi.org/10.2147/DMSO.S371370
Checked for plagiarism Yes
Review by Single anonymous peer review
Peer reviewer comments 2
Editor who approved publication: Prof. Dr. Muthuswamy Balasubramanyam
Li Bao,1,2 Ying Zhang,2,3 Sichao Yan,1,2 Dan Yan,2,3 Dechun Jiang1,2
1Department of Pharmacy, Beijing Shijitan Hospital, Capital Medical University, Beijing, People’s Republic of China; 2Beijing Key Laboratory of Bio-Characteristic Profiling for Evaluation of Rational Drug Use, Beijing, People’s Republic of China; 3Department of Pharmacy, Beijing Friendship Hospital, Capital Medical University, Beijing, People’s Republic of China
Correspondence: Dechun Jiang, Department of Pharmacy, Beijing Shijitan Hospital, Capital Medical University, No. 10 Tieyi-Road, Haidian District, Beijing, 10038, People’s Republic of China, Tel +86-10-63926723, Email [email protected]
Purpose: Type 2 diabetes mellitus is characterized by the dysregulation of glucose homeostasis and insulin sensitivity, resulting in hyperglycemia. The exploration of a complex regulatory network in host metabolism homeostasis may raise a novel strategy for the prevention of T2D. A variety of metabolites serve as the endogenous ligand of G protein-coupled receptors (GPCR) and play an important role in the pathophysiological process of T2D and insulin resistance, however, the roles of remaining endogenous metabolites in insulin resistance and GPCRs still need to be explored.
Patients and Methods: The effect of LPC (17:0) on hyperglycemia were proved in high fat diet (HFD) mice, and qPCR with Western blot technology was used to verify the downstream targets.
Results: Herein, we found that LPC (17:0) reduced blood glucose and alleviated insulin resistance and related metabolic disorders in high-fat diet induced (HFD) mice through activating GLP-1 and promoting insulin secretion. Further, the LPC (17:0) was found to stimulate intestinal GPR120, GPR35 and CALCR, with potential effect on GLP-1 stimulation.
Conclusion: The above observation revealed LPC (17:0) as an endogenous protective factor with potential role on GPCRs, and it provided theoretical support for the development of LPC (17:0) as a potent drug candidate or health food additive for insulin resistance and hyperglycemia.
Keywords: lysophosphatidylcholine, hyperglycemia, GPR120, GPR35, CALCR
Introduction
Type 2 diabetes (T2D) has become an epidemic and worldwide public health issue.1,2 This disease is found in 9% of the adult population and directly causes at least 1.5 million deaths annually all over the world. Moreover, diabetes significantly increases comorbidities of several other chronic health problems, including cardiovascular disease, stroke and kidney disease, which contribute heavily to the health and cost burden associated with diabetes. The current clinical drugs for the treatment of diabetes are still facing some problems due to the limitation of the therapeutic efficacy and the accompanying side effects,3 largely due to the unclear pathological mechanisms of T2D. The exploration of a complex regulatory network in host metabolism homeostasis may raise a novel strategy for the prevention of T2D.
G protein-coupled receptors (GPCRs) are seven transmembrane domain receptors that couple extracellular stimuli to intracellular responses via heterotrimeric G proteins and β-arrestins.4 GPCRs are implicated in a variety of biological processes and are the targets of approximately one third of marketed drugs. A variety of metabolites serve as the endogenous ligand of GPCR and play an important role in the pathophysiological process of T2D and insulin resistance. Bile acids induce thermogenesis via adipose TGR5 and promote GLP-1 secretion in L cells, thus regulate insulin resistance and related metabolic disorders.5 Asprosin, a fasting-induced hormone that promotes hepatic glucose production and increases hunger, were found as a ligand of the olfactory receptor OLFR734 and maintains glucose homeostasis during fasting and in obesity recently.6 Although a number of metabolites were found to orchestrate insulin resistance and related metabolic disorders through the regulation of GPCRs, the role of remaining endogenous metabolites in insulin resistance and GPCRs still need to be explored.
In our previous serum non-targeted metabolomics analysis, we identified 1000 participants from five centers in China (permission No. 2017-keyanlunshen-35). Of all metabolites measured, we found LPC (17:0) was negatively correlated with T2DM sign ificantly (Figure S1),7 which is consistent with Prada’s report that plasma odd-chain saturated fatty acids are inversely associated with type 2 diabetes risk.8 However, the precise role and target of LPC (17:0) in insulin resistance remains unclear. Herein, we reported the protective effect of LPC (17:0) in high-fat diet induced (HFD) mice, including body weight gain, glucose homeostasis and insulin resistance. Further, the LPC (17:0) was found to promote the expression of GPR120, GPR35 and CALCR, with potential effect on GLP-1 stimulation. The above observation revealed LPC (17:0) can be an endogenous protective factor with potential role on GPCRs.
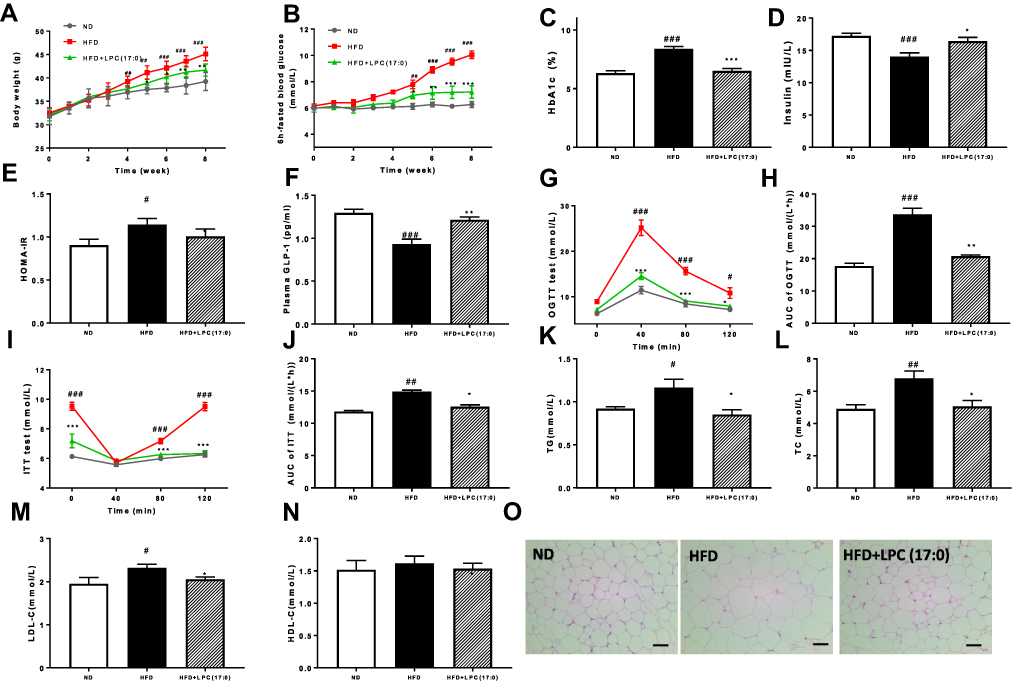 |
Figure 1 LPC (17:0) treatment alleviated glucose metabolism related disorders in HFD-fed mice. (A) Body weight, (B) 6h-fasted blood glucose, (C) HbA1c, (D) Plasma insulin, (E) HOMA-IR, (F) Plasma GLP-1, (G) OGTT and (H) AUC, (I) ITT and (J) AUC, (K) serum TG, (L) serum TC, (M) serum LDL-C, (N) serum HLD-C, (O) Representative H&E-stained pictures and distribution of adipocyte size in WAT deposits. Scale bars, 100 μm. Data are presented as the mean ± standard error of the mean (SEM); N = 7 mice per group. Statistical analysis was done using one way ANOVA followed by the Turkey post hoc test. #P < 0.05, ##P < 0.01, ###P < 0.001, compared with ND mice; *P < 0.05, **P < 0.01, ***P < 0.001 compared with HFD mice. |
Materials and Methods
Animal Care and Experiments
All procedures were performed in accordance with recommendations under the Guidance for the Care and Use of Laboratory Animals of Beijing Shijitan Hospital, Capital Medical University. The protocol was approved by the Ethics Committee of Beijing Shijitan Hospital, Capital Medical University (permission No. sjtkyll-lx-2021(4)). C57BL/6J mice were purchased from Beijing Vital River Laboratory Animal Technology Co., Ltd (Beijing, China). Mice were housed in a 12 h dark−light cycle, with the dark cycle encompassing 7 p.m. to 7 a.m., and had free access to food and water.
To prove the effect of LPC (17:0) on high-fat diet (HFD)-induced T2DM (high-fat diet: 60 kcal% fat, 20 kcal% proteins, and 20 kcal% carbohydrates, Cat. D12492i, Research Diet, New Brunswick, NJ, USA), 6-week-old C57BL/6J male mice were sorted into 3 groups (n = 7) randomly: ND group (normal diet + distilled water), HFD group (HFD diet+ distilled water), and HFD+LPC (17:0) group (HFD diet +LPC (17:0) 5 mg/kg/d), with diets orally administrated for 8 weeks.
Tissue Sampling
After treatment, animals were anesthetized with diethyl ether and blood was sampled from the portal and cava veins. After exsanguination, mice were euthanized by cervical dislocation. Serum was obtained by centrifugation at 4000 rpm for 15 min at 4°C and stored at −20°C. Intestines, liver and brain tissues were precisely dissected, weighed, immediately immersed in liquid nitrogen, and stored at −80 °C for further analysis.
Biochemical Analyses
Serum total cholesterol (TC), triglycerides (TG), low density lipoprotein cholesterol (LDL-C) and high-density lipoprotein cholesterol (HDL-C) were measured by a commercial kit (Nanjing Jiancheng Bioengineering Institute, Jiangsu, China). Serum insulin, glycated hemoglobin A1C (HbA1C), hemoglobin and glucagon-like peptide-1 (GLP-1) were determined using a commercial ELISA kit (CUSABIO, Wuhan, China) following the manufacturer’s instructions. Cyclic adenosine monophosphate (cAMP) was measured using a cAMP Assay Kit (ab138880, Abcam, USA).
Insulin Tolerance Test (ITT) and Oral Glucose Tolerance Test (OGTT)
ITT was performed by injecting insulin (0.8 U/kg) intraperitoneally after a 6 h fasting. OGTT was performed by oral administration of D-glucose (2 g/kg) after overnight fasting. The level of blood glucose was measured using a glucose meter (AccuCheck, Roche, Switzerland) before insulin or glucose load (0 min) and at 40, 80, and 120 min after insulin or glucose load. The area under the curve (AUCs) generated from the data collected during the ITT or OGTT were calculated by GraphPad 7.0.
Real-Time qPCR Analysis
Total RNA was extracted from the intestine and hypothalamus tissue with the TRIzol reagent according to the manufacturer’s protocol (Invitrogen, Carlsbad, CA, USA), Quantification analysis of total RNA were performed by running 1 uL of sample on an Agilent 2100 bioanalyzer (Agilent RNA 6000 Nano kit, Agilent). Reverse transcription was performed on 2 μg of total RNA using a cloned AMV first-strand cDNA synthesis kit (Tiangen, Beijing, China). Primers used for cDNA amplification by real-time PCR are listed in Table 1. β-actin was used as the housekeeping gene for normalization of the target genes expression. PCR reactions were performed using UltraSYBR Mixture (Low ROX) kit (CW2601M) using a QuantStudio 6 Flex Real-Time PCR Systems.
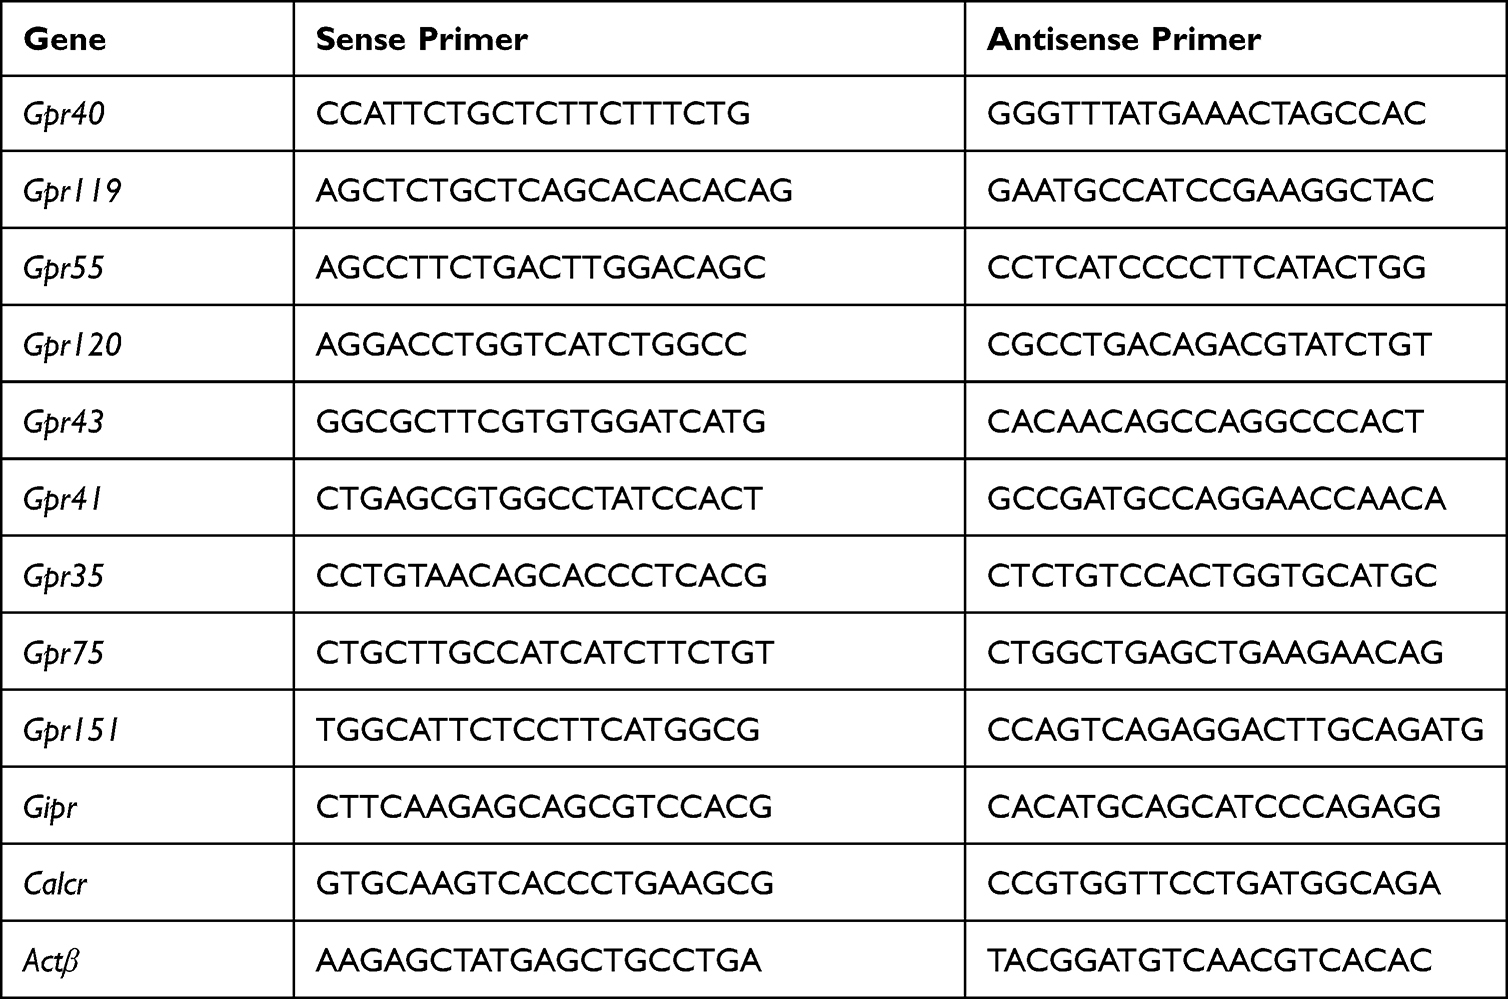 |
Table 1 Primers Used in the Study |
Western Blotting
Intestine and hypothalamus protein was extracted using RIPA lysis buffer (G2002; Servicebio) and PMSF (G2008; Beyotime). The protein amount was measured using a BCA protein assay reagent (P0012; Beyotime). Equal amounts of proteins were denatured in SDS-PAGE sample loading buffer (P0015L; Beyotime) at 37 °C for 10 min and then separated on a 10% SDS-PAGE gel and transferred onto a PVDF membrane (IPVH00010; Merck Millipore Ltd). Membranes were soaked with 5% nonfat milk in TBST (20 mM Tris·Cl, 150 mM NaCl, and 0.05% Tween-20, pH 7.4) for 1 h at room temperature. Subsequently, membranes were incubated with primary antibodies at 4°C overnight, followed by incubation with Alexa Fluor 790 goat anti-rabbit IgG H&L (1:10000; ab186697; Abcam, Cambridge, UK). Finally, fluorescent signals were collected using an Odyssey infrared imaging system (LI-COR, Lincoln, NE). The intensities of protein bands were quantified with the Image-J 1.53e software (National Institutes of Health, USA), and the values were normalized to β-tubulin (1:2000, AF7018, Affinity) or β-actin (1:2000, AF7011, Affinity). GPR35 polyclonal antibody (YT2015; 1:1000) and CALCR polyclonal antibody (YN2509; 1:1000) were purchased from ImmunoWay Biotechnology Company, and GPR120 antibody (CSB-PA002756; 1:500) and GPR151 antibody (CSB-PA007164; 1:500) were purchased from CUSABIO technology.
Statistical Analysis
All results are expressed as mean ± SEM. For multiple comparisons, statistical analysis was performed using one way or two way ANOVA followed by the Tukey’s multiple comparison test s with GraphPad 7.0.
Results
LPC (17:0) Alleviated HFD-Induced Hyperglycemia and Related Metabolic Disorders in HFD-Fed Mice
In this study, we used HFD-induced hyperglycemic mice to evaluate the anti-hypoglycemic effects for LPC (17:0). In comparison with the HFD mice, LPC (17:0) significantly improved the features of T2D and insulin resistance in the HFD-fed DIO mice, indicated by the decreasing body weight, 6h-fasted blood glucose, HbA1c level and HOMA-IR (Figure 1A–E), but it has no significant effect on the normal diet mice (Figure S2). We also observed that plasma insulin levels increased in LPC (17:0) treated mice with increased GLP-1 expression (Figure 1D and F). HFD mice displayed apparent insulin resistance (Figure 1G–J), however, in the oral glucose tolerance test (OGTT), HFD mice treated by LPC (17:0) showed decrease of blood glucose levels at 40, 80 and 120 min compared with the HFD mice (Figure 1G). The AUC of LPC (17:0) group was much lower than that in the HFD group (Figure 1H). The above insulin sensitizing effects were also proved by ITT test (Figure 1I and J), which together indicated the role of LPC (17:0) in the control of blood glucose level and insulin resistance. As shown in Figure 1K–N, compared with the normal C57BL/6J mice, the HFD-treated mice showed significant elevation in the levels of blood lipids, including TG (Figure 1K), TC (Figure 1L) and LDL-C (Figure 1M). After 8 weeks of LPC (17:0) treatment, the serum TG, TC, LDL-C concentrations were significantly lowered (P < 0.05). Moreover, the size of adipocytes in the white adipose tissue (WAT) of LPC (17:0)-treated mice was reduced, indicating the improved adipose steatosis by LPC (17:0) (Figure 1O).
LPC (17:0) Alleviated HFD-Induced Hyperglycemia Through Activated GPR151, GPR120, GPR 35 and CALCR
As reported in the references, LPCs are the natural ligand of G-Protein-coupled receptors (GPCR), such as GPR40, GPR55 and GPR119.9,10 GPR75, GPR151, GIPR and CALCR have been reported to be responsible for obesity,11 and GPR55, GPR119, GPR120, GPR40, GPR43 are closely related to insulin secretion and metabolic syndrome.12–16 Therefore, we selected 11 related genes of the GPCR family to detect their mRNA expression with qPCR technique (the primers are shown in Table 1). Quantitative expression profiling at the mRNA level showed that 2 genes (Gpr151 and Calcr) in hypothalamus and 2 genes (Gpr120 and Gpr35) in intestine of LPC (17:0) treated mice were expressed about 1.2–3-fold more than that in HFD-fed mice, respectively (Figure 2).
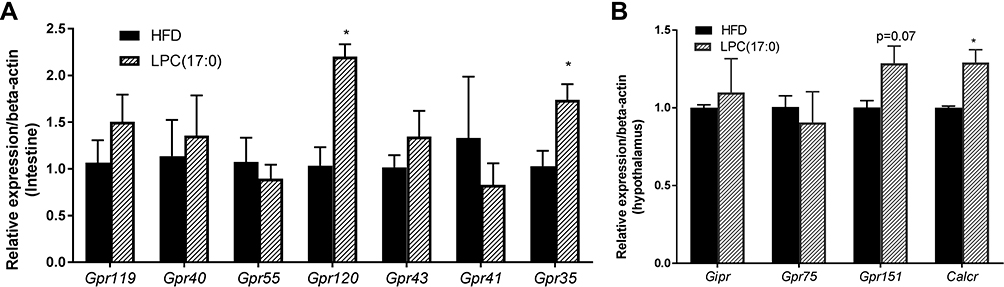 |
Figure 2 Expression of GPCR mRNAs in LPC (17:0) treated mice. (A) Expression of Gpr119, Gpr40, Gpr55, Gpr120, Gpr43, Gpr41, Gpr35 in intestine tissue, (B) Expression of Gpr75, Gpr151, Gipr and Calcr in hypothalamus tissue. Statistical analysis was done using one way ANOVA followed by Tukey post hoc test. *P < 0.05 compared with HFD mice. |
Further, we detected the expression of GPR35 and GPR120 in intestine, GPR151 and CALCR in hypothalamus using Western blotting technique. As shown in Figure 3A and B, LPC (17:0) treatment significantly increased the expression of GPR35, GPR120 and CALCR, but GPR151 did not change significantly at the protein level although the expression of Gpr151 increased at the mRNA level. GLP1 exerts its function by increasing intracellular cAMP accumulation through GPCR receptor expression.13 As mentioned in Figure 1F, LPC (17:0) can promote GLP-1 expression, therefore we measured the cAMP concentration and observed the accumulation of cAMP in the LPC (17:0) treatment group (Figure 3C). So we deduced the hypothesis that LPC (17:0) improves hyperglycemia and promotes insulin secretion through the expression of GPCR receptor.
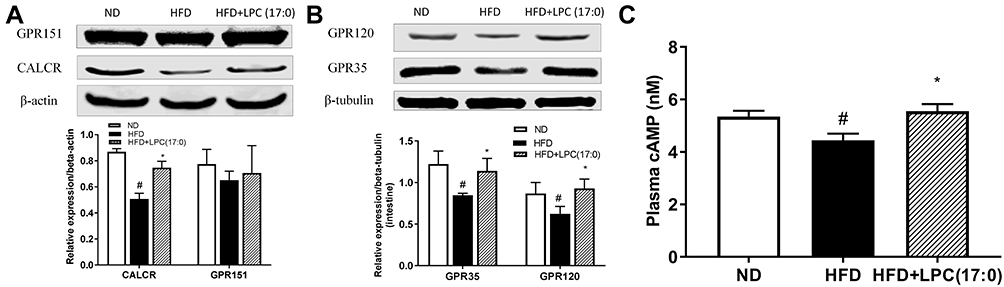 |
Figure 3 The expression of GPR120/GPR151 in intestine of mice treated with LPC (17:0) (A), and the expression of GPR35/CALCR in hypothalamus of mice treated with LPC (17:0) (B), Serum cAMP concentration (C). Statistical analysis was done using one way ANOVA followed by Tukey post hoc test. #P < 0.05 compared with ND mice; *P < 0.05 compared with HFD mice. |
Discussion
In our previous serum non-targeted metabolomics analysis, we identified 1000 participants from five centers in China (permission No. 2017-keyanlunshen-35). Of all metabolites measured, we found LPC (17:0) was negatively correlated with T2DM significantly (Figure S1B).7 Over the last decades, LPCs have shown a variety of biological functions in cellular proliferation, inflammation and glucose metabolism.17,18 For example, Yea et al reported LPC (16:0), LPC (12:0) and LPC (14:0) had a blood glucose lowering effect in STZ-induced insulin deficient mice, furthermore, they found LPC (18:0) and LPC (20:0) did not reduce the blood glucose, and they speculated that variations in the chain lengths of LPC will affect LPCs’ biological functions.19 LPC (17:0) belongs to the lysophospholipids and has an odd-number carbon long chain fatty acid, which is consistent with Prada’s report that plasma odd-chain saturated fatty acids are inversely associated with type 2 diabetes risk.8 Therefore, we mainly evaluated the effect of LPC (17:0) on hyperglycemia and related metabolic disorders in insulin resistant mice induced by high-fat diet, and further analyzed its downstreamed mechanism.
The present study provides evidence that LPC (17:0) can improve HFD-induced hyperglycemia and related metabolic disorders by lowered body weight, fasted blood glucose and HbA1c, as well as increased HOMA-IR and insulin level (Figure 1). Meanwhile, we observed the GLP-1 concentration in serum was increased; GLP-1 is an intestinal glucagon hormone secreted by L cells of the lower digestive tract, and GLP-1 receptor agonists can stimulate the secretion of insulin in a blood glucose-dependent manner,20 so we speculated that LPC (17:0) improves insulin resistance by activating GLP-1 to stimulate insulin secretion. Since LPC (18:1) was recognized as the first endogenous ligand of GPR119 to stimulate rat insulin secretion by activating GLP-1,13 LPC attracted researchers’ attention and has become an important drug target.16 In our study, we selected 11 GPCR receptors related to obesity, insulin secretion and metabolic syndrome to perform a mechanism study, and the results demonstrated that LPC (17:0) acts as a potential anti-diabetes molecule increasing GPR35, GPR120 and CALCR receptors’ expression in the intestine or hypothalamus. GPR120 has been reported to be expressed in the intestine and adipose tissue, and it was activated by the long chain fatty acid and stimulated the secretion of GLP-1 to improve insulin resistance.15 CALCR was reported to be associated with lower BMI; it is expressed in the hypothalamus, responsible for satiety, delayed gastric emptying and weight control.11 Our results also showed LPC (17:0) can increase CALCR expression, which suggested that LPC (17:0) can reduce body weight by promoting the expression of CALCR and inhibiting appetite (Figure S3). cAMP is the second messenger of GPCR, when exogenous substances activated GPCR receptors, intracellular cAMP concentration increased and further regulated downstream signal transduction. In our study, we also observed the accumulation of cAMP; combined with the previous GLP1 elevation and increased insulin secretion, we deduced that GLP1 promoted insulin secretion by increasing intracellular cAMP accumulation through GPCR receptor expression.13 Activation of GPR40, GPR55, GPR119 and GPR120 by LPCs has been reported to potentiate insulin secretion, but their research objects were LPC (12:0), LPC (14:0), LPC (16:0), LPC (18:0) and LPC (18:1), which bear the even-number carbon long chain fatty acid.9 However, as we did not see an increase of GPR55/GPR119/GPR40 expression in our experiment, we speculate that there may be differences between the LPCs bearing odd or even number carbon chain in the activation of GPCRs. We will continue to solve this problem in a future in-depth study.
Conclusion
In conclusion, our study demonstrated that LPC (17:0) is a potent drug candidate or health food additive for insulin resistance and hyperglycemia, which is indicated by reducing weight gain, lowering HbA1c level, and improving insulin resistance, lipid dysfunction. And it can activate GLP-1 by increasing the expression of GPR355/GPR120/CALCR, thus promoting insulin secretion. We hope that our research will help people to have a deeper understanding of the effect of LPC (17:0) and recognize the unique biological mechanism of LPC bearing an odd-number carbon long chain fatty acid.
Acknowledgments
This work was supported by the National Natural Science Foundation of China (grant number 82073741).
Disclosure
The authors report no conflicts of interest in this work.
References
1. Parvez Hossain MD, Bisher Kawar MD, El Nahas M. Obesity and diabetes in the developing world - a growing challenge. New Engl J Med. 2007;356(3):213–215. doi:10.1056/NEJMp068177
2. Rines AK, Sharabi K, Tavares CDJ, et al. Targeting hepatic glucose metabolism in the treatment of type 2 diabetes. Nat Rev Drug Discov. 2016;15:786–804. doi:10.1038/nrd.2016.151
3. Després JP, Lemieux I, Alméras N. Abdominal obesity and the metabolic syndrome. In: Bray GA, Ryan DH, editors. Overweight and the Metabolic Syndrome, Endocrine Updates. Boston, MA: Springer; 2006:137–152.
4. Ghislain J, Poitout V. Targeting lipid GPCRs to treat type 2 diabetes mellitus - progress and challenges. Nat Rev Endocrinol. 2021;17:162–175. doi:10.1038/s41574-020-00459-w
5. Velazquez-Villegas LA, Perino A, Lemos V, et al. TGR5 signalling promotes mitochondrial fission and beige remodelling of white adipose tissue. Nat Commun. 2018;9:245. doi:10.1038/s41467-017-02068-0
6. Li E, Shan H, Chen L, et al. OLFR734 mediates glucose metabolism as a receptor of asprosin. Cell Metab. 2019;30:319–328. doi:10.1016/j.cmet.2019.05.022
7. Long JL, Yang H, Yang ZR, et al. Integrated biomarker profiling of the metabolome associated with impaired fasting glucose and type 2 diabetes mellitus in large-scale Chinese patients. Clin Transl Med. 2021;11(6):e432. doi:10.1002/ctm2.432
8. Prada M, Wittenbecher C, Erichelmann F, Wernitz A, Drouin-Chartier JP, Schulze MB. Association of the odd-chain fatty acid content in lipid groups with type 2 diabetes risk: a targeted analysis of lipidomics data in the EPIC-Potsdam cohort. Clin Nutr. 2021;40:4988–4999. doi:10.1016/j.clnu.2021.06.006
9. Drzazga A, Kristinsson H, Sałaga M, et al. Lysophosphatidylcholine and its phosphorothioate analogues potentiate insulin secretion via GPR40 (FFAR1), GPR55 and GPR119 receptors in a different manner. Mol Cell Endocrinol. 2018;472:117–125. doi:10.1016/j.mce.2017.12.002
10. Drzazga A, Sowinska A, Krzeminska A, et al. 2-OMe-lysophosphatidylcholine analogues are GPR119 ligands and activate insulin secretion from βTC-3 pancreatic cells: evaluation of structure-dependent biological activity. Biochim Biophys Acta Mol Cell Biol Lipids. 2018;1863:91–103. doi:10.1016/j.bbalip.2017.10.004
11. Akbari P, Gilani A, Sosina O, et al. Sequencing of 640,000 exomes identifies GPR75 variants associated with protection from obesity. Science. 2021;373:eabf8683. doi:10.1126/science.abf8683
12. Liu B, Song SS, Ruz-Maldonado I, et al. GPR55-dependent stimulation of insulin secretion from isolated mouse and human islets of Langerhans. Diabetes Obes Metab. 2016;18:1263–1273. doi:10.1111/dom.12780
13. Soga T, Ohishi T, Matsui T, et al. Lysophosphatidylcholine enhances glucose-dependent insulin secretion via an orphan G-protein-coupled receptor. Biochem Bioph Res Co. 2005;326:744–751. doi:10.1016/j.bbrc.2004.11.120
14. Overton HA, Fyfe MCT, Reynet C. GPR119, a novel G protein-coupled receptor target for the treatment of type 2 diabetes and obesity. Brit J Pharmacol. 2008;153:S76–S81. doi:10.1038/sj.bjp.0707529
15. Abdel-Magid AF. Therapeutic potential of GPR120 agonists for the treatment of type 2 diabetes. ACS Med Chem Lett. 2015;6:1097–1098. doi:10.1021/acsmedchemlett.5b00392
16. Gendaszewska-Darmach E, Drzazga A, Koziołkiewicz M. Targeting GPCRs activated by fatty acid-derived lipids in type 2 diabetes. Trends Mol Med. 2019;25:915–929. doi:10.1016/j.molmed.2019.07.003
17. Murugesan G, Sandhya Rani MR, Gerber CE, et al. Lysophosphatidylcholine regulates human microvascular endothelial cell expression of chemokines. J Mol Cell Cardiol. 2003;35:1375–1384. doi:10.1016/j.yjmcc.2003.08.004
18. Wang L, Radu CG, Yang LV, et al. Lysophosphatidylcholine-induced surface redistribution regulates signaling of the murine G protein-coupled receptor G2A. Mol Biol Cell. 2005;16:2234–2247. doi:10.1091/mbc.e04-12-1044
19. Yea K, Kim J, Yoon JH, et al. Lysophosphatidylcholine activates adipocyte glucose uptake and lowers blood glucose levels in murine models of diabetes. J Biol Chem. 2009;284:33833–33840. doi:10.1074/jbc.M109.024869
20. Drucker DJ, Habener JF, Holst JJ. Discovery, characterization and clinical development of the glucagon-like peptides. J Clin Invest. 2017;127:4217–4227. doi:10.1172/JCI97233
 © 2022 The Author(s). This work is published and licensed by Dove Medical Press Limited. The
full terms of this license are available at https://www.dovepress.com/terms
and incorporate the Creative Commons Attribution
- Non Commercial (unported, 3.0) License.
By accessing the work you hereby accept the Terms. Non-commercial uses of the work are permitted
without any further permission from Dove Medical Press Limited, provided the work is properly
attributed. For permission for commercial use of this work, please see paragraphs 4.2 and 5 of our Terms.
© 2022 The Author(s). This work is published and licensed by Dove Medical Press Limited. The
full terms of this license are available at https://www.dovepress.com/terms
and incorporate the Creative Commons Attribution
- Non Commercial (unported, 3.0) License.
By accessing the work you hereby accept the Terms. Non-commercial uses of the work are permitted
without any further permission from Dove Medical Press Limited, provided the work is properly
attributed. For permission for commercial use of this work, please see paragraphs 4.2 and 5 of our Terms.