Back to Journals » Journal of Hepatocellular Carcinoma » Volume 9
LRP1B is a Potential Biomarker for Tumor Immunogenicity and Prognosis of HCC Patients Receiving ICI Treatment
Authors Cheng Y, Tang R, Li X, Wang B, Cheng Y, Xiao S ![]() , Sun P, Yu W, Li C, Lin X, Zhu Y
, Sun P, Yu W, Li C, Lin X, Zhu Y
Received 11 November 2021
Accepted for publication 5 March 2022
Published 22 March 2022 Volume 2022:9 Pages 203—220
DOI https://doi.org/10.2147/JHC.S348785
Checked for plagiarism Yes
Review by Single anonymous peer review
Peer reviewer comments 3
Editor who approved publication: Dr Ahmed Kaseb
Yang Cheng,1,2,* Rui Tang,1,* Xiangzhao Li,3 Biao Wang,4 Yanling Cheng,1 Shuzhe Xiao,1 Penghui Sun,5 Wenxuan Yu,2 Cheng Li,2 Xinsheng Lin,2 Yun Zhu2,*
1Digestive Department, Guangzhou Women and Children’s Medical Center, Guangzhou Medical University, Guangzhou, Guangdong, People’s Republic of China; 2Liver Tumor Center, Department of Infectious Diseases and Hepatology Unit, Nanfang Hospital, Southern Medical University, Guangzhou, Guangdong, People’s Republic of China; 3Department of Pathology, Nanfang Hospital, Southern Medical University, Guangzhou, Guangdong, People’s Republic of China; 4Department of Hepatobiliary Surgery, Nanfang Hospital, Southern Medical University, Guangzhou, Guangdong, People’s Republic of China; 5Nanfang PET Center, Nanfang Hospital, Southern Medical University, Guangzhou, Guangdong, People’s Republic of China
*These authors contributed equally to this work
Correspondence: Yun Zhu, Liver Tumor Center, Department of Infectious Diseases and Hepatology Unit, Nanfang Hospital, Southern Medical University, Guangzhou, Guangdong, 510515, People’s Republic of China, Email [email protected]
Background: New predictors of the efficacy of hepatocellular carcinoma (HCC) immunotherapy are needed. The ability of a single gene mutation to predict the therapeutic effect of immune checkpoint inhibitors (ICI) in HCC remains unknown.
Methods: The most frequently mutated genes in HCC were analyzed using the Cancer Genome Atlas (TCGA) and International Cancer Genome Consortium (ICGC) datasets. Mutant genes that correlated with the tumor mutational burden (TMB) and prognosis were obtained. The mutation pattern and immunological function of one of the most frequently mutated genes, LRP1B, were determined. A pan-tumor analysis of LRP1B expression, association with cancer prognosis, and immunological role was also explored. A retrospective clinical study was conducted using 102 HCC patients who received ICI treatment to further verify whether gene mutations can predict the effectiveness of immunotherapy and prognosis of HCC.
Results: LRP1B is among the most frequently mutated genes in HCC cohorts in TCGA and ICGC datasets. TCGA data showed that the LRP1B mutation activated immune signaling pathways and promoted mast cell activation. Patients with LRP1B mutations had significantly higher TMB than those with wild-type LRP1B. LRP1B expression correlated with the cancer-immunity cycle and immune cell infiltration. High LRP1B expression was also associated with poor survival among HCC patients. Results from the clinical study showed that HCC patients in the LRP1B mutation group had a poor response to ICI and worse prognosis than the wild-type group. The LRP1B mutation group had significantly higher TMB and mast cell infiltration in tumor tissues.
Conclusion: This study is the first to report that a single gene LRP1B mutation is associated with a poor clinical response to ICI treatment and negative outcomes in HCC patients. HighLRP1B expression correlated with tumor immunity and HCC prognosis.
Keywords: LRP1B mutation, ICI treatment response, prognosis, HCC, TMB
Introduction
Hepatocellular carcinoma (HCC) is the third leading cause of cancer death worldwide. The prevalence of HCC is increasing globally, resulting in at least 600,000 deaths annually.1 Over 80% of HCC patients have lost the opportunity for curative treatment by the time they are diagnosed. As a result, the treatment of advanced HCC remains a major challenge to healthcare worldwide.2
Studies suggest that immunotherapy may be an effective treatment approach for HCC. While anti-programmed cell death protein-1 (PD1) antibodies as immune checkpoint inhibitors (ICI) have shown promise in HCC treatment, only a subset of patients is responsive.3,4 In addition, ICI treatment has a number of side effects, some of which can be life-threatening. Thus, it is important to identify markers that can predict the efficacy of ICI treatment for HCC.
Tumor mutation burden (TMB) and PD-L1 are the most commonly used biomarkers to predict response to immunotherapy and both require the detection of tumor tissue. Liver cancer is the only solid tumor that can be diagnosed clinically and obtaining tumor tissue for molecular testing causes trauma and increases the risk of bleeding in patients with advanced tumors. Therefore, it is particularly important to find non-invasive predictive molecules that can identify HCC patients who may benefit from immunotherapy.
The low-density lipoprotein receptor-related protein 1B (LRP1B) encodes an endocytic LDL-family receptor. LRP1B binds to multiple extracellular ligands, including fibrinogen and apoE carrying lipoproteins and may participate in extracellular ligand scavenging. This protein may also modulate the tumor microenvironment and cellular drug uptake.5 LRP1B expression is positively correlated with ten immune cell marker genes and there is evidence that it may act as a tumor suppressor.6 LRP1B is among the most commonly mutated genes in tumors, and alterations are shown to impact antigen processing pathways.7 LRP1B mutations also have a functional impact on tumorigenesis. Indeed, a deletion mutation of LRP1B is associated with poor prognosis of glioblastoma patients.8 LRP1B mutations are also implicated in the development and progression of multiple myeloma in Chinese Han populations,9 and associated with TMB and prognosis of lung cancer and melanoma patients.10,11 Moreover, LRP1B mutations are associated with favorable outcomes to ICI treatment of multiple cancer types.12 LRP1B serves as a mediator of lipid metabolism in HCC,13 and is one of 20 recurrent hepatitis B virus (HBV) targeted genes in HBV infected HCC patients.14 However, knowledge about the relationship between LRP1B and HCC prognosis remains limited.
This study showed that LRP1B is one of the most frequently mutated genes in HCC. The molecular characterization and immunological characteristics of LRP1B mutation and expression were comprehensively analyzed using TCGA data. The correlation between LRP1B mutation and both TMB and disease prognosis was assessed. A retrospective clinical study of the LRP1B mutation and both ICI treatment response and HCC prognosis was conducted to validate the findings.
Methods
Data Acquisition and Analysis
Pan-cancer RNA sequencing (RNA-seq) (FPKM value), somatic mutation, and survival data from TCGA were downloaded from the UCSC Xena data portal.15 Gene mutation and expression data from Chinese HCC patients (n=351) were downloaded from the ICGC portal (http://dcc.icgc.org/ releases/current/Projects). Data on LRP1B expression in normal tissues were downloaded from the Genotype-Tissue Expression (GTEx) project and data on LRP1B expression in cancer cell lines were downloaded from the Cancer Cell Line Encyclopedia (CCLE) project. TMB was defined as the number of somatic, coding, indels, and base substitutions per megabase of genome detected. Mutations without amino acid changes were filtered out.
Molecular Characterization of LRP1B Mutation and Expression
Differentially expressed gene (DEG) analysis was performed using the “DESeq2” R package with the standard comparison mode.16 Gene Ontology (GO) annotation (http://www.geneontology.org/) and Kyoto Encyclopedia of Genes and Genomes (KEGG) pathway enrichment analysis were used to explore the biological functions and pathways associated with the DEGs.17 All of these analyses were performed as described previously using DAVID (https://david.abcc.Ncifcrf.gov/).18 Gene Set Enrichment Analysis (GSEA) (http://software.broadinstitute.org/gsea/index.jsp) was used to define the pathways enriched in the gene rank involved in different groups.19 All hallmark gene sets with significant enrichment were displayed. Gene set variation analysis (GSVA) was conducted to investigate how biological processes changed between different LRP1B expression or mutation patterns using the GSVA R package.20 The biological signatures were derived from the hall marker gene set downloaded from the Molecular Signatures Database database (MSigDB, http://software.broadinstitute.org/gsea/msigdb/index.jsp) v7.1.21 A P-value < 0.05 was set as the cutoff for statistical significance.
Evaluation of the Immunological Characteristics of LRP1B
A single sample gene set enrichment analysis (ssGSEA) based on the gene expression of individual samples was used to evaluate the activity of the cancer-immunity cycle steps.22 The abundance of six tumor-infiltrating immune cells (TIICs) subtypes in tumors was calculated using the Tumor Immune Estimation Resource (TIMER), an algorithm for predicting the degree of immune infiltration.23
Immune Cell Profiles Analysis Using CIBERSORT
Samples containing both mutation and transcriptome data were used for immune cell analysis using the CIBERSORT database (https://cibersort.stanford.edu/index.php) which accurately quantifies the relative levels of 22 distinct immune cell subtypes in a complex gene expression mixture.24 The relative proportion of various immune cell types was calculated, and samples with P<0.05 were selected. From all the samples analyzed, 32/6 wild type/mutant samples met the CIBERSORT requirements of a p-value <0.05, respectively. In the difference analysis, a t-test was used to analyze differences in the immune profile score between the wild-type and mutant groups.
Quantification of the Immune Response Predictor
The immunophenoscore (IPS) is a predictor of the response to ICI treatment.25 The scoring scheme was developed from immune-related genes associated with effector cells, immunosuppressive cells, checkpoints or immunomodulators, and MHC molecules. The IPS of HCC patients was determined from The Cancer Immunome Atlas (TCIA) (https://tcia.at/home). The Tumor Immune Dysfunction and Exclusion (TIDE) score was performed to model distinct tumor immune evasion mechanisms using the TIDE database(http://tide.dfci.harvard.edu).26 The Estimation of Stromal and Immune Cells in Malignant Tumors using Expression Data (ESTIMATE) algorithm27 was performed to predict the level of infiltrating immune and stromal cells based on the immune and stromal score, and the estimated score of each sample.
Prediction of the Chemotherapeutic Response
The chemotherapeutic response for patients in the LRP1B mutant and wild-type subgroups was predicted based on the largest publicly available pharmacogenomics database, the Genomics of Drug Sensitivity in Cancer (GDSC) (https://www.cancerrxgene.org/). The response of 183 small molecular targeted drugs was forecasted and the prediction process was conducted using the “pRRophetic” R package. The half-maximal inhibitory concentration (IC50) of the samples was estimated.28
Methylation Analysis
The SMART database (http://www.bioinfo-zs.com/smartapp/) was used to compare the degree of methylation between different groups.29 Distribution of methylation sites in the LRP1B gene in various tumor types was provided. Pan-tumor analysis of LRP1B methylation was compared between tumor and normal tissues. Microsatellite instability (MSI) data were collected from the study by Bonneville et al.30 Pan-tumor analysis of the correlation between LRP1B and DNA methyltransferase expression as well as expression of mismatch repairs (MMRs) in HCC was conducted using TCGA expression profile data. The methylation levels of LRP1B in HCC patients with wild-type and mutant LRP1B was also assessed.
Retrospective Clinical Study Design
The clinical study was approved by the Ethics Committee of Nanfang Hospital, and all patients provided written informed consent. A total of 102 HCC patients with complete Medical records and prognosis data who received ICI treatment from Jan 2018 to Aug 2020 were enrolled. Clinical data are shown in Table 1. The patients received an average of 9 cycles of ICI treatment with a mean follow-up duration of 14 months. The efficacy of treatment was evaluated every 4–8 weeks. Of the patients, 20 received mono treatment with anti-PD-1 antibody, and 82 received combination treatment with anti-PD-1 antibody and molecular targeted therapy with sorafenib, lenvatinib, or apatinib. Samples of peripheral blood and liver tumor tissue were collected. Pathology data is shown in Supplementary Table S1. Objective response rates (ORR) were measured according to RECIST, version 1.1. Progression-free survival (PFS), overall survival (OS), and duration of response were recorded.
 |
Table 1 Clinical Characteristic and Treatment Response of Patients in the Retrospective Cohort Study |
Whole Exon Sequencing of HCC Patients and TMB Analysis
Somatic mutation of the 102 HCC patients was detected by whole exon sequencing of peripheral blood. Single nucleotide variants (SNV) and indel variants were detected. Variant sites were annotated using ANNOVAR software.31 Mutations were detected using the Novaseq 6000 Platform. Patients were divided into two groups based on LRP1B mutation status. Survival analyses of the two groups was performed using Kaplan-Meyer’s curves. For TMB analysis, the encoding area length of the bed file (bed-length) was calculated and the population allele mutation with a mutation frequency >0.05 was filtered. TMB was determined by the number of mutations/bed-length.
Assessment of Tumor-Infiltrating Mast Cells in HCC Tissue
Mast cell infiltration in tumor tissue was detected in 47 patients using immunohistochemistry with anti-mast cell tryptase antibody (Abcam) as described previously.32 Images were captured and processed using Image-Pro. Mast cell count was performed independently by two investigators.
Statistical Analysis
Statistical analyses were performed using SPSS 24.0 and GraphPad Prism 5.0 software (San Diego, CA, USA). Kaplan-Meier analysis was used to determine the association between gene mutations and prognosis and evaluated using the Log rank test. An unpaired t-test was performed to analyze the correlation between mutant genes and TMB. Correlation between immune cell subtypes was calculated using Pearson correlation coefficients. Univariate and multivariate Cox regression analyses were used to assess the association of different patient characteristics, including gender, age, AFP level, BCLC stage, treatment strategy, and LRP1B mutation, on survival. For comparisons between individual data, a two-tailed p-value <0.05 was considered statistically significant.
Results
Landscape of Gene Mutations in HCC Patients
Mutation patterns of American HCC patients in the TCGA database (n=331) and Chinese HCC patients in the ICGC database (n=351) were analyzed. The frequency and patterns of the top 30 most common mutant genes were shown in Figure 1A and B. The five most frequently mutated genes in HCC samples were TP53, TTN, CTNNB1, MUC16, and ALB in the TCGA database, and TP53, TTN, MUC16, IGFN1, and AHNAK2 in the ICGC database. There were 13 overlapping genes in the top 30 mutant genes in both the TCGA and ICGC databases, TP53, TTN, TNN, MUC16, PCLO, APOB, LSMD3, FLG, OBSCN, USH2A, ADGRV1, RYR3, and LRP1B (Figure 1C). Patients with mutations in TNN, APOB, FLG, LRP1B, OBSCN, USH2A, ADGRV1, and RYR3 had a significantly higher TMB (Figure 1D). Kaplan-Meier analysis showed that LRP1B mutations were the only ones associated with a significantly poor HCC prognosis (Figure 1E).
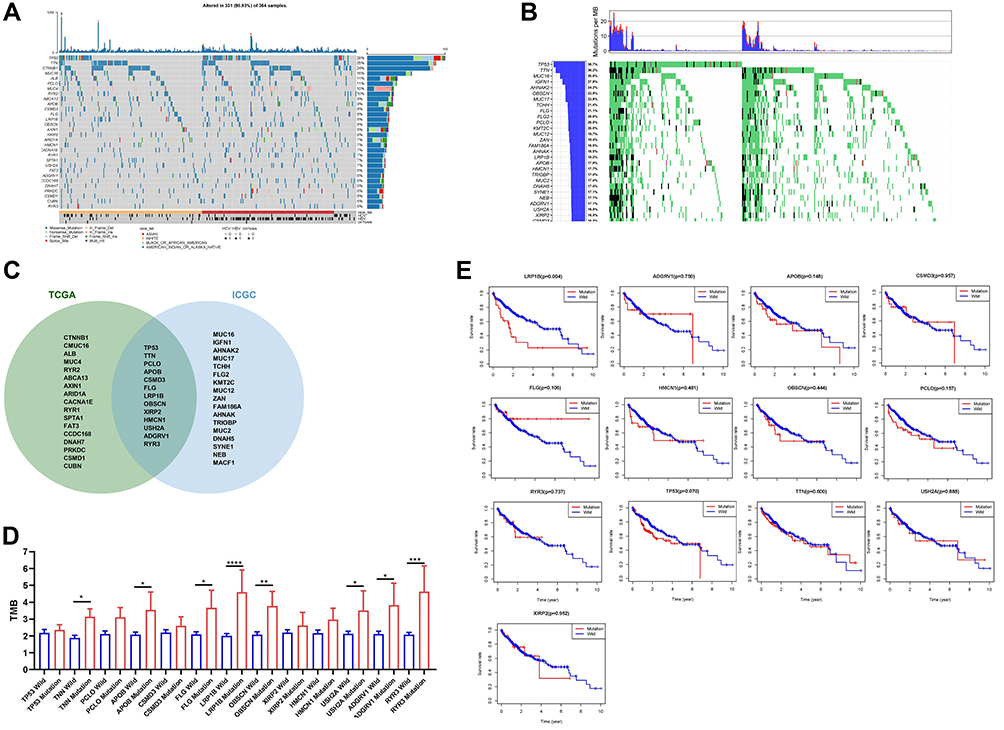 |
Figure 1 Mutation patterns and survival analysis of commonly mutated genes. (A)Mutation patterns of the top 30 most common mutant genes among HCC patients in the TCGA and ICGC (B). Mutation types are summarized by color-coding. Clinical features are displayed at the bottom. (C) The Venn diagram shows the number of commonly mutated genes found in the TCGA data, ICGC data, or both. (D) TMB in the gene mutant and wild-type groups in HCC. *P<0.5; **P<0.01; ***P<0.001; ****P<0.0001. (E) Survival analysis of HCC patients with gene mutations (n=331). |
LRP1B Mutation Analysis in HCC
LRP1B gene mutations were analyzed in 33 tumor types from the TCGA (Supplementary Figure S1). Somatic mutations of LRP1B were found in 7.97% of liver hepatocellular carcinoma (LIHC). An LRP1B mutation map was also analyzed using the cbioportal database where the mutation frequency in liver cancer reached 11% (Figure 2A). In the ICGC database, the mutation frequency of LRP1B was 18% in liver cancer indicating that LRP1B mutations were even common in Chinese than Western patients (Figure 1B). Missense mutations, splice mutations, truncating mutations, amplification, and deep deletions in LRP1B have been observed in liver cancers.
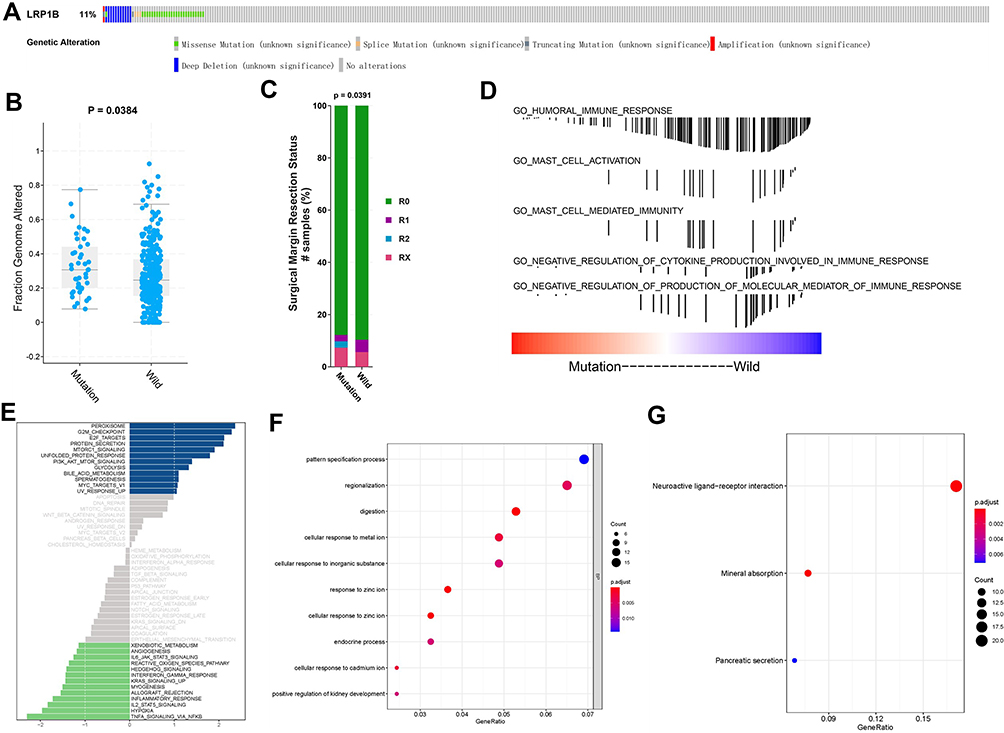 |
Figure 2 LRP1B mutation analysis. (A) Mutation map of LRP1B in the cbioportal database. (B) The percentage of genome changes in the LRP1B mutant and wild-type samples. (C) The relationship between gene mutations and surgical resection status. (D) GSEA of the LRP1B mutation. (E) GSVA of the LRP1B mutation. Blue bars represent the up-regulated signaling pathways, green bars represent the down-regulated signaling pathways, and gray bars represent signaling pathways with insignificant differences. (F and G) GO and KEGG analysis of the DEGs between the LRP1B mutant and wild-type groups. |
The percentage of genome changes was also significantly higher in LRP1B mutant samples than wild-type samples (Figure 2B). This suggests that the mutation of LRP1B in liver cancer can be related to more genomic mutations.
Surgical resection status in patients with or without LRP1B mutations was explored. The R0 resection rate was lower in the mutant than in the wild-type group and while the mutant group included patients with R2 resection, there were no patients with R2 resection in the wild-type group (Figure 2C). These findings suggest that tumors in the mutant group may be more aggressive and have a higher rate of recurrence.
GSEA showed that the LRP1B mutation was associated with humoral immune activation, mast cell activation, mast cell-mediated immunity, negative regulation of cytokine production, and production of molecular immune mediators (Figure 2D). GSVA of the LRP1B mutation was conducted (Figure 2E). GO and KEGG analysis for DEGs in the LRP1B mutant and wild-type groups is shown in Figure 2F and G. The heatmap and volcano map for the DEGs in the two groups is shown in Supplementary Figure S2. These findings indicated that the LRP1B mutation correlates with negative regulation of tumor immunity in HCC.
Correlation Between the LRP1B Mutation and HCC Immune Status
Expression of immune checkpoint molecules and immunomodulators such as MHC, chemokines, and chemokine receptors were assessed in HCC. There were no significant differences in the expression of immune checkpoint molecules and the majority of immunomodulators between the LRP1B mutation and wild-type groups (Figure 3A and Supplementary Figure S3A–C). The activity of the tumor-immunity cycle helps to assess the direct comprehensive performance of the chemokine system and other immune modulator.22,33 No significant differences were observed in steps of the cancer-immunity cycle between the LRP1B mutant and wild-type groups in HCC (Figure 3B). In addition, there were no significant differences in TIDE and IPS scores between the two groups (Supplementary Figure S3D and E) which indicated that there is no association between LRP1B mutation and TIDE/IPS scores.
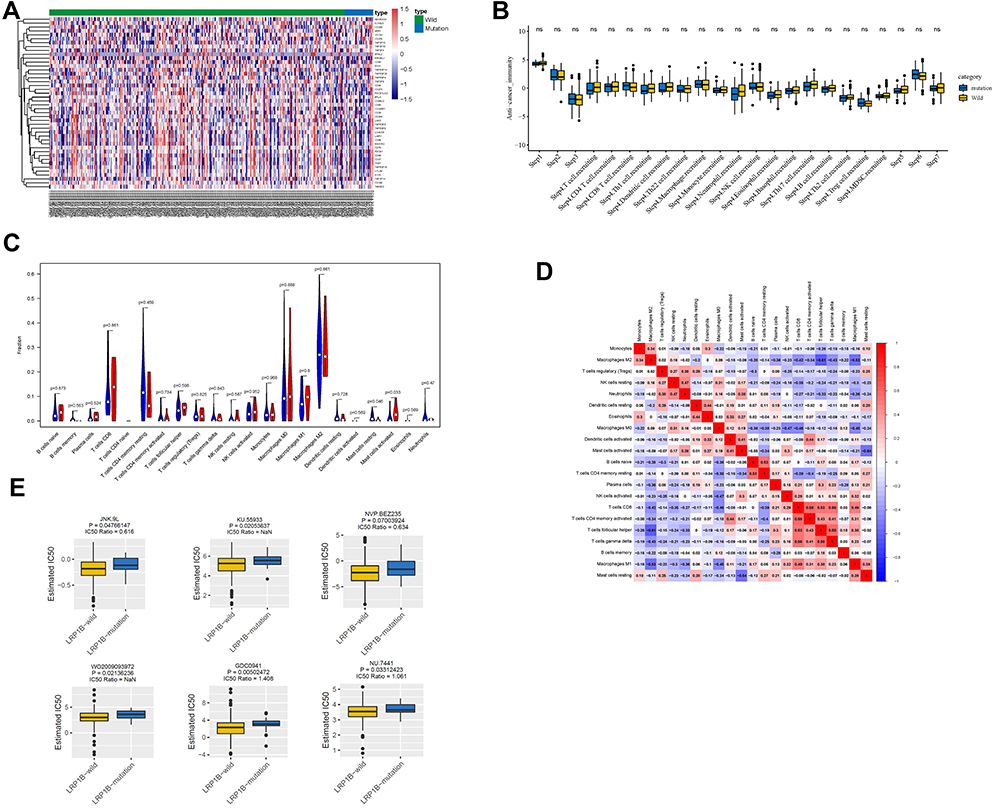 |
Figure 3 LRP1B mutation and immune status in HCC. (A) Heat map of immune checkpoint molecules expression in HCC. (B) Differences in various steps of the cancer-immunity cycle between the LRPB mutant and wild-type groups in HCC. (C) Violin plot of the differentially expressed TIICs in the LRBP1-mutant and wild-type groups in HCC. The blue color represents the wild-type group, and the red color represents the LRBP1-mutant group. (D) Immune cell correlation matrix. Red represents a positive correlation, and blue represents a negative correlation. (E) The sensitivity of small molecule drugs for the LRP1B mutant and wild-type groups in the GDSC database. |
The association between the LRP1B mutation and TIICs was evaluated using the CIBERSORT algorithm. The composition of 22 immune cell subtypes is shown in Supplementary Figure S3F. Activated mast cells were significantly enriched in the LRP1B mutant group while resting mast cells were significantly higher in the wild-type group (Figure 3C). The correlation matrix of immune cell proportions showed that mast cell activation was positively correlated with dendritic cell activation, and negatively correlated with resting memory CD4+ T cells. In addition, resting mast cell were positively correlated with the proportion of macrophages M1 (Figure 3D). The chemotherapy response of the two subgroups was also forecasted. Drug susceptibility prediction using GDSC showed that six chemotherapy drugs had a significantly lower IC50 in the LRP1B mutant group than the wild-type group (Figure 3E and Supplementary Figure S4). These findings suggested that the LRP1B mutation in HCC was associated with increased mast cell activation and reduced the sensitivity of some targeted small-molecule drugs.
Expression Pattern of LRP1B and Prognostic Significance
Comprehensive analysis of TCGA and GTEx expression database showed that LRP1B was differentially expressed in tumor and normal tissues in most tumor types (Figure 4A and Supplementary Figure S5A and B). LRP1B was widely expressed in various cancer cell lines, including HCC cell lines from the CCLE database (Supplementary Figure S5C). LRP1B expression was significantly higher in liver tumor tissues than normal tissues, although the level was relatively low. Chi-square analysis showed no correlation between LRP1B expression and demographic or clinical characteristics including age, gender, TNM stage, metastasis, and pathology grade in 273 HCC patients from the TCGA dataset (Table 2). GSEA showed that high LRP1B expression was enriched in ribosomes in HCC (Figure 4B). GSVA in addition to GO and KEGG analysis for the DEGs between LRP1B high and low expression groups were conducted (Figure 4C–G). LRP1B expression correlated with increased receptor regulatory and receptor-ligand activity and a lower unfolded protein response.
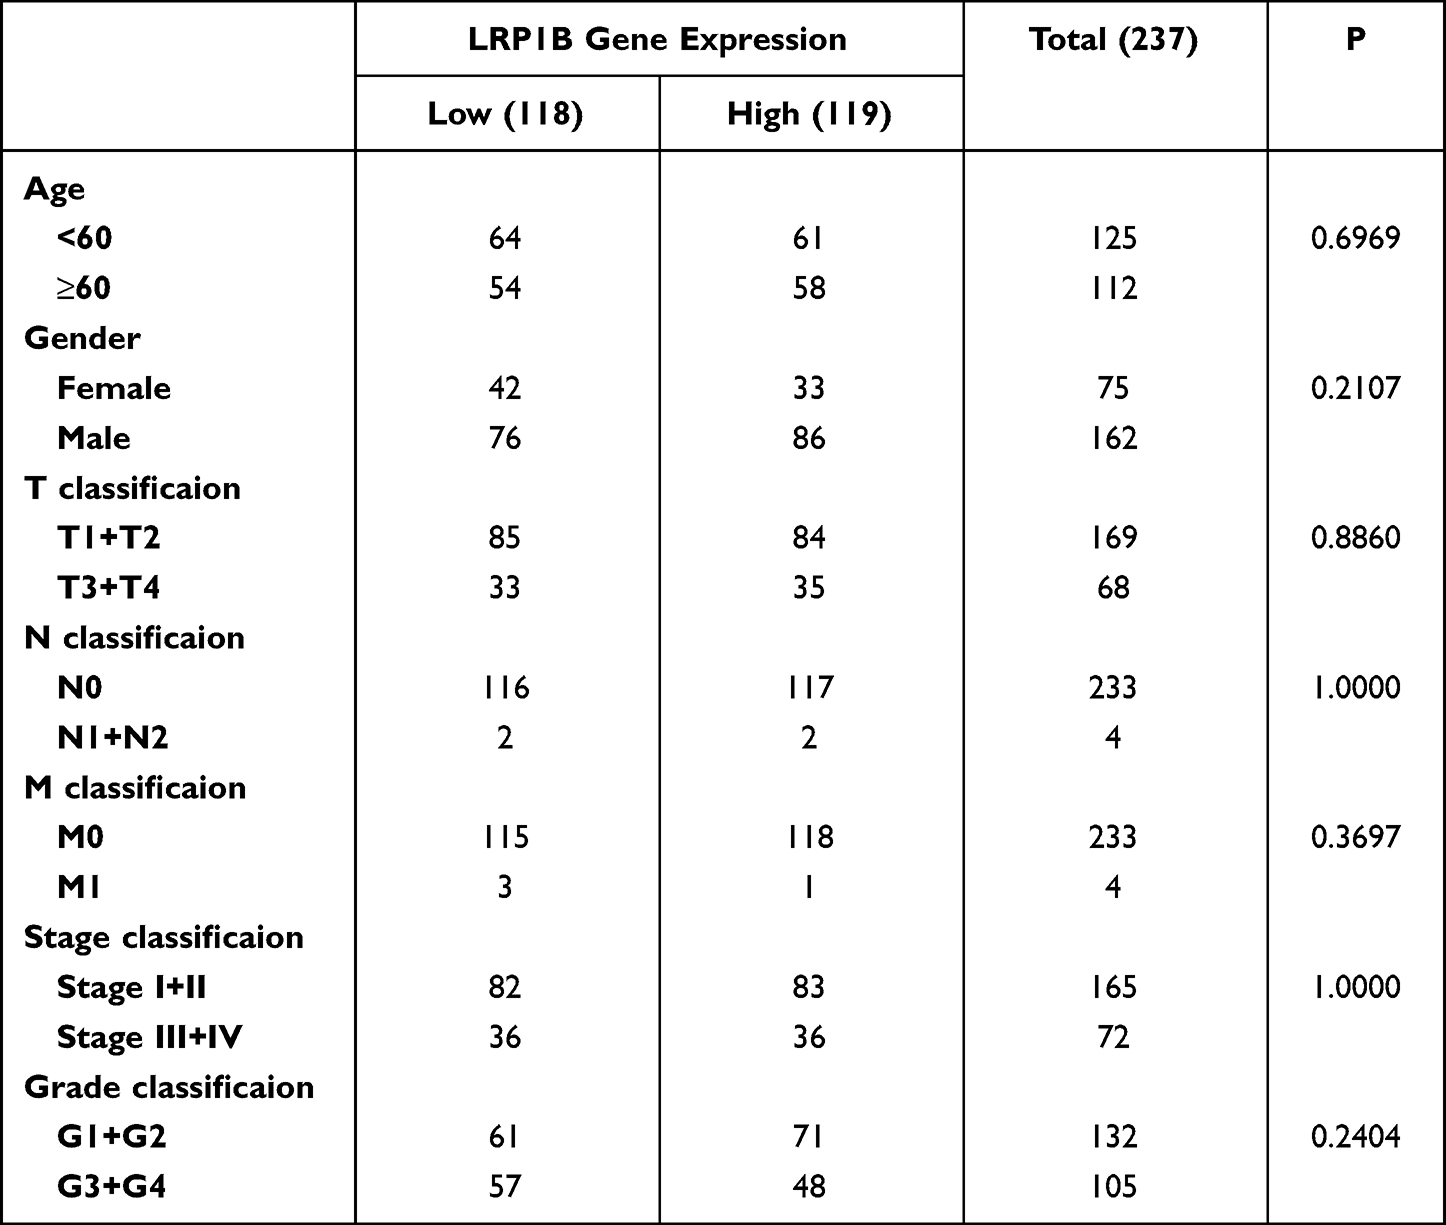 |
Table 2 Association Between Clinicopathological Parameters and LRP1B Gene Expression |
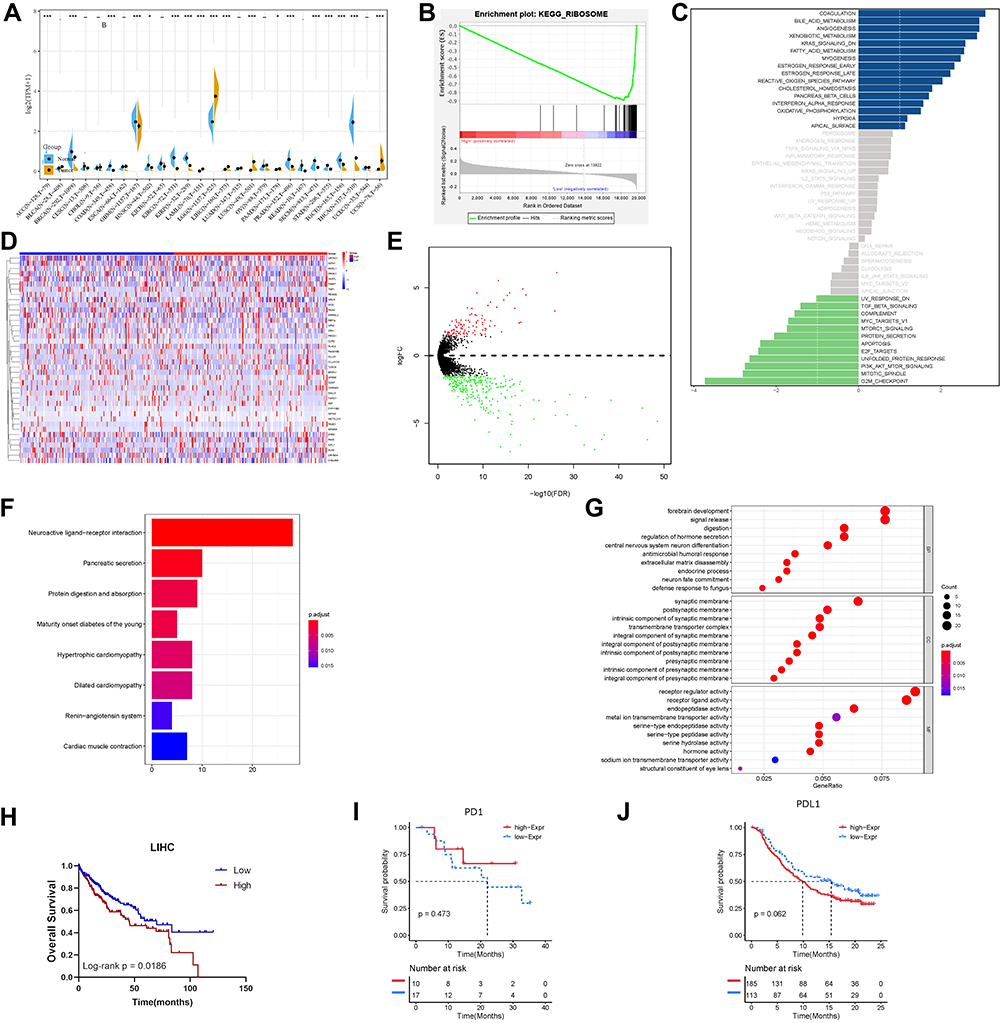 |
Figure 4 Expression pattern of LRP1B and prognostic significance. (A) Integrated analysis for LRP1B expression in tumor and normal tissues in different cancer types using TCGA and GTEx data. (B) GSEA analysis of LRP1B expression in HCC. (C) GSVA of LRP1B expression in HCC. (D) Heatmap for the top 40 DEGs between high and low LRP1B expression groups. (E) Volcano map of DEGs in the high and low LRP1B expression groups. (F) KEGG analysis showing the most activated pathways for LRP1B expression. (G) GO analysis showing the top ten enriched biological processes (BP), cellular components (CC), and molecular functions (MF) in HCC. (H) Survival analysis for the OS in HCC patients with LRP1B high or low expression using TCGA data. (I and J) The OS of HCC patients treated with anti-PDL1 or anti-PDL1 antibodies using TCGA data. *P<0.05, ***P<0.001. |
A pan-cancer survival analysis was conducted to explore the prognostic value of LRP1B expression. The high LRP1B expression group had significantly longer low-grade glioma (LGG) and prostate adenocarcinoma (PRAD) survival time and significantly shorter lung adenocarcinoma (LUAD) and rectum adenocarcinoma (READ) survival time than the low expression group (Supplementary Figure S6). HCC patients with high LRP1B expression had a significantly shorter OS than those with low LRP1B expression (p = 0.0186) (Figure 4H). Univariate and multivariate COX regression analysis indicated that LRP1B expression was not an independent prognostic factor for HCC (Table 3). However, there was no significant difference in the OS of HCC patients with high or low LRP1B expression who were treated with anti-PD1/PDL1 antibody (Figure 4I and J). These results suggest that high LRP1B expression level was associated with low survival in HCC patients.
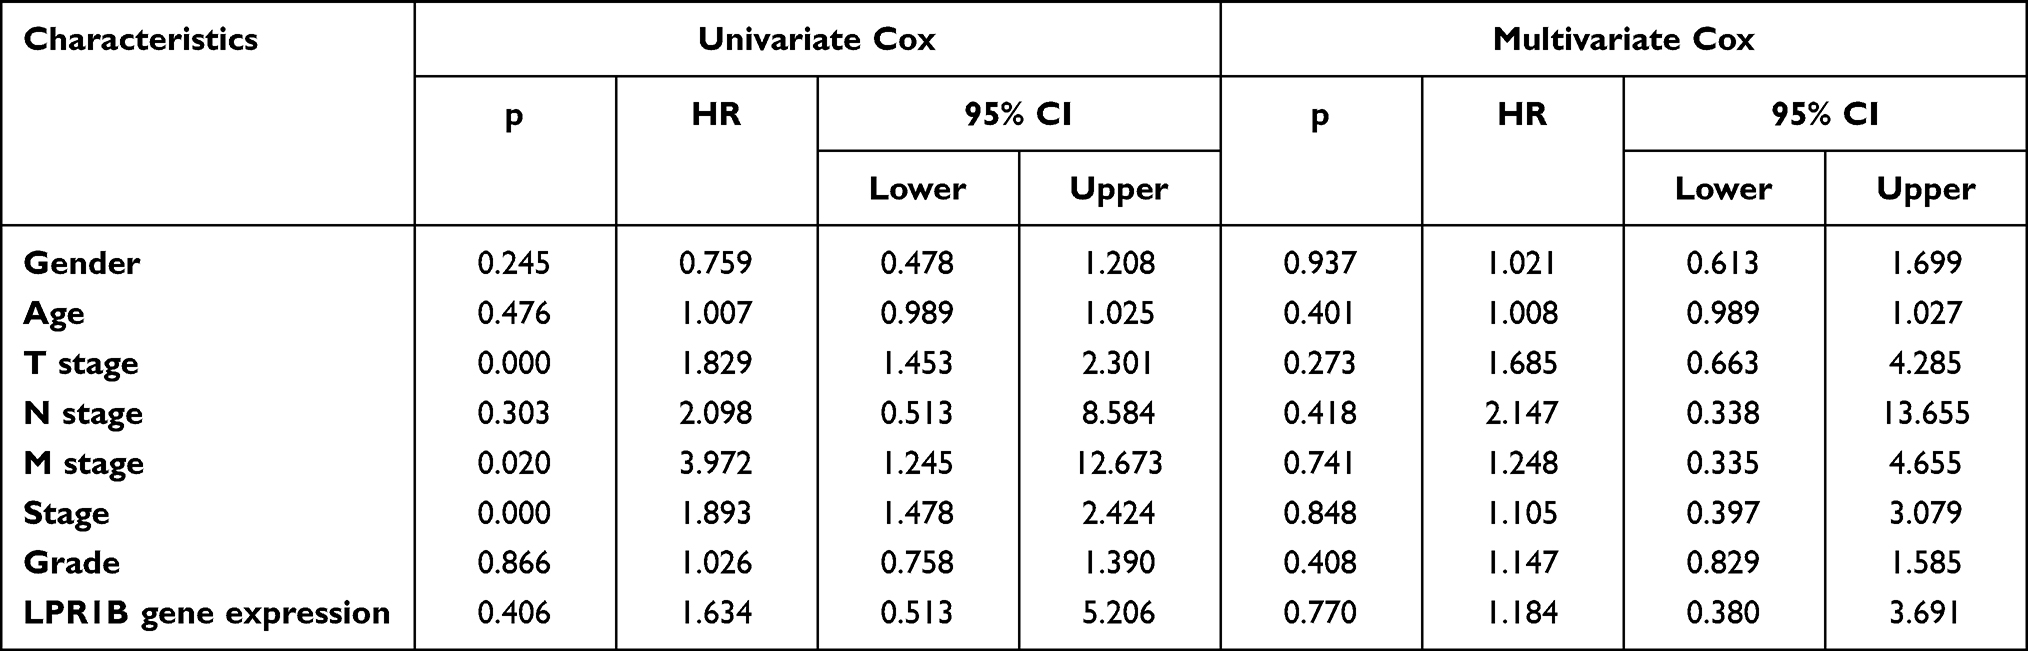 |
Table 3 Univariate and Multivariate Regression Analysis to Determine the Independent Prognostic Factor |
Immunological Correlation of LRP1B Expression
The correlation between LRP1B expression and immune infiltration was explored in different cancer types (Supplementary Figure S7). TIMER database analysis showed that LRP1B expression was positively correlated with the infiltration of immune cells, including B cells, CD8+ T cells, CD4+ T cells, macrophages, neutrophils, and dendritic cells in HCC (Figure 5A). The relationship between LRP1B expression and the ESTIMATE score was also assessed using pan-tumor analysis (Supplementary Figures S8–S10) LRP1B expression was positively correlated with the ESTIMATE in HCC (Figure 5B).
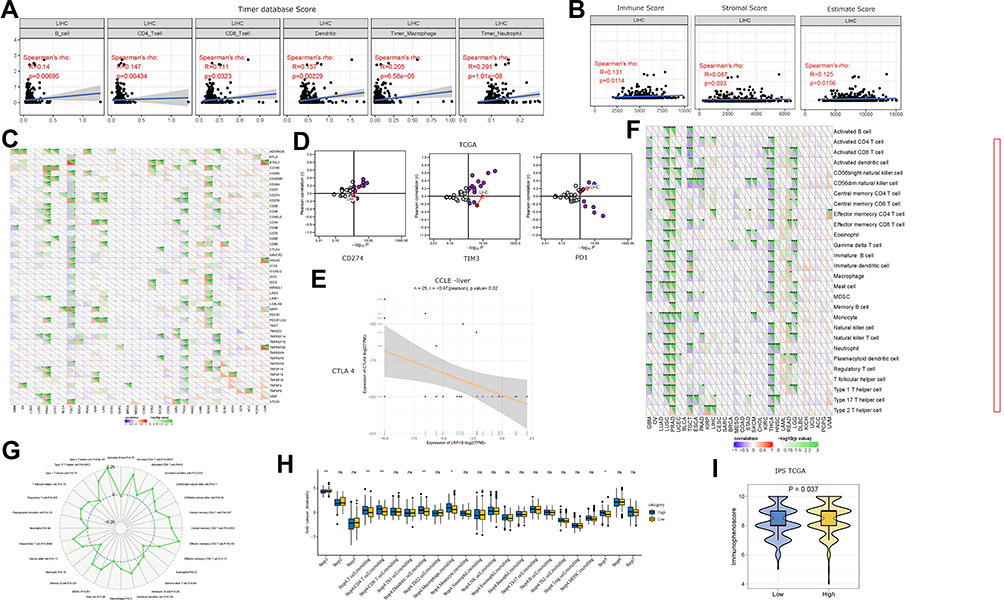 |
Figure 5 The effect of LRP1B expression on immune status. (A) The correlation between LRP1B expression and immune cell infiltration in HCC. (B) The correlation between LRP1B expression and the ESTIMATE score in HCC. (C) Heat map showing the pan-tumor correlation between LRP1B expression and immune checkpoint molecules. (D) Scatter plot showing the correlation between LRP1B expression in tumor tissues and key immunosuppressive molecules in TCGA data. (E) Scatter plot showing the correlation between LRP1B and CTLA4 expression in all cancer cell lines in the CCLE database. (F) Pan-tumor correlation between LRP1B expression and the abundance of 28 TIICs. (G) Correlation between LRP1B expression and TIICs in HCC. (H) Analysis of the cancer-immunity cycle in the LRP1B mutant and wild-type groups. (I) IPS distribution in HCC groups with high and low LRP1B expression. *P<0.01, **P<0.001, ***P<0.0001. |
The correlation between LRP1B expression and immune checkpoint expression is shown in Figure 5C. LRP1B expression was positively correlated with expression of PDCD1LG2, LA1R1, CD86, CD70, CD44, CD276, and CD274 in HCC. The correlation between LRP1B expression and common immune checkpoint genes in pan-tumor tissues, normal tissues, and pan-tumor cell lines was also analyzed (Supplementary Figure S11). LRP1B expression was significantly correlated with PD1, TIM3, and CD274 expression in HCC tissue from the TCGA dataset, and significantly correlated with CTLA4 expression in liver tumor cell lines (Figure 5D and E).
Pan-tumor analysis of the correlation between LRP1B expression and the number of neoantigens, TMB, and microsatellite instability (MSI) is shown in Supplementary Figures S12 and 13. LRP1B expression was significantly correlated with all three factors in several cancer types, suggesting that LRP1B may reflect cancer immunogenicity in these cancers. LRP1B expression also correlated with the infiltration of activated CD4+ T cells, activated dendritic cells, memory B cells, natural killer T cells, Type 17 T helper cells, and Type 2 T helper cells in HCC (Figure 5F and G).
Cancer immunity cycle analysis showed that the release of cancer cell antigens (Step 1) was significantly lower while trafficking of immune cells to tumors (Step 4) was higher in the high LRP1B expression group than with the low expression group (Figure 5H). The high LRP1B expression group also had a high IPS suggesting that this group may be more sensitive to ICI treatment (Figure 5I). These findings indirectly demonstrated that LRP1B expression may play a role in regulating the immune response.
The sensitivity of small molecule chemotherapy drugs in LRP1B high and low groups was also assessed (Supplementary Figure S14). There were significant differences in the IC50 values of the two groups in response to 32 different drugs. The high LRP1B expression group had significantly lower sensitivity to most drugs.
LRP1B Methylation Analysis
LRP1B has 31 methylation sites and its methylation level was significantly lower in many tumor tissues, including HCC, than in normal tissues (Figure 6A–C and Supplementary Figure S15). There was no difference in LRP1B methylation between patients with different HCC stages (Supplementary Figure S16), however, survival analysis showed that the low LRP1B methylation group had significantly shorter HCC survival than the high LRP1B methylation group (Figure 6D). LRP1B methylation was significantly lower in LRP1B mutant than wild-type samples (Figure 6E and Supplementary Figure S17).
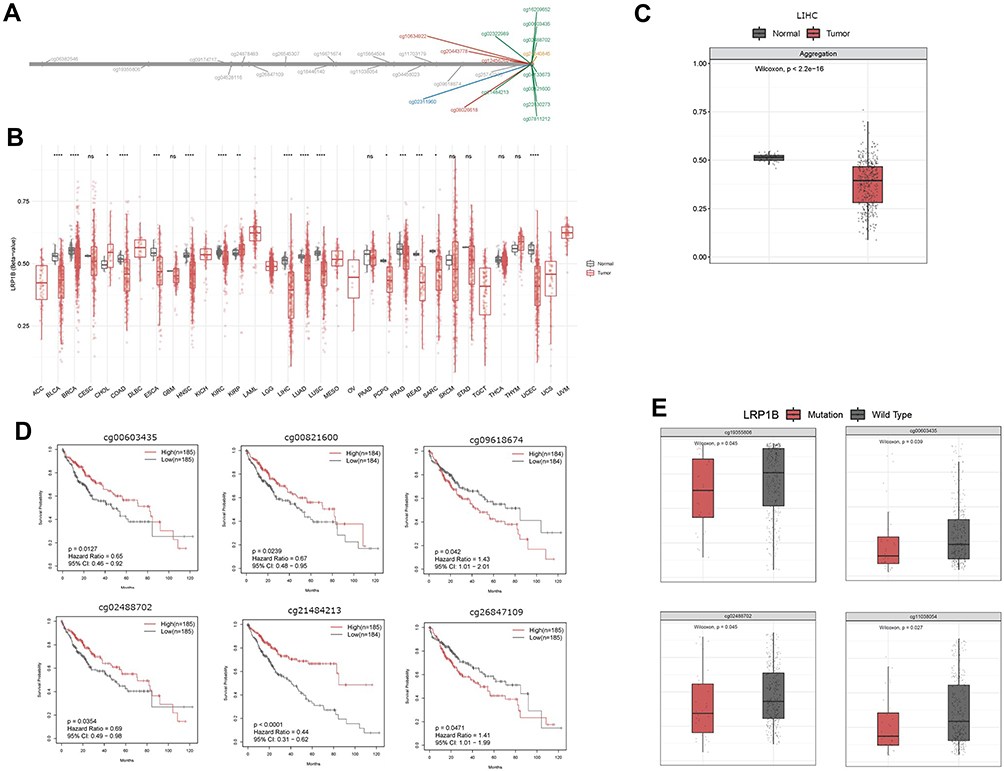 |
Figure 6 LRP1B methylation analysis. (A) Distribution of LRP1B methylation sites in various tumor types. (B) Pan-tumor analysis of LRP1B methylation in tumor and normal tissues. (C) Aggregation of differences in methylation between tumor and normal tissues in HCC. (D) Survival analysis of HCC patients with low and high DNA methylation of LRP1B. (E) Methylation levels of LRP1B mutant and wild-type samples. |
Pan-tumor analysis to assess the correlation between LRP1B and DNA methyltransferases expression is shown in Supplementary Figure S18. LRP1B expression in HCC correlated moderately with DNMT1 and DNMT2 expression, and weakly with DNMT3A and DNMT3B expression. Pan-tumor analysis of the correlation between LRP1B and MMRs expression was also assessed (Supplementary Figure S19). LRP1B expression in HCC correlated moderately with MSH2 and MSH6 expression, and weakly with PMS2 and MLH1 expression.
Taken together, these results suggest that the lower methylation level of LRP1B, such as that seen in the LRP1B mutant group, may be associated with a worse prognosis of HCC. In addition, LRP1B expression was positively correlated with methyltransferase expression.
The LRP1B Somatic Mutation Was Associated with Poor Prognosis in HCC Patients Receiving Anti-PD-1 Antibody Treatment
A retrospective study was conducted to elucidate whether the LRP1B mutation was associated with clinical responses to anti-PD-1 antibodies and the prognosis of HCC patients. Peripheral blood assessments revealed LRP1B mutations in 11 patients and a mutation rate of 19%. LRP1B mutations did not correlate with gender, age, BCLC stage, metastasis, HBV infection, or AFP level (data not shown). The disease control rate (DCR) was 45% and 65% in patients with mutant and wild-type LRP1B, respectively. The ORR was zero in the LRP1B mutation group and 22% in the wild-type group (Table 1). In addition, the OS and PFS were significantly shorter in the mutant than in the wild-type group (Figure 7A and B).
 |
Figure 7 Impact of the LRP1B mutation on the prognosis of HCC patients receiving anti-PD-1 antibody treatment. (A and B) Kaplan–Meier analysis of the OS and PFS of patients with different LRP1B mutation status who received anti-PD-1 antibody treatment. (C and D) Forest plot of the multivariate regression model for OS and PFS of HCC patients who received anti-PD-1 antibody, stratified by clinical characteristics and LRP1B mutation status. (E and F) Kaplan–Meier analysis of the OS and PFS curves of patients who received anti-PD-1 antibody mono-treatment by different LRP1B mutation status. (G and H) Kaplan–Meier analysis of the OS and PFS curves of patients who received combination treatment with the anti-PD-1 antibody and a targeted molecular agent by different LRP1B mutation status. |
Patients in the retrospective study were further divided into monotherapy (anti-PD-1 antibody) and combination therapy subgroups (anti-PD-1 antibody plus molecular targeted agent). Clinical features and LRP1B mutation patterns were included in a multivariate COX regression analysis (Figure 7C and D). Results indicated that the LRP1B mutation was an independent risk factor for OS (Table 4). PFS was impacted by both the LRP1B mutation pattern and treatment type (Table 5). Subgroup analysis showed that patients with the LRP1B mutation had significantly shorter OS and PFS than those with wild-type LRP1B in both the monotherapy and combination therapy subgroups (Figure 7E–H).
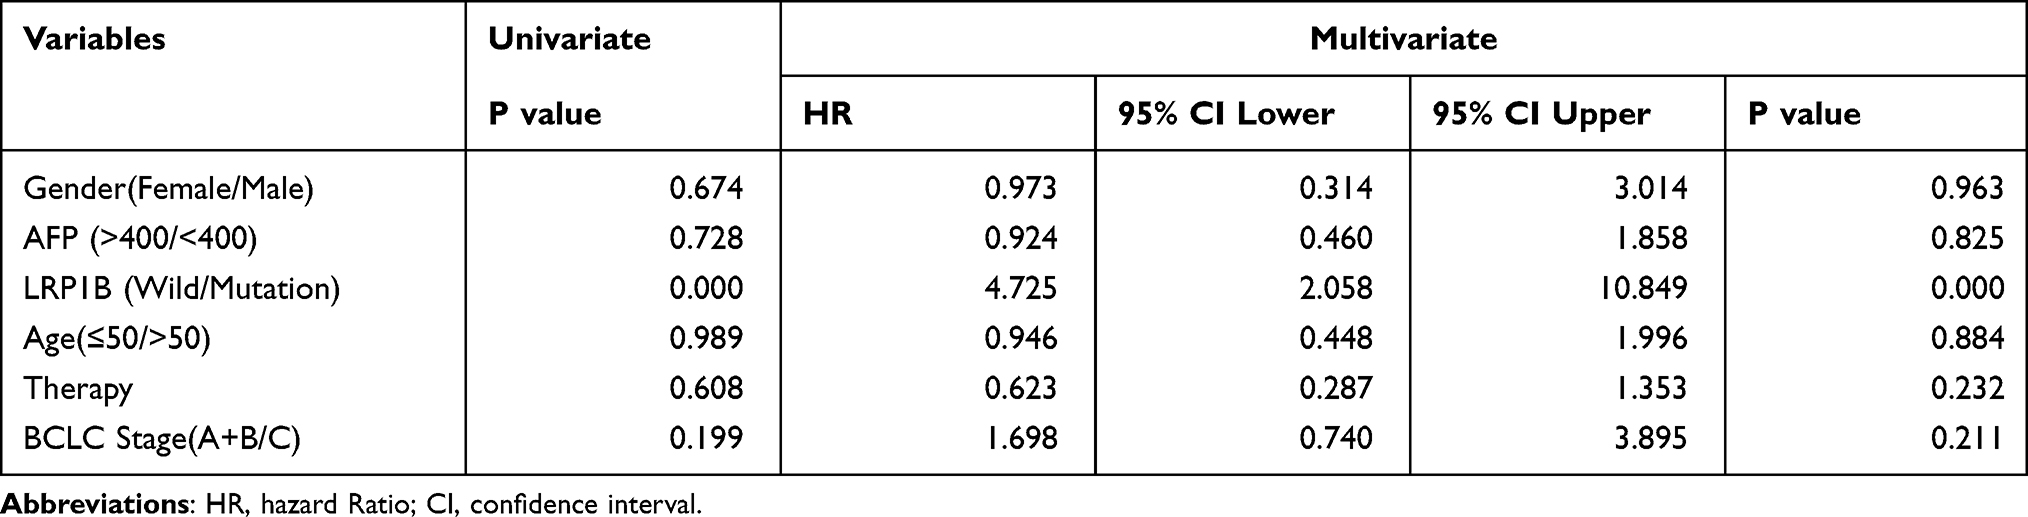 |
Table 4 Univariate and Multivariate COX Regression Analysis of Factors Associated with Overall Survival in the Retrospective Cohort Study |
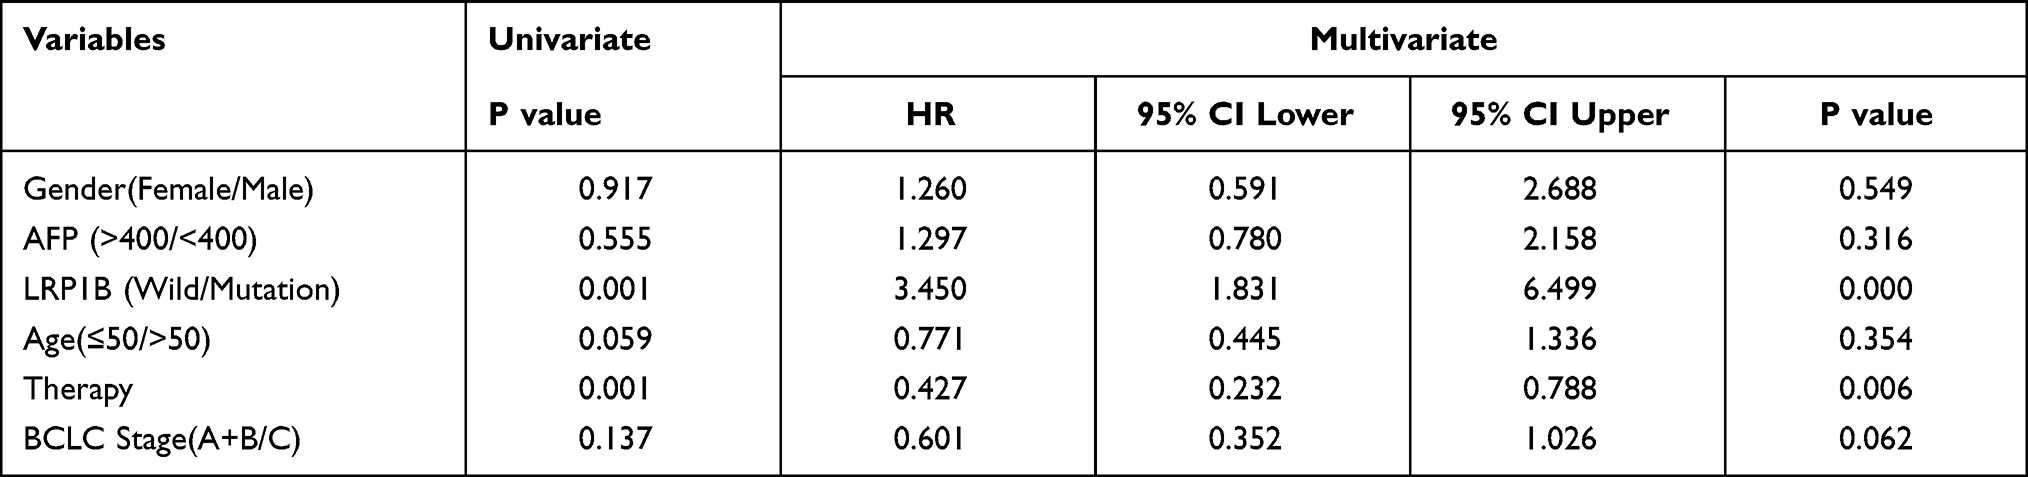 |
Table 5 Univariate and Multivariate COX Regression Analysis of Factors Associated with Progression-Free Survival in the Retrospective Cohort Study |
The LRP1B Mutation Was Associated with Higher TMB and Mast Cell Infiltration in HCC Patients
Patients with the LRP1B mutation had a significantly higher TMB than those with wild-type LRP1B (9.2 vs 3.8, P=0.006, Figure 8A). There was no significant difference in PDL1 expression in tumor tissues from the mutant and wild-type groups (Figure 8B). However, patients with the LRP1B mutation had significantly higher mast cell infiltration than those with wild-type LRP1B (Figure 8C and D).
 |
Figure 8 TMB and mast cell infiltration in HCC patients with the LRP1B mutant or wild-type. (A) TMB of HCC patients in the LRP1B mutant and wild-type groups. (B) PDL1 expression in tumor tissue from HCC patients in the LRP1B mutant and wild-type groups. (C) Mast cell presence in tumor tissue from HCC patients. (D) Number of infiltrated mast cells in tumor tissue from HCC patients. **P<0.01. |
Taken together, these results suggest that the mutation of LRP1B is associated with elevated TMB and increased mast cell infiltration in HCC patients. LRP1B mutations correlate with poorer treatment response and worse prognosis in patients receiving anti-PD1 antibody treatment.
Discussion
While ICI treatment benefits some patients with HCC, biomarkers are needed to predict treatment responsiveness. Whether a single gene mutation can predict the ICI treatment response in HCC patients has not yet been determined. This study showed that LRP1B is among the most frequently mutated genes, and interestingly, the mutation rate is much higher in Chinese than American populations (18.2% vs 8%). Findings showed that the LRP1B mutation correlated with high severity, TMB, and risk of recurrence, as well as poor prognosis of patients with HCC.
The LRP1B mutation is primarily involved in the negative regulation of tumor immunity in HCC. The CIBERSORT immune cell estimation algorithm showed that the LRP1B mutation increased mast cell activation and the correlation matrix of immune cell proportions showed that mast cell activation was positively correlated with dendritic cell activation, and negatively correlated with resting memory CD4 T cells. The LRP1B mutation was also associated with reduced sensitivity to some targeted small molecule drugs.
DNA methylation, induced by a DNA methyltransferases or somatic mutations, plays an important role in the regulation of gene expression and tumorigenesis.34 Indeed, aberrant methylation is found in many tumors.35 The methylation profiles of HCC tumor DNA correlated highly with treatment response and prognosis.36 The current study showed that the LRP1B mutant group had lower LRP1B methylation and this may be linked to poor prognosis in patients with HCC.
Recently, Liu et al37 and Xu et al38 reported that the LRP1B mutation is associated with high TMB and is an independent predictor of HCC prognosis. This is consistent with the findings shown here. Liu et al found that the LRP1B mutation in HCC was significantly associated with expression of the immune checkpoint gene, HHLA2, suggesting that this mutation can act as marker for ICI treatment outcomes. Xu et al indicated that the poor prognosis of HCC patients with the LRP1B mutation may be the result of an immunosuppressive microenvironment. However, neither of these studies assessed the ability of the LRP1B mutation to predict ICI responsiveness during HCC.
A retrospective cohort study was conducted to verify whether LRP1B mutations could predict the clinical ICI response of HCC patients. Findings showed that the somatic LRP1B mutation in peripheral blood was associated with a poor clinical response to immunotherapy. Moreover, the LRP1B mutation was shown to be an independent predictor of HCC immunotherapy treatment response. Treatment strategies that combine molecular targeted therapies with PD-1-targeted immunotherapy are currently being explored in patients not suitable for localized treatment. Thus, a stratified analysis was conducted to evaluate whether the LRP1B mutation could predict treatment response and prognosis in patients receiving combination treatment. Subgroup analysis showed that patients with the LRP1B mutation had significantly shorter OS and PFS than those with wild-type LRP1B in both the monotherapy and combination therapy subgroup. It is critical to identify non-invasive predictive indicators of ICI treatment response in HCC patients. The present study showed that somatic LRP1B mutations in peripheral blood samples may be used to predict clinical response and prognosis in patients receiving ICI treatment.
PDL1 expression evaluated by immunohistochemistry may serve as a prognostic biomarker in HCC,39 though TMB was more reliable at predicting response rate than PD-L1 expression.40 In HCC patients, high TMB was predictive of poorer outcomes than low TMB.41 The current study also explored PDL1 expression and TMB in clinical HCC tissues. While higher TMB was found in HCC patients with LRP1B mutations, no significant correlation was found between the LRP1B mutation and PDL1 expression.
Mast cells are underrecognized but very promising target for cancer immunotherapy42 because they are able to translate local signals into systemic tumor modulating immune responses. Activated mast cells upregulate MHC-II and costimulatory molecules and act as local antigen-presenting cells for T cells. They have also been shown to modulate T-cell function, including reducing the activity of IFN-γ producing CD8 T cells.43 Total mast cell numbers are lower in HCC patients and infection with HBV or HCV further lowers activated mast cell infiltration in HCC patients. A higher proportion of resting mast cells may predict a shorter survival time of patients with HCC,44 while a high density of activated mast cells in peritumoral hepatic tissues may predict late disease recurrence.45 The current study showed that the LRP1B mutation was associated with increased mast cell infiltration in liver tumor tissues. These results suggested that the LRP1B mutation may be an event occurring during HCC progression that reduces mast cell activation and ultimately impacts responsiveness to immunotherapy.
The expression pattern and immunological role of LRP1B were also explored. In pan-tumor analysis, LRP1B expression was significantly correlated with the number of neoantigens, TMB, and MSI in several cancer types, suggesting that LRP1B may be associated with tumor immunogenicity. LRP1B expression was positively correlated with immune cells infiltration in HCC. This study found that LRP1B expression was negatively correlated with the release of cancer cell antigens and positively correlated with the trafficking of immune cells to tumors. IPS can determine tumor immunogenicity and predict responsiveness to ICI therapy in many kinds of tumors. High IPS in LRP1B expression group suggested that LRP1B expression may be positively correlated with increased sensitivity to ICI treatment.
The prognostic analysis showed that LRP1B expression was a prognostic biomarker in several cancers. High LRP1B expression was associated with poor survival in HCC patients and was predicted to reduce sensitivity to targeted small molecule drugs.
Conclusion
This study reported that a single gene LRP1B mutation was correlated with high TMB in HCC patients and could predict the treatment response and prognosis of HCC patients receiving ICI therapy. The LRP1B mutation may result in higher mast cell infiltration. Moreover, high LRP1B expression correlated with the cancer-immunity cycle and immune cell infiltration and was associated with poor survival in HCC patients.
A limitation of this study was the low number of clinical patients receiving ICI treatment and the limited number of samples with the LRP1B mutation. Further studies are needed to confirm the relationship between the blood somatic mutation of LRP1B and both TMB and the outcomes of HCC patients receiving immunotherapy. Additional understanding of the molecular mechanisms involved in the LRP1B mutation and mast cell infiltration is also needed.
Funding
This work was supported by National Natural Science Foundation of China [No. 81802339 and 82073174] and Guangzhou Science and Technology plan project [No. 202102020069 and 202102020185].
Disclosure
The authors report no conflicts of interest in this work.
References
1. Henley SJ, Ward EM, Scott S, et al. Annual report to the nation on the status of cancer, part I: national cancer statistics. Cancer. 2020;126(10):2225–2249. doi:10.1002/cncr.32802
2. Busato D, Mossenta M, Baboci L, Di Cintio F, Toffoli G, Dal Bo M. Novel immunotherapeutic approaches for hepatocellular carcinoma treatment. Expert Rev Clin Pharmacol. 2019;12(5):453–470. doi:10.1080/17512433.2019.1598859
3. El-Khoueiry AB, Sangro B, Yau T, et al. Nivolumab in patients with advanced hepatocellular carcinoma (CheckMate 040): an open-label, non-comparative, phase 1/2 dose escalation and expansion trial. Lancet. 2017;389(10088):2492–2502. doi:10.1016/S0140-6736(17)31046-2
4. Zhu AX, Finn RS, Edeline J, et al. Pembrolizumab in patients with advanced hepatocellular carcinoma previously treated with sorafenib (KEYNOTE-224): a non-randomised, open-label phase 2 trial. Lancet Oncol. 2018;19(7):940–952. doi:10.1016/S1470-2045(18)30351-6
5. Chung NS, Wasan KM. Potential role of the low-density lipoprotein receptor family as mediators of cellular drug uptake. Adv Drug Deliv Rev. 2004;56(9):1315–1334. doi:10.1016/j.addr.2003.12.003
6. Wang M, Xiong Z. The mutation and expression level of LRP1B are associated with immune infiltration and prognosis in hepatocellular carcinoma. Int J Gen Med. 2021;14:6343–6358. doi:10.2147/IJGM.S333390
7. Beer AG, Zenzmaier C, Schreinlechner M, et al. Expression of a recombinant full-length LRP1B receptor in human non-small cell lung cancer cells confirms the postulated growth-suppressing function of this large LDL receptor family member. Oncotarget. 2016;7(42):68721–68733. doi:10.18632/oncotarget.11897
8. Tabouret E, Labussière M, Alentorn A, Schmitt Y, Marie Y, Sanson M. LRP1B deletion is associated with poor outcome for glioblastoma patients. J Neurol Sci. 2015;358(1–2):440–443. doi:10.1016/j.jns.2015.09.345
9. Li B, Liu C, Cheng G, et al. LRP1B polymorphisms are associated with multiple myeloma risk in a Chinese han population. J Cancer. 2019;10(3):577–582. doi:10.7150/jca.28905
10. Lan S, Li H, Liu Y, et al. Somatic mutation of LRP1B is associated with tumor mutational burden in patients with lung cancer. Lung Cancer. 2019;132:154–156. doi:10.1016/j.lungcan.2019.04.025
11. Chen H, Chong W, Wu Q, Yao Y, Mao M, Wang X. Association of LRP1B mutation with tumor mutation burden and outcomes in melanoma and non-small cell lung cancer patients treated with immune check-point blockades. Front Immunol. 2019;10:1113. doi:10.3389/fimmu.2019.01113
12. Brown LC, Tucker MD, Sedhom R, et al. LRP1B mutations are associated with favorable outcomes to immune checkpoint inhibitors across multiple cancer types. J Immunother Cancer. 2021;9(3):e001792. doi:10.1136/jitc-2020-001792
13. Li M, Hu J, Jin R, et al. Effects of LRP1B regulated by HSF1 on lipid metabolism in hepatocellular carcinoma. J Hepatocell Carcinoma. 2020;7:361–376. doi:10.2147/JHC.S279123
14. Ding D, Lou X, Hua D, et al. Recurrent targeted genes of hepatitis B virus in the liver cancer genomes identified by a next-generation sequencing-based approach. PLoS Genet. 2012;8(12):e1003065. doi:10.1371/journal.pgen.1003065
15. Goldman MJ, Craft B, Hastie M, et al. Visualizing and interpreting cancer genomics data via the Xena platform. Nat Biotechnol. 2020;38(6):675–678. doi:10.1038/s41587-020-0546-8
16. Love MI, Huber W, Anders S. Moderated estimation of fold change and dispersion for RNA-seq data with DESeq2. Genome Biol. 2014;15(12):550. doi:10.1186/s13059-014-0550-8
17. Ashburner M, Ball CA, Blake JA, et al. Gene ontology: tool for the unification of biology. The Gene Ontology Consortium. Nat Genet. 2000;25(1):25–29. doi:10.1038/75556
18. Cheng Y, Wang K, Geng L, et al. Identification of candidate diagnostic and prognostic biomarkers for pancreatic carcinoma. EBioMedicine. 2019;40:382–393. doi:10.1016/j.ebiom.2019.01.003
19. Subramanian A, Kuehn H, Gould J, Tamayo P, Mesirov JP. GSEA-P: a desktop application for gene set enrichment analysis. Bioinformatics. 2007;23(23):3251–3253. doi:10.1093/bioinformatics/btm369
20. Hänzelmann S, Castelo R, Guinney J. GSVA: gene set variation analysis for microarray and RNA-seq data. BMC Bioinform. 2013;14:7. doi:10.1186/1471-2105-14-7
21. Subramanian A, Tamayo P, Mootha VK, et al. Gene set enrichment analysis: a knowledge-based approach for interpreting genome-wide expression profiles. Proc Natl Acad Sci U S A. 2005;102(43):15545–15550. doi:10.1073/pnas.0506580102
22. Xu L, Deng C, Pang B, et al. TIP: a web server for resolving tumor immunophenotype profiling. Cancer Res. 2018;78(23):6575–6580. doi:10.1158/0008-5472.CAN-18-0689
23. Li T, Fan J, Wang B, et al. TIMER: a web server for comprehensive analysis of tumor-infiltrating immune cells. Cancer Res. 2017;77(21):e108–e110. doi:10.1158/0008-5472.CAN-17-0307
24. Newman AM, Liu CL, Green MR, et al. Robust enumeration of cell subsets from tissue expression profiles. Nat Methods. 2015;12(5):453–457. doi:10.1038/nmeth.3337
25. Jiang P, Gu S, Pan D, et al. Signatures of T cell dysfunction and exclusion predict cancer immunotherapy response. Nat Med. 2018;24(10):1550–1558. doi:10.1038/s41591-018-0136-1
26. Charoentong P, Finotello F, Angelova M, et al. Pan-cancer immunogenomic analyses reveal genotype-immunophenotype relationships and predictors of response to checkpoint blockade. Cell Rep. 2017;18(1):248–262. doi:10.1016/j.celrep.2016.12.019
27. Yoshihara K, Shahmoradgoli M, Martínez E, et al. Inferring tumour purity and stromal and immune cell admixture from expression data. Nat Commun. 2013;4:2612. doi:10.1038/ncomms3612
28. Geeleher P, Cox NJ, Huang RS. Clinical drug response can be predicted using baseline gene expression levels and in vitro drug sensitivity in cell lines. Genome Biol. 2014;15(3):R47. doi:10.1186/gb-2014-15-3-r47
29. Li Y, Ge D, Lu C. The SMART App: an interactive web application for comprehensive DNA methylation analysis and visualization. Epigenetics Chromatin. 2019;12(1):71. doi:10.1186/s13072-019-0316-3
30. Bonneville R, Krook MA, Kautto EA, et al. Landscape of microsatellite instability across 39 cancer types. JCO Precis Oncol. 2017;2017. doi:10.1200/PO.17.00073
31. Wang K, Li M, Hakonarson H. ANNOVAR: functional annotation of genetic variants from high-throughput sequencing data. Nucleic Acids Res. 2010;38(16):e164. doi:10.1093/nar/gkq603
32. Cheng Y, Zheng H, Wang B, Xu W, Xu J, Zhu Y. Sorafenib and fluvastatin synergistically alleviate hepatic fibrosis via inhibiting the TGFbeta1/Smad3 pathway. Dig Liver Dis. 2018;50(4):381–388. doi:10.1016/j.dld.2017.12.015
33. Chen DS, Mellman I. Oncology meets immunology: the cancer-immunity cycle. Immunity. 2013;39(1):1–10. doi:10.1016/j.immuni.2013.07.012
34. Kulis M, Esteller M. DNA methylation and cancer. Adv Genet. 2010;70:27–56.
35. Hainaut P, Plymoth A. Targeting the hallmarks of cancer: towards a rational approach to next-generation cancer therapy. Curr Opin Oncol. 2013;25(1):50–51. doi:10.1097/CCO.0b013e32835b651e
36. Xu RH, Wei W, Krawczyk M, et al. Circulating tumour DNA methylation markers for diagnosis and prognosis of hepatocellular carcinoma. Nat Mater. 2017;16(11):1155–1161. doi:10.1038/nmat4997
37. Liu F, Hou W, Liang J, Zhu L, Luo C. LRP1B mutation: a novel independent prognostic factor and a predictive tumor mutation burden in hepatocellular carcinoma. J Cancer. 2021;12(13):4039–4048. doi:10.7150/jca.53124
38. Xu J, Shen X, Zhang B, et al. Development and validation of LRP1B mutation-associated prognostic model for hepatocellular carcinoma. Biosci Rep. 2021;41(9). doi:10.1042/BSR20211053
39. Semaan A, Dietrich D, Bergheim D, et al. CXCL12 expression and PD-L1 expression serve as prognostic biomarkers in HCC and are induced by hypoxia. Virchows Arch. 2017;470(2):185–196. doi:10.1007/s00428-016-2051-5
40. Rosenberg JE, Hoffman-Censits J, Powles T, et al. Atezolizumab in patients with locally advanced and metastatic urothelial carcinoma who have progressed following treatment with platinum-based chemotherapy: a single-arm, multicentre, phase 2 trial. Lancet. 2016;387(10031):1909–1920. doi:10.1016/S0140-6736(16)00561-4
41. Shrestha R, Prithviraj P, Anaka M, et al. Monitoring immune checkpoint regulators as predictive biomarkers in hepatocellular carcinoma. Front Oncol. 2018;8:269. doi:10.3389/fonc.2018.00269
42. Lichterman JN, Reddy SM. Mast cells: a new frontier for cancer immunotherapy. Cells. 2021;10(6):1270. doi:10.3390/cells10061270
43. Wasiuk A, Dalton DK, Schpero WL, Stan RV, Conejo-Garcia JR, Noelle RJ. Mast cells impair the development of protective anti-tumor immunity. Cancer Immunol Immunother. 2012;61(12):2273–2282. doi:10.1007/s00262-012-1276-7
44. Rohr-Udilova N, Klinglmüller F, Schulte-Hermann R, et al. Deviations of the immune cell landscape between healthy liver and hepatocellular carcinoma. Sci Rep. 2018;8(1):6220. doi:10.1038/s41598-018-24437-5
45. Chen L, Zhang Q, Chang W, Du Y, Zhang H, Cao G. Viral and host inflammation-related factors that can predict the prognosis of hepatocellular carcinoma. Eur J Cancer. 2012;48(13):1977–1987. doi:10.1016/j.ejca.2012.01.015
 © 2022 The Author(s). This work is published and licensed by Dove Medical Press Limited. The
full terms of this license are available at https://www.dovepress.com/terms
and incorporate the Creative Commons Attribution
- Non Commercial (unported, 3.0) License.
By accessing the work you hereby accept the Terms. Non-commercial uses of the work are permitted
without any further permission from Dove Medical Press Limited, provided the work is properly
attributed. For permission for commercial use of this work, please see paragraphs 4.2 and 5 of our Terms.
© 2022 The Author(s). This work is published and licensed by Dove Medical Press Limited. The
full terms of this license are available at https://www.dovepress.com/terms
and incorporate the Creative Commons Attribution
- Non Commercial (unported, 3.0) License.
By accessing the work you hereby accept the Terms. Non-commercial uses of the work are permitted
without any further permission from Dove Medical Press Limited, provided the work is properly
attributed. For permission for commercial use of this work, please see paragraphs 4.2 and 5 of our Terms.