Back to Journals » International Journal of Nanomedicine » Volume 10 » Issue 1
Lower irritation microemulsion-based rotigotine gel: formulation optimization and in vitro and in vivo studies
Authors Wang Z, Mu H, Zhang X, Ma P, Lian S, Zhang F, Chu S, Zhang W, Wang A, Wang W, Sun K
Received 11 September 2014
Accepted for publication 1 November 2014
Published 14 January 2015 Volume 2015:10(1) Pages 633—644
DOI https://doi.org/10.2147/IJN.S74079
Checked for plagiarism Yes
Review by Single anonymous peer review
Peer reviewer comments 2
Editor who approved publication: Dr Thomas Webster
Zheng Wang,1 Hong-Jie Mu,1 Xue-Mei Zhang,1 Peng-Kai Ma,1 Sheng-Nan Lian,1 Feng-Pu Zhang,1 Sheng-Ying Chu,1 Wen-Wen Zhang,1 Ai-Ping Wang,1,2 Wen-Yan Wang,2 Kao-Xiang Sun1
1School of Pharmacy, Yantai University, 2State Key Laboratory of Long-acting and Targeting Drug Delivery System, Yantai, Shandong Province, People’s Republic of China
Background: Rotigotine is a potent and selective D1, D2, and D3 dopaminergic receptor agonist. Due to an extensive first-pass effect, it has a very low oral bioavailability (approximately 0.5% in rats).
Purpose: The present investigation aimed to develop a microemulsion-based hydrogel for transdermal rotigotine delivery with lower application site reactions.
Methods: Pseudoternary phase diagrams were constructed to determine the region of oil in water (o/w)-type microemulsion. Central composite design was used to support the pseudoternary phase diagrams and to select homogeneous and stable microemulsions with an optimal amount of rotigotine permeation within 24 hours. In vitro skin permeation experiments were performed, using Franz diffusion cells, to compare rotigotine-loaded microemulsions with rotigotine solutions in oil. The optimized formulation was used to prepare a microemulsion-based hydrogel, which was subjected to bioavailability and skin irritancy studies.
Results: The selected formulations of rotigotine-loaded microemulsions had enhanced flux and permeation coefficients compared with rotigotine in oil. The optimum microemulsion contained 68% water, 6.8% Labrafil®, 13.44% Cremophor® RH40, 6.72% Labrasol®, and 5.04% Transcutol® HP; the drug-loading rate was 2%. To form a microemulsion gel, 1% Carbomer 1342 was added to the microemulsion. The bioavailability of the rotigotine-loaded microemulsion gel was 105.76%±20.52% with respect to the marketed rotigotine patch (Neupro®). The microemulsion gel irritated the skin less than Neupro.
Conclusion: A rotigotine microemulsion-based hydrogel was successfully developed, and an optimal formulation for drug delivery was identified. This product could improve patient compliance and have broad marketability.
Keywords: pseudoternary phase diagrams, central composite design, transdermal
Introduction
Interest in dopaminergic drug research has increased since the discovery that patients with Parkinson’s disease exhibit dopamine deficiency in the striatum.1 Rotigotine ([–]2-(N-propyl-N-2-thienylethylamino)5-hydroxytetralin) was developed for the once-daily treatment of idiopathic Parkinson’s disease. Due to its extensive gastrointestinal metabolism, rotigotine is not suitable for oral administration.2 Neupro® was developed by Schwarz Pharma (UCB, Inc, Brussels, Belgium) for the once daily treatment of Parkinson’s disease using a transdermal delivery system. Neupro releases rotigotine steadily over 24 hours, reducing side effects, such as dyskinesia, motor fluctuations, and resting tremor, resulting from fluctuating concentration-versus-time profiles.1,3,4 The most common adverse events observed during rotigotine clinical studies were application site reactions. Approximately half of rotigotine patients had application site reactions, including erythema, pruritus, and dermatitis, compared with 11%–21% of patients receiving placebo.4 Therefore, an alternative transdermal delivery route with lower application site reactions is required.
Microemulsions generally comprise appropriate proportions of an oil phase, surfactant, cosurfactant, and aqueous phase.5 Microemulsions have several specific physicochemical properties, ie, transparency, optical isotropy, low viscosity, and thermodynamic stability. Microemulsions have several advantages for drug delivery, such as simple preparation, strong stability, increased drug solubility, controlled drug delivery rate, and improved bioavailability of hydrophilic and lipophilic drugs via various delivery routes.6 Microemulsions are a promising method for transdermal drug delivery, and several mechanisms have been proposed to explain the advantages of microemulsions for transdermal drug delivery.7 The microemulsion components may function as permeation enhancers, which may reduce the diffusional barrier of the stratum corneum and increase the drug permeation rate through the skin. In addition, the hydration effect of the microemulsion on the stratum corneum may influence the permeability of drug formulations.
The low viscosity of microemulsions leads to a short residence time on the skin surface.8 The viscosity of rotigotine microemulsions can be increased, by adding polymer materials to prepare a hydrogel.8 The polymer material generally does not react with surfactants or cosurfactants and does not affect microemulsion stability.9 Furthermore, hydrogels possess good moisture retention and permeability characteristics and cause little skin irritation.10
In this study, oil in water (o/w) microemulsions containing rotigotine were developed after selecting oils, surfactant, and cosurfactants. By constructing pseudoternary phase diagrams, we obtained the optimal ratio of the mixed surfactants. Using central composite design (CCD), we determined the most suitable ratio of components to create an optimized formulation. The in vivo performance of the formulation was also evaluated in rats.
Materials and methods
Materials
Rotigotine and (S)-5,6,7,8-4H-6-[propyl[4-fluorinated phenyl ethyl]amino]-1-naphthol were received as a gift from Luye Pharmaceutical Ltd (Shandong, People’s Republic of China). Neupro was purchased from Schwarz Pharma. Oleoyl macrogol-6 glycerides EP (Labrafil® M 1944 CS), medium-chain triglycerides (Labrafac® Lipophile), Labrasol® and Transcutol® HP were received as a gift from Gattefosse (St Priest, Cedex, France). Cremophor® RH40 was purchased from BASF SE (Ludwigshafen, Germany). Oleic acid, Tween® 80, polyethylene glycol (PEG)-400, 1,2-propylene glycol, and ethyl alcohol were purchased from the Huachen Chemical reagent factory (Tanjin, People’s Republic of China). All other chemicals and solvents were analytical grade.
Animals
Male and female Sprague Dawley® (SD) rats weighing approximately 250 g were supplied by the State Key Laboratory of Long-acting and Targeting Drug Delivery System. The animals were housed at room temperature (approximately 22°C) with a relative humidity of 40%±5%.
Preparation of rotigotine microemulsions
Microemulsion components screening
To identify the optimal components for the microemulsion formulations, the solubility of rotigotine in different oils (olive oil, Labrafil M 1944 CS, Labrafac Lipophile and oleic acid, and Tween 80), surfactants (Labrasol, Cremophor RH40, and Transcutol HP), and cosurfactants (PEG-400, 1,2- propylene glycol, and absolute ethyl alcohol) was measured. An excess amount of rotigotine was added to a fixed volume of each solvent (10 mL), and the mixture was incubated at 25°C in a constant temperature water bath oscillator (BoXun SHZ-A, Shanghai, People’s Republic of China) for 24 hours. The resulting suspension was then centrifuged for 10 minutes at 12,000 rpm. After appropriate dilution, the supernatant was filtered using a 0.45 μm microporous membrane filter. The concentration of rotigotine in the filtrate was determined by high-performance liquid chromatography (HPLC) (Agilent 1100 Series HPLC Value System; Agilent Technologies, Santa Clara, CA USA) with detection at a wavelength of 223 nm. The solubility of rotigotine in the various solvents was then calculated to identify high-solubility solvents.
Construction of phase diagrams
Pseudoternary diagrams were constructed to characterize microemulsion formation. Two different surfactants (Cremophor RH 40 and Labrasol) were mixed at different proportions (Ks) and then mixed with a cosurfactant at a specific weight ratio (Km), as shown in Table 1. Then, different amounts of oil (Labrafil M 1944 CS) were added to the surfactants and cosurfactant mixtures (Smix) at a ratio of 9.5:0.5, 9:1, 8.5:1.5, 8:2, 7.5:2.5, 7:3, 6.5:4.5, 6:4, 5.5:4.5, 5:5, 4.5:6.5, 4:6, 3.5:6.5, 3:7, 2.5:7.5, 2:8, 1.5:8.5, 1:9, and 0.5:9.5 (w/w). Distilled water was then added dropwise under magnetic stirring at room temperature and atmospheric pressure The samples were classified as microemulsions when clear liquids formed.11 The amount of water consumption was recorded and used to calculate the final weight percentages of water, oil, and Smix. The pseudoternary phase diagram was constructed using Origin software (version 7.5; OriginLab Corp, Northampton, MA, USA).
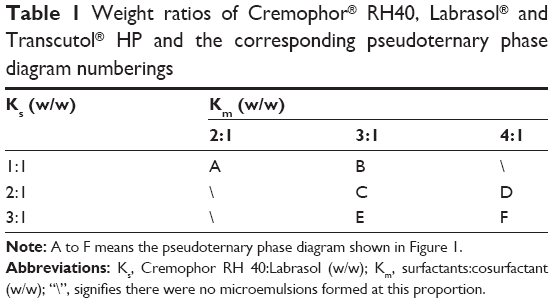 | Table 1 Weight ratios of Cremophor® RH40, Labrasol® and Transcutol® HP and the corresponding pseudoternary phase diagram numberings |
Experimental design
The most appropriate ratio of Smix, oil, and water was determined using CCD. In this study, a 13-run, two-factor, three-level CCD statistical screening design was used to optimize the formulation factors and evaluate the main effects, interaction effects, and quadratic effects on the permeation of rotigotine in 24 hours (Q24) and the steady-state flux (Jss). The statistical analysis was performed using Design-Expert® software (version 7.1; Stat-Ease Inc., Minneapolis, MN, USA). The two independent factors (X1 and X2) and dependent factors (Y1 and Y2) are shown in Table 2.
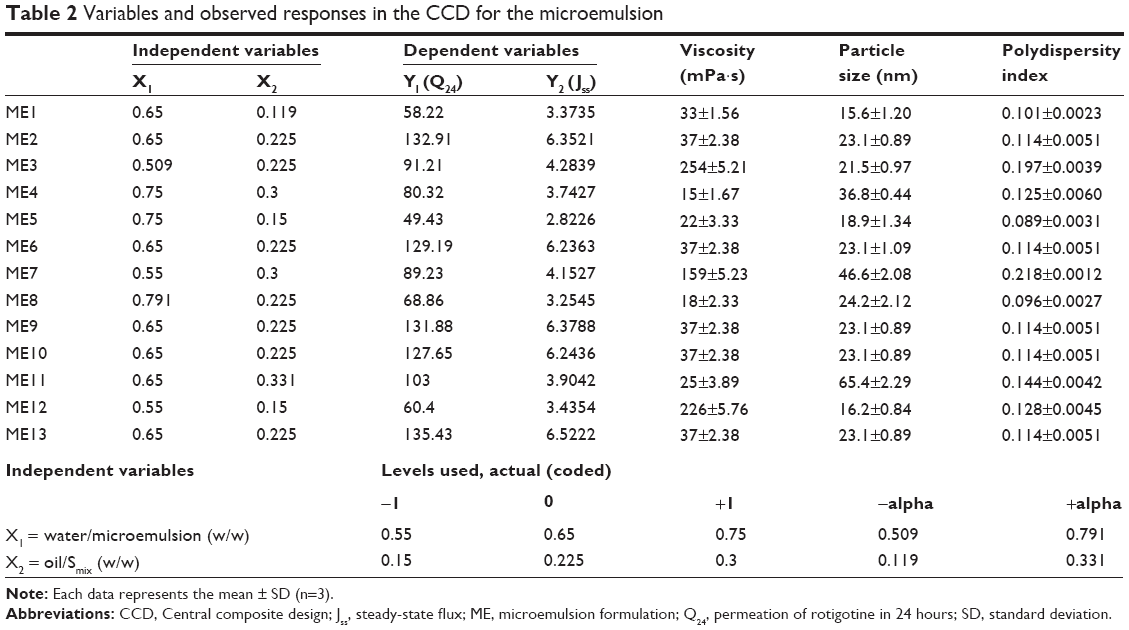 | Table 2 Variables and observed responses in the CCD for the microemulsion |
Particle size and polydispersion index investigation
The particle size and polydispersion index of the samples were determined using a particle size analyzer (Deisa™Nano C; Beckman Coulter Inc, Brea, CA, USA). Particle size was measured at a temperature of 25°C and a refractive index of 1.3328. The particle size and polydispersion index of all CCD and rotigotine-loaded optimized microemulsion formulations were determined under the same conditions.
Viscosity studies
All CCD formulations were subjected to viscosity studies to explain the results of the in vitro permeation and optimization studies. The viscosity of the optimized formulation was also measured. The viscosity of each sample was measured at 25°C using a Brookfield Digital Display Viscometer (DV-C; Brookfield Engineering Laboratories, Middleborough, MA, USA) at a shear rate of 50 rpm.
Scanning electron microscopy
The microstructure of the optimal rotigotine microemulsion was observed using an electron microscope (JEM-1400; JEOL Ltd, Tokyo, Japan). A drop of rotigotine microemulsion was placed on a copper network carrying a Formvar membrane and was partially air-dried before a drop of 1% phosphotungstic acid was added to the membrane. The membrane was completely air-dried and imaged using the electron microscope.
Stability studies
The heating–cooling cycle test was performed for the optimized rotigotine-loaded microemulsions, by storing the rotigotine-loaded microemulsions in a refrigerator at 4°C for 48 hours and then transferring the microemulsion to a drying case (LC-225; RiShun® Shanghai, People’s Republic of China) at 45°C for 48 hours.12 This cycle of cooling and drying was repeated five times. Phase separation or precipitation was evaluated after centrifugation (LD5-2A; DingLi®, Beijing, People’s Republic of China) at 3,600 rpm.
Long-term stability studies of the rotigotine-loaded microemulsions were performed at time points of 0, 1, 2, 3, and 6 months. The microemulsion was sealed and then stored at a temperature of 4°C. Phase separation or precipitation was evaluated after centrifugation at 3,600 rpm.
In vitro skin permeation studies
All experiments were performed according to the Guidelines for Animal Experiments, Yantai University. In vitro skin permeation studies of the rotigotine-loaded microemulsion were performed on rat skin, using a Franz diffusion cell assembly with an effective diffusion area of 1.34 cm2. The rat hair was removed using a razor, and the abdominal skin of the rat was carefully removed 24 hours later and stored at −80°C until further use. The rat skin was installed between the donor and receptor compartments of the diffusion cell, with the stratum corneum facing the donor compartment.
The rotigotine-loaded microemulsion formulations were prepared according to Table 3, with a rotigotine drug-loading of 2%. Then, 2 mL of the rotigotine-loaded microemulsion was placed in the donor compartment, and 18 mL of the receptor medium (normal saline containing 40% [v/v] PEG-400) was placed in the receptor compartment. PEG-400 was incorporated to maintain sink conditions. The receptor compartment was maintained at 37°C with stirring at 100 rpm. At predetermined time points, 1.5 mL aliquots of receptor medium were removed from the receptor compartment and immediately replaced with the same volume of receptor medium. The amount of rotigotine in the receptor compartment was determined by HPLC using an analytical column (Inertsil® ODS-SP C18, 4.6×250 mm, pore size 5 μm; Agilent Technologies) and using (a) acetonitrile and (b) water containing 0.3% phosphoric acid as the mobile phase, at 34:66. The flow rate was set at 1 mL/min, and the elution temperature was 35°C. Jss was calculated from the slope of the steady-state portion of the plot of drug amount vs time (hours).13
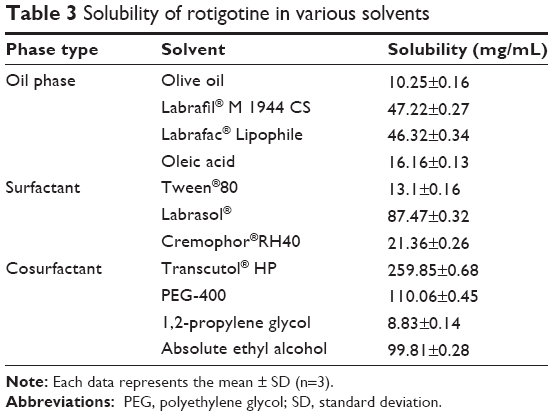 | Table 3 Solubility of rotigotine in various solvents |
Rotigotine microemulsion-based hydrogel preparation
Carbomer 1342 was selected as the gel matrix and was dispersed in the rotigotine-loaded microemulsion at weight ratios of 0.5%, 1%, and 1.5%, followed by complete swelling. The obtained gel was evaluated in in vitro skin permeation studies. The drug-loading rate was 2% (w/w).
Pharmacokinetic studies
Twelve healthy Sprague Dawley rats were randomly assigned to two groups, each containing six rats. The gel and Neupro were administered to the two groups at equal drug doses, ie, 1.2 mg/kg. The hair on the rat abdomen was removed 24 hours prior to dosing. A specific weight of the gel was applied to a piece of nonwoven cloth with an area of 0.8×0.8 cm2. Neupro was accurately cut to 0.8×0.8 cm2 according to the dose and applied to the abdomen.
Blood was collected from the canthus of rats, at pred etermined time points (1, 2, 4, 6, 8, 10, 12, 24, and 48 hours after the gel and patch were admistrated), in centrifuge tubes containing heparin and centrifuged for 10 minutes at 3,600 rpm. The supernatant was collected and stored at −20°C.
The blood samples were transferred to glass centrifuge tubes. Then, 10 μL of internal standard solution (5 ng/mL) and 3 mL of extractant (N-hexane : dichloromethane : isopropyl =2:1:0.1) were added to each tube, and each was vortexed for 5 minutes and centrifuged at 3,600 rpm for 10 minutes. The supernatant was collected and dried under a nitrogen gas flow, and 50 μL of mobile phase was added to the tube. The resulting mixture was quantified by liquid chromatography mass spectrometry (LC-MS/MS) (TSQ Quantum™ Access MAX; Thermo Fisher Scientific Inc, Waltham, MA, USA).
The LC-MS/MS conditions were: internal standard, (S)-5,6,7,8-4H-6-[propyl[4-fluorinated phenyl ethyl]amino]-1-naphthol hydrochloride; chromatographic column, LiChrospher® C18; measurement wavelength, 271.5 nm; mass spectrometer ion source, electrospray ionization source; detection method, cation; rotigotine and internal standard ion pair, 316.0/147.1, 328.1/147.1. The pharmacokinetic parameters were calculated using Phoenix® WinNonlin (version 6.3; Pharsight, St Louis, MO, USA), based on the average blood drug concentration.
Skin irritancy observation
Twelve healthy Sprague Dawley rats were randomly assigned to groups, each of which contained six rats. The first group was administered a 2 cm2 Neupro. In the second group, 45 mg of gel was applied over a 2 cm2 area. The skin lesion conditions were observed and recorded for the gel group and the Neupro group. The skin lesions were scored as follows: no erythema, 0 points; erythema point number <5, 1 point; erythema point number of 5–10, 2 points; and erythema point number >10, 3 points.
Statistical analysis
All experiments were performed at least in triplicate. The data are presented as the means ± standard deviation (SD). Comparisons between two groups were performed using a two-tailed Student’s t-test. P<0.05 was considered statistically significant, and P<0.01 was considered highly significant.
Results and discussion
Selection of components
The solubility of rotigotine in various vehicles is listed in Table 2. High-solubility solvents were prioritized. Labrasol promotes absorption, while Transcutol HP promotes solubility and absorption.14 Therefore, Labrafil M 1944 CS, Labrasol, and Transcutol HP were selected as the oil, surfactant, and cosurfactant, respectively. Research has demonstrated that the aforementioned three components are compatible,15 but they did not form a microemulsion in the present study. The second high-solubility surfactant, Cremophor RH40, formed a microemulsion when used with Labrafil M 1944 CS and Transcutol HP; however, the drug-loading percentage was <1% (data not shown) because of the low solubility of rotigotine in Cremophor RH40. Therefore, we combined Cremophor RH40 and Labrasol for use as surfactants.
Pseudoternary phase diagram
The determination of the ratio of various surfactants and cosurfactants is a critical aspect of microemulsion formulation design. The most common and effective method for screening surfactant and cosurfactant proportions is the construction of pseudoternary phase diagrams. Two methods, water titration and oil titration, are generally employed to construct pseudoternary phase diagrams.16 Water titration was selected in our study because this method is economical and widely used.16 In a pseudoternary phase diagram, each corner of the diagram represents 100% of any particular component.8
The pseudoternary phase diagrams are shown in Figure 1. Cremophor RH 40, Labrasol, and Transcutol HP were mixed at specific weight ratios as outlined in Table 1. The “\” in Table 1 indicates that no microemulsion was formed at these ratios. According to the pseudoternary phase diagrams, a larger region of microemulsion formation was observed at a Ks of 2:1 than at a Ks of 1:1 (Figure 1A and B) or 3:1 (Figure 1E and F). Therefore, a Ks of 2:1 was selected. Different Kms were then evaluated. No microemulsion was formed at Km values of 2:1 or 5:1 (data not shown). The area of the microemulsion region was larger at a Km value of 4:1 compared with 3:1 (Figure 1C and D). Therefore, values of Ks and Km of 2:1 and 4:1, respectively, were chosen. Cremophor RH 40, Labrasol, and Transcutol HP were mixed at a ratio of 8:4:3.
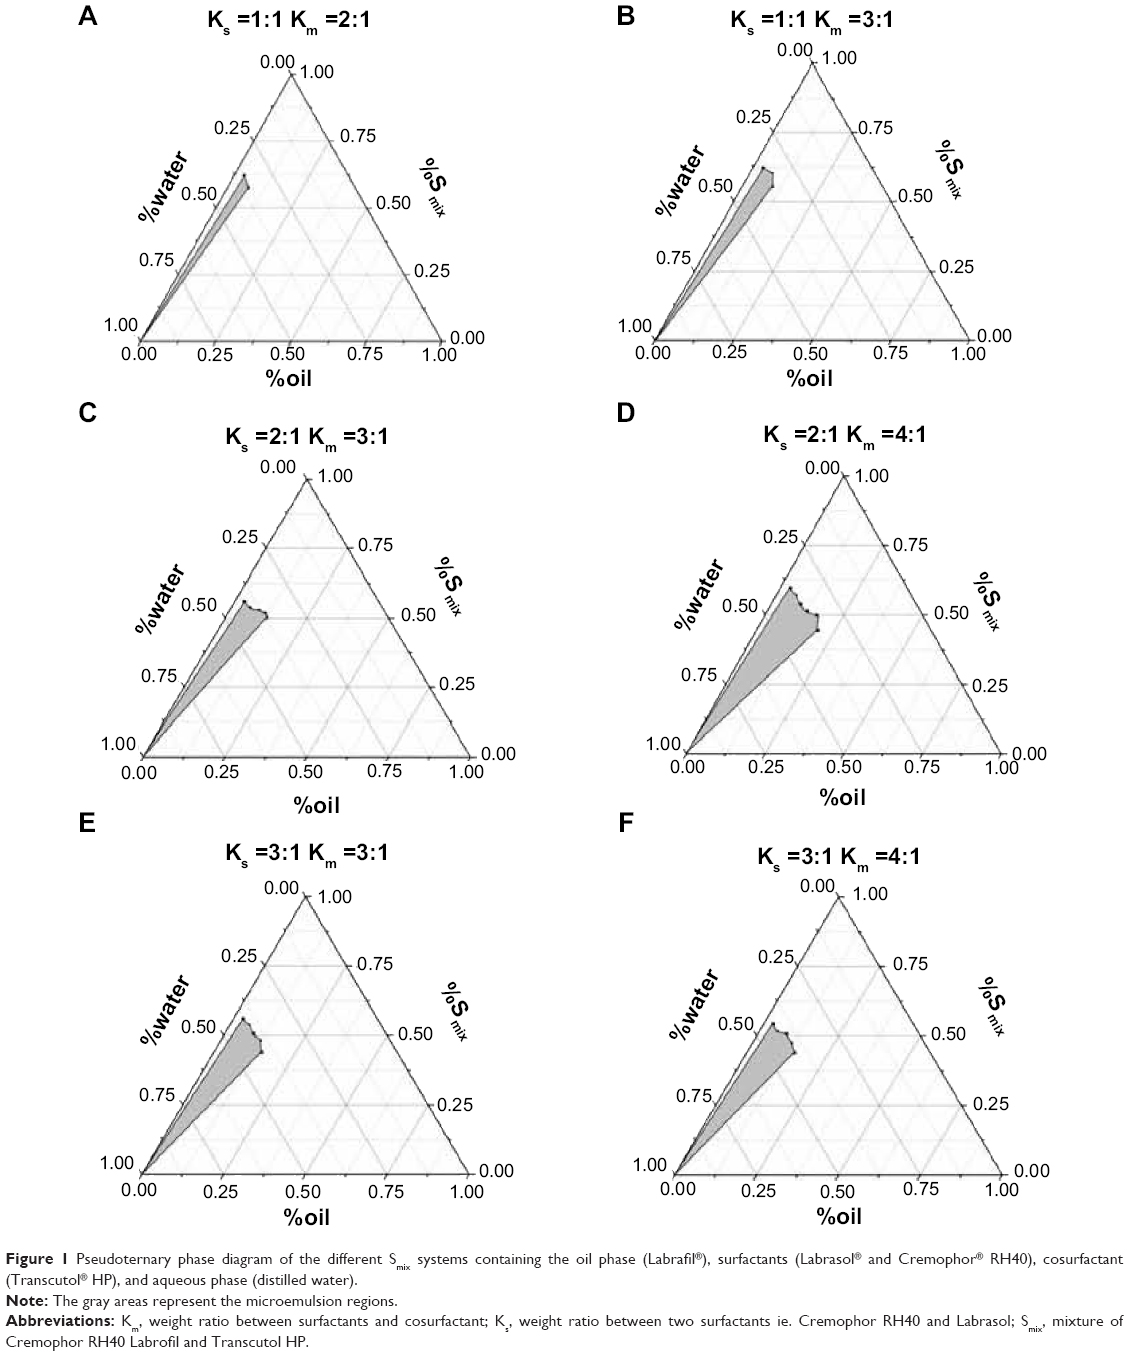 | Figure 1 Pseudoternary phase diagram of the different Smix systems containing the oil phase (Labrafil®), surfactants (Labrasol® and Cremophor® RH40), cosurfactant (Transcutol® HP), and aqueous phase (distilled water). |
Formulation optimization
The ratio of surfactant and cosurfactant was determined using pseudoternary phase diagrams. However, the ratio of oil, water, and surfactant that enables microemulsion formation must also be determined. CCD is the most common method for response surface design. A CCD consists of factorial points, axial points and center points. The axial points provide additional levels of the factor to estimate the quadratic terms.16 In this research, the contents of water (X1) and oil/Smix (X2) were chosen as the two independent variables. The optimal values of X1 and X2 for microemulsion formation were determined from the appropriate point in the pseudoternary phase diagram. The best fit model was the quadratic model, which is represented as follows:
Y1(Q24) = −1311.05 + 3600.21X1 + 2402.07X2 + 68.67X1X2 − 2830.79X12 − 4981.40X22 | (1) |
Y2(Jss) = −60.30 + 168.0X1 + 111.21X2 + 6.76X1X2 − 133.01X12 − 248.05X22 | (2) |
The series variance analysis, including the model F-value, and the comparative values of R2, etc, are provided in Table 4. The “R2” values of Y1 and Y2 were greater than 0.97. The correlation between the predicted response value and actual response value is illustrated by the linear correlation plots shown in Figure 2A and B. The high values of R2 (Q24, 0.9747; Jss, 0.9901) indicate that the predicted response value and actual response value correlated well. An analysis of variance and co-fitting diagnosis confirmed the suitability of the model for guiding further optimization.
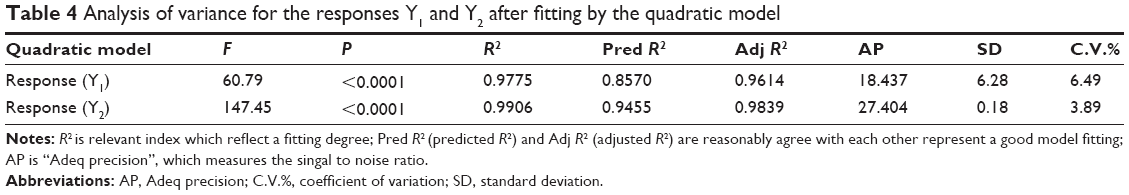 | Table 4 Analysis of variance for the responses Y1 and Y2 after fitting by the quadratic model |
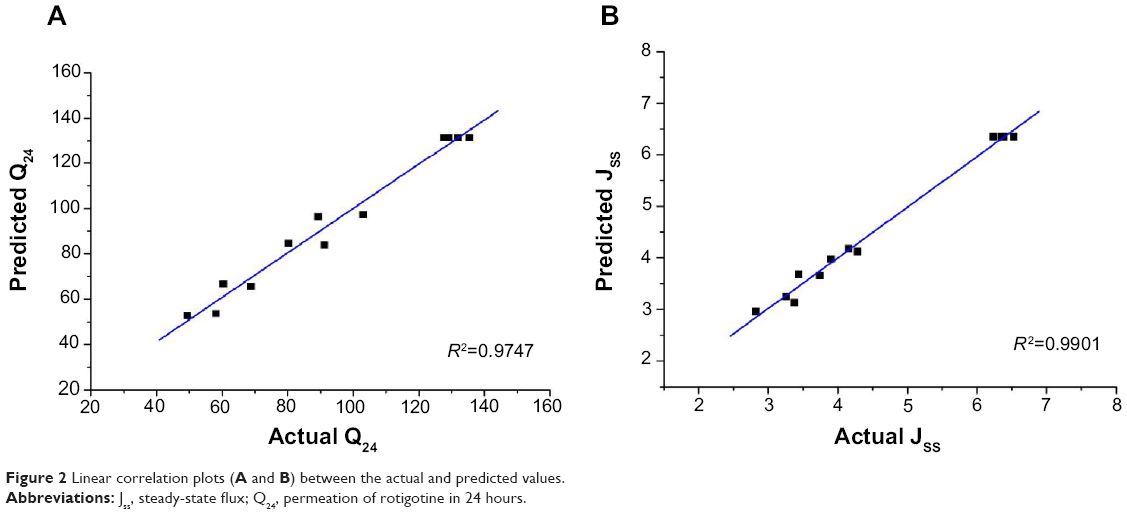 | Figure 2 Linear correlation plots (A and B) between the actual and predicted values. |
The contour and response surface plots are shown in Figure 3. According to Figure 3A and B, the maximum value of Q24 was obtained when the water content was 57%–70% and oil/Smix was 0.19–0.30. In this region, Q24 was greater than 120 μg/cm2, and the maximum point was in the center of this area. According to Figure 3C and D, the maximum value of Jss was obtained when the content of water was 58%–70% and oil/Smix was 0.20–0.28. In this region, Jss was greater than 5.8 μg/cm2·h, and the maximum point was in the center of this area. In conclusion, based on CCD, Q24, and Jss were maximized.
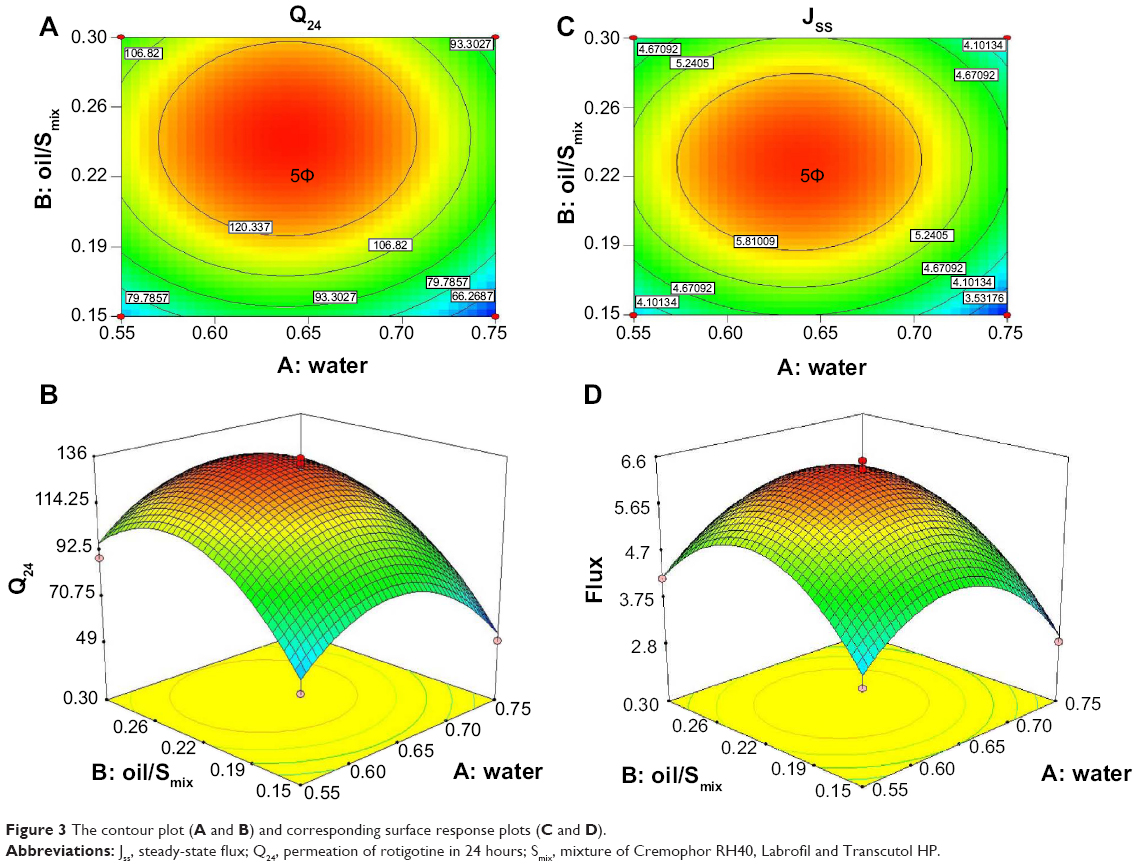 | Figure 3 The contour plot (A and B) and corresponding surface response plots (C and D). |
The aim of optimization is to produce the formulation with the highest Q24 and Jss values. The optimal formulation was obtained when the water content was 68% and oil/Smix was 0.27. The final composition was 6.8% Labrafil, 13.44% Cremophor RH40, 6.72% Labrasol, 5.04% Transcutol HP, and 68% water.
This optimum formulation was prepared for use in an in vitro permeation study. The predicted and experimental values of the response variables as well as the prediction error percentage are shown in Table 5. The predicted error was less than 5%, indicating that the actual responses were very similar to the predicted values.
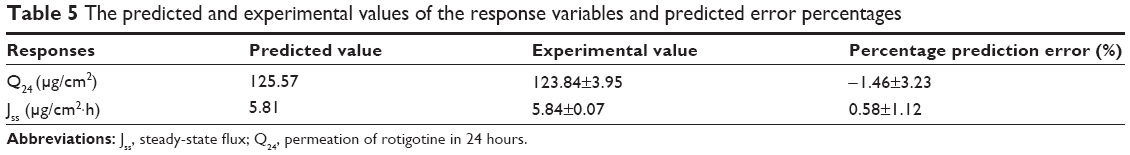 | Table 5 The predicted and experimental values of the response variables and predicted error percentages |
In vitro skin permeation experiments
The permeability parameters of the microemulsions that were designed by CCD, including Q24 and Jss, are listed in Table 3. The permeability curves of the rotigotine-loaded microemulsions are shown in Figure 4. The lag time of all the rotigotine microemulsions was close to 0 (data not shown). The Q24 and Jss of the control group, which contained 2% (w/w) rotigotine in Labrafil, were 33.33 μg/cm2 and 1.66 μg/cm2·h, respectively. The changes to Q24 and Jss were obvious in the different microemulsion formulations. When the particle size was smaller, the surface tension of the microemulsions was lower, which may result in moister skin and facilitate drug penetration into the skin. Similarly, larger particle sizes, such as in microemulsion formulation (ME)4 and ME11, had lower Q24 and Jss values. The surfactant and cosurfactant, ie, Labrasol and Transcutol HP, enhanced rotigotine solubility and facilitated drug penetration into the skin due to hydration of the stratum corneum.14,17 Compared with oil, if the amount of Smix was increased, the Q24 and Jss values decreased, such as in ME1, ME5, and ME12. Although the microemulsion particles sizes were small, the thermodynamic activity of the microemulsions decreased, and the distribution of the drug between the inner and outer phases was inhibited. When the amounts of surfactant, cosurfactant, and oil increased, such as in ME3, ME7, and ME12, the affinity of the microemulsion for the drug was too strong to permit rapid release of the drug into the aqueous phase, resulting in lower values of Q24 and Jss. In addition, when the water content was decreased, the viscosity of the microemulsion system increased, which may also inhibit the rate of drug distribution. In conclusion, the rate-limiting step of transdermal drug movement from the microemulsion has two parts; first, the drug distribution between the inner phase and outer phase of the vehicle; and second, the skin permeation process.
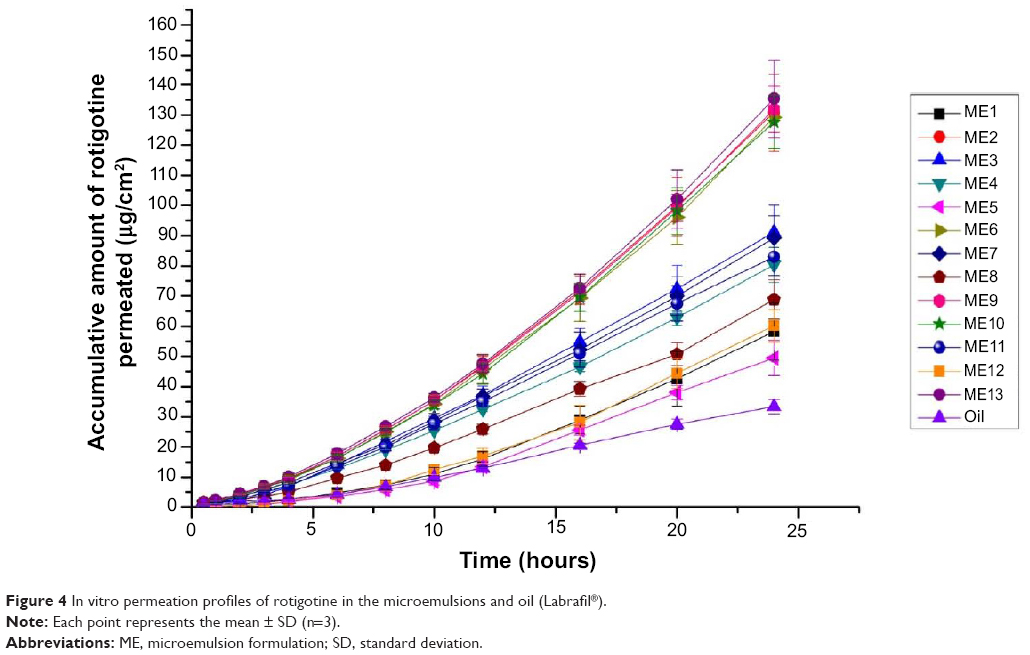 | Figure 4 In vitro permeation profiles of rotigotine in the microemulsions and oil (Labrafil®). |
Microemulsion characteristics
The drug-loading of the optimized microemulsion was 2% (w/w). The viscosity, particle size, and polydispersity index of the CCD formulations are listed in Table 3. The particle size increased as oil/Smix increased. The water content did not obviously influence particle size. Smaller particle sizes may reduce the surface tension of the microemulsion, which may facilitate percutaneous drug penetration. The polydispersion index is a measure of particle uniformity. In the majority of the formulations, the polydispersion index was lower than 0.2, which indicates uniform particle size. The particle size and polydispersion index of the optimized rotigotine-loaded microemulsion were 27.1±1.69 nm and 0.109±0.0037, respectively.
Water content greatly influenced the viscosity of the microemulsion. As the water content decreased to 65%, the viscosity of the microemulsion noticeably increased. The viscosity of the optimized rotigotine-loaded microemulsion was 26±1.77 mPa·s.
A transmission electron microscopy image of the optimized rotigotine-loaded microemulsion is shown in Figure 5. The particle was well regulated and uniform.
 | Figure 5 Transmission electron microscopy of the rotigotine-loaded microemulsion. |
No phase separation or drug precipitation was observed after the six heating–cooling cycles used in the short-term stability study for the rotigotine-loaded microemulsion. Moreover, no phase separation or deposition after centrifugation was observed after 0, 1, 2, 3, and 6 months at 4°C, in the long-term stability study. All these results demonstrated the stability of the rotigotine-loaded microemulsion was good.
Rotigotine microemulsion gel preparation
The rotigotine microemulsion gel was prepared by adding Carbomer 1342 directly to the microemulsion and allowing the gel to fully swell until transparency was observed. The results demonstrated that the amount of transdermal rotigotine was greatest when the Carbomer 1342 content was 1%. When the concentration of Carbomer 1342 was 1.0%, the viscoelastic and flow properties of the microemulsions were suitable to ensure adequate performance during topical and transdermal administration. The permeation plot is shown in Figure 6.
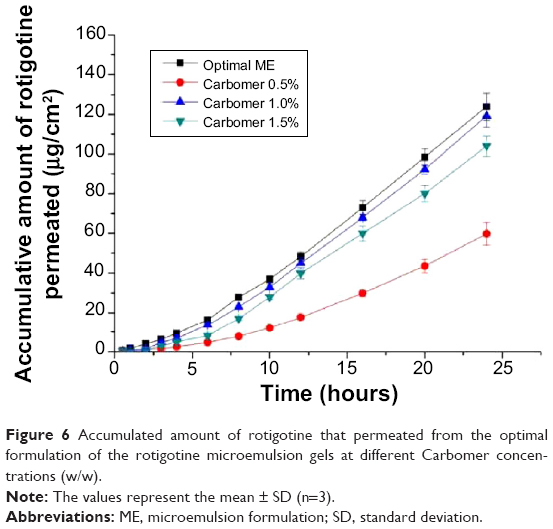 | Figure 6 Accumulated amount of rotigotine that permeated from the optimal formulation of the rotigotine microemulsion gels at different Carbomer concentrations (w/w). |
Pharmacokinetic studies
The plasma rotigotine concentration vs time profiles and related pharmacokinetic parameters are shown in Figure 7 and Table 6, respectively. The group that received the gel had maximum plasma rotigotine concentrations at 6.67±1.03 hours after administration; in the Neupro group, the maximum concentration occurred at 7.33±2.42 hours. The area under the concentration–time curve (AUC) of the gel was 179.68±34.85 μg·h/mL, and the relative bioavailability was 105.76%±20.52%. The rotigotine microemulsion gel exhibited considerably improved bioavailability and a faster permeation rate at the early postadministration time points, although the plasma concentration curve of the gel was not as steady as that of Neupro. In conclusion, the microemulsion gel may represent an alternative administration method to Neupro, but the gel requires further improvement.
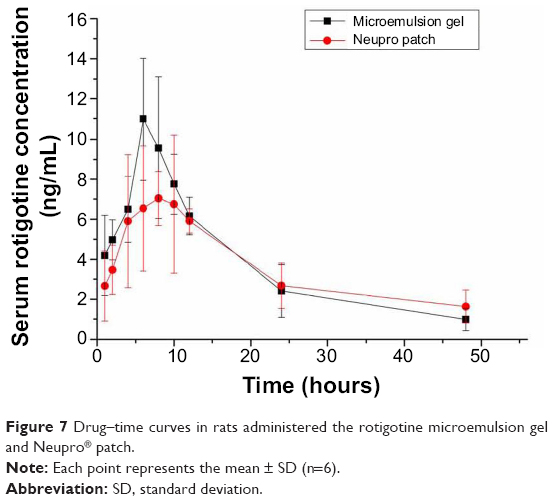 | Figure 7 Drug–time curves in rats administered the rotigotine microemulsion gel and Neupro® patch. |
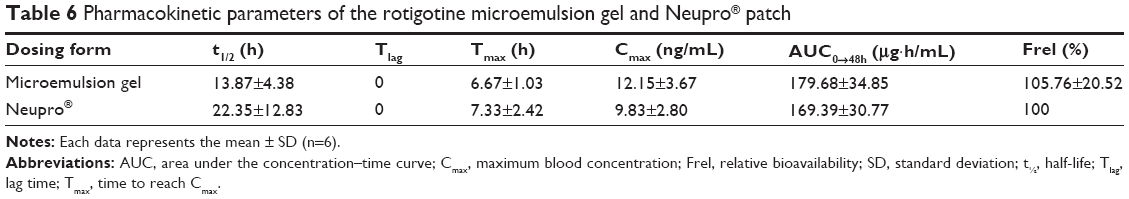 | Table 6 Pharmacokinetic parameters of the rotigotine microemulsion gel and Neupro® patch |
Skin irritancy observation
Average skin irritation response scores are shown in Table 7. Rat skin before administration is shown in Figure 8A. No erythema was observed in the microemulsion gel group, as shown in Figure 8B, resulting in a score of 0. However, half of the animals in the Neupro group exhibited obvious erythema, as shown in Figure 8C, resulting in a score of 1.33±0.52. These results suggest that the microemulsion gel is less irritating to the skin than is Neupro. In the Neupro group, obvious erythema was observed on the rat abdominal skin, and the skin was dry. In contrast, the rat abdominal skin of the gel group could maintain moisture, and no erythema was observed. Thus, the microemulsion gel should be used to protect skin due to its moisturizing effect, as it has high water content. In addition, hydrogels have received considerable interest as leading candidates for engineered tissue scaffolds, due to their unique composition and structural similarities to the native extracellular matrix, as well as their desirable framework for cellular proliferation and survival.10 From these results, we can conclude that the hydrogel matrix of the microemulsion gel had more moderate effects on the skin than did the silicone matrix of Neupro. The microemulsion hydrogel matrix displayed high water content and permeability as well as minimal skin irritation, which may improve patient compliance.
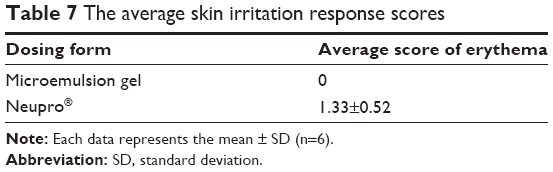 | Table 7 The average skin irritation response scores |
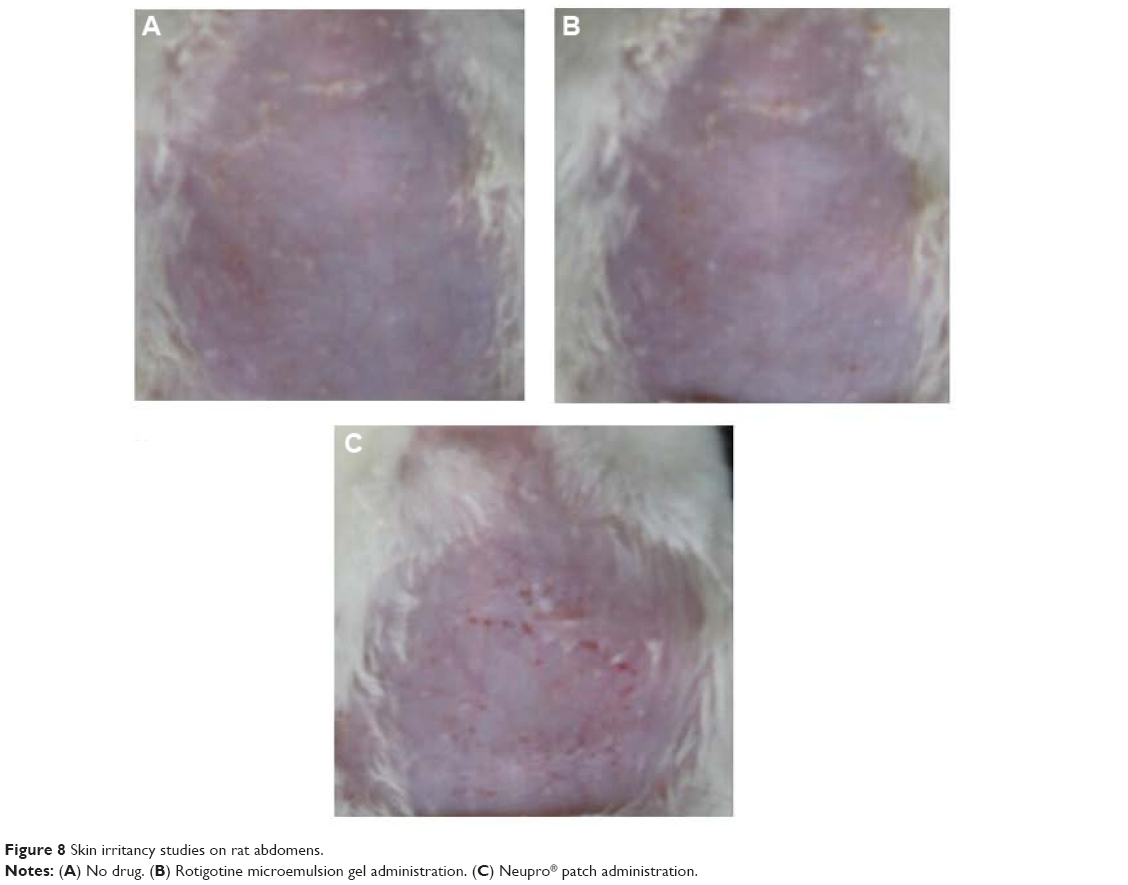 | Figure 8 Skin irritancy studies on rat abdomens. |
Conclusion
In the present studies, two types of surfactants were used synergistically in the microemulsion to achieve the desired rotigotine solubility and stability. Compared with Neupro, the rotigotine microemulsion gel exhibited similar bioavailability as well as moderate effects on the skin and decreased application site reactions. In conclusion, the rotigotine microemulsion gel is a potential alternative for rotigotine delivery.
Acknowledgment
The authors are grateful to an award from the Taishan Scholar Project for Zimei Wu.
Disclosure
The authors report no conflicts of interest in this work.
References
Scheller D, Ullmer C, Berkels R, Gwarek M, Lübbert H. The in vitro receptor profile of rotigotine: a new agent for the treatment of Parkinson’s disease. Naunyn Schmiedebergs Arch Pharmacol. 2009;379(1):73–86. | ||
Swart PJ, De Zeeuw RA. Extensive gastrointestinal metabolic conversion limits the oral bioavailability of the dopamine D2 agonist N-0923 in freely moving rats. Pharmazie. 1992;47(8):613–615. | ||
Calabrese VP, Lloyd KA, Brancazio P, et al. N-0923, a novel soluble dopamine D2 agonist in the treatment of parkinsonism. Mov Disord. 1998;13(5):768–774. | ||
Antonini A, Bernardi L, Calandrella D, Mancini F, Plebani M. Rotigotine transdermal patch in the management of Parkinson’s disease (PD) and its night-time use for PD-related sleep disorders. Funct Neurol. 2010;25(1):21–25. | ||
Gannu R, Palem CR, Yamsani VV, Yamsani SK, Yamsani MR. Enhanced bioavailability of lacidipine via microemulsion based transdermal gels: formulation optimization, ex vivo and in vivo characterization. Int J Pharm. 2010;388(1–2):231–241. | ||
Salimi A, Sharif Makhmal Zadeh B, Moghimipour E. Preparation and characterization of cyanocobalamin (vit B12) microemulsion properties and structure for topical and transdermal application. Iran J Basic Med Sci. 2013;16(7):865–872. | ||
Chen H, Chang X, Du D, Li J, Xu H, Yang X. Microemulsion-based hydrogel formulation of ibuprofen for topical delivery. Int J Pharm. 2006;315(1–2):52–58. | ||
Lawrence MJ, Rees GD. Microemulsion-based media as novel drug delivery systems. Adv Drug Deliv Rev. 2000;45(1):89–121. | ||
Chen H, Mou D, Du D, et al. Hydrogel-thickened microemulsion for topical administration of drug molecule at an extremely low concentration. Int J Pharm. 2007;341(1–2):78–84. | ||
El-Sherbiny IM, Yacoub MH. Hydrogel scaffolds for tissue engineering: Progress and challenges. Glob Cardiol Sci Pract. 2013;2013(3):316–342. | ||
Moghimipour E, Salimi A, Karami M, Isazadeh S. Preparation and characterization of dexamethasone microemulsion based on pseudoternary phase diagram. Jundishapur J Nat Pharm Prod. 2013;8(3):105–112. | ||
Panapisal V, Charoensri S, Tantituvanont A. Formulation of microemulsion systems for dermal delivery of silymarin. AAPS Pharm Sci Tech. 2012;13(2):389–399. | ||
Hayton WL, Chen T. Correction of perfusate concentration for sample removal. J Pharm Sci. 1982;71(7):820–821. | ||
Kommuru TR, Gurley B, Khan MA, Reddy IK. Self-emulsifying drug delivery systems (SEDDS) of coenzyme Q10: formulation development and bioavailability assessment. Int J Pharm. 2001;212(2):233–246. | ||
Delongeas JL, de Conchard GV, Beamonte A, et al. Assessment of Labrasol/Labrafil/Transcutol (4/4/2, v/v/v) as a non-clinical vehicle for poorly water-soluble compounds after 4-week oral toxicity study in Wistar rats. Regul Toxicol Pharmacol. 2010;57(2–3):284–290. | ||
Zhang Y, Wang Y, Wang ZG, et al. Optimization of fermentation medium for the production of atrazine degrading strain Acinetobacter sp. DNS(32) by statistical analysis system. J Biomed Biotechnol. 2012;2012:623062. | ||
Mahdi ES, Sakeena MH, Abdulkarim MF, Abdullah GZ, Sattar MA, Noor AM. Effect of surfactant and surfactant blends on pseudoternary phase diagram behavior of newly synthesized palm kernel oil esters. Drug Des Devel Ther. 2011;5:311–323. |
 © 2015 The Author(s). This work is published and licensed by Dove Medical Press Limited. The
full terms of this license are available at https://www.dovepress.com/terms
and incorporate the Creative Commons Attribution
- Non Commercial (unported, 3.0) License.
By accessing the work you hereby accept the Terms. Non-commercial uses of the work are permitted
without any further permission from Dove Medical Press Limited, provided the work is properly
attributed. For permission for commercial use of this work, please see paragraphs 4.2 and 5 of our Terms.
© 2015 The Author(s). This work is published and licensed by Dove Medical Press Limited. The
full terms of this license are available at https://www.dovepress.com/terms
and incorporate the Creative Commons Attribution
- Non Commercial (unported, 3.0) License.
By accessing the work you hereby accept the Terms. Non-commercial uses of the work are permitted
without any further permission from Dove Medical Press Limited, provided the work is properly
attributed. For permission for commercial use of this work, please see paragraphs 4.2 and 5 of our Terms.