Back to Journals » Cancer Management and Research » Volume 11
Loss of KCNJ15 expression promotes malignant phenotypes and correlates with poor prognosis in renal carcinoma
Authors Liu Y, Wang H, Ni B, Zhang J, Li S ![]() , Huang Y, Cai Y, Mei H, Li Z
, Huang Y, Cai Y, Mei H, Li Z
Received 17 August 2018
Accepted for publication 15 November 2018
Published 7 February 2019 Volume 2019:11 Pages 1211—1220
DOI https://doi.org/10.2147/CMAR.S184368
Checked for plagiarism Yes
Review by Single anonymous peer review
Peer reviewer comments 2
Editor who approved publication: Dr Chien-Feng Li
Yang Liu,1,2,* Han Wang,1–3,* Beibei Ni,1,2 Jinghua Zhang,1,2 Shi Li,1,2 Yuqian Huang,1,2 Yanling Cai,1,2 Hongbing Mei,1–3 Zesong Li1,2
1Guangdong Key Laboratory of Systems Biology and Synthetic Biology for Urogenital Tumors, Shenzhen Second People’s Hospital, First Affiliated Hospital of Shenzhen University, Shenzhen 518035, China; 2Shenzhen Key Laboratory of Genitourinary Tumor, Shenzhen Second People’s Hospital, First Affiliated Hospital of Shenzhen University, Shenzhen, China; 3Department of Urinary Surgery, Shenzhen Second People’s Hospital, The First Affiliated Hospital of Shenzhen University, Shenzhen, China
*These authors contributed equally to this work
Background: KCNJ15 belongs to the inwardly rectifying potassium channel (KIR) family. Although members of the KIR family have been proven to play important roles in a variety of developmental processes, the molecular role and clinical effects of KCNJ15 in cancers remain unclear.
Purpose: The aim of this study was to identify the expression, biological functions and molecular mechanisms of KCNJ15 in renal cell carcinoma (RCC).
Methods: KCNJ15 mRNA expression was evaluated in kidney cancer tissue, paired adjacent normal tissue, and cell lines with qRT-PCR. KCNJ15 protein expression was investigated via western blotting and immunohistochemistry. In addition, the clinical and prognostic significance of KCNJ15 in RCC were assessed using Kaplan-Meier analysis and Cox proportional hazards analysis. In vitro, the effects of KCNJ15 on kidney cancer cells were evaluated by means of a cell counting kit-8, transwell assay along with flow cytometry, respectively. Moreover, the potential mechanism of KCNJ15 was demonstrated by Western blot.
Results: Here, we first found that KCNJ15 was significantly downregulated in RCC, and this low expression was an independent prognostic factor for clear cell RCC (ccRCC). Moreover, KCNJ15 was associated with advanced TNM stage (n=150, p=0.014) and histological grade (n=150, p=0.045). Furthermore, KCNJ15 overexpression significantly inhibited RCC cell proliferation, migration, and colony formation, arrested the cell cycle and induced apoptosis of RCC cells in vitro. The inhibitory effect of KCNJ15 overexpression may be regulated by its effects on the epithelial mesenchymal transition (EMT) process and matrix metalloproteinase (MMP)-7 and p21 expression.
Conclusion: These findings indicate that KCNJ15 may be a tumour suppressor in RCC and a possible target for RCC therapy.
Keywords: KCNJ15, renal cell carcinoma, biomarker, tumor suppressor, prognosis
Introduction
Renal cell carcinoma (RCC), accounting for 80%–90% of the renal tumors, is a common malignant tumor of the genitourinary system.1,2 Approximately 75%–85% of the RCC cases are clear cell RCC (ccRCC).3,4 Around one-third of the patients diagnosed with RCC already have locally advanced or metastatic disease. The metastasis of RCC is the leading cause of the high mortality rate in patients with RCC.2,5,6 Therefore, the study of the molecular mechanism of the occurrence, development, and metastasis of RCC and the identification of new specific early diagnostic biomarkers and therapy targets for RCC are imperative.
The inwardly rectifying potassium channel (KIR) family mainly consists of 7 subfamilies (KIR1.x–KIR7.x) and has ~20 members.7 The inward rectification property of the inwardly rectifying calcium-activated potassium (KC) (Kir) channels is mediated by positively charged intracellular small molecules called polyamines.8 KIR channels have been shown to play an important role in the resting membrane potential, K1 homeostasis maintenance, heart rate control, and hormone secretion.9,10 In addition, KIR channel function can be regulated by many other factors in vitro and in vivo.11
KCNJ15, also known as IRKK, KIR1.3, and KIR4.2, is a member of the KIR4.x subfamily and encodes a potassium (K) channel. KCNJ15 was first cloned from human embryonic kidney cells. It has eight different transcriptional mutants, but each encodes the same protein KIR4.2 (KCNJ15 protein).12 Previous studies have shown that KCNJ15, a susceptibility gene for type 2 diabetes, is upregulated by glucose and has a remarkable inhibitory effect on insulin secretion.13–15 Moreover, KCNJ15 is the most highly expressed among all K+ channels in the stomach and plays an essential role in the stimulation of gastric acid secretion.16,17 In addition, KCNJ15 is located on chromosome 21 in the Down syndrome chromosome region 1 and has been reported to be associated with Down syndrome.18,19 However, up until now, whether KCNJ15 plays any role in cancers has remained unclear.
In this study, we first examined the relationship between KCNJ15 gene expression and the clinicopathological features of RCC. Furthermore, we explored the functional roles of the KCNJ15 gene and the related molecular mechanisms in RCC. Our findings will provide a theoretical basis for the early diagnosis and specifically targeted therapy of RCC.
Materials and methods
Patient tissue specimens
In this study, 57 pairs of ccRCC tissues and paired paracancerous tissues were collected during surgery in the Second Affiliated Hospital of Lanzhou University. Tissue samples were fixed in RNAlater reagent and immediately stored in liquid nitrogen until required. All patients were pathologically diagnosed with RCC and had no history of chemotherapy or radiotherapy preoperatively.
Cell lines and culture
The human renal cancer cell lines (786-O, 769-P, Caki-1, Caki-2, and OS-RC-2) were purchased from the American Type Culture Collection (ATCC) (Manassas, VA, USA). According to the ATCC protocols, the cells were cultivated in RPMI-1640 or McCoy’s 5A medium supplemented with 10% FBS (Thermo Fisher Scientific, Waltham, MA, USA) in a humidified atmosphere with 5% CO2 at 37°C.
RNA extraction and quantitative real-time reverse transcription PCR (qRT-PCR)
Trizol reagent (Thermo Fisher Scientific) was used to extract the total RNA from renal cancer cell lines or tissues. cDNA synthesis was performed using a reverse transcription kit (TOYOBO, Co. Ltd, Osaka, Japan). After reverse transcription, KCNJ15 mRNA expression was detected by using SYBR Premix Taq II (Takara, Shiga, Japan) with β-actin (ACTB) as an internal reference. The primers for KCNJ15 and ACTB were as follows: KCNJ15 primers: forward, 5′-CCACATCAGAACTCCCTTCAAACA-3′; reverse, 5′-AGTTCACTTTCAGACGAAGCACCTA-3′ and ACTB primers: forward, 5′-GAGATCAAGATCATTGCTCCTC-3′; reverse, 5′-AACTAAGTCATAGTCCGCCTAGAAG-3′.
Western blot
Protein from tissues or cells was extracted using cold RIPA lysis buffer (150 mM NaCl, 50 mM Tris-base, 5 mM EDTA, 1% NP-40, and 0.25% deoxycholate, pH 7.4) with protease inhibitors (Thermo Fisher Scientific). The obtained protein was relatively quantified using a Piece BCA Protein assay kit (Thermo Fisher Scientific) and then stored in a –80°C freezer. The extracted protein samples (20 µg) were electrophoresed by SDS-PAGE and transferred to polyvinylidene fluoride membranes. The membranes were blocked with 5% non-fat skim milk in 50 mM Tris–HCl, 50 mM NaCl, and 0.1% Tween-20 (TBST) at room temperature for 2 hours and then incubated with primary antibodies including mouse polyclonal anti-KCNJ15 antibodies (1:3,000 ratio; Santa Cruz Biotechnology Inc., Dallas, TX, USA) and rat polyclonal anti-GAPDH antibodies (1:8,000; Abcam, Cambridge, UK) at 4°C overnight. After the membranes were washed with 1× TBST buffer three times, horseradish peroxidase-labelled goat anti-rabbit antibodies (1:8,000; Abcam) and goat anti-mouse antibodies (1:8,000; Abcam) were added as secondary antibodies at room temperature with gentle shaking for 1 hour.
Immunohistochemical (IHC) analysis
IHC staining was conducted to detect KCNJ15 expression in RCC tissues and matched paracancerous tissues. A paraffin-embedded ccRCC tissue microarray (TMA) comprising 150 cancerous tissues and 30 adjacent tissues was obtained from the Shanghai Biochip Company Ltd. (Shanghai, China). After deparaffinization and rehydration, tissue sections were cooked for antigen repair in a microwave oven with sodium citrate solution (10 mM, pH 6.0) at high temperature for 2 minutes, medium temperature for 5 minutes, and low temperature for 10 minutes. Then, the slides were washed with PBS twice, incubated in 3% hydroxyl peroxide for 20 minutes to block endogenous peroxidase activity, and incubated with the anti-KCNJ15 antibody (1:600, HPA016702; Sigma-Aldrich Co., St Louis, MO, USA) at 4°C overnight. Tissue sections were placed at room temperature for half an hour and incubated with a biotin-labelled goat anti-rabbit antibody for 30 minutes. The staining for antigenic detection was performed with 3,3′-diaminobenzidine (DAB) solution (Dako Denmark A/S, Glostrup, Denmark). The duration of the DAB incubation was determined by observing the degree of staining under a microscope.
Overexpression
Full-length KCNJ15 cDNA and a negative control were cloned into a lentiviral vector (Gene Pharma, Shang Hai, China). For transfection, lentiviral constructs expressing KCNJ15 or negative control were transfected into Caki-2 and OS-RC-2 cell lines following the manufacturer’s instructions. The expression of the KCNJ15 gene was analyzed by Western blot and qRT-PCR.
Cell proliferation assays were evaluated using the cell counting kit-8 (CCK-8) assay (Dojindo, Kumamoto, Japan). Here, cell lines were seeded at a density of 2×10³ cells/well in a 96-well plate and allowed to grow for 24, 48, 72, and 96 hours. Then, the CCK-8 reagent was added to the plates, which were then incubated in a humidified atmosphere with 5% CO2 at 37°C for 2 hours. Cell viability was assessed by measuring the absorbance values at 450 nm.
Cell transwell assays
Transwell chambers (8 µm pore size; BD, Franklin Lakes, NJ, USA) were used to evaluate the cell migration capacity. Each group of RCC cells were harvested 48 hours after transfection. Briefly, 4×10⁴ cells were seeded in the top compartment, whereas 500 µL medium supplemented with 10% FBS was added to the lower chamber. The chambers were cultured in a humidified atmosphere with 5% CO2 at 37°C for 24 hours. Non-migratory cells on the upper side of the chambers were gently scrubbed, whereas migratory cells attached to the bottom surface of the membrane were fixed with 4% paraformaldehyde for 20 minutes and stained with 0.05% crystal violet for 15 minutes. Migrated cells in five random fields were counted under an Olympus microscope.
Colony formation assay
For cell colony formation, 1×10³ cells were plated in a cell culture dish and allowed to grow in a humidified atmosphere with 5% CO2 at 37°C for 1–2 weeks until each colony consisted of >50 cells. After the plates were washed twice with PBS, the colonies were fixed with 4% paraformaldehyde for 20 minutes, stained with 0.05% crystal violet for 15 minutes, photographed, and counted.
Flow cytometric analysis of cell cycle and apoptosis
For the cell cycle assessment, the cell lines used in the study were cultured in a T75 cell culture flask until 70%–80% confluency. Cells were harvested with trypsinization and fixed in ice-cold 75% ethanol at –20°C overnight. The cells were washed twice with PBS, resuspended with the PI/RNase staining buffer (BD Pharmingen™ catalog number 550825; BD Biosciences, San Jose, CA, USA) for 30 minutes in the dark at room temperature according to the manufacturer’s instructions and then detected using an FACScan flow cytometer (BD).
For the apoptosis analysis, 2×10⁵ cells were stained with Annexin V and phycoerythrin using an Annexin V Apoptosis Detection kit I (BD Pharmingen™ catalog number 559763; BD Biosciences) for 15 minutes and then analyzed with flow cytometry.
Statistical analyses
All statistical analyses were performed by using SPSS version 16.0 (SPSS Inc., Chicago, IL, USA). A chi-square test was used to compare the KCNJ15 expression levels with the clinicopathological characteristics. Survival curve analyses were performed using the Kaplan–Meier method. Differences were only considered significant when P-values <0.05.
Results
KCNJ15 expression in RCC tissues and cell lines
We first examined the relative RNA expression of KCNJ15 in 57 fresh paired RCC samples and adjacent non-tumor tissues by qRT-PCR to investigate KCNJ15 gene expression in RCC. As shown in Figure 1A, KCNJ15 expression was significantly lower in RCC tissues than in adjacent non-tumor tissues (P<0.05). The protein levels were confirmed by Western blot (Figure 1B).
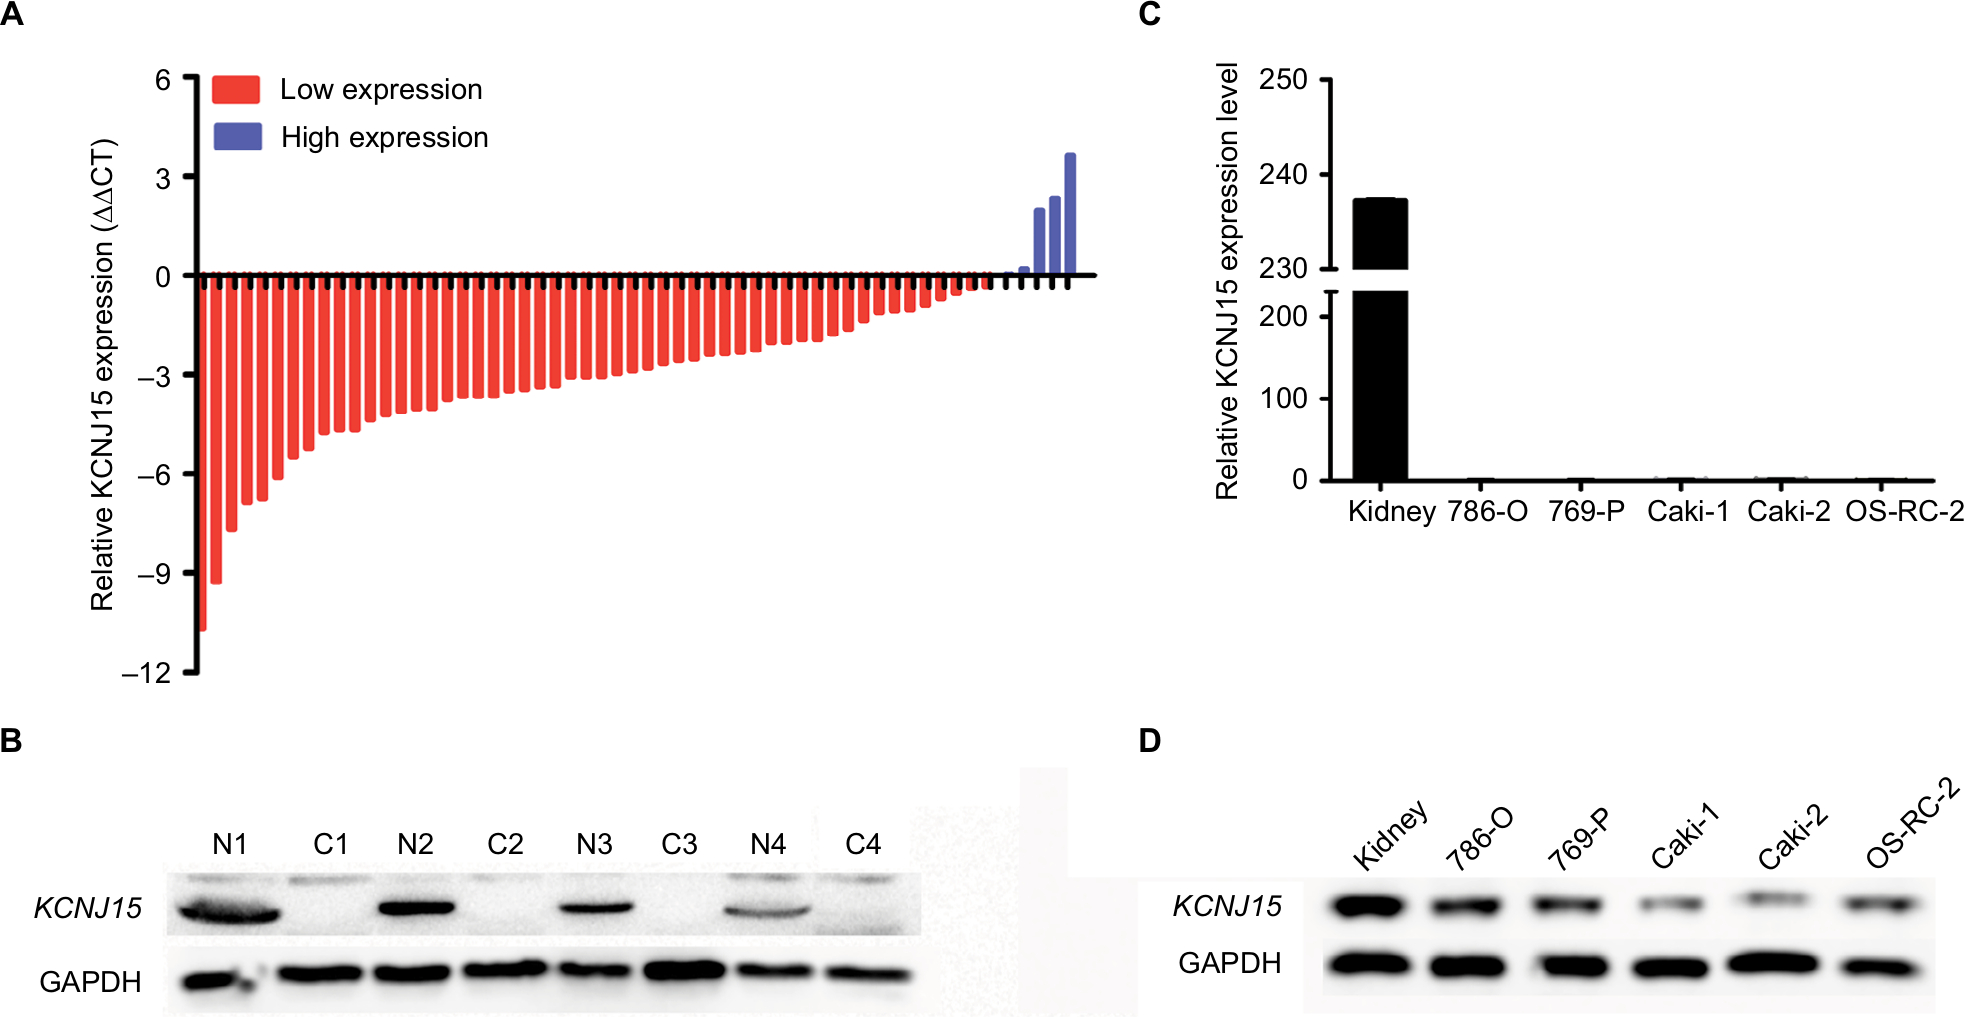 | Figure 1 KCNJ15 expression in RCC tissues, paracancerous tissues, and cell lines. Notes: (A) KCNJ15 mRNA expression levels in RCC tissues. (B) KCNJ15 protein levels in RCC tissues were determined using Western blot. (C) KCNJ15 mRNA expression levels were significantly lower in RCC cell lines (786-O, 769-P, Caki-1, Caki-2, and OS-RC-2) than in normal tissues. (D) KCNJ15 protein expression levels in renal cancer cell lines. N (1–4) are the adjacent non-tumor tissues; C (1–4) are the the RCC tissues. Abbreviation: RCC, renal cell carcinoma. |
We next conducted IHC analysis and demonstrated that KCNJ15 was primarily located in the cytoplasm of RCC cells and normal renal tubular epithelial cells to further validate the expression and location of KCNJ15 in RCC tissues and adjacent non-tumor tissues. In addition, statistical analysis revealed markedly lower KCNJ15 expression in RCC tissues than in adjacent non-tumor tissues (Figure 2A–D, P<0.001).
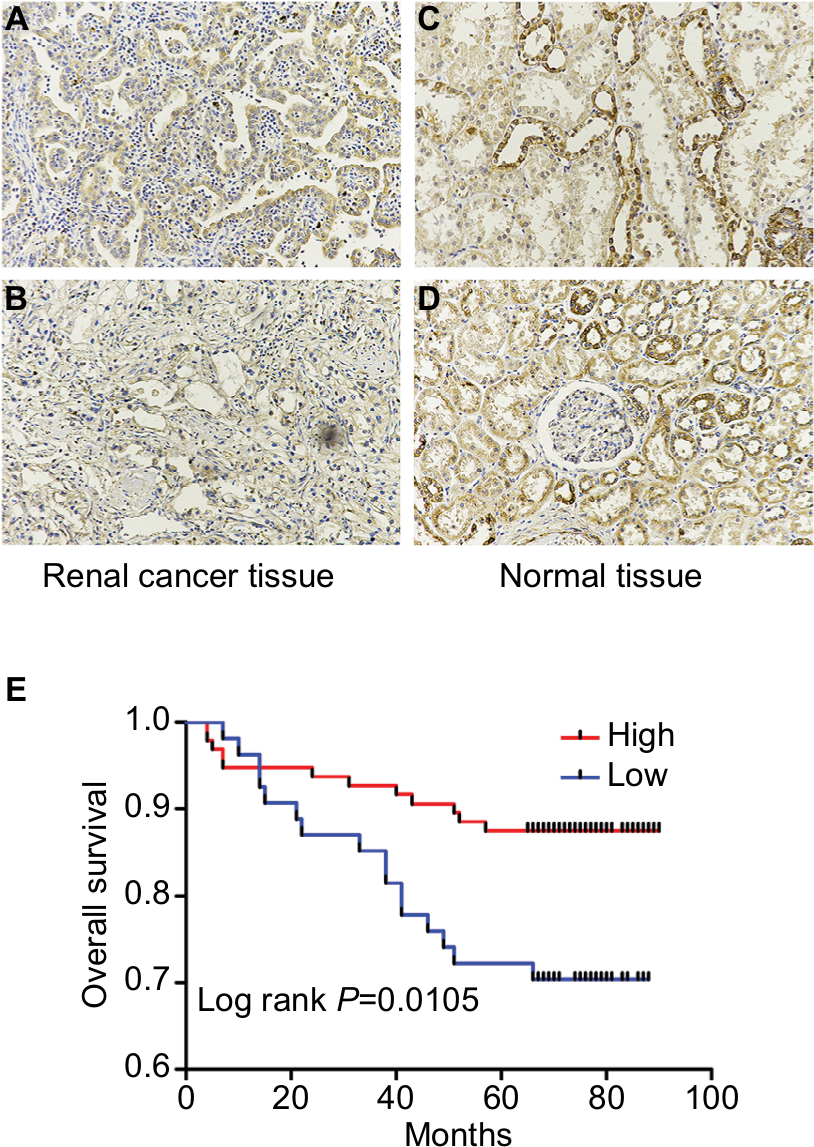 | Figure 2 KCNJ15 is downregulated in ccRCC. Notes: (A, B) Immumohistochemical staining of KCNJ15 protein expression in tumor renal tissues. (C, D) Immumohistochemical staining of KCNJ15 protein expression in adjacent tissues. (E) Kaplan–Meier survival analysis indicated that high expression of KCNJ15 increased the overall survival rate of patients with RCC. Data are presented as mean ± SD (log-rank P<0.05). Abbreviations: ccRCC, clear cell RCC; RCC, renal cell carcinoma. |
Similarly, the relative RNA and protein expression of KCNJ15 in 5 RCC cell lines (786-0, 769-P, CAKI-1, Caki-2, and OS-RC-2) was markedly lower than that in normal para-carcinoma tissue (Figure 1C and D), indicating that low KCNJ15 expression might be related to RCC progression.
Loss of KCNJ15 is significantly associated with poor survival of patients with ccRCC
We conducted IHC analysis on a TMA containing 150 ccRCC cancers to determine the relationship between KCNJ15 gene expression and prognosis of RCC patients. As shown in Table 1, among the 150 samples of paraffin-embedded ccRCC tissues, 96 samples (64%) expressed KCNJ15 at higher levels and 54 samples (36%) expressed KCNJ15 at low levels. Kaplan–Meier analysis demonstrated that the patients with low KCNJ15 expression had worse overall survival than patients with high KCNJ15 expression (P=0.0105) (Figure 2E), with a median survival time of 82 months for the high KCNJ15 expression group and 71 months for the low KCNJ15 expression group. Moreover, we found that low KCNJ15 expression was closely correlated with the clinical stage (n=150, P=0.014) and histological grade (P=0.045) of ccRCC patients. However, KCNJ15 expression in ccRCC patients was not correlated with age (n=150, P=0.337), gender (n=150, P=0.237), or tumor size (P=0.195) (Table 1).
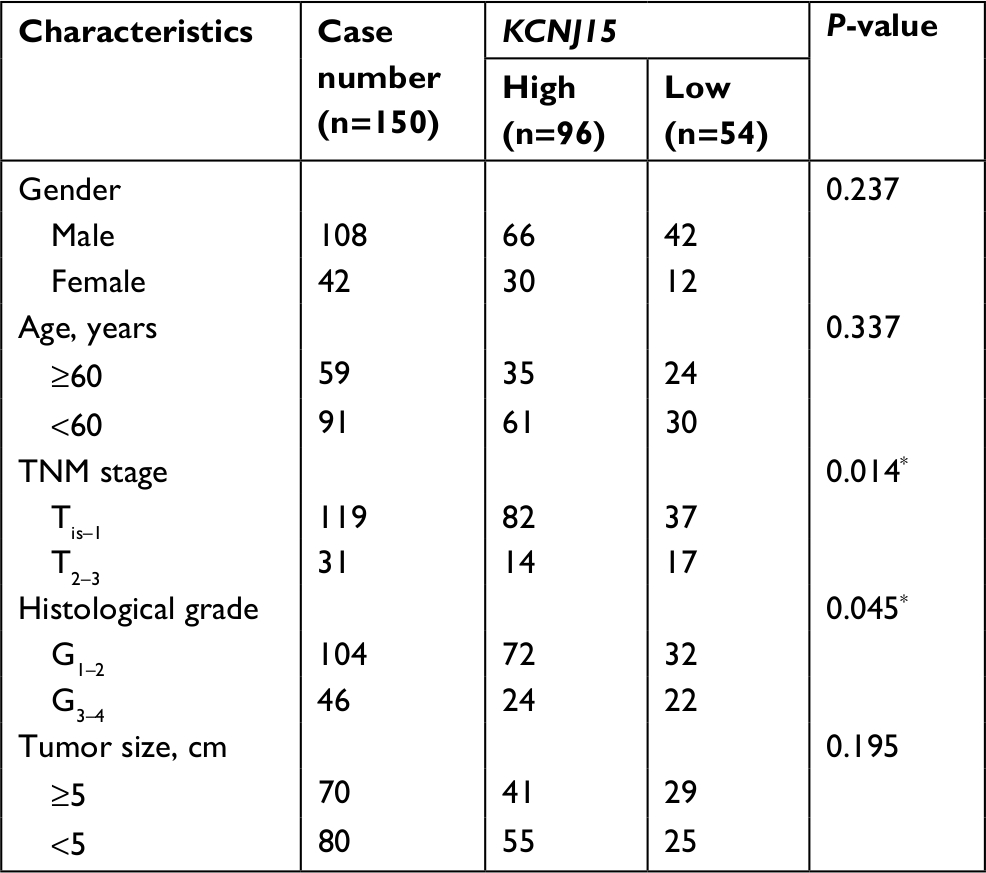 | Table 1 Correlation between KCNJ15 expression and clinicopathological characteristics of bladder cancer patients Note: P<0.05. |
We performed a Cox regression analysis to determine whether KCNJ15 expression is an independent prognostic factor for ccRCC. As shown in Table 2, multivariate analysis indicated that clinical stage (P=0.000, HR =0.167, 95% CI =0.077–0.36), histological grade (P=0.009, HR =0.350, 95% CI =0.160–0.767), and KCNJ15 expression (P=0.012, HR =0.375, 95% CI =0.175–0.803) were independent prognostic factors for overall survival in ccRCC (Table 2). These results showed that downregulation of KCNJ15 might serve as an independent predictor for patients with ccRCC.
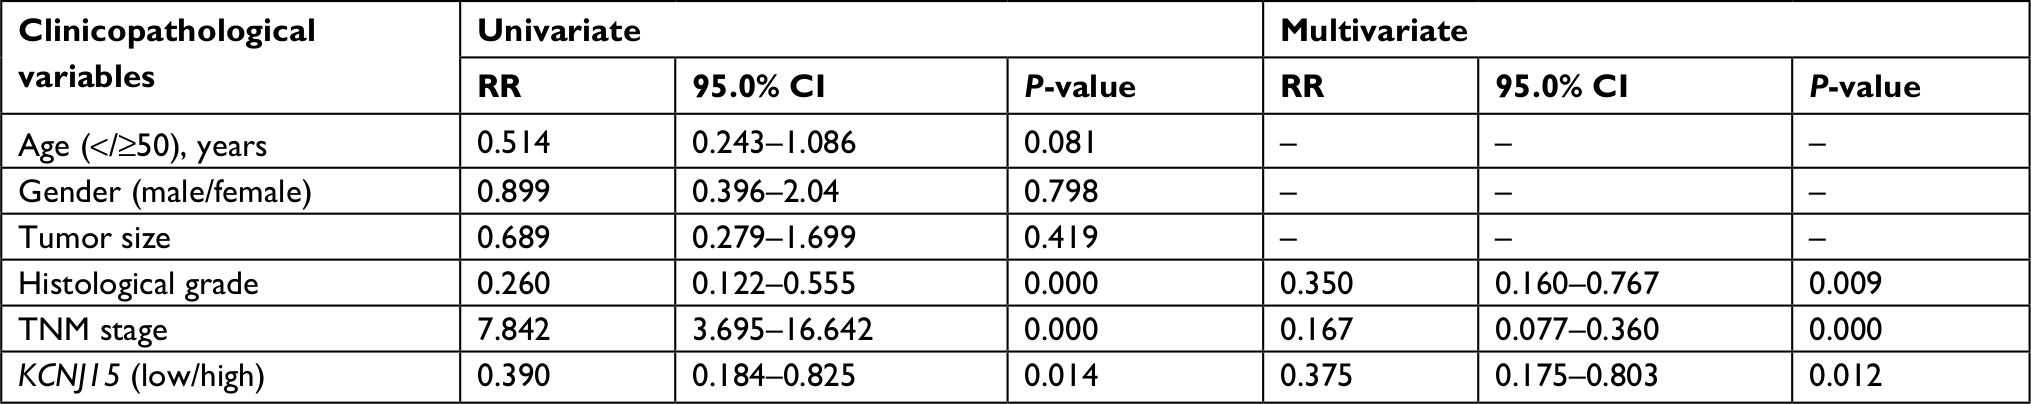 | Table 2 Univariate and multivariate analyses for overall survival |
Generation of overexpression cell lines
KCNJ15 was transfected into Caki-2 and OS-RC-2 cells to restore KCNJ15 expression to analyze the functions of KCNJ15 in RCC. As shown in Figure 3, the protein and mRNA levels of KCNJ15 were clearly higher in Caki-2 and OS-RC-2 cells transfected with KCNJ15 than in the untransfected control (NC) group, which was transfected with the empty vector.
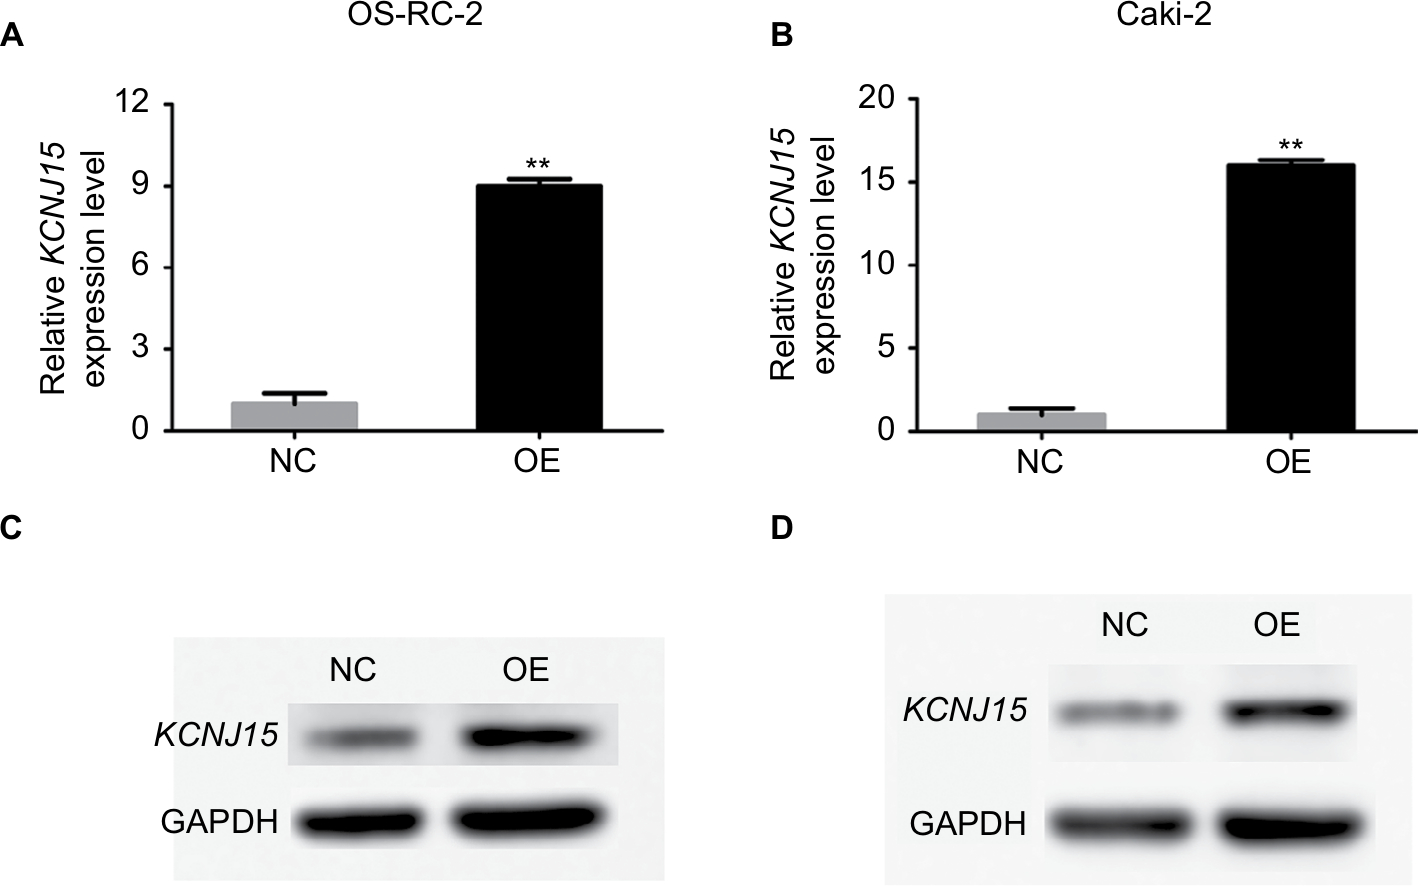 | Figure 3 KCNJ15 is overexpressed in Caki-2 and OS-RC-2 renal cancer cell lines. Notes: qRT-PCR and Western blot analysis of KCNJ15 in empty vector-transfected control (NC) and target gene-transfected cells (OE) are depicted for OS-RC-2 (A, C) and Caki-2 (B, D) cells. Data are presented as mean ± SD. **P<0.01 Abbreviation: qRT-PCR, quantitative real-time reverse transcription PCR. |
KCNJ15 decreases cell proliferation and colony formation in Caki-2 and OS-RC-2 cell lines
We performed CCK-8 cell proliferation assays to investigate the effect of KCNJ15 expression on the proliferation and growth of RCC cell lines. Here, the proliferation rate of KCNJ15-transfected cells was significantly lower than that in the control group (Figure 4A and D). Moreover, the colony formation assays demonstrated that KCNJ15 overexpression prevented the formation of colonies in both Caki-2 and OS-RC-2 cell lines (P<0.05) (Figure 4B, C, E, and F). These results revealed that the overexpression of the KCNJ15 gene inhibited RCC cell growth in vitro.
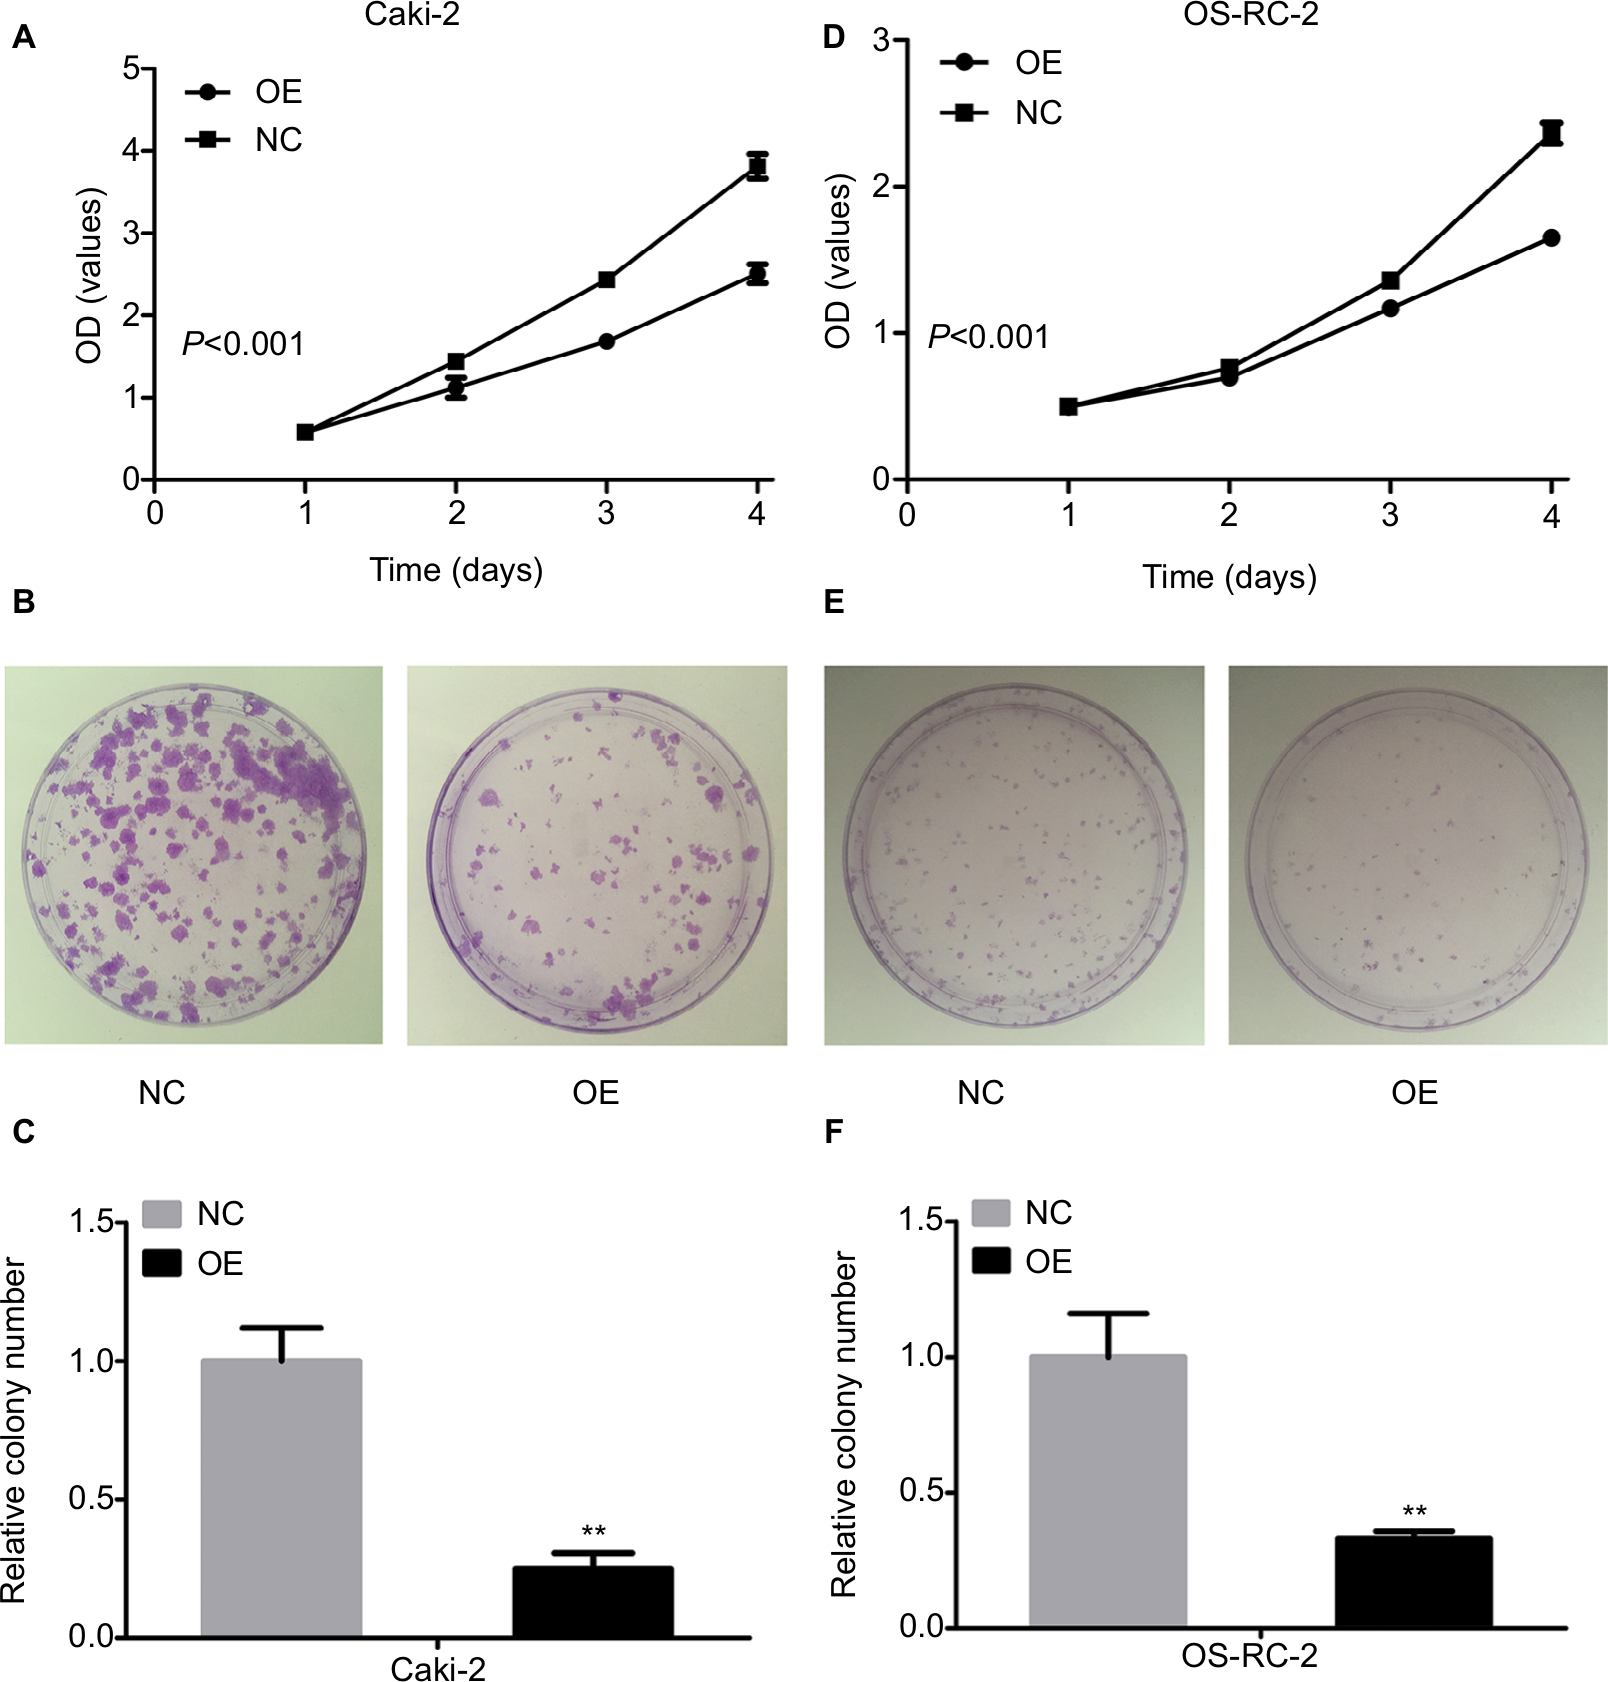 | Figure 4 KCNJ15 inhibits the growth of Caki-2 and OS-RC-2 cell lines. Notes: (A and D) The cell proliferation rate of Caki-2 and OS-RC-2 KCNJ15 overexpression cells as assessed by the OD value was detected by CCK-8 assay. (B and E) The number of colonies of Caki-2 and OS-RC-2 cell lines with KCNJ15 overexpression. (C and F) Histogram of the number of colonies of Caki-2 and OS-RC-2 cell lines with KCNJ15 overexpression. **P<0.01 compared with the NC group. Each assay was performed in triplicate. NC, untransfected control; OE, target gene-transfected cells. Abbreviation: CCK-8, cell counting kit-8. |
KCNJ15 overexpression prevents migration in Caki-2 and OS-RC-2 cell lines
We performed the transwell assays in two cell lines (Caki-2 and OS-RC-2) to determine the migration capacity of RCC cells overexpressing KCNJ15. In the migration assays, the number of migrated cells in the KCNJ15 overexpression groups was significantly lower than that in the control cells (P<0.01, Figure 5), suggesting that KCNJ15 overexpression inhibited cell migration in RCC.
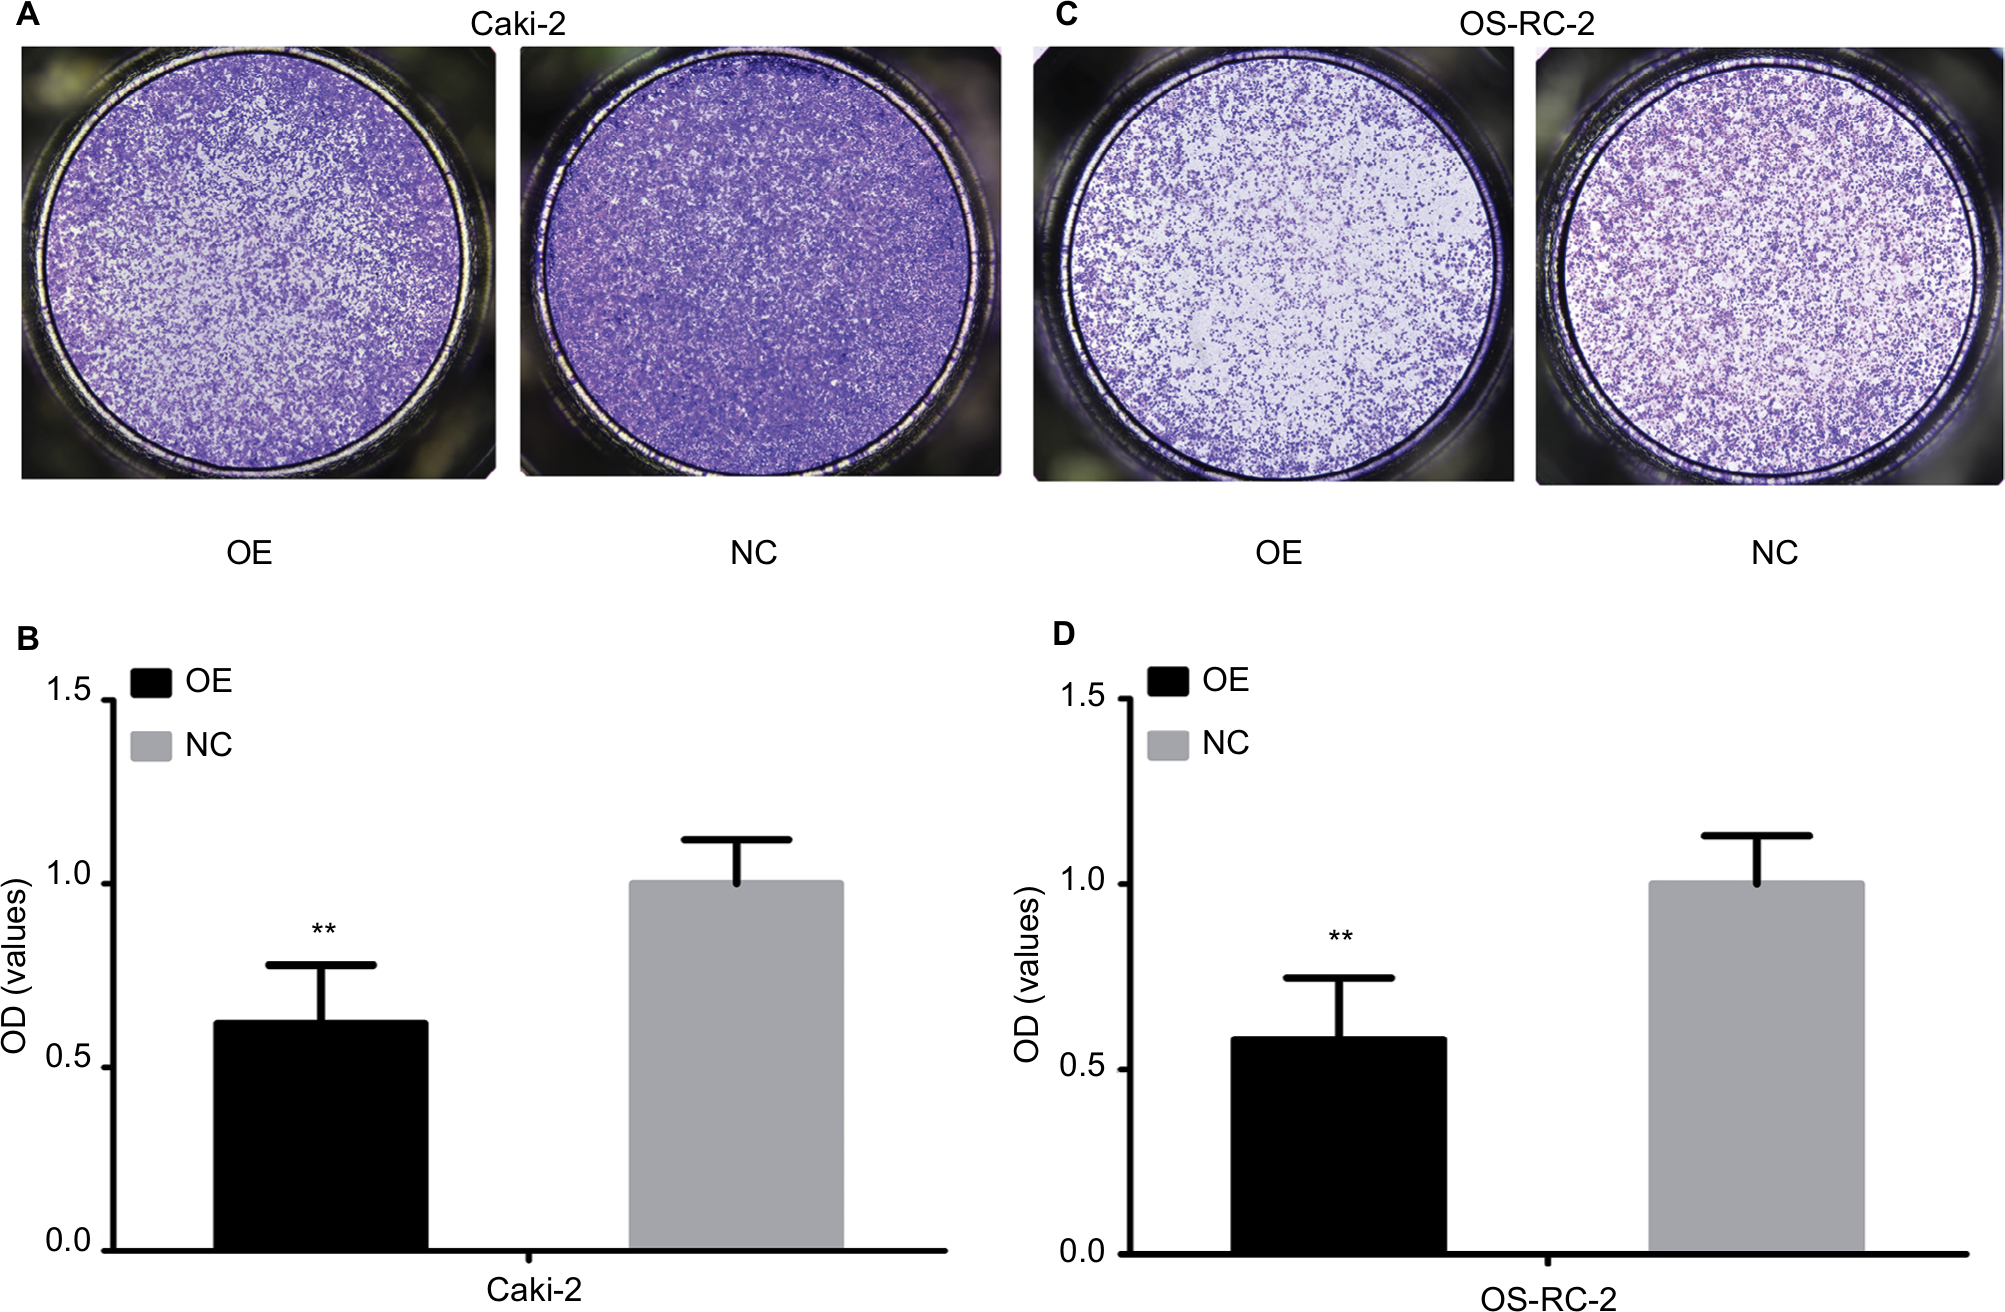 | Figure 5 Overexpression of KCNJ15 inhibits the migration ability of RCC cell lines in vitro. Notes: (A and B) The effect of KCNJ15 overexpression on Caki-2 cell migration was examined by transwell assay. (C and D) The effect of KCNJ15 overexpression on OS-RC-2 cell migration was examined by transwell assay. Data are presented as mean ± SD. **P<0.01. Each experiment was repeated three times independently. NC, un-transfected control; OE, target gene-transfected cells. Abbreviation: RCC, renal cell carcinoma. |
KCNJ15 overexpression induces cell cycle arrest
We performed flow cytometric analysis to further investigate whether the effect of KCNJ15 overexpression on cell proliferation reflected a cell cycle arrest. As expected, more KCNJ15 overexpression cells were in the G0/G1 phase and fewer were in the S phase when compared with the NC cells (Figure 6), suggesting that KCNJ15 overexpression suppressed cell proliferation by inducing cell cycle arrest at the G1 phase.
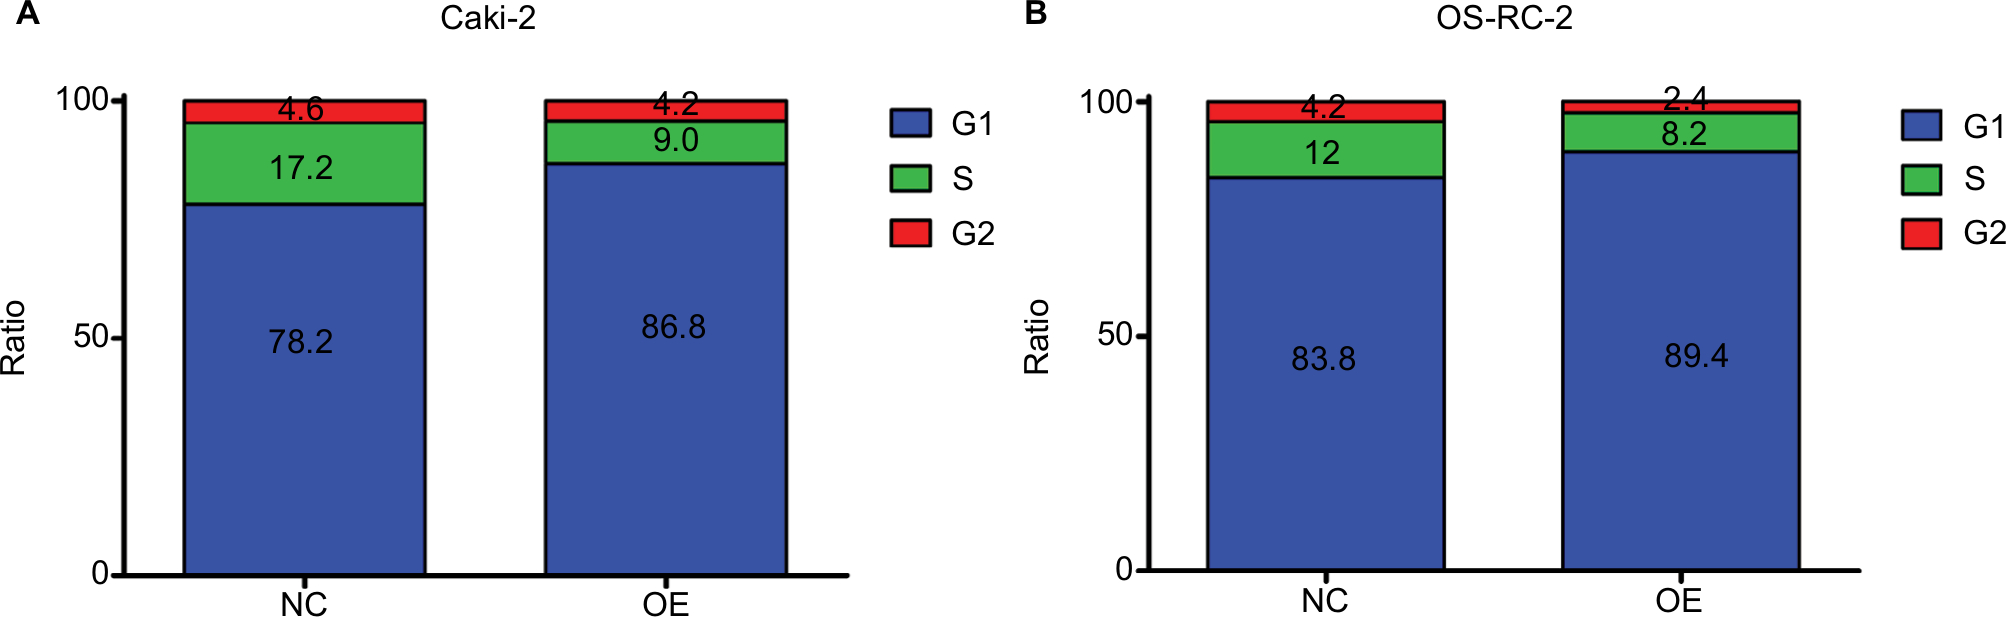 | Figure 6 The effect of KCNJ15 expression on the cell cycle. Notes: (A and B) Both Caki-2 and OS-RC-2 cell lines exhibited cell cycle arrest at the G1 phase. All assays were performed three times independently. NC, un-transfected control; OE, target gene-transfected cells. |
KCNJ15 overexpression induces apoptosis in Caki-2 and OS-RC-2 cell lines
We conduced flow cytometric analysis to verify whether the overexpression of the KCNJ15 gene affected cell apoptosis. Quantitative analysis of apoptosis revealed that KCNJ15 overexpression increased the cell apoptosis rates by ~11.8% in the Caki-2 cell line (P<0.01; Figure 7A and B) and 10% in the OS-RC-2 cell line (P<0.01; Figure 7C and D) relative to the apoptosis rates in the NC groups.
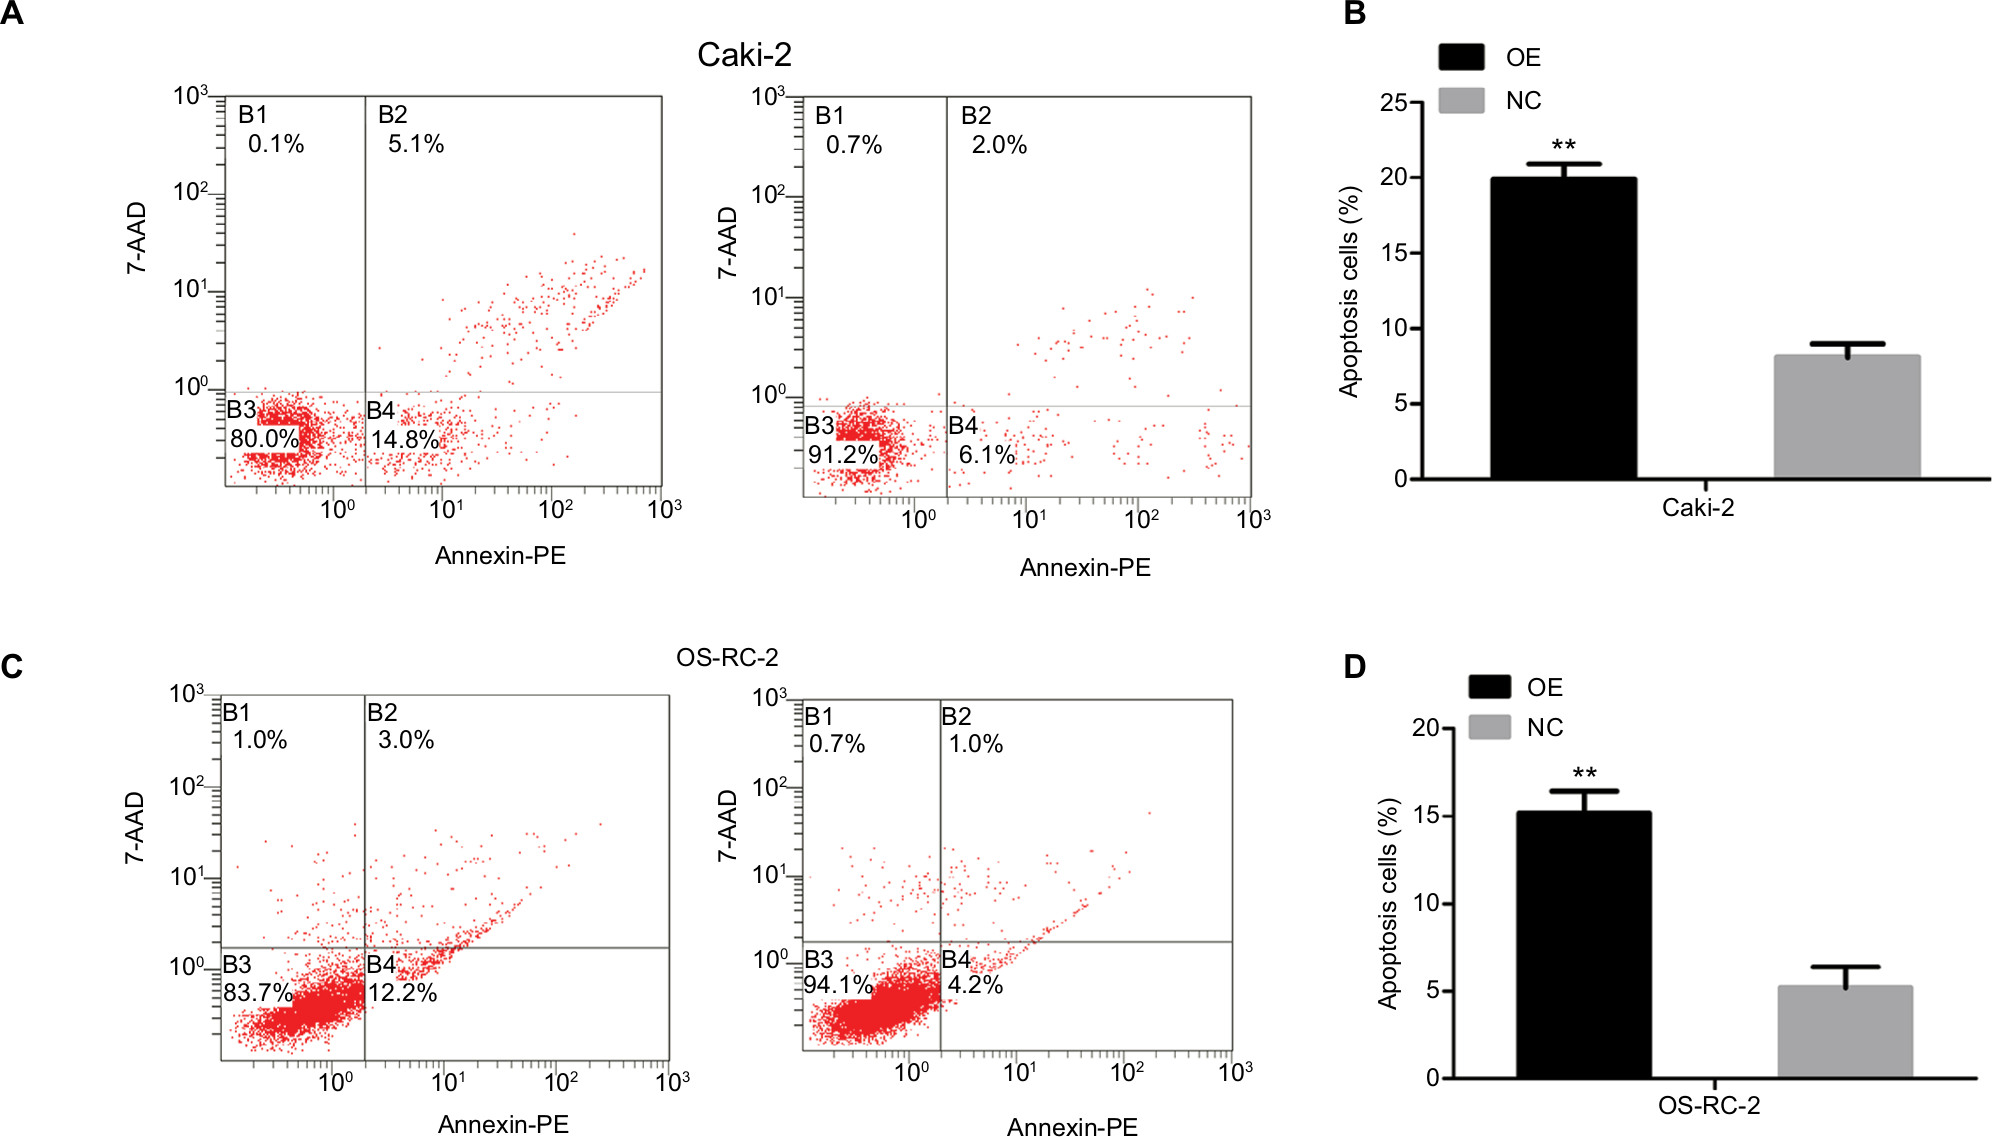 | Figure 7 KCNJ15 overexpression increases the apoptosis rate of renal cancer cell lines. Notes: (A and C) The apoptosis rate of Caki-2 and OS-RC-2 cells was determined by flow cytometric analysis. (B and D) Histogram of the apoptosis rate of Caki-2 and OS-RC-2 overexpression cell lines. Data are presented as mean ± SD. **P<0.01 compared with the NC group. NC, un-transfected control; OE, target gene-transfected cells. Abbreviation: 7-AAD, 7-amino-actinomycin |
Effect of KCNJ15 on signaling pathways
We finally analyzed the expression of proteins in related signaling pathways by Western blot to explore the molecular mechanisms of KCNJ15. As shown in Figure 8, KCNJ15 overexpression upregulated p21 expression and downregulated N-cadherin, vimentin, and matrix metalloproteinase (MMP)-7 expression but had no impact on the expression of mechanistic target of rapamycin (mTOR), phosphorylated (P-) mTOR, glycogen synthase kinase (GSK)-3β, P-GSK-3β, or phosphoinositide 3-kinase (PI3K) in both cell lines (Caki-2 and OS-RC-2).
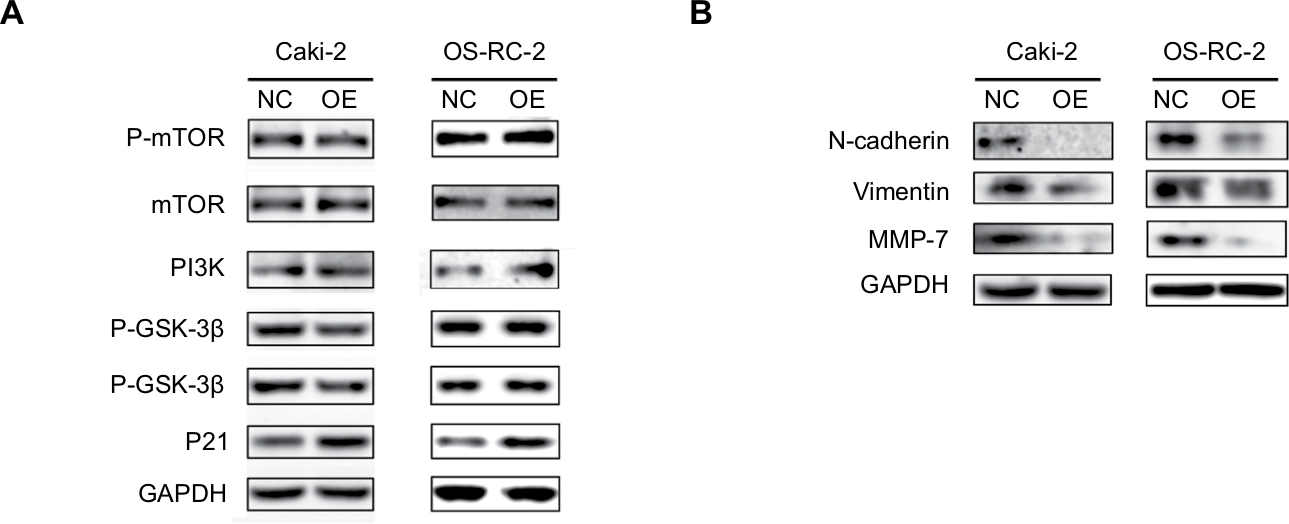 | Figure 8 The effect of KCNJ15 overexpression on the PI3K/AKT, EMT, and MMP-7 pathways. Notes: (A) Western blot analysis was performed to examine the expression of P-mTOR, mTOR, PI3K, P-GSK-3β, GSK-3β, and p21 in Caki-2 and OS-RC-2 cell lines. (B) The expression of EMT-associated proteins (N-cadherin and vimentin) and MMP-7 was determined by Western blot. Abbreviations: EMT, epithelial–mesenchymal transition; GSK, glycogen synthase kinase; MMP, matrix metalloproteinase; mTOR, mechanistic target of rapamycin; PI3K, phosphoinositide 3-kinase. |
Discussion
This is the first report showing that KCNJ15 expression is obviously lower in RCC than in adjacent tissues and serves as an independent prognostic indicator for reduced overall survival in patients with ccRCC. In addition, downregulated KCNJ15 expression is associated with clinical characteristics including advanced TNM stage (n=150, P=0.014) and histological grade (n=150, P=0.045). These results indicate that KCNJ15 plays an important role in RCC occurrence and development. Furthermore, we examined cell proliferation, migration, cell cycle, and apoptosis in the RCC cell lines after increasing KCNJ15 expression levels and revealed that KCNJ15 overexpression inhibited cell proliferation and migration, suppressed G0/G1-phase entry, and induced cell apoptosis in vitro.
Previous evidence has demonstrated that KCNJ15 is expressed in many organs such as the kidney, lung, and pancreas during human development18 and might play a crucial role in the negative regulation of insulin secretion by maintaining the resting membrane potential of pancreatic β cells.14 Additionally, KCNJ15/Kir4.2 and its intracellular polyamines are essential for electric field sensing in galvanotaxis. Furthermore, KCNJ15/Kir4.2 might affect the phosphoinositide 3-kinase/protein kinase B (PI3K/AKT) pathway.11,20
We assessed the expression of related signaling proteins to examine the mechanism of function of KCNJ15. The p21 protein is a member of the CIP family and an inhibitor of cyclin-dependent kinases and has been shown to be able to control cell cycle progression and negatively regulate cell proliferation. In this study, KCNJ15 overexpression upregulated p21 expression, suggesting that KCNJ15 inhibited cell proliferation and induced cell cycle arrest via upregulation of p21 protein expression.
The epithelial–mesenchymal transition (EMT) pathway is considered to participate in cancer progression and metastasis. Our data revealed that overexpression of KCNJ15 caused the downregulation of N-cadherin and vimentin protein expression, suggesting that KCNJ15 was involved in the regulation of RCC migration and invasion through suppressing the transition of epithelial cells into mesenchymal cells.
MMPs are protein hydrolases that can promote the metastasis and invasion of tumor cells by degrading the extracellular matrix. Our Western blot results showed that MMP-7 protein expression was decreased by the overexpression of KCNJ15, indicating that KCNJ15 inhibited the invasion of RCC via upregulating MMP-7 expression.
Taken together, these findings suggested that KCNJ15 might serve as a tumor inhibitor and play an inhibitory role in RCC carcinogenesis and progression. However, the occurrence of kidney cancer is a complex, multifactorial, and multi-step biological process. Therefore, further research is needed to unravel the exact mechanism by which this occurs.
Conclusion
This experiment demonstrates that KCNJ15 gene expression was downregulated in RCC tissues and could serve as an independent prognostic predictor of ccRCC. KCNJ15 inhibited metastasis by suppressing the EMT process and MMP-7 expression. Furthermore, KCNJ15 may have induced cell cycle G1 arrest through the upregulation of the p21 signaling pathway. These results indicate that KCNJ15 might be a new candidate prognostic biomarker and target for RCC therapy.
Ethical approval and consent
This study was implemented according to the Declaration of Helsinki and approved by the ethics committee of Shenzhen Second People’s Hospital (approval number 20170512001). Written informed consents were obtained from the patients.
Acknowledgments
This work was supported by the National Natural Science Foundation of China (Grant No.81472584), the National Key Scientific Program of China (Grant No. 2014CBA02005), the Guangdong Key Laboratory funds of Systems Biology and Synthetic Biology for Urogenital Tumors (2017B030301015), Shenzhen Project of Science and Technology (Grant No. 20160520174730707), the Natural Science Foundation of Guangdong Province (No.2017A030310613), and the Foundation of Shenzhen Science Technology and Innovation Commission (No.JCYJ20160427173722143).The research was implemented according to the Declaration of Helsinki and approved by the Ethics Committee of Shenzhen Second People’s Hospital (approval number 20170512001).Written informed consents were obtained from the patients.
Disclosure
The authors report no conflicts of interest in this work.
References
Li Y, Chen D, Jin LU, et al. Oncogenic microRNA-142-3p is associated with cellular migration, proliferation and apoptosis in renal cell carcinoma. Oncol Lett. 2016;11(2):1235–1241. | ||
Li JW, Gong JY, Li K, Liu Y, Ye QP, Liu X, Su ZX. Construction of a fusion expression plasmid containing the G250 gene and human granulocyte-macrophage colony stimulating factor and its significance in renal cell carcinoma. Oncol Lett. 2011;2(2):343–347. | ||
Tang Y, Wan W, Wang L, Ji S, Zhang J. MicroRNA-451 inhibited cell proliferation, migration and invasion through regulation of MIF in renal cell carcinoma. Int J Clin Exp Pathol. 2015;8(12):15611–15621. | ||
Linehan WM. Genetic basis of kidney cancer: role of genomics for the development of disease-based therapeutics. Genome Res. 2012;22(11):2089–2100. | ||
von Klot CA, Dubrowinskaja N, Peters I, et al. Rho GDP dissociation inhibitor-β in renal cell carcinoma. Oncol Lett. 2017;14(6):8190–8196. | ||
Kim C, Baek SH, Um JY, Shim BS, Ahn KS. Resveratrol attenuates constitutive STAT3 and STAT5 activation through induction of PTPε and SHP-2 tyrosine phosphatases and potentiates sorafenib-induced apoptosis in renal cell carcinoma. BMC Nephrol. 2016;17:19. | ||
Doupnik CA, Davidson N, Lester HA. The inward rectifier potassium channel family. Curr Opin Neurobiol. 1995;5(3):268–277. | ||
Hibino H, Inanobe A, Furutani K, Murakami S, Findlay I, Kurachi Y. Inwardly rectifying potassium channels: their structure, function, and physiological roles. Physiol Rev. 2010;90(1):291–366. | ||
Abraham MR, Jahangir A, Alekseev AE, Terzic A. Channelopathies of inwardly rectifying potassium channels. FASEB J. 1999;13(14):1901–1910. | ||
Oliver D, Baukrowitz T, Fakler B. Polyamines as gating molecules of inward-rectifier K+ channels. Eur J Biochem. 2000;267(19):5824–5829. | ||
Nakajima K, Zhu K, Sun YH, et al. KCNJ15/Kir4.2 couples with polyamines to sense weak extracellular electric fields in galvanotaxis. Nat Commun. 2015;6:8532. | ||
Shuck ME, Piser TM, Bock JH, Slightom JL, Lee KS, Bienkowski MJ. Cloning and characterization of two K+ inward rectifier (Kir) 1.1 potassium channel homologs from human kidney (Kir1.2 and Kir1.3). J Biol Chem. 1997;272(1):586–593. | ||
Okamoto K, Iwasaki N, Nishimura C, et al. Identification of KCNJ15 as a susceptibility gene in Asian patients with type 2 diabetes mellitus. Am J Hum Genet. 2010;86(1):54–64. | ||
Okamoto K, Iwasaki N, Doi K, et al. Inhibition of glucose-stimulated insulin secretion by KCNJ15, a newly identified susceptibility gene for type 2 diabetes. Diabetes. 2012;61(7):1734–1741. | ||
Fukuda H, Imamura M, Tanaka Y, et al. Replication study for the association of a single-nucleotide polymorphism, rs3746876, within KCNJ15, with susceptibility to type 2 diabetes in a Japanese population. J Hum Genet. 2013;58(7):490–493. | ||
He W, Liu W, Chew CS, Baker SS, Baker RD, Forte JG, Zhu L. Acid secretion-associated translocation of KCNJ15 in gastric parietal cells. Am J Physiol Gastrointest Liver Physiol. 2011;301(4):G591–G600. | ||
Yuan J, Liu W, Karvar S, et al. Potassium channel KCNJ15 is required for histamine-stimulated gastric acid secretion. Am J Physiol Cell Physiol. 2015;309(4):C264–C270. | ||
Gosset P, Ghezala GA, Korn B, et al. A new inward rectifier potassium channel gene (KCNJ15) localized on chromosome 21 in the Down syndrome chromosome region 1 (DCR1). Genomics. 1997;44(2):237–241. | ||
Jiang X, Liu C, Yu T, et al. Genetic dissection of the Down syndrome critical region. Hum Mol Genet. 2015;24(22):6540–6551. | ||
Nakajima K, Zhao M. Concerted action of KCNJ15/Kir4.2 and intracellular polyamines in sensing physiological electric fields for galvanotaxis. Channels (Austin). 2016;10(4):264–266. |
 © 2019 The Author(s). This work is published and licensed by Dove Medical Press Limited. The
full terms of this license are available at https://www.dovepress.com/terms
and incorporate the Creative Commons Attribution
- Non Commercial (unported, 3.0) License.
By accessing the work you hereby accept the Terms. Non-commercial uses of the work are permitted
without any further permission from Dove Medical Press Limited, provided the work is properly
attributed. For permission for commercial use of this work, please see paragraphs 4.2 and 5 of our Terms.
© 2019 The Author(s). This work is published and licensed by Dove Medical Press Limited. The
full terms of this license are available at https://www.dovepress.com/terms
and incorporate the Creative Commons Attribution
- Non Commercial (unported, 3.0) License.
By accessing the work you hereby accept the Terms. Non-commercial uses of the work are permitted
without any further permission from Dove Medical Press Limited, provided the work is properly
attributed. For permission for commercial use of this work, please see paragraphs 4.2 and 5 of our Terms.