Back to Journals » Journal of Inflammation Research » Volume 14
Longitudinal Chest CT Features in Severe/Critical COVID-19 Cases and the Predictive Value of the Initial CT for Mortality
Authors Li H ![]() , Luo S, Zhang Y, Xiao X, Liu H
, Luo S, Zhang Y, Xiao X, Liu H ![]()
Received 27 January 2021
Accepted for publication 4 March 2021
Published 25 March 2021 Volume 2021:14 Pages 1111—1124
DOI https://doi.org/10.2147/JIR.S303773
Checked for plagiarism Yes
Review by Single anonymous peer review
Peer reviewer comments 4
Editor who approved publication: Professor Ning Quan
Hailan Li,1,* Shiyong Luo,2,* Youming Zhang,3 Xiaoyi Xiao,4 Huaping Liu4
1Department of Radiology, Hunan Provincial People’s Hospital (The First Affiliated Hospital of Hunan Normal University), Changsha, 410000, Hunan Province, People’s Republic of China; 2Department of Radiology, Wuhan Third Hospital (Tongren Hospital of Wuhan University), Wuhan, 430060, Hubei Province, People’s Republic of China; 3Department of Radiology, Xiangya Hospital, Central South University, Changsha, 410008, Hunan Province, People’s Republic of China; 4Department of Radiology, The Third Xiangya Hospital, Central South University, Changsha, 410013, Hunan Province, People’s Republic of China
*These authors contributed equally to this work
Correspondence: Huaping Liu
Department of Radiology, The Third Xiangya Hospital, Central South University, Tongzipo Road 138, Changsha, 410013, Hunan Province, People’s Republic of China
Tel +86-731-88638888
Fax +86-731-84327332
Email [email protected]
Purpose: To evaluate longitudinal computed tomography (CT) features and the predictive value of the initial CT and clinical characteristics for mortality in patients with severe/critical coronavirus disease 2019 (COVID-19) pneumonia.
Methods: A retrospective analysis was performed on patients with COVID-19 pneumonia confirmed by laboratory. By excluding mild and common patients, 155 severe/critical patients with definite outcome were finally enrolled. A total of 516 CTs of 147 patients were divided into four stages according to the time after onset (stage 1, 1– 7 days; stage 2, 8– 14 days; stage 3, 15– 21 days, and stage 4, > 21 days). The evolving imaging features between the survival and non-survival groups were compared by using Chi-square, Fisher’s exact test, student’s t-test or Mann–Whitney U-test, as appropriate. The predictive value of clinical and CT features at admission for mortality was analysed through logistic regression analysis. To avoid overfitting caused by CT scores, CT scores were divided into two parts, which were combined with clinical variables, respectively, to construct the models.
Results: Ground-glass opacities (GGO) patterns were predominant for stages 1 and 2 for both groups (both P> 0.05). The numbers of consolidation lesions increased in stage 3 in both groups (P=0.857), whereas the linear opacity increased in the survival group but decreased in the non-survival group (P=0.0049). In stage 4, the survival group predominantly presented linear opacity patterns, whereas the non-survival group mainly showed consolidation patterns (P=0.007). Clinical and imaging characteristics correlated with mortality; multivariate analyses revealed age > 71 years, neutrophil count > 6.38 × 10⁹/L, aspartate aminotransferase (AST) > 58 IU/L, and CT score (total lesions score > 17 in model 1, GGO score > 14 and consolidation score > 2 in model 2) as independent risk factors (all P< 0.05). The areas under the curve of the six independent risk factors alone ranged from 0.65 to 0.75 and were 0.87 for model 2, 0.89 for model 1, and 0.92 for the six variables combined. Statistical differences were observed between Kaplan Meier curves of groups separated by cut-off values of these six variables (all P< 0.01).
Conclusion: Longitudinal imaging features demonstrated differences between the two groups, which may help determine the patient’s prognosis. The initial CT score combined with age, AST, and neutrophil count is an excellent predictor for mortality in COVID-19 patients.
Keywords: COVID-19, SARS-CoV-2, mortality, multivariate combined analysis, chest CT score, risk factors
Introduction
On March 11 2020 the World Health Organization (WHO) declared COVID-19, novel coronavirus pneumonia (NCP), a global pandemic.1 As of February 22, 2021, the number of global confirmed cases exceeded 110,749,023, with a death toll of 2,455,131. According to the guidelines of the National Health Commission of China, the clinical type of COVID-19 was classified into severe, critical, moderate and mild types.2 A recent study revealed a case-fatality rate of 49.0% among the critical cases.3 Mortality is common in severe and critical cases and further monitoring of these cases is key for reducing the mortality rate. On the other hand, the most common symptoms of COVID-19 are fever and cough, which are not specific.4 Therefore, the diagnostic criteria rely on real time reverse-transcription polymerase chain reaction (RT-PCR) test. Due to high sensitivity, chest computed tomography (CT) may help in the early detection, management and follow-up of COVID-19 pneumonia.4,5
Although researchers have described differential imaging features in the different clinical types of COVID-19,6 to the best of our knowledge, few studies7–9 have reported a relationship between the outcome and the imaging characteristics in detail. Several studies have investigated the risk factors for mortality in patients with COVID-19.10–12 However, these studies enrolled patients with all clinical types, including mild, moderate, severe, and critical cases, which may reduce the prediction performance of the regression model for one specific subtype.13 Moreover, CT imaging features and CT scores, which are extremely important for COVID-19 patients, were not included in these risk factor assessment.14,15
In the present study, we describe the clinical characteristics and detailed imaging features of 155 critical/severe cases of COVID-19 patients with definite outcomes (discharge or death). We further evaluate longitudinal chest CT features and the predictive value of the initial CT and clinical features for mortality assessment, which may aid patient management, as well as resource allocation.
Patients and Methods
Participants and Study Design
This study was approved by the Research Ethics Commission of Wuhan Third Hospital (Ethical approval number: KY2020-020), and the requirement for patient’s informed consent was waived following the Council for International Organizations of Medical Sciences guidelines.
This was a retrospective, single-centre cohort study of 155 patients, aged 27 to 95 years, with laboratory-confirmed COVID-19 pneumonia, at the Wuhan Hospital (Tongren Hospital of Wuhan University), Hubei, China. COVID-19 pneumonia was diagnosed and classified following the guidelines by the National Health Commission of the People’s Republic of China.2 The inclusion criteria were (1) the availability of a positive RT-PCR tests confirming the COVID-19 pneumonia, (2) classified into severe/critical types at admission and (3) the availability of a definite outcome (death or discharge). The exclusion criteria were (1) patients who had not undergone chest CT, (2) patients with normal chest CT, (3) patients who had not been confirmed by RT-PCR tests. All patients were admitted to the hospital between January 10, 2020, and April 6, 2020.
Laboratory Procedures and CT Image Acquisition
The method to identify severe acute respiratory syndrome coronavirus 2 (SARS-CoV-2) infection has been described previously.16 In brief, throat swab specimens were obtained from all patients at admission and tested using RT-PCR assay. The standard procedure for discharge was based on the absence of fever for more than 3 d if the respiratory symptoms had significantly improved, the CT images of both lungs showed signs of substantial resolution, and two consecutive (at least 1 d apart) nucleic acid tests of throat swabs were negative for the SARS-CoV-2 RNA.2 In addition, patients underwent routine blood tests, five items of serum immune function assessment (including C3, C4, IgA, IgM and IgG), procalcitonin level measurements, serum biochemical tests (including renal, liver, and cardiac function), and coagulation function tests. All laboratory data were collected from the first day of admission.
All patients underwent non-contrast CT scans using either of the two CT scanners (uCT 760, United Imaging, Shanghai, China and SOMATOM Definition AS, Siemens Healthineers, Erlangen, Germany) in a single inspiratory phase. All patients were examined using a standardized technique: 120 kVp; 120–200 mA; slice thickness, 5–10 mm; matrix, 512 ×512; collimation, 0.625–5 mm; and pitch, 0.625. The reconstruction section thickness was 0.5–1 mm. CT scans of patients were collected from admission until discharge.
Clinical Data Collection and Image Interpretation
The data on demographic, symptoms, underlying comorbidities, laboratory examinations, treatment, and outcome were collected by a trained team of medical students from the electronic medical records. These data were reviewed by two authors (Youming Zhang and Xiaoyi Xiao).
Two senior radiologists with 15 and 10 years of experience in chest imaging, blinded to clinical data and the patient’s outcome, analysed the CT images using methods reported earlier;17,18 disagreements were resolved by consensus. The image findings included pure ground-glass opacity (GGO), pure consolidation, GGO and consolidation, linear opacity, lung involvement, distribution, predominant location, the extent of lesion involvement, margin definition, interlobular septal thickening, crazy-paving pattern, reversed halo sign, bronchiectasis, air bronchogram sign, bronchial wall thickening, round cystic changes, honeycomb pattern, tree-in-bud, adjacent pleura thickening, pleural effusion, thoracic lymphadenopathy, predominant CT pattern, lung segments of lesion distribution, number of involved lung segments, and the involved lobes. In addition, a similar scoring system based on quantitative analysis was adopted to evaluate the consolidation lesions, GGO, linear lesions, and total lesions, respectively.17,18 The definitions of the analyzed CT characteristics and the details on the scoring system are provided in a Supplemental Information File. To elucidate the dynamic evolution of CT features during COVID-19, we divided the time axis from illness onset into four stages: stage 1 (1–7 d), stage 2 (8–14 d), stage 3 (15–21 d), and stage 4 (>21 d).
Moreover, we compared the differences in CT findings between the survival and non-survival groups during disease progression. Finally, the initial CT findings and laboratory tests at admission were used to predict the risk of patient mortality.
Statistical Analysis
All statistical analyses were performed using the IBM SPSS (version 25; IBM, New York, USA) and MedCalc (version 19.0.7; MedCalc Software Ltd, Ostend, Belgium). P values <0.05 with a two-tailed test were considered to be significant. Differences between survival and non-survival groups were analysed using the Chi-square or Fisher’s exact test for categorical variables and the Student’s t-test or Mann–Whitney U-test for quantitative variables, according to the normal distribution. To identify the risk factors associated with in-hospital death, univariable and multivariable logistic regressions models were analyzed using the “enter” method. To avoid overfitting of the models,11,19 four clinical variables were combined with the total lesion score or the other two CT scores (GGO score and consolidation score) to construct the multivariable logistic regressions models. The results of the logistic regression and the independent risk factors were used to generate receiver operating characteristic (ROC) curves. The cut-off values of the ROC curves were used to stratify the patients. Furthermore, Kaplan–Meier curves were generated, and the Log rank test was used to compare differences between groups.
Results
Clinical and Laboratory Features
The study included 155 patients with a confirmed case of severe/critical COVID-19 pneumonia on admission. The clinical and laboratory features of these patients at admission are shown in Table 1. The median age for the survival group (n =131) was 65 years (interquartile ranges [IQR], 57–71 years), whereas that for the non-survival group (n= 24) was 71 years (IQR, 61–78 years), which was significantly different (P = 0.022).
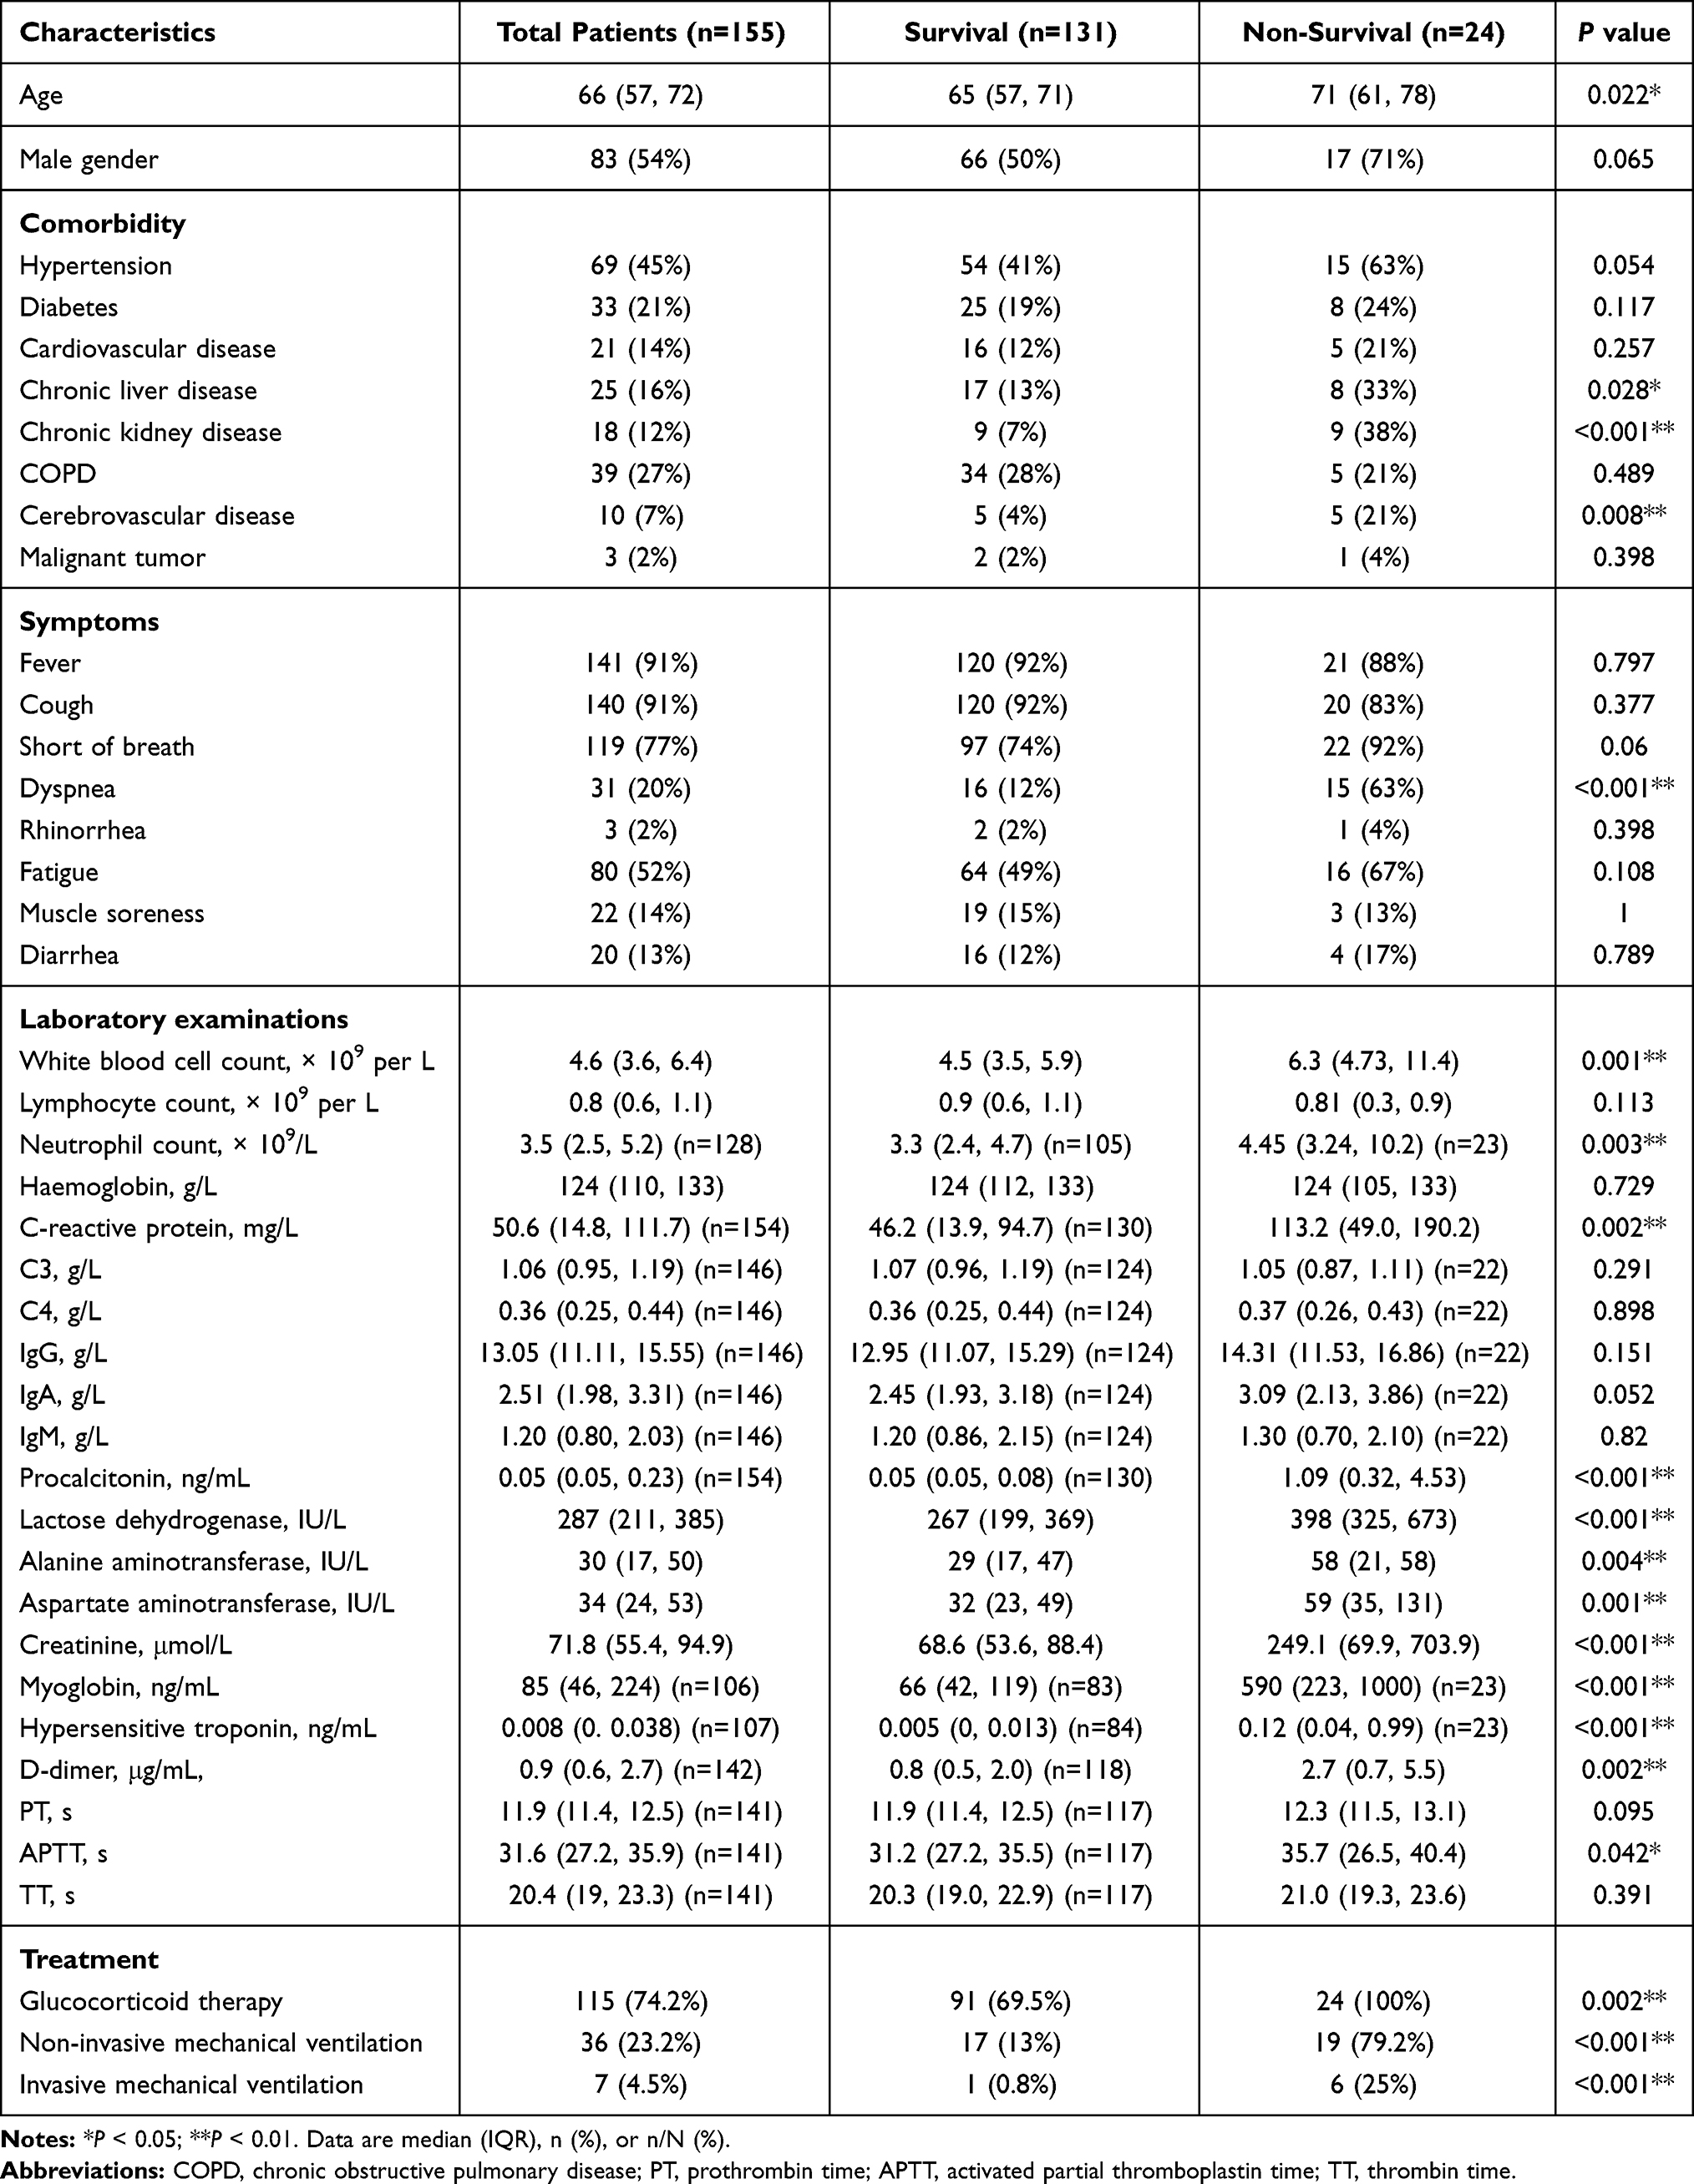 |
Table 1 Clinical and Laboratory Characteristics of 155 Severe/Critical COVID-19 Patients at Admission According to Disease Outcome |
Upon laboratory examination, the non-survival group had higher levels of inflammatory indices (leukocytes, neutrophils, C-reactive protein, and procalcitonin; all P < 0.05), abnormal hepatic function (lactose dehydrogenase, alanine aminotransferase, and aspartate aminotransferase (AST); all P< 0.05), renal function (creatinine; P < 0.01), cardiac function (myoglobin, hypersensitive troponin; both P< 0.01), and coagulation function (D-dimer, activated partial thromboplastin time; both P< 0.05). It is worth noting that the difference in lymphocytes was not statistically significant between the two groups.
Initial CT Findings and Dynamic CT Evolution
The CT images of eight patients in the survival group could not be accessed. Therefore, a total of 147 patients with 516 CT scans were enrolled for evaluation. Of those, 123 patients with 473 CTs were in the survival group and 24 patients with 43 CTs were in the non-survival group.
Upon comparison of the initial CT findings of 147 patients at admission, the non-survival group had higher total lesion scores, GGO scores, consolidation scores, and were more likely to have lymphadenopathy (all P < 0.01) (Table 2). All other imaging features of the initial CT showed no statistical difference between the groups.
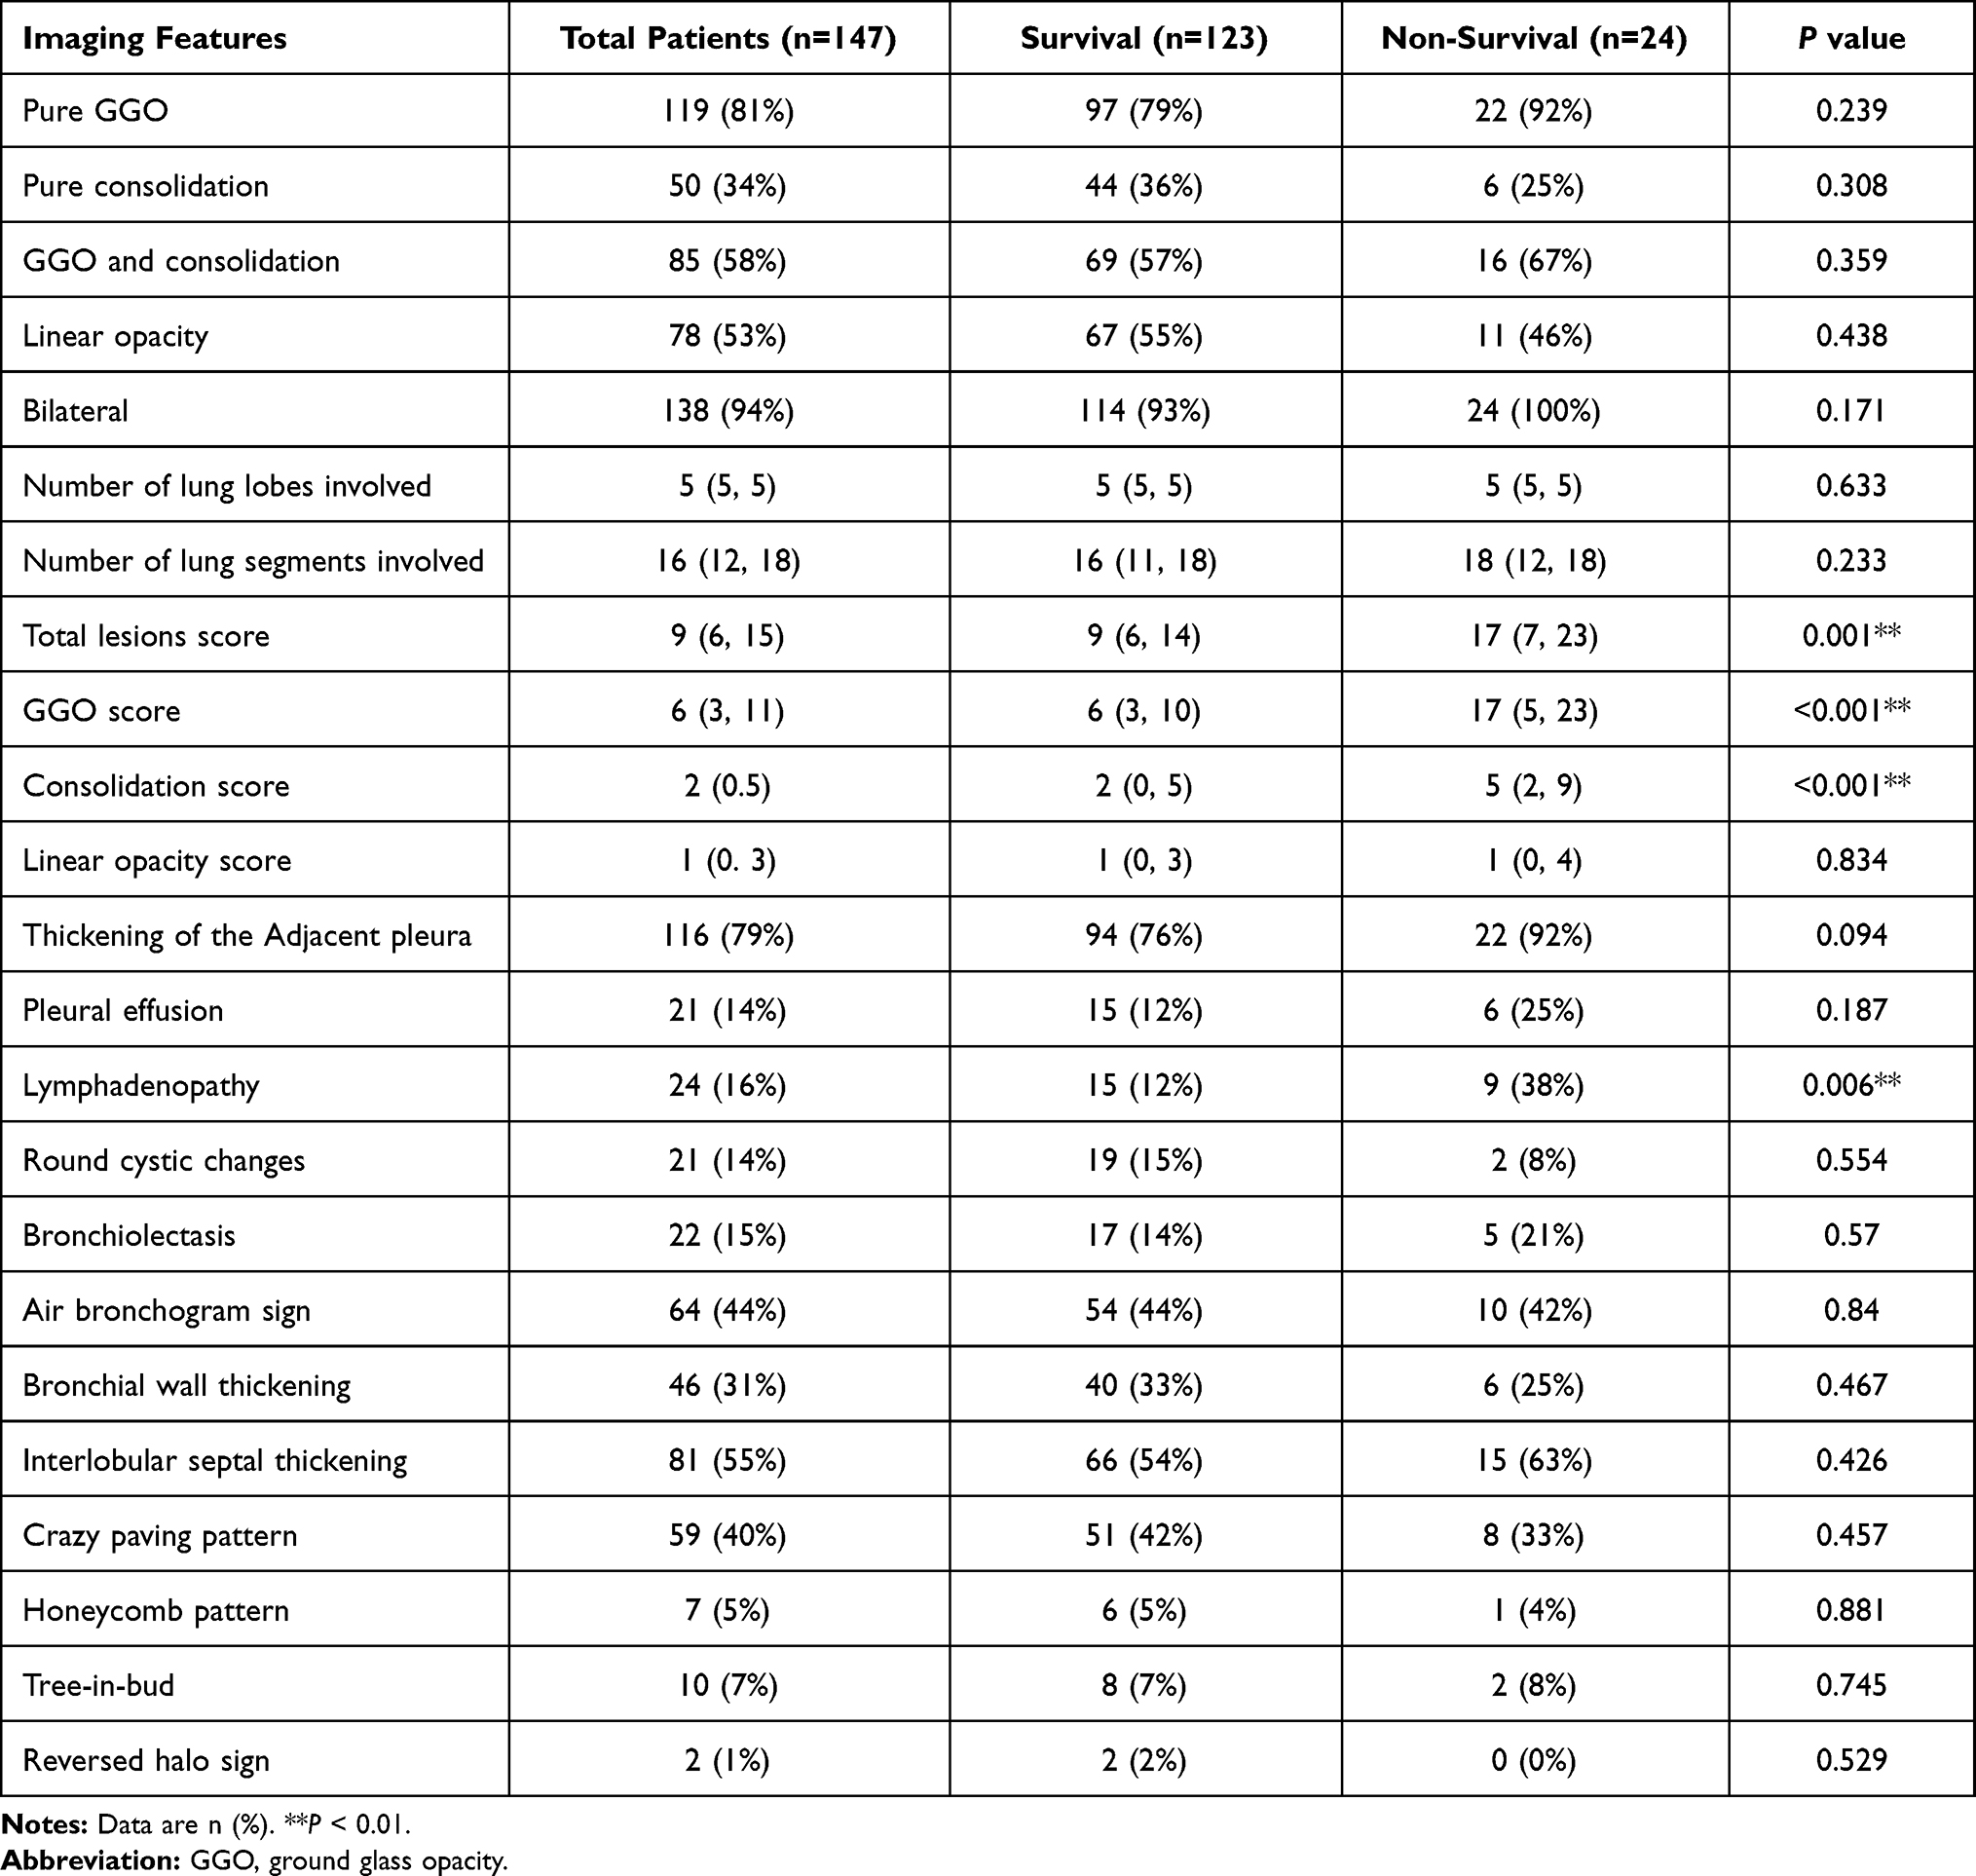 |
Table 2 Initial CT Characteristics of 147 Severe/Critical COVID-19 Patients at Admission According to Disease Outcome |
The longitudinal development of chest CT features at different stages is shown in Figures 1–3 and Supplementary Figure 1. As the disease progressed, the percentages of CT images presenting pure GGO, pure consolidation, GGO, and consolidation showed no significant differences between the survival group and the non-survival group (Figure 1A–C). By contrast, the percentages of linear opacity opposing trend in the two groups (Figure 1D), it increased gradually in the survival group (Supplementary Figure 1A) but decreased gradually in the non-survival group (Supplementary Figure 1B), reaching statistical difference in stage 4 (43% in non-survival group vs 85% in the survival group; P < 0.01). The distribution characteristics of the lesions are shown in Figure 1E–I. The differences in the predominant pattern between the two groups in stage 4 were statistically significant (P<0.01; Figure 2A). In both groups, severe/critical COVID-19 pneumonia impacted all lung segments in both lobes, and the lesions were more common in the apical posterior/posterior segment, lateral basal segment, and posterior basal segment (Figure 2B–F).
 |
Figure 1 Imaging characteristics of 516 CTs from 147 patients with severe/critical COVID-19 during the four defined stages. The detailed CT features of the survival group and the non-survival group are shown in (A–O). GGO, ground-glass opacity. |
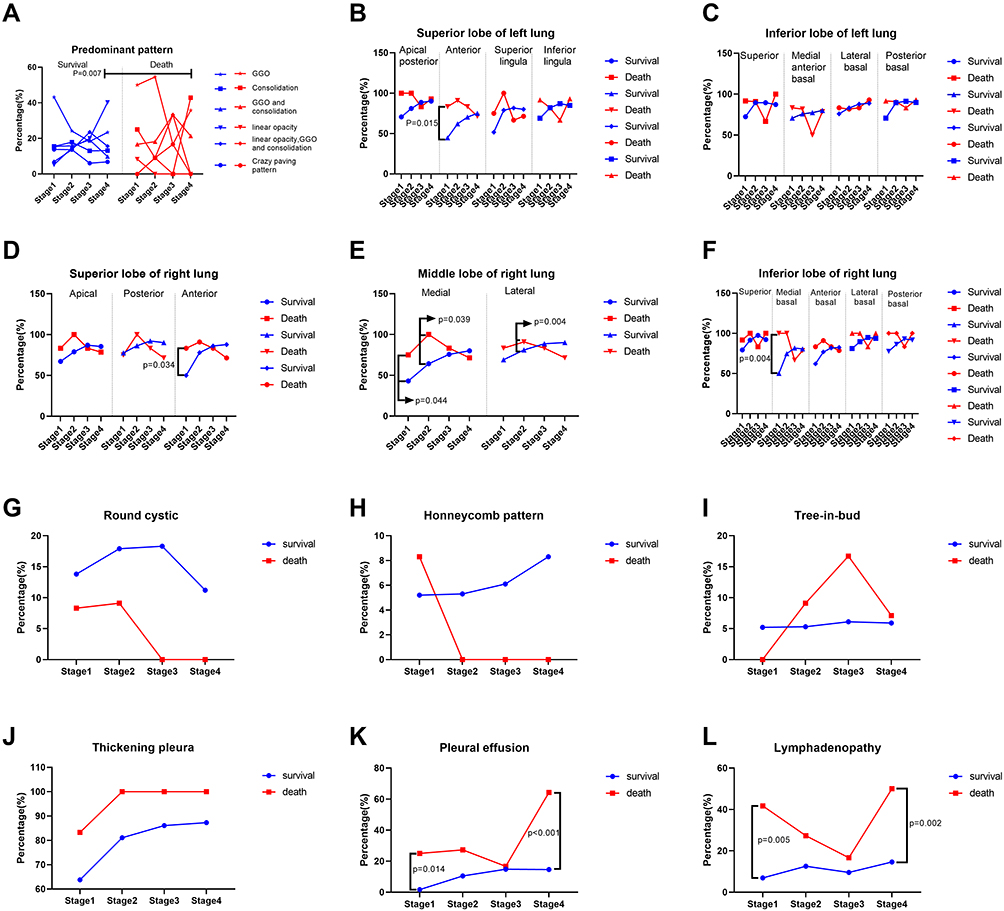 |
Figure 2 Imaging features of 516 CTs from 147 patients during four stages. The detailed CT features of the survival group and the non-survival group are shown in (A–L). *P<0.05; **P<0.01. |
 |
Figure 3 The scores of 516 CTs in 147 patients during four stages. Temporal changes in CT scores (A–D) and the number of lung lobes and lung segments involved during the four stages (E and F). GGO, ground-glass opacity. |
Statistical differences between the two groups were also observed in the proportions of pleural effusion and lymphadenopathy in stages 1 and 4 (all P<0.05); there were no significant differences in other imaging features (Figures 1J–O and 2G–L). In stage 1, all four CT scores were statistically different between the two groups (Figure 3A–D; all P<0.05). In stage 2, only the total lesion and GGO scores were statistically different (both P<0.01), whereas in stage 3, the GGO and linear opacity scores were significantly different (both P<0.05). In stage 4, there were statistical differences in the total lesion score, GGO score, and linear opacity score (all P<0.05). In addition, there was no significant difference in the number of affected lung lobes between the groups, whereas the number of involved lung segments was statistically different in stages 1 and 2 (Figure 3E and F; all P<0.05).
Clinical and Radiological Predicting Factors of Mortality in Severe/Critical COVID-19 Patients
The univariate analysis identified many clinical and CT features to be associated with the mortality in severe/critical COVID-19 cases (all P < 0.05, Table 3). Of the 155 patients, a multivariate analysis was performed based on 144 patients with available CT images, considering that CT images were not available for 8 patients due to failures of the Picture Archiving and Communication Systems. Multivariate regression identified model 1 the variables age (OR, 1.08; 95% CI, 1.01–1.16; P=0.026), neutrophil count (OR, 1.41; 95% CI, 1.09–1.81; P=0.008), AST (OR, 1.03; 95% CI, 1.01–1.05; P=0.01), GGO score (OR, 1.11; 95% CI, 1.01–1.22; P=0.035), and consolidation score (OR, 1.23; 95% CI, 1.05–1.43; P=0.01) as independent risk factors (Table 4 and Supplementary Figure 2), whereas the multivariate regression identified in model 2 the variables age (OR, 1.07; 95% CI, 1.01–1.14; P =0.032), neutrophil count (OR, 1.31; 95% CI, 1.06–1.62; P =0.012), AST (OR, 1.02; 95% CI, 1.01–1.04; P =0.008), and total lesions score (OR, 1.14; 95% CI, 1.02–1.27; P =0.017) as independent risk factors (Table 4, Supplementary Figure 2). The areas under the curve (AUCs) values of the above six independent risk factors alone were in the range of 0.65–0.75, 0.78 for the three combined CT scores, 0.87 for model 2, 0.89 for model 1, and 0.92 for the six independent risk factors (Figure 4). The Kaplan–Meier curves for patients with age ≤71 years and age >71 years (log-rank P=0.0045), AST ≤ 58 IU/L and AST > 58IU/L (log-rank P =0.0001), neutrophil count ≤6.38 × 10⁹/L and neutrophil count >6.38 × 10⁹/L (log-rank P=0.0001), GGO score ≤14 and GGO score >14 (log-rank P<0.0001), consolidation score ≤2 and consolidation score >2 (log-rank P<0.0043), and total lesions score ≤17 and total lesion score >17 (log-rank P<0.0001) are shown in Figure 5.
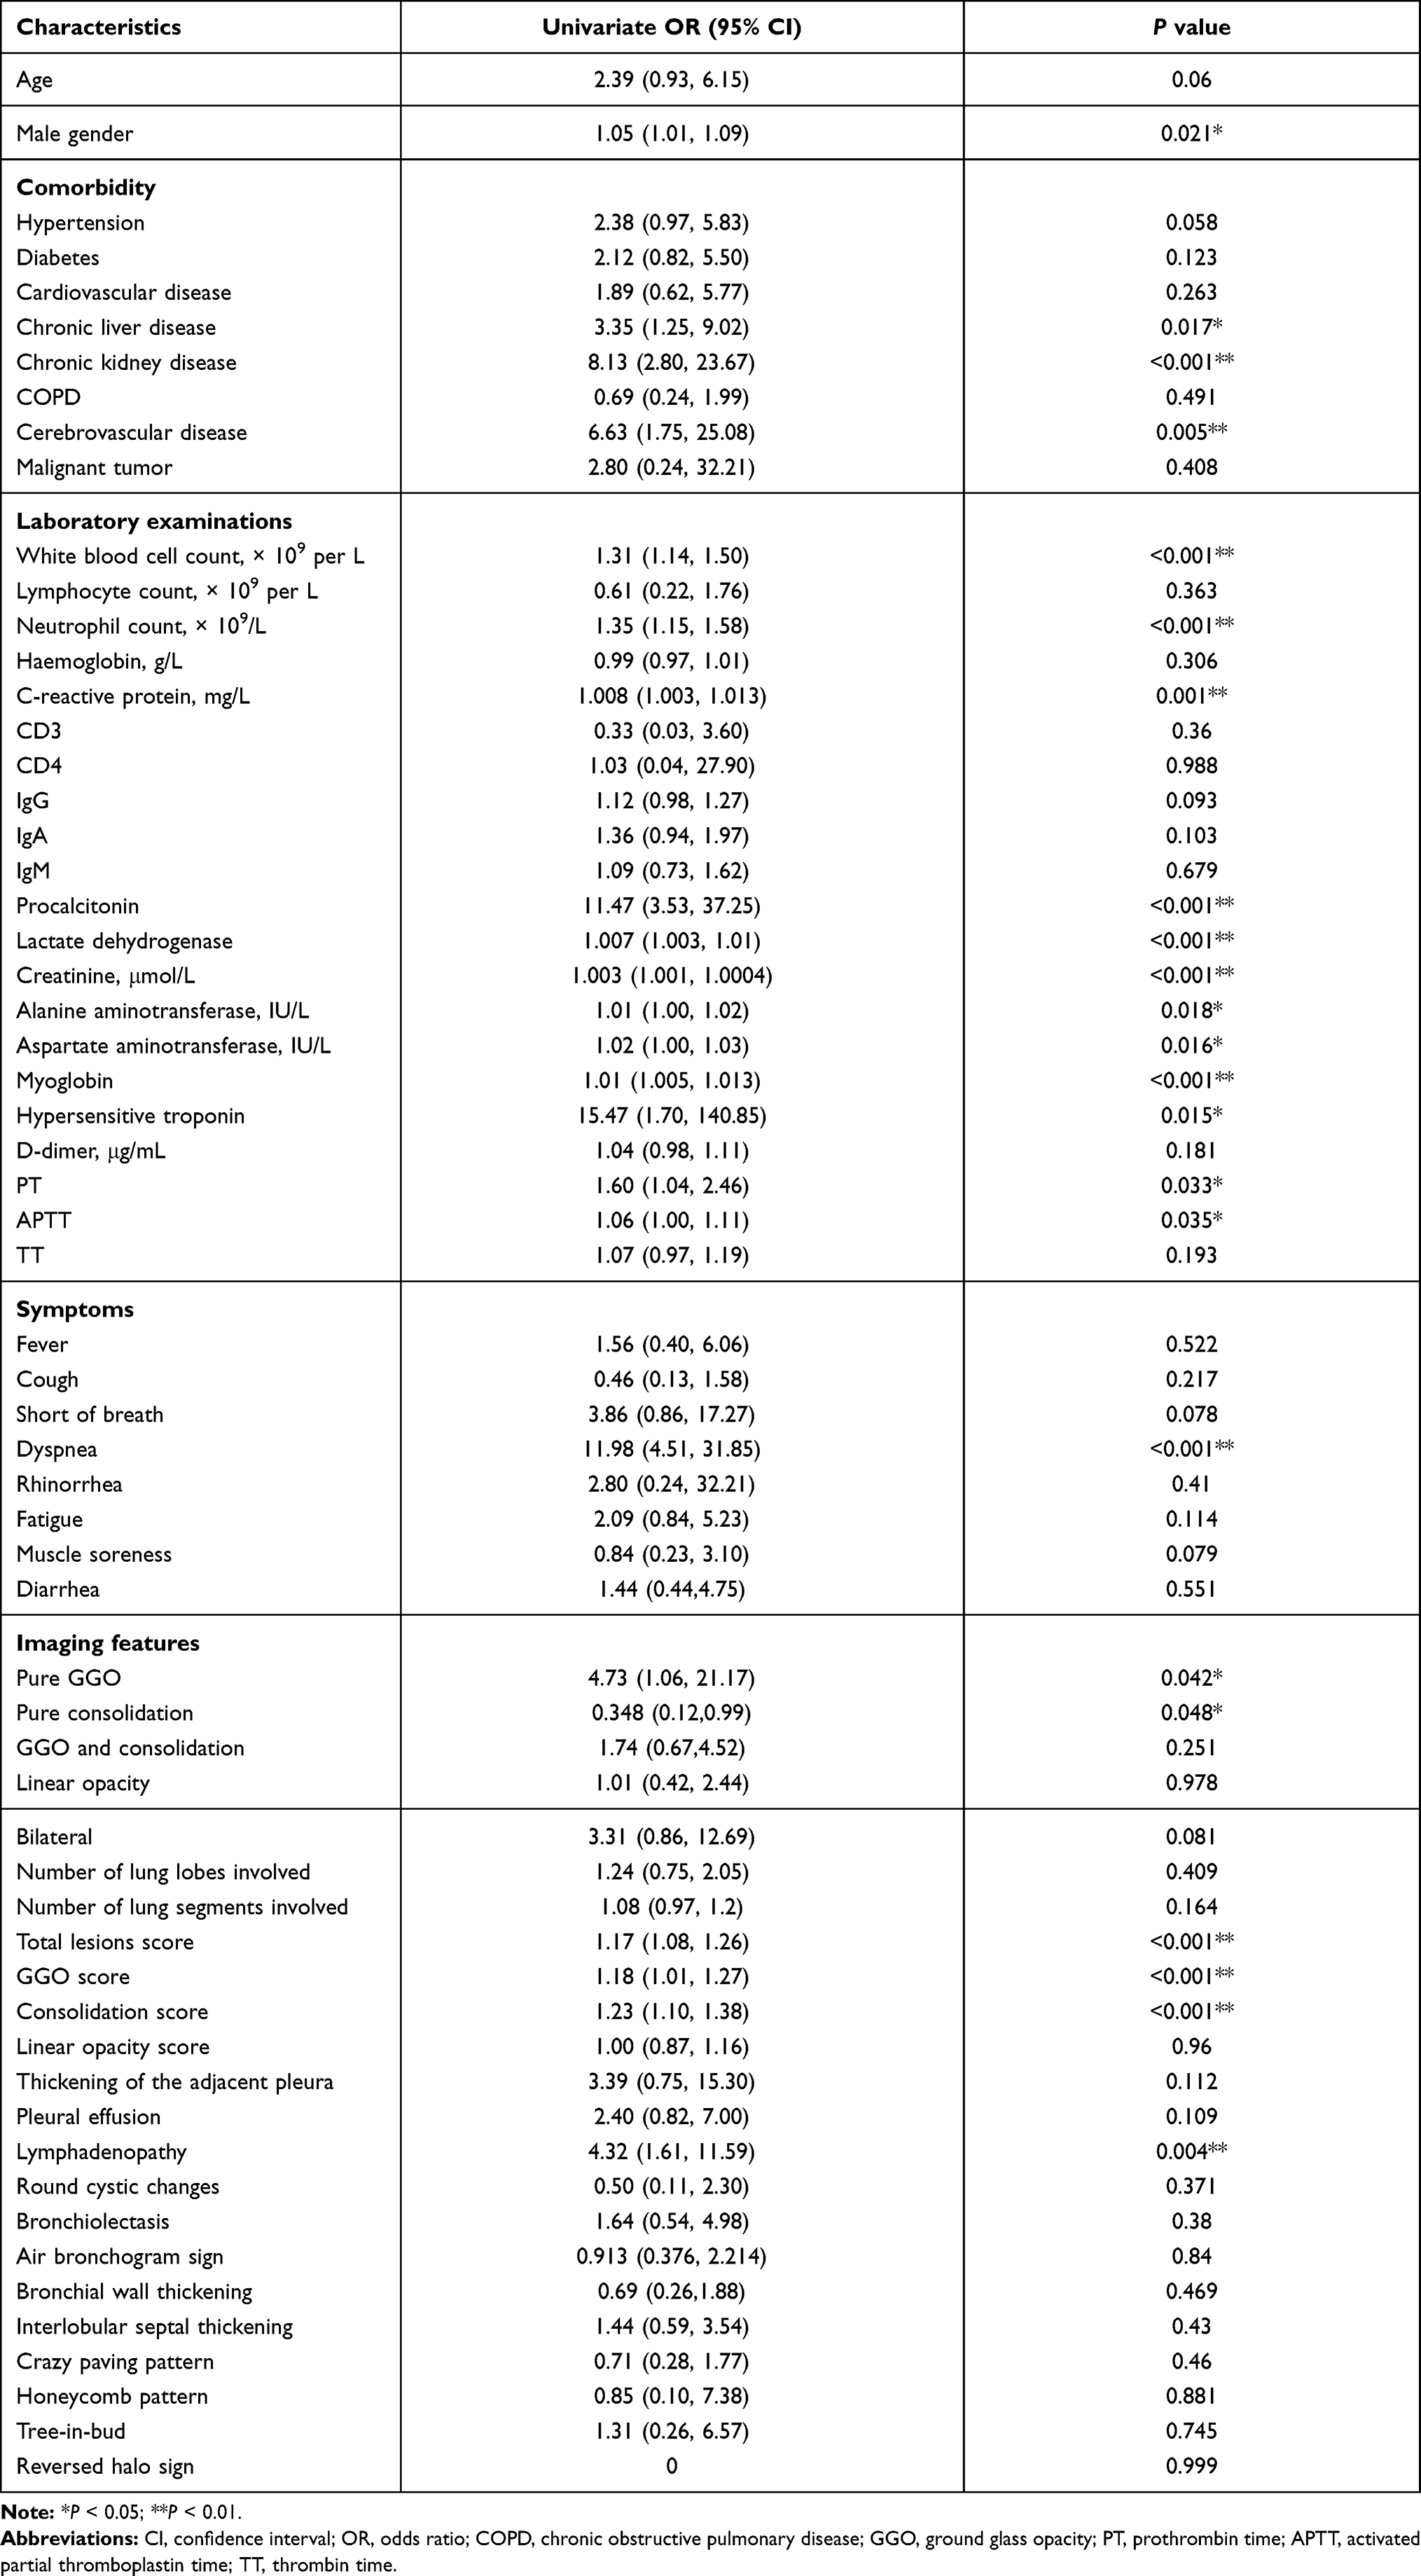 |
Table 3 Clinical Risk Factors Associated with Non-Survivability of Severe/Critical COVID-19 According to Univariable Logistic Regressions |
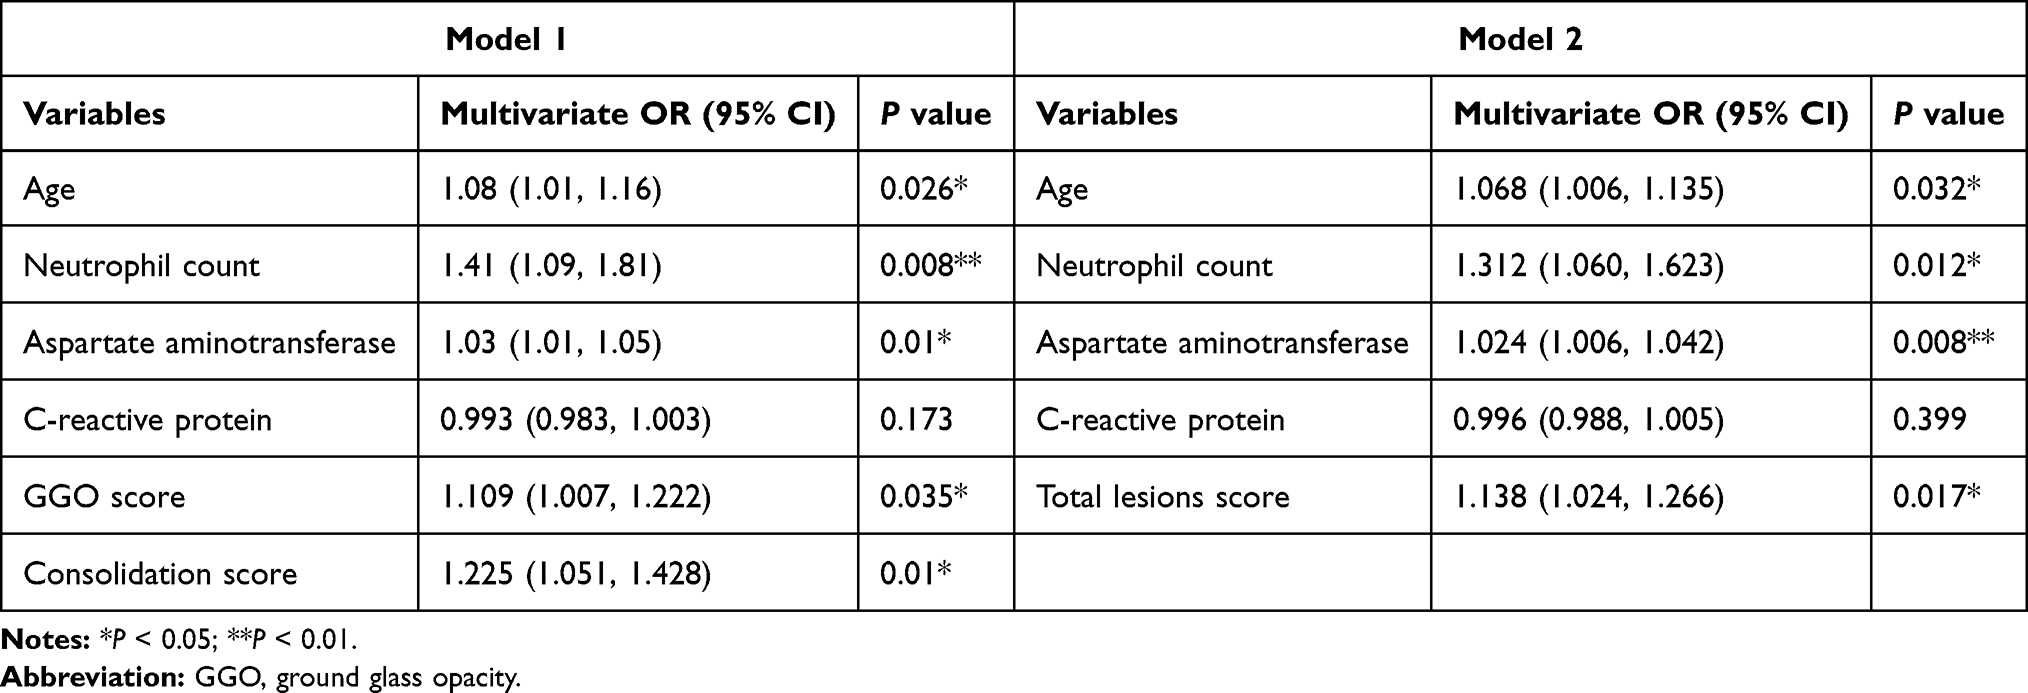 |
Table 4 Clinical Risk Factors Associated with Non-Survivability of Severe/Critical COVID-19 According to Multivariable Logistic Regressions in Two Models |
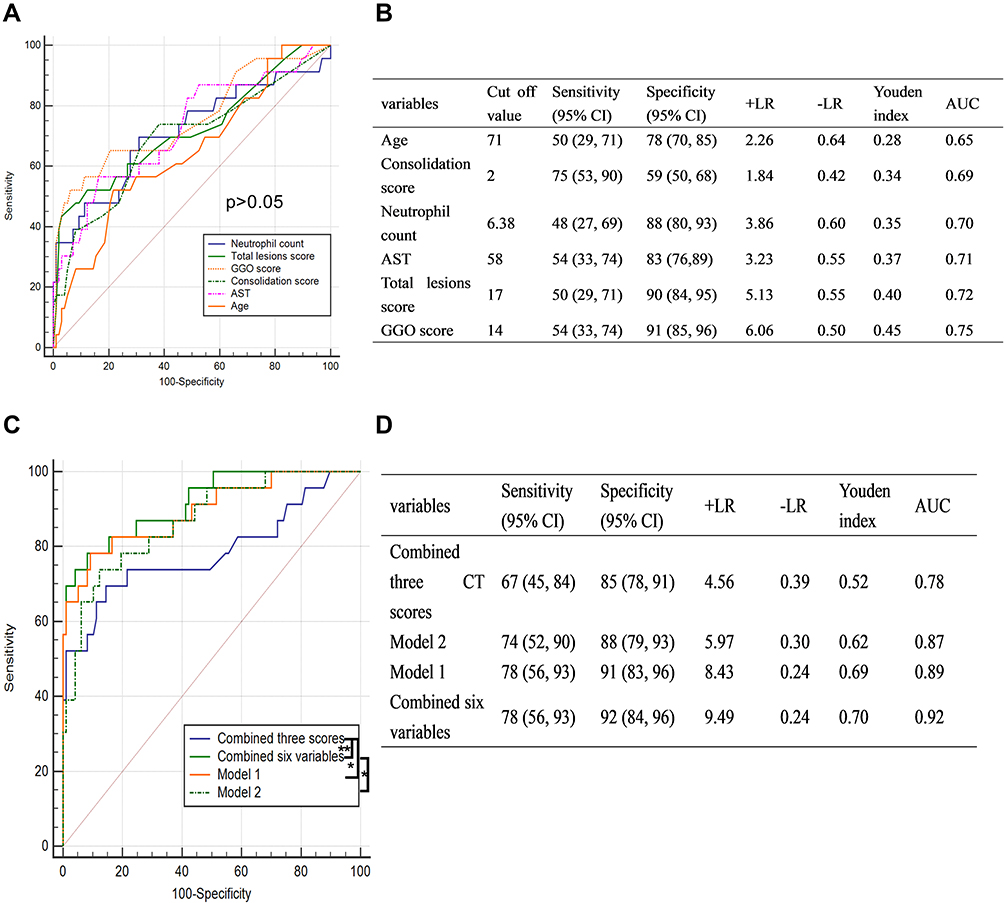 |
Figure 4 AUCs of the six independent risk factors. Individual ROC curves of six independent risk factors (A) and their individual predictive performance (B). ROC curves of different combination of the six independent risk factors (C) and their corresponding predictive performance (D). *P<0.05; **P<0.01. Abbreviations: AUCs, areas under the curve; ROC, receiver operating characteristic. |
 |
Figure 5 Kaplan–Meier curves of the six independent risk factors. Kaplan–Meier curves of patients with age ≤71 years and age >71 years (A), AST ≤58 IU/L and AST >58IU/L (B), neutrophil count ≤6.38 × 10⁹/L and neutrophil count >6.38 × 10⁹/L (C), GGO score ≤14 and GGO score >14 (D), consolidation score ≤2 and consolidation score >2 (E), and total lesions score ≤17 and total lesions score >17 (F). Abbreviations: AST, aspartate aminotransferase; GGO, ground-glass opacity. |
Discussion
The lesions in patients with severe/critical COVID-19 pneumonia were typically bilateral, with multiple subpleural localizations and ill-defined border, similar to previous reports.14,20–22 The GGO pattern was predominant in stages1 and 2. In stage 3, the number of consolidation lesions increased in both groups, whereas the number of linear opacities increased in survival group but decreased in the non-survival group. In stage 4, the survival group predominantly presented linear opacity patterns whereas the non-survival group showed predominantly the consolidation patterns.
These distinct imaging changes over time confirmed our previous hypothesis,18 that is, an increase in linear opacity indicates a good prognosis, whereas an increase in consolidation is indicative of a poor prognosis. Evidence from the literature also suggests that linear opacity is an organized feature at the end-stage of the infectious lung parenchyma lesions on CT23 and that consolidation is formed by hyaline membranes in the alveolar cavity.24 Previous studies14,25,26 suggest that the peak of total lesion score is in the stage 2. In the survival group, the peak value of the total lesion score was also observed in stage 2, whereas the total lesion score in the non-survival group peaked in stage 3 and was accompanied by a gradual increase in the consolidation score. Moreover, the presence of pleural effusion and lymphadenopathy, as well as the involvement of specific lung segments (such as the anterior segment of the upper lobe and medial segment of the middle lobe) in the stage 1 may indicate a worse prognosis.
In the analysis of risk factors for mortality in patients with severe/critical COVID-19 pneumonia, the initial CT score (total lesions score >17, consolidation score >2 and GGO score >14) combined with the patient’s age (>71 years), AST (>58 IU/L), and the neutrophils count (>6.38 × 10⁹/L) at admission had an excellent predictive power to determine the survival outcome of patient. Various studies have confirmed that older age, neutrophilia, and elevated AST levels are risk factors for mortality in patients with COVID-19,10–12,15,27 similar to our findings. Moreover, we found that the total lesion score, GGO score, and consolidation score of the initial CT were associated with mortality of severe/critical COVID-19 cases. Few studies7,20,25,26 have explored the longitudinal development of total lesion scores in patients with COVID-19 but no prior study investigated the predictive value of CT scores in severe/critical patients. A previous study28 on Middle East respiratory syndrome confirmed that the total lesion score has predictive value to determine a patient’s prognosis, similar to our findings, in patients with COVID-19. Furthermore, we found that the GGO and consolidation scores have predictive value for mortality, with the GGO score having the highest influence, whereas the linear opacity score has no predictive value. In the predictive models 1 and 2 based on the CT scores, the addition of variables age, AST, and neutrophil count lead to excellent predictive performances which were still slightly inferior to the combined prognostic performance of all six variables.
There are several limitations to our study. First, the number of deaths in this study was small and did not meet the requirements of the event per variable (EPV), therefore the results may not be sufficiently robust. However, considering that the results have certain interpretability they are still reported here. The selection of the four clinical variables (age, neutrophil count, aspartate aminotransferase and C-reactive protein) was based on previous reports and the feasibility of emergency work.11,12,15 Second, this was a single-center study and the results require further confirmation by multi-center studies. Third, the CT score of this study may not be as accurate as the scores determined using artificial intelligence; however, our scoring method is highly malleable and innovatively divides the total lesion score into linear opacity, GGO, and consolidation scores.
Conclusion
The longitudinal changes in imaging manifestations of patients with severe/critical COVID-19 pneumonia revealed differences between the survival and non-survival groups, which may help predict the patients’ prognosis and identify patients that require further intervention. The initial CT score (total lesions score >17, consolidation score >2 and GGO score >14) combined with age (>71 years), AST (>58 IU/L), and neutrophils (6.38 × 10⁹/L) provides an excellent predictive model for the survival outcome of patients with severe/critical COVID-19 pneumonia.
Abbreviations
COVID-19, coronavirus disease 2019; CT, computed tomography; GGO, ground-glass opacities; AST, aspartate aminotransferase; RT-PCR, reverse-transcription polymerase chain reaction; SARS-CoV-2, severe acute respiratory syndrome coronavirus 2; ROC, receiver operating characteristic; IQR, interquartile ranges; EPV, event per variable.
Data Sharing Statement
The authors commit to making the relevant anonymized patient-level data available on reasonable request.
Ethics Approval and Consent to Participate
This study was conducted in accordance with the principles of the Declaration of Helsinki and Institutional Review Board approval has been obtained. The patients’ consent to review their medical records was not required by the ethics committee, the reasons for the waiver are as follows. Firstly, this was a retrospective study, the relevant clinical features and CT images of the patients were anonymized or maintained with confidentiality. Secondly, there was no risk to the subjects.
Acknowledgments
We thank the frontline medical staff for their hard work and selfless dedication in the face of the pandemic, despite the risk of infection to themselves and their families. They make an important contribution to controlling the spread of this outbreak.
Author Contributions
All authors contributed to data analysis, drafting or revising the article, have agreed on the journal to which the article will be submitted, gave final approval of the version to be published, and agree to be accountable for all aspects of the work.
Funding
This research did not receive any specific grant from funding agencies in the public, commercial, or not-for-profit sectors.
Disclosure
The authors declare that they have no conflict of interest.
References
1. World Health Organization. WHO characterizes COVID-19 as a pandemic; March 11, 2020. Available from: https://www.who.int/emergencies/diseases/novel-coronavirus-2019/events-as-they-happen.
2. National Health and Health Commission of the People’s Republic of China. Diagnosis and treatment guidelines for 2019 novel coronavirus pneumonia (version 6); February 19, 2020. Available from: http://www.nhc.gov.cn/yzygj/s7653p/202002/8334a8326dd94d329df351d7da8aefc2.shtml.
3. Wu Z, McGoogan JM. Characteristics of and important lessons from the Coronavirus Disease 2019 (COVID-19) outbreak in China: summary of a report of 72314 cases from the Chinese Center for Disease Control and Prevention. JAMA. 2020;323(13):1239. doi:10.1001/jama.2020.2648
4. Caruso D, Polidori T, Guido G, et al. Typical and atypical COVID-19 computed tomography findings. World J Clin Cases. 2020;8(15):3177–3187. doi:10.12998/wjcc.v8.i15.3177
5. Caruso D, Polici M, Zerunian M, et al. Quantitative Chest CT analysis in discriminating COVID-19 from non-COVID-19 patients. Radiol Med. 2021;126(2):243–249. doi:10.1007/s11547-020-01291-y
6. Li K, Wu J, Wu F, et al. The clinical and chest CT features associated with severe and critical COVID-19 pneumonia. Invest Radiol. 2020;55(6):327–331. doi:10.1097/RLI.0000000000000672
7. Han X, Cao Y, Jiang N, et al. Novel coronavirus pneumonia (COVID-19) progression course in 17 discharged patients: comparison of clinical and thin-section CT features during recovery. Clin Infect Dis. 2020;71(15):723–731. doi:10.1093/cid/ciaa271
8. Buonsenso D, Raffaelli F, Tamburrini E, et al. Clinical role of lung ultrasound for diagnosis and monitoring of COVID-19 pneumonia in pregnant women. Ultrasound Obstet Gynecol. 2020;56(1):106–109. doi:10.1002/uog.22055
9. Pata D, Valentini P, De Rose C, De Santis R, Morello R, Buonsenso D. Chest computed tomography and lung ultrasound findings in COVID-19 pneumonia: a pocket review for non-radiologists. Front Med (Lausanne). 2020;7:375. doi:10.3389/fmed.2020.00375
10. Wu C, Chen X, Cai Y, et al. Risk factors associated with acute respiratory distress syndrome and death in patients with Coronavirus disease 2019 pneumonia in Wuhan, China. JAMA Intern Med. 2020;180(7):934. doi:10.1001/jamainternmed.2020.0994
11. Zhou F, Yu T, Du R, et al. Clinical course and risk factors for mortality of adult inpatients with COVID-19 in Wuhan, China: a retrospective cohort study. Lancet. 2020;395(10229):1054–1062. doi:10.1016/S0140-6736(20)30566-3
12. Zheng Z, Peng F, Xu B, et al. Risk factors of critical & mortal COVID-19 cases: a systematic literature review and meta-analysis. J Infect. 2020;81(2):e16–e25. doi:10.1016/j.jinf.2020.04.021
13. Pocock SJ, Stone GW. The primary outcome is positive - is that good enough? N Engl J Med. 2016;375(10):971–979. doi:10.1056/NEJMra1601511
14. Shi H, Han X, Jiang N, et al. Radiological findings from 81 patients with COVID-19 pneumonia in Wuhan, China: a descriptive study. Lancet Infect Dis. 2020;20(4):425–434. doi:10.1016/S1473-3099(20)30086-4
15. Zhang JJY, Lee KS, Ang LW, Leo YS, Young BE. Risk factors of severe disease and efficacy of treatment in patients infected with COVID-19: a systematic review, meta-analysis and meta-regression analysis. Clin Infect Dis. 2020;71(16):2199–2206. doi:10.1093/cid/ciaa576
16. Huang C, Wang Y, Li X, et al. Clinical features of patients infected with 2019 novel coronavirus in Wuhan, China. Lancet. 2020;395(10223):497–506. doi:10.1016/S0140-6736(20)30183-5
17. Liu H, Luo S, Li H, et al. Clinical characteristics and longitudinal chest CT features of healthcare workers hospitalized with coronavirus disease 2019 (COVID-19). Int J Med Sci. 2020;17(17):2644–2652. doi:10.7150/ijms.48696
18. Liu H, Luo S, Zhang Y, et al. Chest CT features of 182 patients with mild Coronavirus Disease 2019 (COVID-19) pneumonia: a Longitudinal, Retrospective and Descriptive Study. Infect Dis Ther. 2020;9(4):1029–1041. doi:10.1007/s40121-020-00352-z
19. Mahdjoub E, Mohammad W, Lefevre T, Debray MP, Khalil A. Admission chest CT score predicts 5-day outcome in patients with COVID-19. Intensive Care Med. 2020;46(8):1648–1650. doi:10.1007/s00134-020-06118-y
20. Wang Y, Dong C, Hu Y, et al. Temporal changes of CT findings in 90 patients with COVID-19 pneumonia: a Longitudinal Study. Radiology. 2020;200843.
21. Wang YC, Luo H, Liu S, et al. Dynamic evolution of COVID-19 on chest computed tomography: experience from Jiangsu Province of China. Eur Radiol. 2020;30(11):6194–6203. doi:10.1007/s00330-020-06976-6
22. Zhou S, Zhu T, Wang Y, Xia L. Imaging features and evolution on CT in 100 COVID-19 pneumonia patients in Wuhan, China. Eur Radiol. 2020.
23. Bernheim A, Mei X, Huang M, et al. Chest CT findings in Coronavirus Disease-19 (COVID-19): relationship to duration of infection. Radiology. 2020;295(3):200463. doi:10.1148/radiol.2020200463
24. Yao XH, Li TY, He ZC, et al. [A pathological report of three COVID-19 cases by minimally invasive autopsies]. Zhonghua Bing li Xue Za Zhi. 2020;49(5):E009. doi:10.3760/cma.j.cn112151-20200312-00193.Chinese.
25. Liang T, Liu Z, Wu CC, et al. Evolution of CT findings in patients with mild COVID-19 pneumonia. Eur Radiol. 2020;30(9):4865–4873. doi:10.1007/s00330-020-06823-8
26. Pan F, Ye T, Sun P, et al. Time course of lung changes on chest CT during recovery from 2019 novel Coronavirus (COVID-19) pneumonia. Radiology. 2020;295(3):200370. doi:10.1148/radiol.2020200370
27. Lei F, Liu YM, Zhou F, et al. Longitudinal association between markers of liver injury and mortality in COVID-19 in China. Hepatology (Baltimore, Md). 2020;72(2):389–398. doi:10.1002/hep.31301
28. Das KM, Lee EY, Enani MA, et al. CT correlation with outcomes in 15 patients with acute Middle East respiratory syndrome coronavirus. AJR Am J Roentgenol. 2015;204(4):736–742. doi:10.2214/AJR.14.13671
 © 2021 The Author(s). This work is published and licensed by Dove Medical Press Limited. The
full terms of this license are available at https://www.dovepress.com/terms
and incorporate the Creative Commons Attribution
- Non Commercial (unported, 3.0) License.
By accessing the work you hereby accept the Terms. Non-commercial uses of the work are permitted
without any further permission from Dove Medical Press Limited, provided the work is properly
attributed. For permission for commercial use of this work, please see paragraphs 4.2 and 5 of our Terms.
© 2021 The Author(s). This work is published and licensed by Dove Medical Press Limited. The
full terms of this license are available at https://www.dovepress.com/terms
and incorporate the Creative Commons Attribution
- Non Commercial (unported, 3.0) License.
By accessing the work you hereby accept the Terms. Non-commercial uses of the work are permitted
without any further permission from Dove Medical Press Limited, provided the work is properly
attributed. For permission for commercial use of this work, please see paragraphs 4.2 and 5 of our Terms.