Back to Journals » OncoTargets and Therapy » Volume 13
Long Noncoding RNA LINC00460 Facilitates Colorectal Cancer Progression by Negatively Regulating miR-613
Authors Wang L ![]() , Chen X, Sun X
, Chen X, Sun X ![]() , Suo J
, Suo J
Received 18 March 2020
Accepted for publication 15 July 2020
Published 3 August 2020 Volume 2020:13 Pages 7555—7569
DOI https://doi.org/10.2147/OTT.S254489
Checked for plagiarism Yes
Review by Single anonymous peer review
Peer reviewer comments 2
Editor who approved publication: Dr Yao Dai
Lei Wang, 1 Xinxin Chen, 2 Xuan Sun, 1 Jian Suo 1
1Department of Gastrointestinal Surgery, Jilin University First Hospital, Changchun, Jilin 130021, People’s Republic of China; 2Department of Burn Surgery, Jilin University First Hospital, Changchun, Jilin 130021, People’s Republic of China
Correspondence: Jian Suo
Department of Gastrointestinal Surgery, Jilin University First Hospital, 71 Xinmin Street, Changchun, Jilin 130021, People’s Republic of China
Email [email protected]
Background: Long-noncoding RNAs (lncRNAs) could exert a crucial effect on the development of human cancers, including CRC. However, the biological function and underlying mechanism of LINCRNA00460 in the development of CRC still need deeper exploration.
Materials and Methods: The expression of LINC00460 in CRC tissues and cell lines was assessed by qRT-PCR. Cell proliferation, migration, and invasion were measured by the respective cell counting Kit-8 (CCK-8), wound healing assay and transwell invasion assay. Cell apoptosis and caspase-3 activity were detected by flow cytometry and caspase-3 activity assay. The relationship between LINC00460 and miR-613 expression was explored by Dual-luciferase reporter assay. Protein expression was measured by Western blotting. In vivo tumour growth was evaluated using a xenograft model of nude mice.
Results: LINC00460 was markedly up-regulated in CRC tissues and cell lines compared to their corresponding controls, which was closely correlated with clinical stage, TNM (T) classification, nodal (N) classification, metastasis (M) classification, liver metastasis and pathological differentiation, and survival rate of CRC patients. Functionally, LINC00460 knockdown decreased the proliferative, migrative and invasive abilities, and enhanced apoptosis rates and caspase-3 activity in HT29 and LOVO cells. Mechanistic studies indicated that miR-613 was targeted by LINC00460, and SphK1 was targeted and inversely regulated by miR-613 in HT29 and LOVO cells. In vivo studies, LINC00460 knockdown attenuated tumour growth. MiR-613 downregulation and SphK1 upregulation in the CRC tissues, and LINC00460 expression levels were inversely correlated with miR-613 expression and positively correlated with the SphK1 mRNA expression. Overall, LINC00460 modulated cell proliferation, migration, invasion and sphingosine kinase 1 (SphK1) expression in HT29 and LOVO cells, at least in most part, by regulating miR‐613.
Conclusion: LINC00460 functions as a competing endogenous RNA to regulate SphK1 expression by sponging miR‐613 in CRC and provides a valuable therapeutic strategy for CRC patients.
Keywords: long noncoding RNA 00460, miR‐613, colorectal cancer, SphK1
Corrigendum for this paper has been published
Introduction
Colorectal cancer (CRC), the third most prevalent malignancy worldwide, has high morbidity and mortality.1 Previous study has reported that 50–60% of CRC patients die of distant metastasis.2 The 5-year survival rate of these patients is less than 10%, resulting from their non-adaptation to surgical treatment.3 Thus, it is of great urgency to identify the underlying mechanisms associated with the development of metastasis.
LncRNAs are a class of noncoding RNAs of more than 200 nucleotides in length and have a limited protein-coding ability.4 Accumulating evidence have been presented that lncRNAs regulated the physiological and pathological processes in multiple types of tissues and cell lines, and multiple biological events, such as the process of the cell differentiation, apoptosis, metastasis and tumorigenesis.5–7 Recently, several lncRNAs were reported frequently abnormally expression in CRC, and have related to CRC progression.8,9 But, the molecular regulation mechanism during CRC progression remains unelucidated.
LINC00460 from chromosome 13 has been reported to be dysregulated and functioned as an oncogene in multiple types of cancers, including non‐small cell lung cancer,10 esophageal squamous cell carcinoma,11 nasopharyngeal carcinoma,12 head and neck squamous cell carcinoma.13 Previous study has been reported that LINC00460 was markedly up-regulated in CRC tissues, and closely associated with the clinical stage of CRC.14 Nevertheless, the role of LINC00460 in CRC progression has yet to be clarified.
Our study aims are to ascertain the role of LINC00460 in CRC progression. Our results indicated that LINC00460 was remarkably up-regulated in CRC tissues and cell lines. Then, knockdown of LINC00460 significantly inhibited the number of cell proliferation, migration, and invasion in HT29 and LOVO. Mechanistically, LINC00460 obviously suppressed the number of cell proliferation, migration, and invasion in HT29 and LOVO by regulating miR‐613/SphK1 axis. In short, all findings indicated regulation function of LINC00460/miR‐613/SphK1 in CRC progression, which might provide a new treatment strategy for CRC disease.
Materials and Methods
Patient and Tissue Samples
Seventy-four CRC tissues and adjacent normal tissues were collected from CRC patients at Jilin University First Hospital (Changchun, China) between August 2012 and August 2013. Clinicopathological features of CRC patients are shown in Table 1. Our study was performed in strict accordance with the Declaration of Helsinki and approved by the Ethical Committee of Jilin University First Hospital. Written informed consent was received from all patients whose tissues were used.
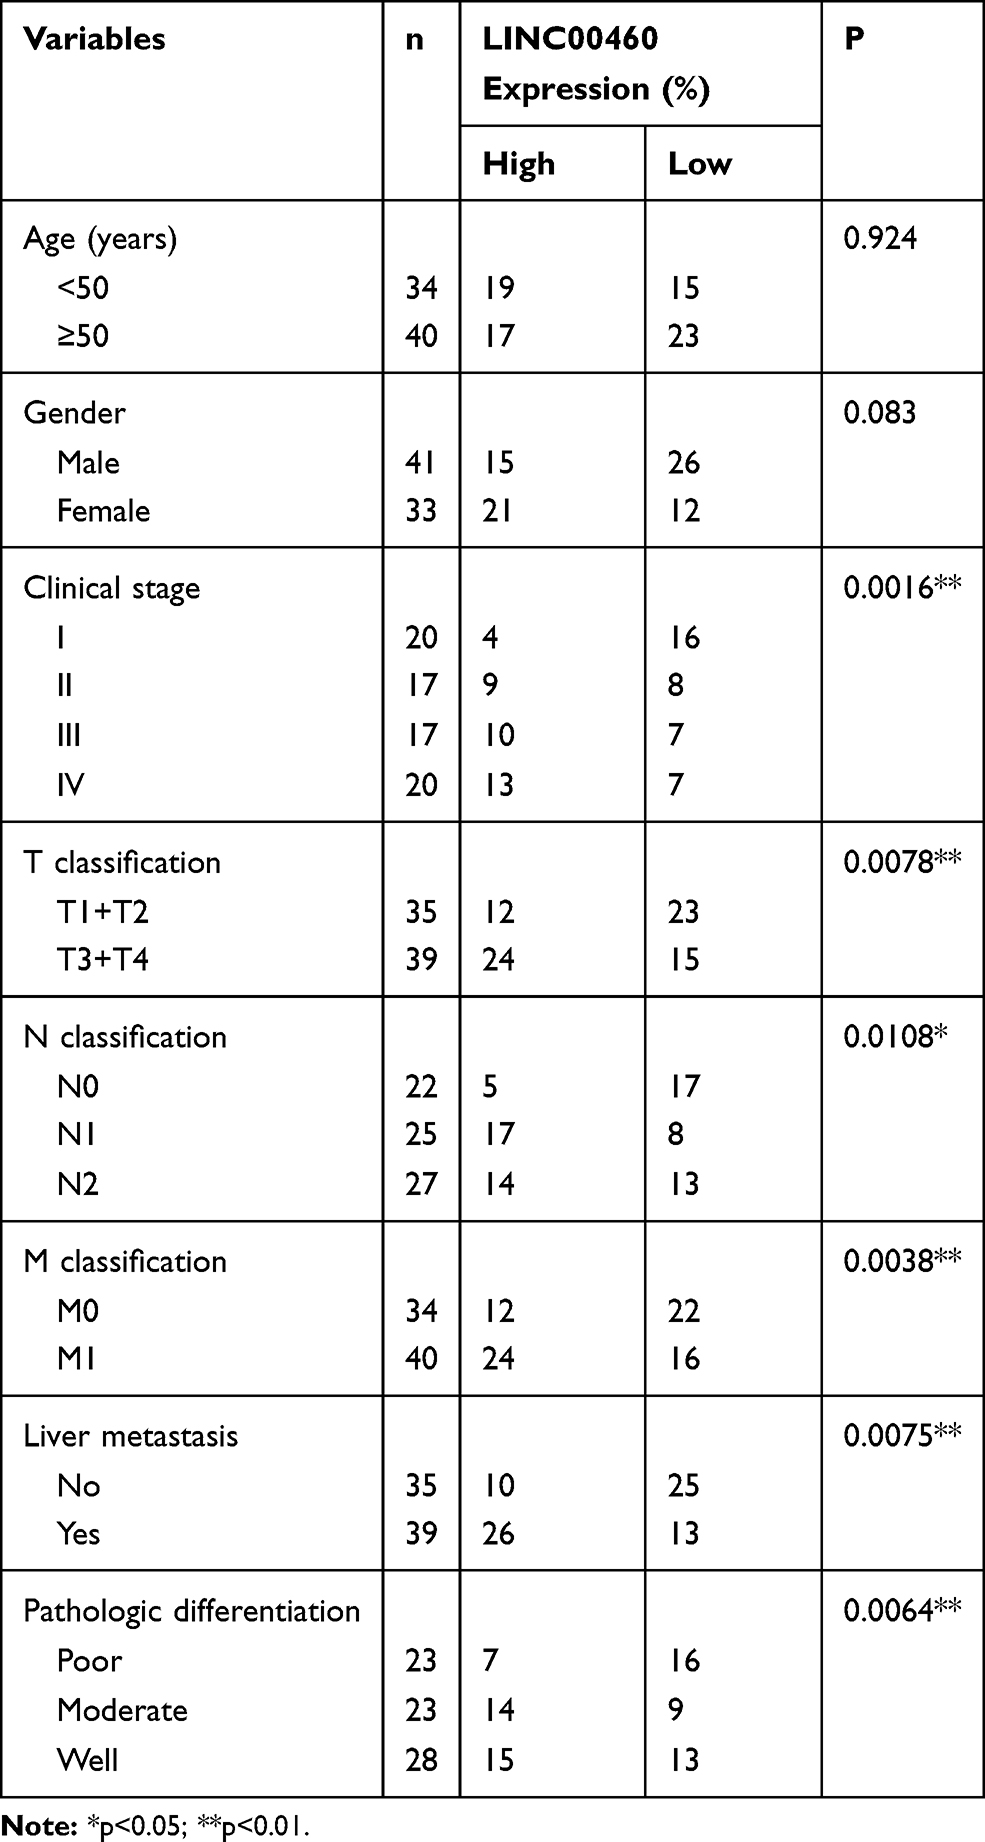 |
Table 1 Correlation Between Clinicopathological Features and LINC00460 Expression in 74 Patients with Colorectal Cancer |
Cell Culture
Human colon cancer cell lines (HT29, HCT116, SW480, and LOVO) and normal human colon epithelial cell line (NCM460) were obtained from Solaribio (Beijing, China) and cultured in RPMI1640 medium supplemented with 10%FBS (HyClone, USA), 100 IU/mL penicillin, and 100 mg/mL streptomycin at 37°C in a humidified with 5% CO2.
Oligonucleotide and Cell Transfection
Effective small interfering RNA oligonucleotides that targeted LINC00460 (si-LINC 00460; 5ʹ-GUGUCAACAACCUGUUUAAUU-3ʹ) and negative control small interfering RNA (si-NC; 5ʹ-UUCUCCGAACGUGUCACGUTT-3ʹ) were chemically synthesized by RiboBio (Guangzhou, China). MiR-613 mimics: (5ʹ-AGGAAUGUU CCUUCUUUGCC-3ʹ), negative control (NC mimic, 5ʹ-UUCUCCGAACGUGUCAC GUTT), miR-613 inhibitor: (5ʹ-GGCAAAGAAGGAACAUUCCT-3ʹ) and corresponding negative control (NC inhibitor,5ʹ-AUCCGUAGGCGUUAGCCUAU-3ʹ) were also obtained from RiboBio. Then, all the oligonucleotides were transfected into HT29 and procedure of the manufacturer’s instructions.
Cell Counting Kit-8 (CCK-8)
Cell proliferative ability was assessed by Cell Counting Kit‐8 reagent (CCK‐8; Dojindo, Tokyo, Japan). In brief, transfected cells (5x10³ cells/well) were added into a 96-well plate and incubated at 37°C with 5% CO2 for 24–72 h. Then, 10 µl of CCK-8 solution was added to each cell well and the plates continued to incubate for 2h. The absorbance (OD) at 450 nm was determined with the microplate reader.
Wound Healing Assay
Transfected cells (5x10⁴ cells/well) were added into a 6‐well plate, and cultured until 100% confluence. Monolayers were wounded using a sterile plastic micropipette tip. After washing with PBS for 10min, cells were cultured and observed at 0 and 24 h, and then photographed under an inverted phase‐contrast Microscope (Olympus, Tokyo, Japan). Migration distance (units) was assessed using the Image J software.
Transwell Invasion Assay
Cells invasive ability was measured by Transwell invasion chambers (Corning, Tewksbury, MA, USA) covered with a membrane with 8um pores. In brief, transfected cells (2×10⁵) in serum‐free medium were added to the upper chamber, which had been precoated with Matrigel (BD Biosciences). Whereas medium containing 10% FBS was added to the lower chambers as a chemoattractant. After incubation for 48h at 37°C, the invaded cells of the membrane were fixed in 20% methanol, and then stained with 0.1% crystal violet. Finally, the invaded cells were counted in five randomly fields (×400) under an inverted phase‐contrast microscope (Olympus, Tokyo, Japan).
Cell Apoptotic Rates
Cells after being transfected with oligonucleotides were trypsinized and fixed by ice‐cold 70% ethanol for the duration of 30 min. After that, the transfected cells were incubated with 20mg/mL RNase (Sigma‐Aldrich) at 37°C for the duration of 1h. For cell apoptosis analysis, cells were stained with FITC Annexin V and propidium iodide (Beyotime, Beijing, China), and then apoptotic cells were detected using a FACSCalibur flow cytometer (BD Biosciences, Franklin Lakes, NJ).
Caspase-3 Activity
Cells after being transfected with oligonucleotides were subjected to the caspase‐3 activity determination using a Caspase‐3 activity assay kit (Abcam, Cambridge, UK) according to the manufacturer’s protocol.
Dual-Luciferase Reporter Assay
According to the miRcode bioinformatics tools (http://www.mircode.org/), we found that LINC00460 was predicted to be a directly regulated target of miR‐613. Then, we amplified the 3ʹ-untranslated region (3ʹ-UTR) fragment of LINC00460 and cloned into psiCHECK-2 vectors, which was named as Wt-LINC00460. LINC00460-3ʹ- UTR-mutant was constructed, which named as Mut-LINC00460. For reporter assays, 200 ng of reporter plasmid and 100 nM of either miR-613 mimics or miR-613 inhibitor were co-transfected into HT29 and LOVO cells for 48h. The luciferase activity assays were measured using a Dual-Luciferase Reporter Assay System (Promega Corporation, Fitchburg, WI, USA) according to the manufacturer’s protocol. The relative luciferase activity was normalized to Renilla luciferase activity.
RNA Immunoprecipitatation
HT29 and LOVO cells were co-transfected with pSL-MS2, pSL-MS2-LINC00460 or pSL-MS2-LINC00460 (MUT) along with pMS2-GFP (Addgene). At 48 h after co-transfection, cells were processed to perform RNA immunoprecipitation (RIP) experiments using a GFP antibody (Roche, Basel, Switzerland) and the Magna RIPTM RNA-Binding Protein Immunoprecipitation Kit (Millipore, Burlington, USA) according to the manufacturer’s protocol. The RNA fraction was then purified and analysed by qRT-PCR.
Reverse Transcription and Quantitative Real-Time PCR (qRT‐PCR)
Total RNA from CRC tissues and cells were collected using a Trizol reagent (Thermo Fisher Scientific), respectively. cDNA was synthesized from total RNA by a RNA PCR Kit (Takara, Dalian, China). Real‐time PCR was conducted with the 7900 Real‐Time PCR System (Applied Biosystems). GAPDH and U6 were used to normalize the expression levels of LINC00460/Sphk1 and miR-613, respectively. Relative expression levels were analyzed using the −2ΔΔCt method. Primer sequences were presented as follows (Table 2): miR-613: forward: 5ʹ-CGCAGCA CACCTGCTTTTTG-3ʹ, reverse: 5ʹ-AGAGATTCGGGTCGATGCTC-3ʹ; U6: forward: 5ʹ-TC CGATCGTGAAGCGTTC-3ʹ, reverse:5ʹ-GTGCAGGGTCCGAGG
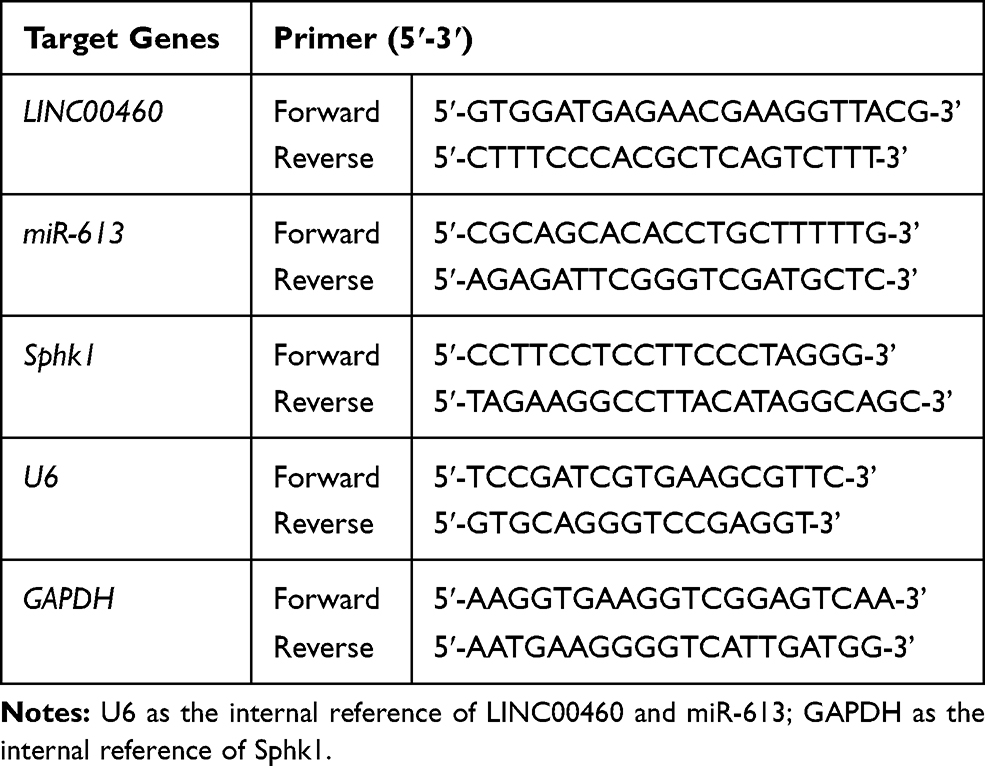 |
Table 2 Real-Time PCR Primers Used for mRNA Expression Analysis |
T-3ʹ; LINC00460: forward: 5ʹ-GTGGATGAGAACGAAGGTTACG-3ʹ, reverse: 5ʹ-CTTTCCCACGCTCAGTCTTT-3ʹ; Sphk1: forward: 5ʹ-CCTTCCTCCTTCCCTA
GGG-3ʹ, reverse: 5ʹ-TAGAAGGCCTTACATAGGCAGC-3ʹ GAPDH: forward: 5ʹ-
AAGGTGAAGGTCGGAGTCAA-3ʹ, reverse: 5ʹ-AATGAAGGGGTCATTGATGG-3ʹ.
Western Blot Analysis
Total protein from CRC tissues and CRC cells were extracted by using RIPA lysis buffer (Solarbio, Beijing, China) and qualified using a BCA kit (Solarbio, Beijing, China). Protein (80ug) was separated on the 10% SDS-PAGE gel and then transferred into PVDF membranes (Solarbio, Beijing, China). After blocking with 5% skim milk, the membrane was incubated with the primary antibody overnight at 4°C. Then, the membranes were incubated with the HRP-conjugated goat anti-rabbit IgG (1:3000; ab97051, Abcam, Cambridge, UK) at room temperature for 2h. Protein bands were visualized using an enhanced chemiluminescence (ECL) detection system (Thermo Fisher Scientific). The primary antibody was presented as follows: SphK1 (1:1200; ab71700, Abcam, Cambridge, UK) and GAPDH (1:3000; ab9485, Abcam, Cambridge, UK).
In vivo Xenograft Model
All animal experimental procedures were under the approval of the Animal Research Committee of Jilin University First Hospital and followed the ARRIVE guidelines. Six 4w-old BALB/c nude mice were randomly divided into two groups. H29 cells transfected with si-NC or si-LINC00460 (2x10⁶ cells/mice) were administered into the neck area of the nude mice by subcutaneous injections. The tumour volume of the mice was monitored up to 42d with measurement at a 7d interval. The tumour volume was calculated using the following formula: volume = (width x length x height)/2.
Statistical Analysis
Statistical analysis was performed using SPSS software (version 19.0, IBM, Chicago, USA). All findings were presented as mean±standard deviation (SD). Comparison for two groups was assessed by the Student’ t test, comparison of multiple groups was performed through the one-way analysis of variance. The correlations were conducted with the Spearman’s rank test. P-values of 0.05 or less were considered significant statistical difference.
Results
LINC00460 Was Increased and Closely Correlated with Poor Prognosis in CRC
We first investigate the LINC00460 expression profiles in 74 CRC tissues and adjacent normal tissues by qRT-PCR assay. As illustrated in Figure 1A, LINC00460 was up-regulated in most (66/74, 89.2%) CRC tissues compared to the corresponding control. Then, we detected the LINC00460 expression with a different clinical pathological status of CRC tissues, we found that LINC00460 was gradually increased with the advanced staging of CRC (Figure 1B), and LINC00460 expression up-regulation was more prevalent present in CRC patients with liver metastasis (Figure 1C) and lymph node metastasis (Figure 1D). Based on the median expression of LINC00460, we divided CRC patients into high LINC00460 expression group and low LINC00460 expression group. Moreover, we assessed the correlation between LINC00460 and clinical features in CRC patients. Our findings indicated that high LINC00460 level was closely correlated with shorter survival rate (Figure 1E, P<0.01), clinical stage (P=0.002), metastasis (M) classification (P=0.004), nodal (N) classification (P=0.011), and liver metastasis (P=0.008) (Figure 1E and Table 2). Further, LINC00460 expression was presented at cellular level, LINC00460 was markedly increased in CRC cell lines (HT29, HCT116, SW480, and LOVO) compared to the NCM460 cells (Figure 1F, P < 0.01).
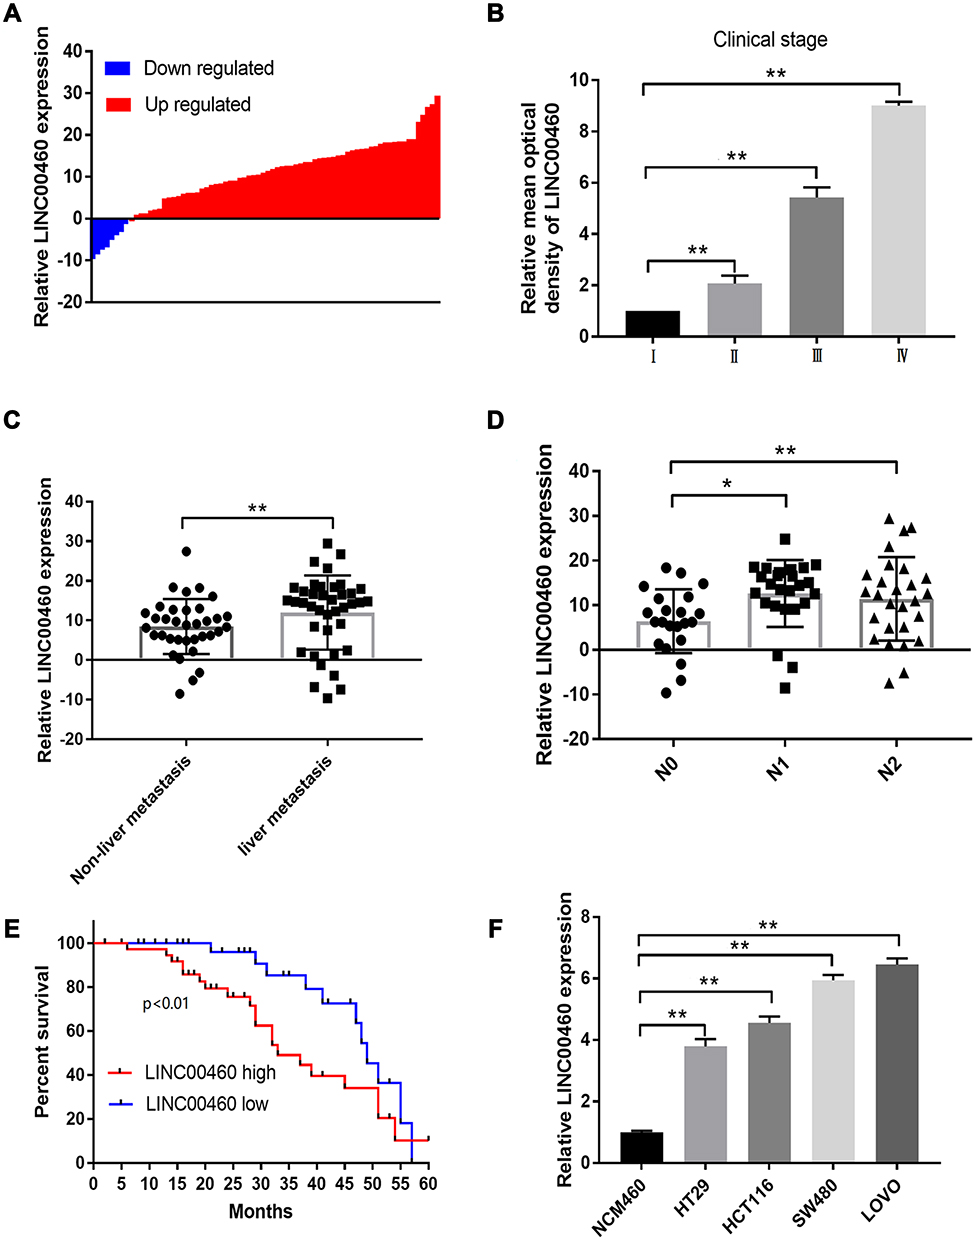 |
Figure 1 LINC00460 was up-regulated and correlated with poor prognosis in CRC. (A) Expression of LINC00460 was examined by qRT‐PCR assay in CRC tissues (n = 74). (B) LINC00460 was gradually elevated with advanced staging as measured by an in situ hybridization assay. (C and D) Expression of LINC00460 was up-regulated in patients with liver metastasis (C) and lymph node metastasis (D) by qRT-PCR assay. (E) The overall survival in the patients with high LINC00460 was significantly shorter than that in the patients with low LINC00460, p<0.0001 as determined by Kaplan-Meier analyses. (F) LINC00460 expression was remarkably elevated in CRC cell lines HT29, HCT116, SW480 and LOVO. *p<0.05, **p<0.01. |
LINC00460 Knockdown Inhibited Cell Proliferation, Migration, and Invasive Potentials and Increased Cell Apoptotic Rates and Caspase-3 Activity in HT29 and LOVO Cells
We further explored that LINC00460 might play a role in CRC metastasis. We first transfected LINC00460 siRNA and si-NC into HT29 and LOVO cell lines to knockdown of LINC00460. si-LINC00460 transfection markedly decreased the expression of LINC00460 in HT29 and LOVO cell lines by qRT-PCR assay (Figure 2A; p<0.001). Then, we also detected the cell proliferation, migration, invasion, cell apoptotic rates and caspase-3 activity of HT29 and LOVO cells transfected with si-LINC00460. LINC00460 knockdown remarkably suppressed cell proliferation (Figure 2B and C; p < 0.001), migration (Figure 2D; p < 0.001) and invasion (Figure 2E; p < 0.01) of HT29 and LOVO cells. Moreover, cell apoptosis (Figure 2F, p<0.01) and caspase-3 activity (Figure 2G, p<0.01) were obviously increased after si-LINC00460 transfection in HT29 and LOVO cells.
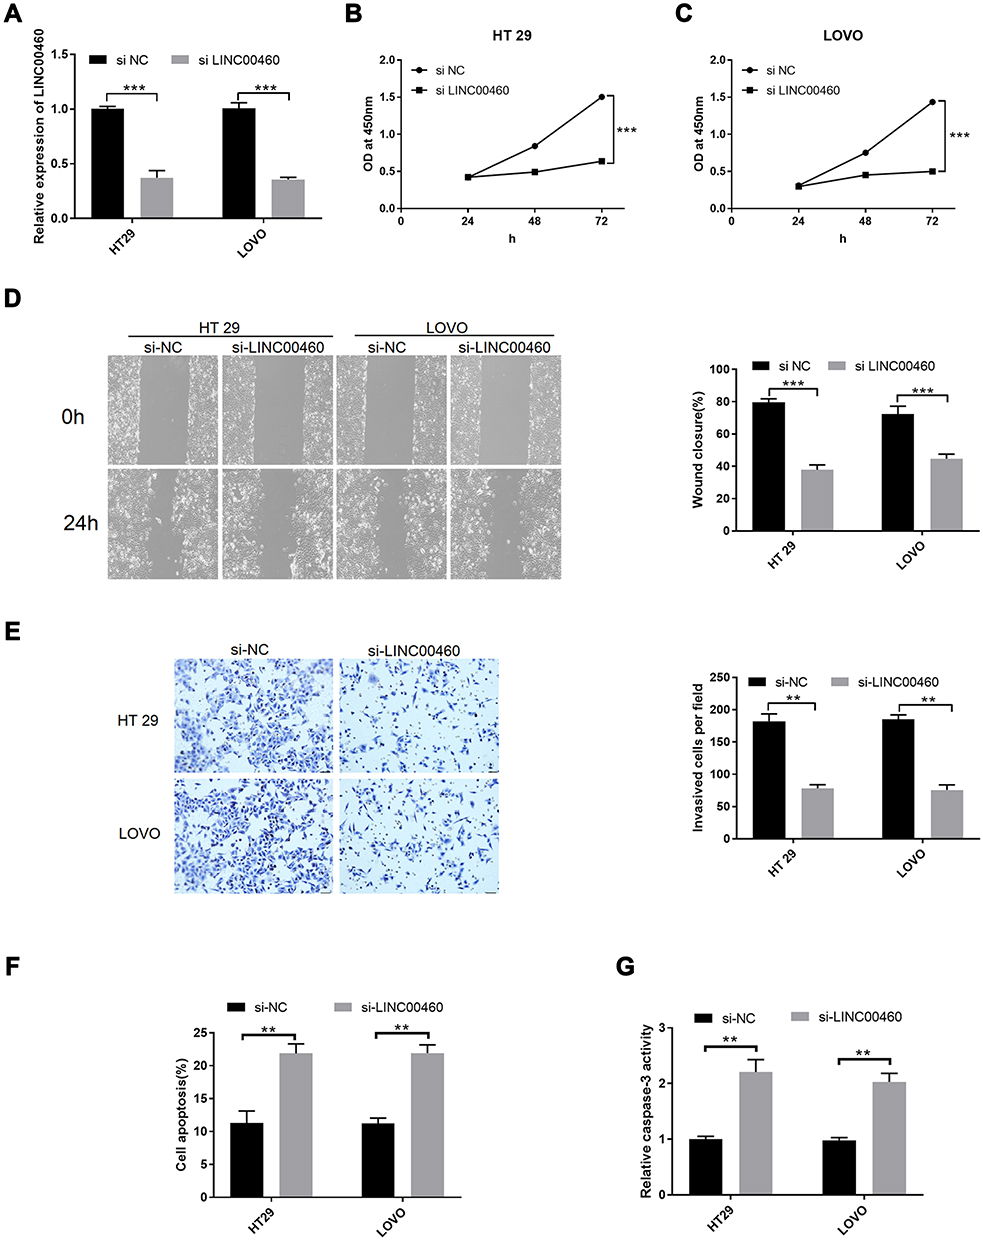 |
Figure 2 LINC00460 knockdown inhibited cell proliferation, migration, and invasive potentials and increased cell apoptotic rates and caspase-3 activity in HT29 and LOVO cells. (A) Relative expression of LINC00460 was examined by qRT‐PCR in HT29 and LOVO cells transfected with si‐NC or si‐LINC00460. (B and C) Cell proliferation was examined by CCK‐8 assay in HT29 (B) and LOVO (C) cells transfected with si‐NC or si‐LINC00460. (D) Cell migration was detected by wound healing assay in HT29 and LOVO cells transfected with si‐NC or si‐LINC00460. (E) Cell invasion was determined by transwell invasion assay in HT29 and LOVO cells transfected with si‐NC or si‐LINC00460. (F) Cell apoptosis and (G) caspase-3 activity of HT29 and LOVO cells after si-NC or si-LINC00460 transfection were detected by flow cytometry and caspase-3 activity assay, respectively. **p < 0.01, ***p < 0.001. |
LINC00460 Down-Regulated miR‐613 Expression in HT29 and LOVO Cells
Previous study has been demonstrated that lncRNA serves as a competing endogenous RNAs (ceRNA) to exert its regulatory functions.15 Hence, we used miRcode software to predict the potential targets of LINC00460. Our findings indicated that miR‐613 was a directly potential target of LINC00460. To further validate it, we also performed the luciferase reporter assay. As illustrated in Figure 3A, Luciferase reporter plasmids with fragments of LINC00460 (wild type or mutated) were constructed. Transfection by miR-613 mimics successfully increased miR-613 expression (Figure 3B, p<0.01). Co-transfection with miR-613 mimics and reporter vectors with fragment of Wt-LINC00460 remarkably attenuated luciferase activity in HT29 and LOVO cells, whereas miR‐613 inhibitor elevated the activity (Figure 3C and D; p < 0.01). However, when the binding site was mutated, miR‐613 mimics or inhibitors failed to attenuate the luciferase activity, which suggested that miR‐613 directly bond to LINC00460 (Figure 3C and D; p > 0.05). More importantly, the RIP assay showed LINC00460 RIP was markedly enriched for miR-613 in HT29 and LOVO cells compared with MS2 and the mutant vector (Figure 3E, p<0.01). Furthermore, miR-613 downregulation was analyzed in HT29 and LOVO cells compared to the normal cells (Figure 3F, p<0.01). miR-613 over-expression remarkably reduced the LINC00460 expression in HT29 and LOVO cells, whereas miR-613 inhibitor restored the LINC00460 expression in HT29 and LOVO cells (Figure 3G and H; p < 0.01). Moreover, LINC00460 knockdown obviously elevated the miR-613 expression in both HT29 and LOVO cells by qRT-PCR assays (Figure 3I; p < 0.01).
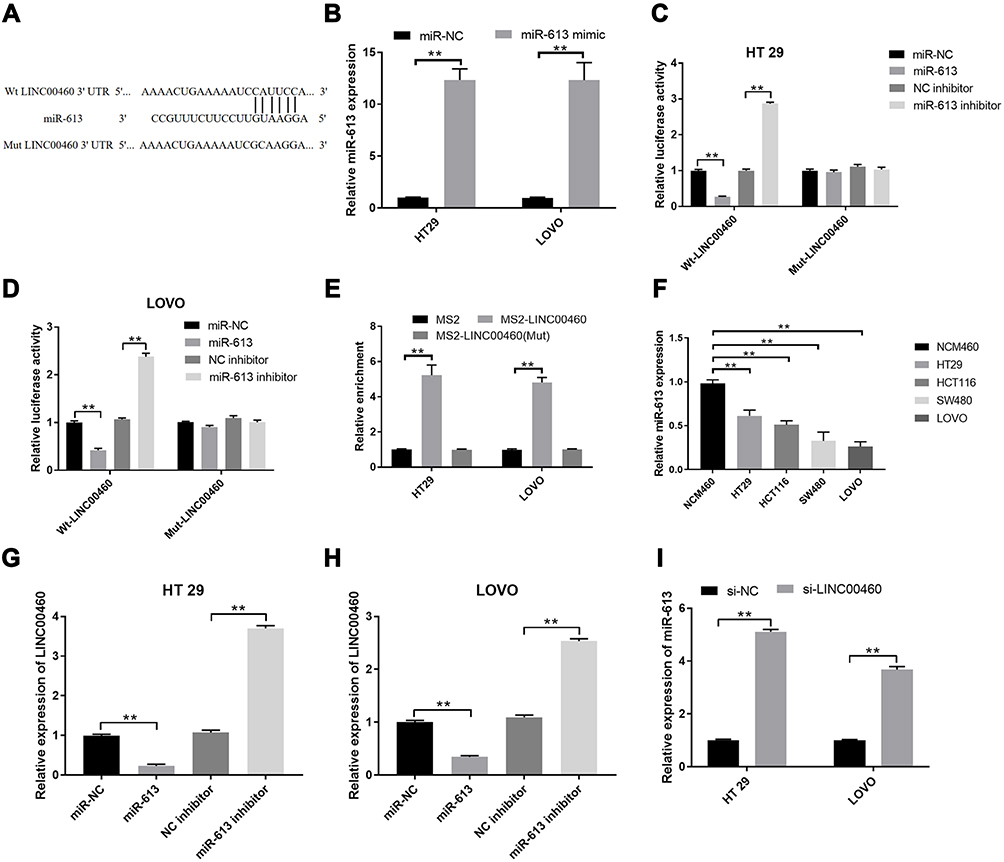 |
Figure 3 LINC00460 down-regulated miR‐613 expression in HT29 and LOVO cells. (A) Putative miR-613 binding sequences of LINC00460 and the reporter constructs showing the wild type (Wt) LINC00460 sequence and the mutant (Mut) LINC00460 sequence. (B) qRT-PCR analysis of miR-613 expression levels in HT29 and LOVO cells after miR-NC or miR-613 mimics transfection. (C and D) Luciferase activity was examined in HT29 and LOVO cells co-transfected with Wt‐LINC00460‐3′‐UTR or Mut‐LINC00460‐3′‐UTR reporter plasmid and miR‐613 mimic, miR‐NC and miR‐613 inhibitor. (E) MS-RIP followed by qRT-PCR to detect the interaction between LINC00460 and miR-613 in HT29 and LOVO cells. (F) qRT-PCR analysis of miR-613 expression levels in normal cell line, and HT29 and LOVO cell lines. (G and H) Relative expression of LINC00460 was examined by qRT‐PCR in HT29 and LOVO cells transfected with miR‐NC, miR‐613 mimic, and miR‐613 inhibitor. (I) Relative expression of miR‐613 was determined in HT29 and LOVO cells transfected with si‐NC or si‐LINC00460 by qRT‐PCR. U6 was used as internal control. **p < 0.01.Abbreviations: Wt, wild‐type; Mut, mutant‐type; 3′‐UTR, 3′‐untranslated region. |
MiR‐613 Mediated the Tumor-suppressive Effects of LINC00460 Knockdown on HT29 and LOVO Cells
To further investigate whether LINC00460 exerted a biological function role in CRC, depending on the negative regulation of miR‐613, we knocked down LINC00460 and suppressed miR‐613 in the same time in HT29 and LOVO cells, subsequently, we detected the cell proliferation, migration and invasion. Our findings indicated that LINC00460 knockdown markedly increased miR‐613 expression, whereas miR-613 inhibitor restores miR-613 expression in both HT29 and LOVO cells (Figure 4A and B; p < 0.05). Meanwhile, LINC00460 knockdown remarkably inhibited cell proliferation (Figure 4C and D; p < 0.05), migration (Figure 4E; p < 0.05) and invasion (Figure 4F; p < 0.05) in HT29 and LOVO cells, whereas miR-613 inhibitor in the meantime abrogated inhibition effects by LINC00460 knockdown.
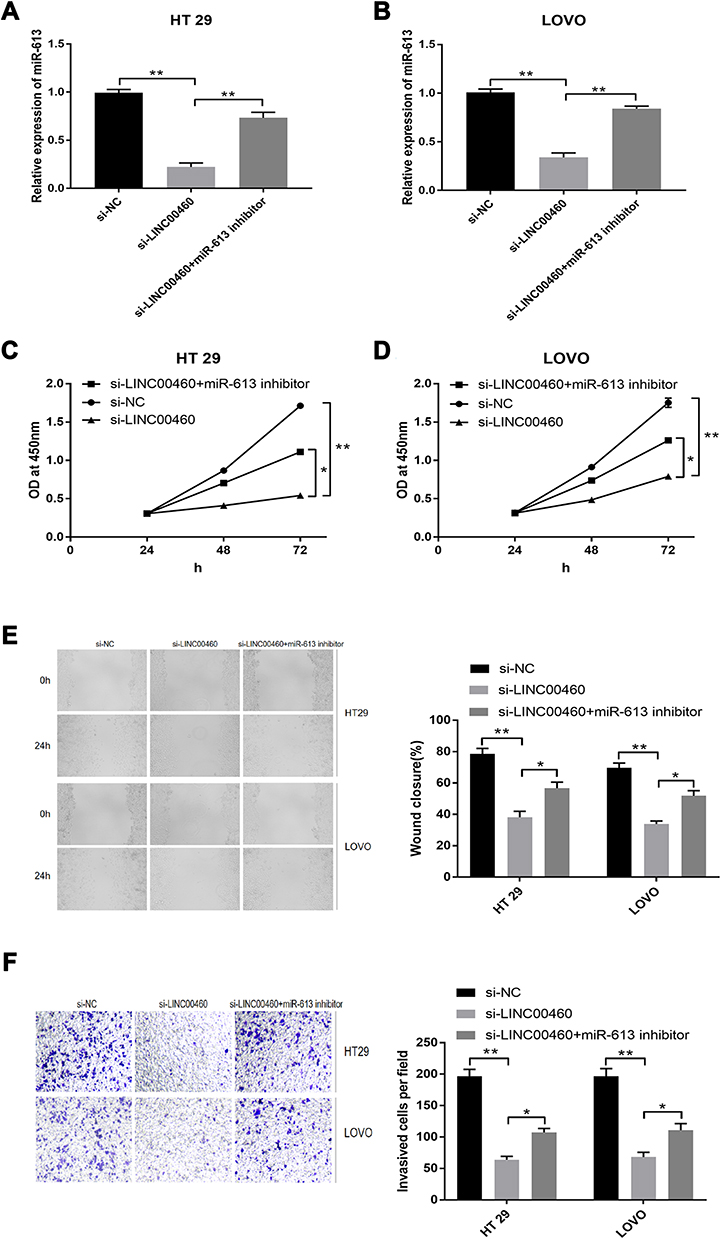 |
Figure 4 MiR‐613 mediated the tumor‐suppressive effects of LINC00460 knockdown on HT29 and LOVO cells. (A and B) Relative expression of miR‐613 was determined in (A) HT29 and (B) LOVO cells transfected with si‐NC, si‐LINC00460, and si‐LINC00460 + miR‐613 inhibitor. (C and D) Cell proliferation was determined by CCK‐8 assay in HT29 (C) and LOVO (D) cells transfected with si‐NC, si‐LINC00460, and si‐LINC00460 + miR-613 inhibitor. (E and F) Cell migration (E) and invasion (F) were determined in HT29 and LOVO cells transfected with si‐NC, si‐LINC00460, and si‐LINC00460 + miR‐613 inhibitor. *p < 0.05, **p < 0.01. |
SphK1 is Targeted by miR-613 in HT29 and LOVO Cells
SphK1, a oncogene that facilitates cancer progression in various cancers, was identified as a downstream effector of miR‐613.16 Hence, luciferase reporter assay was performed to confirm this interaction. Reporter plasmids containing the wild-type or mutated 3ʹ-UTR of SphK1 were constructed (Figure 5A). Co-transfection with miR-613 mimics and reporter vectors with the SphK1 3ʹ-UTR (wild-type) inhibited luciferase activity (Figure 5B and C, p<0.01), while co-transfection with miR-613 mimics and reporter plasmids with mutated SphK1 3ʹ-UTR failed to change luciferase activity in HT29 and LOVO cells (Figure 5B and C, p>0.05). MiR-613 over-expression inhibited the expression of SphK1 mRNA (Figure 5D, p<0.01) and protein (Figure 5E, p<0.01) in HT29 and LOVO cells. LINC00460 silence down-regulated SphK1 mRNA (Figure 5F, p<0.01) and protein (Figure 5G, p<0.01) expression.
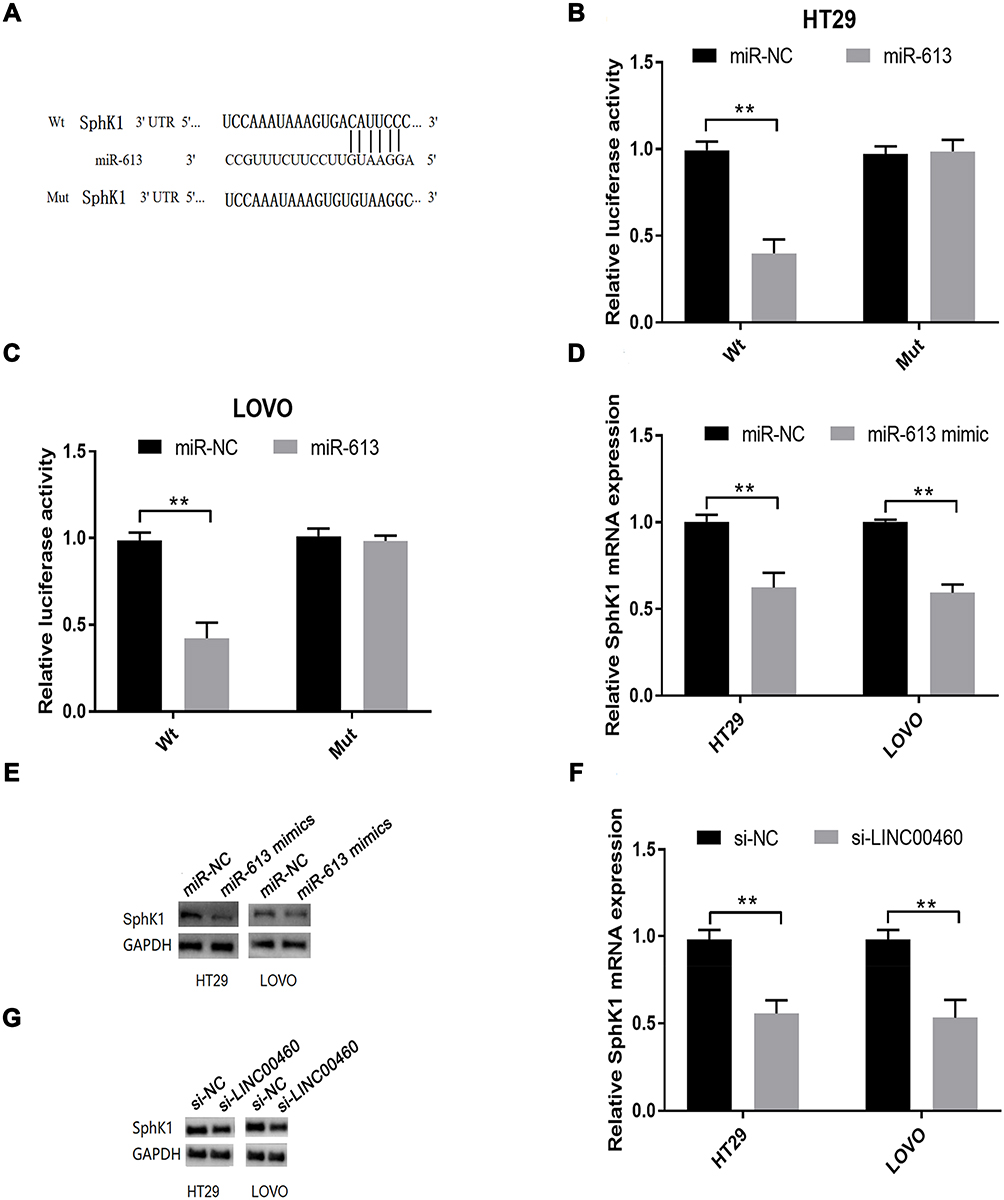 |
Figure 5 SphK1 is targeted by miR-613 in HT29 and LOVO cells. (A) Putative miR-613 binding sequences in the 3ʹ-UTR of SphK1 and the reporter constructs showing the wild type (Wt) SphK1 3ʹ-UTR sequence and the mutant (Mut) SphK1 3ʹ-UTR sequence. (B and C) miR-613 mimics transfection suppressed the luciferase activity of the Wt but not the MUT SphK1 3ʹ-UTR reporter in HT29 and LOVO cells. (D) qRT-PCR analysis and (E) Western blot analysis of SphK1 mRNA and protein expression levels in HT29 and LOVO cells after miR-NC or miR-613 mimics transfection. (F) qRT-PCR analysis and (G) Western blot analysis of SphK1 mRNA and protein expression levels in HT29 and LOVO cells after si-NC or si-LINC00460 transfection. **p < 0.01. |
In addition, pcDNA3.1-SphK1 transfection markedly elevated the SphK1 mRNA (Figure 6A, p<0.01) and protein (Figure 6B, p<0.01) expression, and the SphK1 expression was obviously increased in HT29 and LOVO cells (Figure 6C, p<0.01). Moreover, SphK1 over-expression restored the reduced cell proliferation (Figure 6D, 6E; p<0.05, p<0.01) and invasion abilities (Figure 6F and G; p<0.05, p<0.01) induced by miR-613 mimics transfection or LINC00460 knockdown in HT29 and LOVO cells.
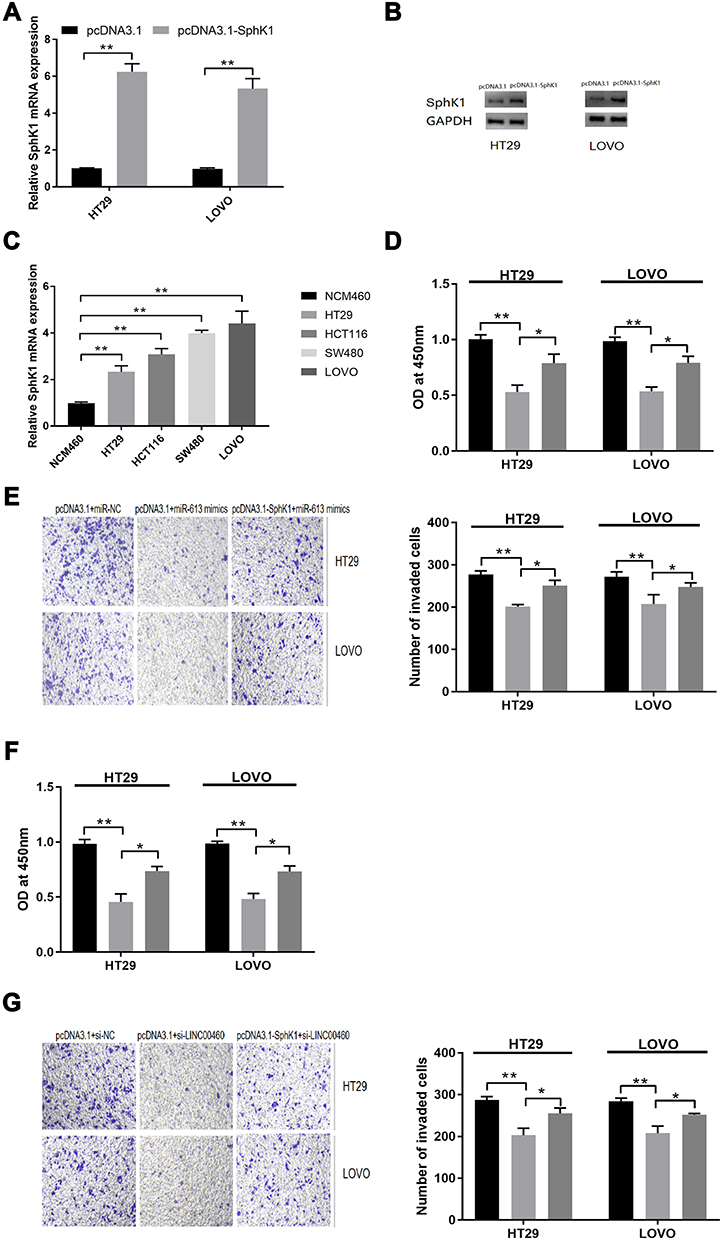 |
Figure 6 SphK1 is targeted by miR-613 in HT29 and LOVO cells. (A) qRT-PCR analysis and (B) Western blot analysis of SphK1 mRNA and protein expression levels in HT29 and LOVO cells after pcDNA3.1 or pcDNA3.1-SphK1 transfection. (C) qRT-PCR analysis of SphK1 mRNA expression levels in normal cell line (NCM460) and CRC cell lines (HT29, HCT116, SW480 and LOVO). (D) Cell proliferation and (E) cell invasion of HT29 and LOVO cells co-transfected with pcDNA3.1+miR-NC, pcDNA3.1+miR-613 mimics, or pcDNA3.1-SphK1+miR-613 mimics were detected by CCK-8 assay and Transwell invasion assay, respectively. (F) Cell proliferation and (G) cell invasion of HT29 and LOVO cells co-transfected with si-NC + pcDNA3.1, si-LINC00460+pcDNA3.1, si-LINC00460+pcDNA3.1-SphK1 were detected by CCK-8 assay and Transwell invasion assay, respectively. *p < 0.05, **p < 0.01. |
LINC00460 Knockdown Inhibited in vivo Xenograft Tumour Growth
The nude mice were injected subcutaneously with HT29 cells after being transfected with si‐NC or si‐LINC00460. Our observed that LINC00460 knockdown markedly decreased tumor volume at 28, 35 and 42 days (Figure 7A, p<0.01). Meanwhile, compared to si-NC group, tumor weight of LINC00460 knockdown group remarkably reduced (Figure 7B, p<0.01). LINC00460 expression was decreased in the si‐LINC00460 group compared to the si‐NC group (Figure 7C, p<0.01), whereas miR‐613 expression was increased in the si‐LINC00460 group compared to the si‐NC group (Figure 7D, p<0.01). Moreover, SphK1 expression was obviously decreased in the si‐LINC00460 group (Figure 7E, p<0.01).
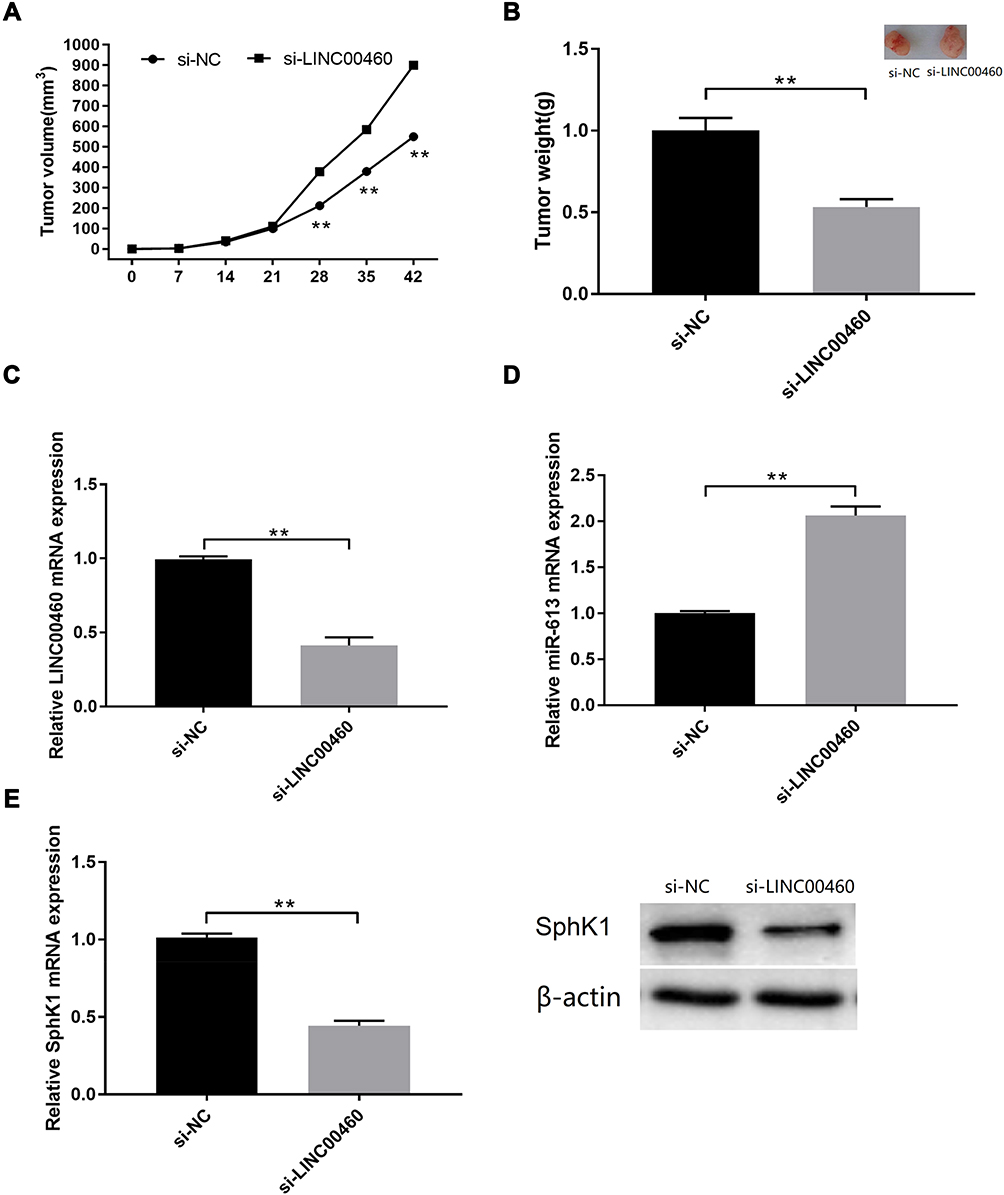 |
Figure 7 LINC00460 knockdown inhibited in vivo xenograft tumour growth. (A) Tumour volume and (B) tumour weight changes in the mice bearing HT29 cells with si-NC or si-LINC00460 transfection. (C) qRT-PCR analysis of LINC00460 expression levels in the isolated tumour tissues. (D) qRT-PCR analysis of miR-613 expression levels in the isolated tumour tissues. (E) qRT-PCR analysis of SphK1 mRNA and protein expression levels in the isolated tumour tissues. N = 3.**p < 0.01. |
MiR-613 Downregulation and SphK1 Upregulation in CRC Tissues from CRC Patients
Results from the qRT‐PCR assay found that miR‐613 expression levels were decreased (Figure 8A, p<0.01), while SphK1 mRNA expression levels were increased in CRC tissues when compared with adjacent normal tissues (Figure 8B, p<0.01). Further correlation analysis showed that LINC00460 expression levels were inversely correlated with miR-613 expression levels (Figure 8C; p<0.05) and positively correlated with those of SphK1 in CRC tissues (Figure 8D; p<0.05).
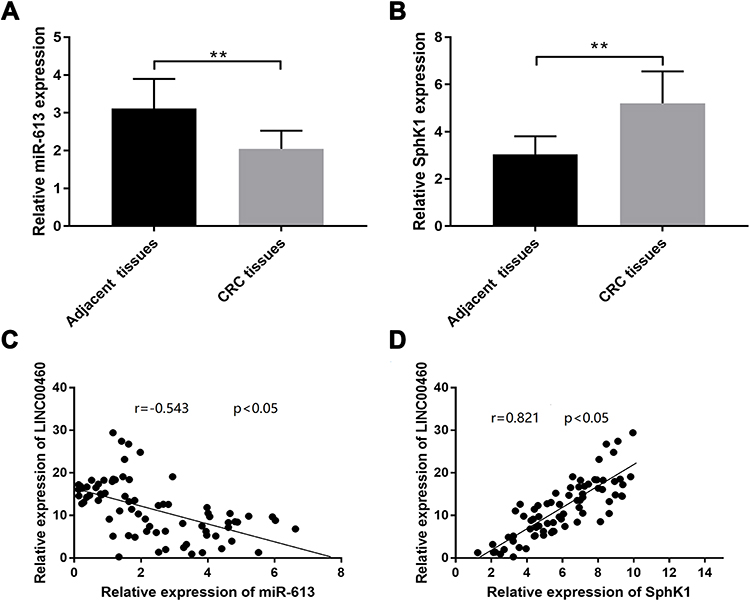 |
Figure 8 MiR-613 downregulation and SphK1 upregulation in CRC tissues from CRC patients. (A) qRT-PCR analysis of miR-613 expression levels in adjacent normal tissues and tissues from CRC patients. (B) qRT-PCR analysis of SphK1 mRNA expression levels in adjacent normal tissues and tissues from CRC patients. (C) Spearman correlation analysis was used to determine the correlations between LINC00460 expression level and miR‐613 in CRC tissues. (D) Spearman correlation analysis was used to determine the correlations between LINC00460 expression level and SphK1 mRNA expression levels in CRC tissues. **p < 0.01. |
Discussion
Growing evidence has been reported that lncRNAs involve in multiple types of cancer-related biological abnormal behaviors, such as proliferation, apoptosis and metastasis.17–19 As a newly identified lncRNA, LINC00460 has been reported to be closely correlated with progression in several types of cancers. For example, LINC00460 facilitated nasopharyngeal carcinoma tumorigenesis through regulating miR-149-5p/IL6 signal pathway.13 LINC00460 contributed to cell migration, invasion, and promoted epithelial–mesenchymal transition in non-small-cell lung cancer.10 LINC00460 depletion inhibited esophageal squamous carcinoma cell growth, cell cycle and apoptosis.11 Although LINC00460 was increased and positively associated with the clinical stage of CRC,14 the function and underlying mechanism of LINC00460 remain unclarified. Hence, we first detected the LINC00460 expression in CRC tissues and cell lines by qRT‐PCR assay. Our results indicated that LINC00460 was increased in the CRC tissues and cell lines, and elevated LINC00460 expression was closely associated with CRC patients’ clinicopathological features, such as M classification (P=0.004), N classification (P=0.011), and liver metastasis (P=0.008), which was consistent with Zhang et al’s result.14 Further, we explored the function of LINC00460 knockdown. We observed that LINC00460 knockdown remarkably suppressed the number of cell proliferation, migration and invasion in HT29 and LOVO. In short, our results revealed that LINC00460 acted as the oncogene role in CRC progression.
Multiple lncRNAs was served as a ceRNAs to sponge miRNAs through competitively binding the 3ʹ-UTR site of microRNAs.20 Hence, we wonder whether LINC00460 might also act as a ceRNA exerting its biological function in CRC progression. To investigate the correlation between both LINC00460 and miRNA, we observed that the miR-613 could tightly bind to LINC00460 through bioinformatics analysis. MiR-613 was identified to function as a tumor suppressor in several cancers.21–23 Importantly, miR-613 over-expression markedly inhibited the number of cell proliferation, migration and invasion in CRC.24 Moreover, we identified that LINC00460 directly bond to miR-613 by luciferase reporter analysis. Meanwhile, miR-613 over-expression decreased LINC00460 expression, whereas under/over-expression of miR-613 elevated LINC00460 expression in HT29 and LOVO cells. Meanwhile, LINC00460 knockdown elevated miR-613 expression in HT29 and LOVO cells. Our results suggested that LINC00460 was a target of miR-613 in CRC. To further verification whether LINC00460 could play oncogene roles in CRC by inhibiting miR-613 expression. Our results revealed that inhibitory effects on the number of cell proliferation, migration, invasion and increased cell apoptotic rates induced by LINC00460 knockdown were partially reversed by inhibiting miR-613 in the meantime. In brief, LINC00460 contributed to CRC progression by negatively regulating miR-613.
It is well known that the binding of miRNAs to lncRNAs could reduce miRNA levels, which leads to elevating miRNA target gene expression.25,26 SphK1 has been identified to be a target of miR‐613.16 To ascertain whether LINC00460 regulated SphK1 expression through competitively binding to miR‐613. qRT‐PCR and Western blot assays were performed. LINC00460 knockdown led to significant reduction of SphK1 mRNA and protein expression in both HT29 and LOVO cells, whereas miR-613 inhibitor reversed the trends. Meanwhile, LINC00460 was positively correlated with SphK1 expression in CRC tissues. Hence, we infer that LINC00460 modulated the SphK1 expression, at least in most part, by competitively binding to miR-613 in CRC.
However, this study has several limitations that should be addressed. The link between LINC00460 expression and the overall survival of CRC patients should be examined to further confirm the prognostic potential of LINC00460 in CRC. Localization of LINC00460 should be determined by immunohistochemistry to confirm the up-regulation of LINC00460 in CRC tissues. In addition, because LINC00460 and miR-613 have more than just one targeted gene, other potential targets of LINC00460 and miR-613 may be investigated in future studies.
Conclusion
This study first revealed that LINC00460 expression was elevated in CRC tissues and CRC cells. Meanwhile, the elevation of LINC00460 was positively correlated with clinicopathological features and poor prognosis of patients with CRC. Our data also indicated that the oncogene LINC00460 facilitated CRC progression through mostly part of modulating miR‐613/SphK1 axis. These results revealed that the LINC00460/miR‐613/SphK1 might identify as a new therapeutic target for CRC treatment.
Disclosure
The authors report no conflicts of interest for this work.
References
1. Siegel RL, Miller KD, Fedewa SA, et al. Colorectal cancer statistics, 2017. CA Cancer J Clin. 2017;67(3):177–193. doi:10.3322/caac.21395
2. Manfredi S, Lepage C, Hatem C, Coatmeur O, Faivre J, Bouvier AM. Epidemiology and management of liver metastases from colorectal cancer. Ann Surg. 2006;244(2):254–259. doi:10.1097/01.sla.0000217629.94941.cf
3. Landreau P, Drouillard A, Launoy G, et al. Incidence and survival in late liver metastases of colorectal cancer. J Gastroenterol Hepatol. 2015;30(1):82–85. doi:10.1111/jgh.12685
4. Delás MJ, Hannon GJ. lncRNAs in development and disease: from functions to mechanisms. Open Biol. 2017;7(7):170121. doi:10.1098/rsob.170121
5. Shi X, Sun M, Liu H, Yao Y, Song Y. Long non-coding RNAs: a new frontier in the study of human diseases. Cancer Lett. 2013;339(2):159–166. doi:10.1016/j.canlet.2013.06.013
6. Huang Q, Yan J, Agami R. Long non-coding RNAs in metastasis. Cancer Metast Rev. 2018;37(1):75–81. doi:10.1007/s10555-017-9713-x
7. Yu WD, Wang H, He QF, Xu Y, Wang XC. Long non-coding RNAs in cancer- immunity cycle. J Cell Physiol. 2018;233:6518–6523. doi:10.1002/jcp.26568
8. Cai J, Zuo X, Chen Z, et al. Long noncoding RNAs serve as potential diagnostic biomarkers for colorectal cancer. J Cancer. 2019;10(3):611–619. doi:10.7150/jca.28780
9. Shen B, Yuan Y, Zhang Y, et al. Long non-coding RNA FBXL19-AS1 plays oncogenic role in colorectal cancer by sponging miR-203. Biochem Biophys Res Commun. 2017;488(1):67–73. doi:10.1016/j.bbrc.2017.05.008
10. Li K, Sun D, Gou Q, et al. Long non-coding RNA linc00460 promotes epithelial- mesenchymal transition and cell migration in lung cancer cells. Cancer Lett. 2018;420:80–90. doi:10.1016/j.canlet.2018.01.060
11. Liang Y, Wu Y, Chen X, et al. A novel long noncoding RNA linc00460 up-regulated by CBP/P300 promotes carcinogenesis in esophageal squamous cell carcinoma. Biosci Rep. 2017;37(5). doi:10.1042/BSR20171019.
12. Kong YG, Cui M, Chen SM, Xu Y, Xu Y, Tao ZZ. LncRNA-LINC00460 facilitates nasopharyngeal carcinoma tumorigenesis through sponging miR-149-5p to up-regulate IL6. Gene. 2018;639:77–84. doi:10.1016/j.gene.2017.10.006
13. Cao W, Liu J, Liu Z, et al. A three-lncRNA signature derived from the Atlas of ncRNA in cancer (TANRIC) database predicts the survival of patients with head and neck squamous cell carcinoma. Oral Oncol. 2017;65:94–101. doi:10.1016/j.oraloncology.2016.12.017
14. Zhang Y, Liu X, Li Q, Zhang Y. lncRNA LINC00460 promoted colorectal cancer cells metastasis via miR-939-5p sponging. Cancer Manag Res. 2019;11:1779–1789. doi:10.2147/CMAR.S192452
15. Bayoumi AS, Sayed A, Broskova Z, et al. Crosstalk between long noncoding RNAs and microRNAs in health and disease. Int J Mol Sci. 2016;17(3):356. doi:10.3390/ijms17030356
16. Yu HF, Duan P, Zhu HB, Rao DP. miR-613 inhibits bladder cancer proliferation and migration through targeting SphK1. Am J Transl Res. 2017;9(3):1213–1221.
17. Wang Y, Zeng X, Wang N, et al. Long noncoding RNA DANCR, working as a competitive endogenous RNA, promotes ROCK1-mediated proliferation and metastasis via decoying of miR-335-5p and miR-1972 in osteosarcoma. Mol Cancer. 2018;17(1):89. doi:10.1186/s12943-018-0837-6
18. Cheng Z, Li Z, Ma K, et al. Long non-coding RNA XIST promotes glioma tumorigenicity and angiogenesis by acting as a molecular sponge of miR-429. J Cancer. 2017;8(19):4106–4116. doi:10.7150/jca.21024
19. Sun Y, Qin B. Long noncoding RNA MALAT1 regulates HDAC4-mediated proliferation and apoptosis via decoying of miR-140-5p in osteosarcoma cells. Cancer Med. 2018;7(9):4584–4597. doi:10.1002/cam4.1677
20. Thomson DW, Dinger ME. Endogenous microRNA sponges: evidence and controversy. Nat Rev Genet. 2016;17(5):272–283. doi:10.1038/nrg.2016.20
21. Sang Q, Liu X, Sun D. Role of miR-613 as a tumor suppressor in glioma cells by targeting SOX9. Onco Targets Ther. 2018;11:2429–2438. doi:10.2147/OTT.S156608
22. Jiang X, Wu J, Zhang Y, et al. MiR-613 functions as tumor suppressor in hepatocellular carcinoma by targeting YWHAZ. Gene. 2018;659:168–174. doi:10.1016/j.gene.2018.03.036
23. Xiong H, Yan T, Zhang W, et al. miR-613 inhibits cell migration and invasion by downregulating Daam1 in triple-negative breast cancer. Cell Signal. 2018;44:33–42. doi:10.1016/j.cellsig.2018.01.013
24. Li B, Xie Z, Li Z, Chen S, Li B. MicroRNA-613 targets FMNL2 and suppresses progression of colorectal cancer. Am J Transl Res. 2016;8(12):5475–5484.
25. Awan HM, Shah A, Rashid F, Shan G. Primate-specific long non-coding RNAs and microRNAs. Genomics Proteomics Bioinformatics. 2017;15(3):187–195. doi:10.1016/j.gpb.2017.04.002
26. Li LJ, Leng RX, Fan YG, Pan HF, Ye DQ. Translation of noncoding RNAs: focus on lncRNAs, pri-miRNAs, and circRNAs. Exp Cell Res. 2017;361(1):1–8. doi:10.1016/j.yexcr.2017.10.010
 © 2020 The Author(s). This work is published and licensed by Dove Medical Press Limited. The
full terms of this license are available at https://www.dovepress.com/terms
and incorporate the Creative Commons Attribution
- Non Commercial (unported, 3.0) License.
By accessing the work you hereby accept the Terms. Non-commercial uses of the work are permitted
without any further permission from Dove Medical Press Limited, provided the work is properly
attributed. For permission for commercial use of this work, please see paragraphs 4.2 and 5 of our Terms.
© 2020 The Author(s). This work is published and licensed by Dove Medical Press Limited. The
full terms of this license are available at https://www.dovepress.com/terms
and incorporate the Creative Commons Attribution
- Non Commercial (unported, 3.0) License.
By accessing the work you hereby accept the Terms. Non-commercial uses of the work are permitted
without any further permission from Dove Medical Press Limited, provided the work is properly
attributed. For permission for commercial use of this work, please see paragraphs 4.2 and 5 of our Terms.