Back to Journals » Cancer Management and Research » Volume 12
Long Noncoding RNA KCNMB2-AS1 Increases ROCK1 Expression by Sponging microRNA-374a-3p to Facilitate the Progression of Non–Small-Cell Lung Cancer
Authors Yang H, Wang Z, Wang Z
Received 3 July 2020
Accepted for publication 10 November 2020
Published 11 December 2020 Volume 2020:12 Pages 12679—12695
DOI https://doi.org/10.2147/CMAR.S270646
Checked for plagiarism Yes
Review by Single anonymous peer review
Peer reviewer comments 2
Editor who approved publication: Dr Ahmet Emre Eşkazan
This paper has been retracted.
Haitao Yang, 1,* Ziyi Wang, 2,* Zhenyuan Wang 1
1Department of Thoracic Surgery, The People’s Hospital of Liaoning Province, Liaoning 110015, People’s Republic of China; 2Department of Thoracic Surgery, The Tenth People’s Hospital of Shenyang, Liaoning 110044, People’s Republic of China
*These authors contributed equally to this work
Correspondence: Zhenyuan Wang
Department of Thoracic Surgery, The People’s Hospital of Liaoning Province, 33 Wenyi Road, Shenyang, Liaoning 110015, People’s Republic of China
Email [email protected]
Purpose: The expression and roles of most long noncoding RNAs (lncRNAs) in non–small-cell lung cancer (NSCLC) remain poorly understood. Thus, this study investigated KCNMB2 antisense RNA 1 (KCNMB2-AS1) expression in NSCLC and determined the roles and mechanisms of KCNMB2-AS1 in regulating NSCLC progression.
Methods: KCNMB2-AS1 expression in NSCLC tissues and cells was detected using reverse transcription-quantitative polymerase chain reaction. Cell proliferation, apoptosis, migration, and invasion were evaluated using Cell Counting Kit-8, flow cytometry, Transwell migration, and Transwell invasion assays, respectively. In vivo tumor xenograft models were constructed to assess tumorigenicity. Bioinformatics predictions were performed to identify microRNAs targeting KCNMB2-AS1. Interactions between KCNMB2-AS1 and miR-374a-3p were analyzed using RNA immunoprecipitation, luciferase reporter, and rescue experiments.
Results: KCNMB2-AS1 levels were increased in NSCLC tissues and cells. KCNMB2-AS1 silencing hindered NSCLC cell proliferation, migration, and invasion and promoted apoptosis in vitro. Additionally, KCNMB2-AS1 knockdown decreased tumor growth in vivo. Mechanistically, KCNMB2-AS1 functioned as an endogenous miR-374a-3p sponge and increased ρ-associated coiled-coil–containing protein kinase 1 (ROCK1) expression. Furthermore, increased miR-374a-3p/ROCK1 output attenuated KCNMB2-AS1 silencing-induced inhibition of NSCLC progression.
Conclusion: The KCNMB2-AS1/miR-374a-3p/ROCK1 pathway drives NSCLC progression, suggesting that this pathway can be targeted to reduce NSCLC progression.
Keywords: KCNMB2 antisense RNA 1, long noncoding RNA, ceRNA theory
Expression of Concern for this paper has been published
Introduction
Lung cancer is the most frequent cancer and the leading cause of cancer-associated mortality worldwide.1 Every year, 2.1 million new cases of lung cancer are diagnosed, and 1.8 million patients die from the disease globally.1 Approximately 80%–85% of the newly diagnosed lung cancer cases are non–small-cell lung cancer (NSCLC), which includes adenocarcinoma, squamous cell carcinoma, adenosquamous cell carcinoma, and large cell carcinoma.2 The clinical efficacy of NSCLC therapies remains dismal despite great efforts made in the development of diagnostic methods and treatment options in recent decades.3 The 1-year survival rate of patients with NSCLC is 30%, and the 5-year survival rate is only 8%.4 The primary reasons contributing to poor prognosis are uncontrolled tumor growth, high degree of malignancy, and high incidence of recurrence and metastasis.5 Furthermore, NSCLC has no typical early symptoms; thus, approximately 57% of NSCLC cases are diagnosed at advanced stages, which is another major cause of treatment failure.6 Therefore, elucidating the mechanisms responsible for NSCLC carcinogenesis and progression is urgently needed to improve therapeutic regimens and diagnostic techniques.
Long noncoding RNAs (lncRNAs) are a group of transcripts with lengths of over 200 nucleotides.7 Because most lncRNAs do not encode proteins, they were originally considered to be genomic transcriptional noise.8 In recent years, an increasing number of studies have shown that lncRNAs perform crucial functions in numerous cellular biological processes and are closely related to most human diseases, including cancer.9,10 lncRNAs have emerged as novel master regulators of tumorigenesis and tumor development by controlling gene expression at epigenetic, transcriptional, and post-transcriptional levels.11,12 Consistently, several studies have revealed the differential expression of lncRNAs in NSCLC, and dysregulation of lncRNAs in NSCLC contributes to cancer oncogenesis.13–15 lncRNAs may play pro-oncogenic and anti-oncogenic roles and be implicated in the regulation of multiple aggressive processes.15–17
MicroRNAs (miRNAs) are defined as noncoding RNA molecules with lengths of approximately 17–24 nucleotides. They play critical roles in diverse physiological and pathological processes by directly binding to the 3ʹ-untranslated region (3ʹ-UTR) of target genes, thereby triggering mRNA degradation and/or suppressing translation.18 Recently, an increasing number of studies have focused on the interactions between lncRNAs and miRNAs and their importance in cancer genesis and progression.19,20 A competing endogenous RNA (ceRNA) regulatory network was proposed and validated that lncRNAs can serve as ceRNAs by sponging certain miRNAs and consequently regulating the expression of cancer-related target genes.21 Hence, identifying the lncRNAs and miRNAs related to the development and progression of NSCLC and elucidating their detailed roles in NSCLC progression are of great significance for the development of promising strategies for cancer diagnosis and therapy.
This work aimed to examine the expression pattern of KCNMB2-AS1 in NSCLC and explore the functions of KCNMB2-AS1 in the regulation of NSCLC oncogenicity. In addition, the mechanisms by which KCNMB2-AS1affects the aggressive behavior of NSCLC cells were fully elucidated. Our results may offer new insight to improve the understanding of NSCLC pathogenesis and develop effective therapeutic techniques.
Materials and Methods
Tissue Specimens and Cell Lines
Sixty-one pairs of NSCLC tissues and adjacent non-tumor lung tissues were obtained from The People’s Hospital of Liaoning Provincial. No patients had undergone preoperative chemotherapy, radiotherapy, or other antitumor therapeutic regimens. All the clinicopathological information of 61 NSCLC patients was presented in Table 1. All tissue samples were snap-frozen and immersed in liquid nitrogen. All tissues were obtained following informed consent by the participants, and this study was approved by the Ethics Committee of The People’s Hospital of Liaoning Provincial (2017–1008).
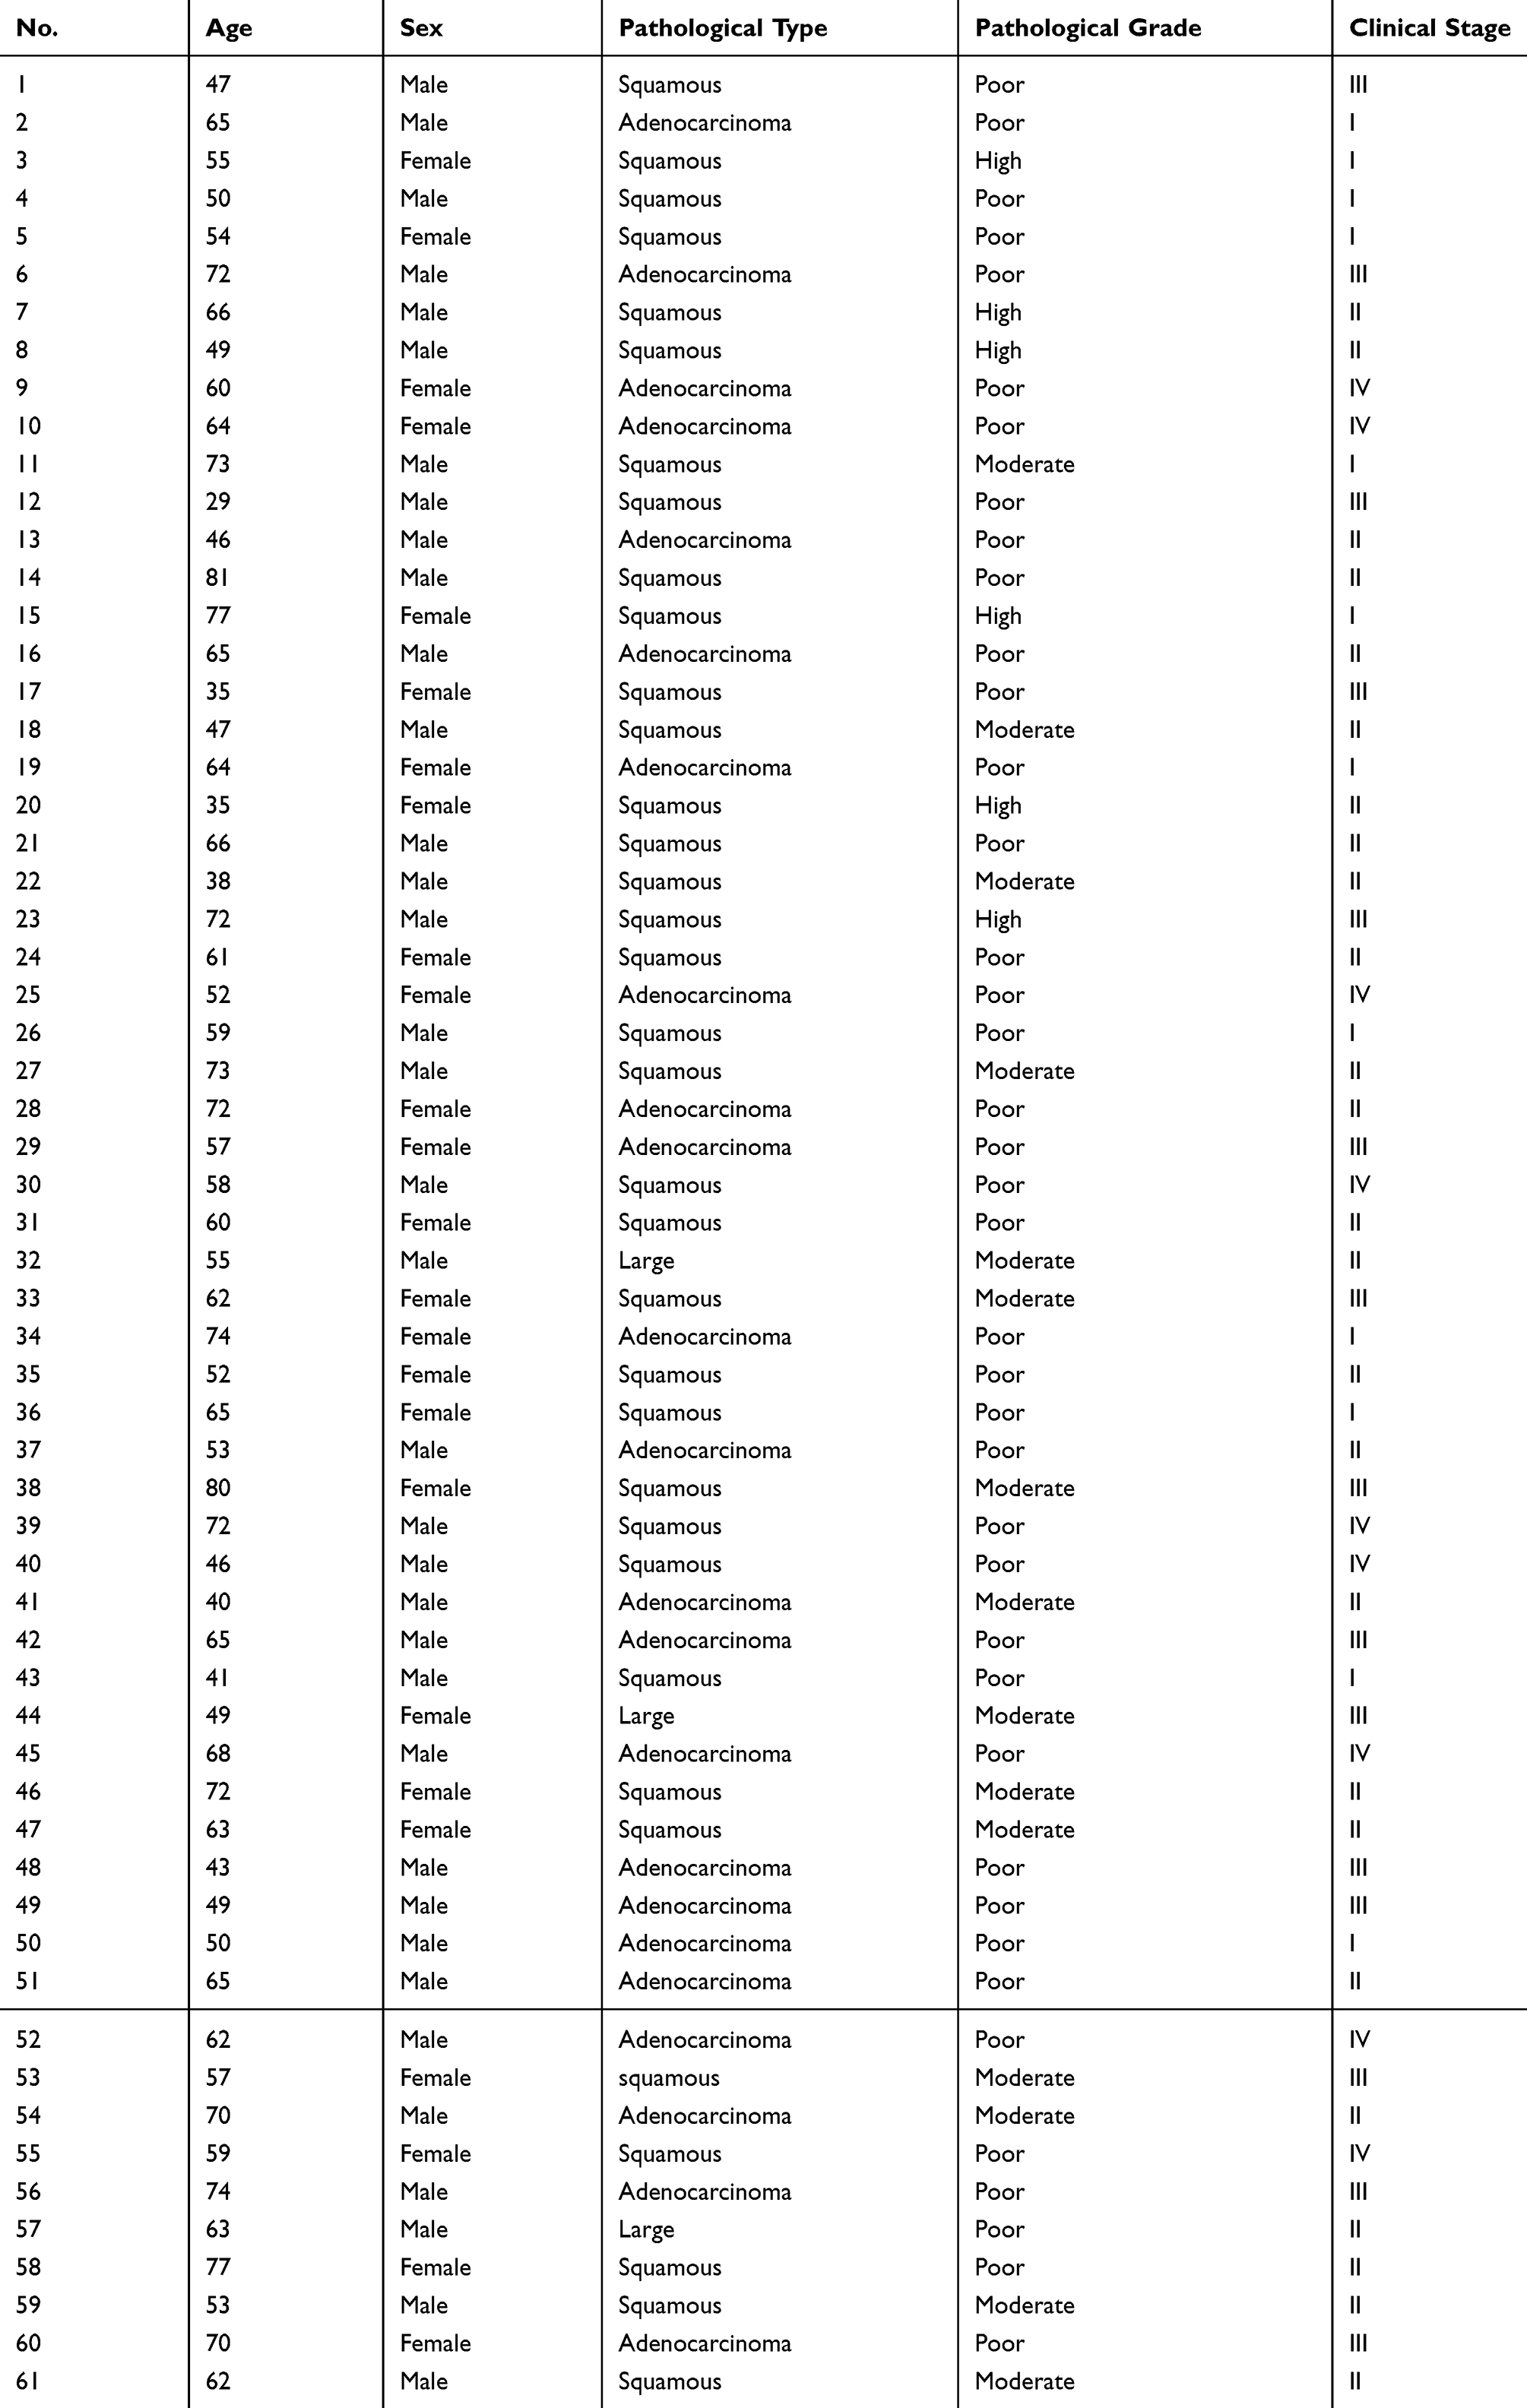 |
Table 1 The Clinicopathological Information of 61 NSCLC Patients |
The NSCLC cell lines A549 and SK-MES-1 were purchased from the Shanghai Institute for Biological Sciences, Chinese Academy of Sciences (Shanghai, China). A549 cells were cultured in F-12K medium supplemented with 10% heat-inactivated fetal bovine serum (FBS) and 1% Glutamax (all from Gibco; Thermo Fisher Scientific, Inc., Waltham, MA, USA). MEM medium (Gibco; Thermo Fisher Scientific, Inc.,) containing 10% FBS was used to culture SK-MES-1 cells. The human nontumorigenic bronchial epithelial cell line BEAS-2B and two NSCLC cell lines (H522 and H460) were obtained from American Type Culture Collection (Manassas, VA, USA). BEAS-2B cells were grown in Bronchial Epithelial Cell Growth Medium (Lonza/Clonetics Corporation, Walkersville, MD, USA), whereas H522 and H460 cells were maintained in RPMI 1640 medium (Gibco; Thermo Fisher Scientific, Inc.) supplemented with 10% FBS. A 1% mixture of penicillin–streptomycin was added in all culture media.
Cell Transfection
Small interfering RNAs (siRNAs) for KCNMB2-AS1 (si-KCNMB2-AS1) and negative control (NC) siRNAs (si-NC) were designed and synthesized by GenePharma Co., Ltd. (Shanghai, China). The si-KCNMB2-AS1#1 sequence was 5ʹ-AACTTTTTATTAGATATCAAAGA-3ʹ; si-KCNMB2-AS1#2 sequence was 5ʹ-ATGAAGATATCTAAAAACAAAGA-3ʹ; si-KCNMB2-AS1#3 sequence was 5ʹ-CTGGATTTCTTGTGAAGAAAACT-3ʹ; and the si-NC sequence was 5ʹ-CACGATAAGACAATGTATTT-3ʹ. An overexpression vector (pcDNA3.1/+) harboring human ρ-associated coiled-coil–containing protein kinase 1 (pcDNA3.1-ROCK1) and empty pcDNA3.1 plasmid were also synthesized by GenePharma Co., Ltd. miR-374a-3p mimic, miR-negative control (miR-NC), miR-374a-3p inhibitor, and NC inhibitor were obtained from RiboBio Co., Ltd. (Guangzhou, China). Cells were seeded into 6-well plates, and Lipofectamine 2000 (Invitrogen, Carlsbad, CA, USA) was used for oligonucleotide and plasmid transfections.
RNA Extraction and Reverse Transcription-Quantitative Polymerase Chain Reaction (RT-qPCR)
Total RNA extraction was conducted using TRIzol reagent (Beyotime Biotechnology; Shanghai, China). The concentration of total RNA was determined using a NanoDropND-1000 spectrophotometer (Invitrogen; Thermo Fisher Scientific, Inc.). To analyze KCNMB2-AS1 and ROCK1 expression, the PrimeScript reagent kit with gDNA Eraser (TaKaRa, Dalian, China) was used to reverse-transcribe total RNA into cDNA. The cDNA was subjected to qPCR using a PrimeScript™ RT Master Mix (TaKaRa). Glycerol 3-phosphate dehydrogenase (GAPDH) functioned as a reference gene for KCNMB2-AS1 and ROCK1.
To quantify miRNAs expression, reverse transcription was performed using a Mir-X miRNA First-Strand Synthesis Kit (TaKaRa), and the Mir-X miRNA qRT-PCR TB Green® Kit (TaKaRa) was used for qPCR. miRNA expression was normalized to U6 small nuclear RNA expression. The 2–ΔΔCt method was used to analyze relative gene expression.
The primers were designed as follows: KCNMB2-AS1, 5′-GCAGTTTGATCTCAGACTGCTGTG −3′ (forward) and 5′-TTTATTTCCTGTAGTCTCAGCTACTCAG-3′ (reverse); ROCK1, 5′-CTGGGGACAGTTTTGAGACTCG −3′ (forward) and 5′-GTCTTTATATCTGCTTAAAAAGTTGTCAA-3′ (reverse); GAPDH, 5′-CGGAGTCAACGGATTTGGTCGTAT-3′ (forward) and 5′-AGCCTTCTCCATGGTGGTGAAGAC-3′ (reverse); miR-374a-3p, 5′-TCGGCAGGUUAAUGUUAUGUUAG −3′ (forward) and 5′-CACTCAACTGGTGTCGTGGA −3′ (reverse); miR-676-3p, 5′-TCGGCAGGUUGAGUUGUUGGAA −3′ (forward) and 5′-CACTCAACTGGTGTCGTGGA −3′ (reverse); miR-3194-3p, 5′-TCGGCAGGUGACGGUCACUCGU-3′ (forward) and 5′-CACTCAACTGGTGTCGTGGA-3′ (reverse); miR-122-5p, 5′-TCGGCAGGUGGAGUGUGACAAUG-3′ (forward) and 5′-CACTCAACTGGTGTCGTGGA-3′ (reverse); and U6, 5′-GCTTCGGCAGCACATATACTAAAAT-3′ (forward) and 5′-CGCTTCACGAATTTGCGTGTCAT-3′ (reverse).
Nuclear and Cytoplasmic Fractionation
A PARIS™ Kit (Invitrogen, CA, USA) was used for the separation of nuclear and cytoplasmic fractions. After RNA extraction, RT-qPCR was performed to determine the distribution of KCNMB2-AS1 in NSCLC cells.
Cell Counting Kit (CCK)-8 Assay
Transfected cells were collected after 24 h and seeded into 96-well plates. Each well contained 100 µL of cell suspension containing 3000 cells. Cell proliferation was quantitatively detected for 3 consecutive days by incubating cells with 10 µL of CCK-8 reagent (Beyotime Biotechnology). Following incubation for 2 h at 37°C, the absorbance at a wavelength of 450 nm was measured using a SUNRISE Microplate Reader (Tecan Group, Ltd., Mannedorf, Switzerland).
Flow Cytometry Analysis
The apoptosis rate was determined using an Annexin V-Fluorescein Isothiocyanate (FITC) Apoptosis Detection Kit (BioLegend, San Diego, CA, USA). Transfected cells were harvested using trypsin, rinsed with pre-cooled phosphate-buffered saline, and resuspended in 100 μL of 1X binding buffer. Before incubation at room temperature for 15 min in the dark, 5 μL each of PI and Annexin V-FITC was added to the cell suspension. The stained cells were analyzed using a BD FACSCalibur cytometer (BD Biosciences), and CellQuest software (BD Biosciences) was used to analyze all data.
Transwell Cell Migration and Invasion Assays
Transfected cells were collected at 48 h after transfection, and single-cell suspensions were generated using FBS-free culture medium. The 24-well plates with 8-μm Transwell inserts (Millipore, Billerica, MA, USA) were used in migration assays. For invasion assays, the Transwell inserts were precoated with Matrigel (BD Biosciences, San Jose, CA, USA), and the remaining experimental procedures were the same as those used for the migration assays. In brief, 100 μL of cell suspension containing 5 × 10⁴ cells was added into the upper compartments. The lower compartments were loaded with 600 ul of culture medium supplemented with 20% FBS, which was used to induce cell migration or invasion. After 24 h, the non-migrated and non-invaded cells remaining on the upper side of the Transwell inserts were removed with a cotton bud, and the migrated and invaded cells were fixed with 4% polyformaldehyde and stained with 0.1% crystal violet. Finally, the migrated and invaded cells were imaged using an inverted microscope (x200 magnification; Olympus Corporation, Tokyo, Japan), and the number of cells was counted in six randomly selected visual fields.
In vivo Tumor Xenograft Model
A short-hairpin RNA (shRNA) targeting KCNMB2-AS1 (sh-KCNMB2-AS1) and negative control shRNA (sh-NC) were designed and constructed by GenePharma Co., Ltd. sh-KCNMB2-AS1 and sh-NC lentiviruses were packaged and collected from 293 T cells and then used to infect H460 cells. H460 cells stably transfected with sh-KCNMB2-AS1 or sh-NC were selected by incubation with puromycin. The sh-KCNMB2-AS1 sequence was 5ʹ-CCGGAACTTTTTATTAGATATCAAAGACTCGAGTCTTTGATATCTAATAAAAAGTTTTTTTG-3ʹ; and the sh-NC sequence was 5ʹ-CCGGCACGATAAGACAATGTATTTCTCGAGAAATACATTGTCTTATCGTGTTTTTG-3ʹ.
All animal experiments were performed with the approval of the Animal Care and Ethics Committee of The People’s Hospital of Liaoning Provincial (2019–0214) and in accordance with the NIH guidelines for the care and use of laboratory animals. BALB/c nude mice aged less than 4–6 weeks were acquired from Shanghai SLAC Laboratory Animal Co., Ltd. (Shanghai, China) and subcutaneously injected with 2 × 10⁶ H460 cells stably transfected with sh-KCNMB2-AS1 or sh-NC. Each group contained three nude mice. The longest and shortest diameters of tumor xenografts were recorded weekly using calipers, and tumor volumes were determined with the equation volume = 0.5 × length × width2. All mice were euthanized 28 days after cell injection, and tumor xenografts were harvested for further studies.
Hematoxylin and Eosin (HE) Staining and Immunohistochemistry
Tumor xenografts were made into 4μm sections and embedded with paraffin, followed by staining with hematoxylin and eosin. The histological assessment was implemented employing an inverted light microscope (Olympus Corporation).
The 4μm sections of tumor xenografts were prepared, and incubated with Ki-67 (ab15580; Abcam) and cleavedcaspase-3 (ab2302; Abcam) primary antibodies. After overnight incubation at 4 °C, the secondary antibody (ab205718; Abcam) was used to treat the sections at room temperature for 1 h. after which were dyed with the 3,3-diaminobenzidine tetrahydrochloride. At last, the mild restaining with hematoxylin, dehydration, coverslipping, and microscopic examination were executed.
Bioinformatics Analysis
The potential miRNAs targeting KCNMB2-AS1 were predicted using StarBase version 3.0 (http://starbase.sysu.edu.cn/). TargetScan (http://www.targetscan.org/) and miRDB (http://mirdb.org/) were used to identify the candidate target genes of miR-374a-3p. After inputting the key words KCNMB2-AS1 or miR-374a-3p, their targets will be presented.
RNA Immunoprecipitation (RIP) Assay
RIP assays were performed to explore the interaction between KCNMB2-AS1 and miR-374a-3p in NSCLC cells using the Magna RIP RNA-Binding Protein Immunoprecipitation Kit (Millipore, Billerica, MA, USA). NSCLC cells were grown to approximately 90% confluence and then lysed using RIP lysis buffer. The harvested cell lysates were incubated with RIP immunoprecipitation buffer containing magnetic beads coated with human antibody against Ago2 (Millipore) or negative control IgG (Millipore). Following overnight cultivation at 4°C, the magnetic beads were washed, and the protein was digested by incubation with proteinase K. The immunoprecipitated RNA was then extracted, followed by the determination of KCNMB2-AS1 and miR-374a-3p enrichment using RT-qPCR.
Luciferase Reporter Assay
The wild-type fragments of KCNMB2-AS1 (111679–112253 nt) and ROCK1 3ʹ-UTR (0–356 nt) containing miR-374a-3p binding sites were amplified and inserted into the pmirGlO Dual-luciferase miRNA Target Expression Vector (Promega, Madison, WI, USA). The synthesized luciferase reporter plasmids were named KCNMB2-AS1-wt and ROCK1-wt. The primers were designed as follows: KCNMB2-AS1-wt, 5′-CCGCTCGAG ATCCTCATTGTTAACGATGAAGAAAC −3′ (forward) and 5′-GCTCTAGA TTCCATCCATCATTCATTCTTGCCG −3′ (reverse); and ROCK1-wt, 5′-CCGCTCGAG CCATGTGACTGAGTGCCCTGT-3′ (forward) and 5′-GCTCTAGAGGCATTTTCTTATAAATCCAAAAAG-3′ (reverse). The mutant luciferase reporter plasmids were produced by replacing the wild-type sequences with mutant sequences, and the resulting reporter plasmids were referred to as KCNMB2-AS1-mut and ROCK1-mut. The primers were designed as follows: KCNMB2-AS1-mut, 5′-CCGCTCGAGATCCTCATTGTTAACGATGAAGAAAC −3′ (forward) and 5′- GCTCTAGATTCCATCCATCATTCATTCTTGCCG −3′ (reverse); and ROCK1-mut, 5′-CCGCTCGAG CCATGTGACTGAGTGCCCTGT −3′ (forward) and 5′- GCTCTAGAGGCATTTTCTTATAAATCCAAAAAG −3′ (reverse). Lipofectamine 2000 was used to cotransfect wild-type or mutant reporter plasmids and miR-374a-3p mimic or miR-NC. Following incubation for 48 h, the dual-luciferase reporter assay system (Promega) was used to measure luciferase activity.
Western Blotting
Total protein was isolated from cultured cells using RIPA lysis buffer (Beyotime Biotechnology). A Detergent Compatible Bradford Protein Assay Kit (Beyotime Biotechnology) was used to quantify total proteins. Equal amounts of proteins were separated by 10% sodium dodecyl sulfate–polyacrylamide gel electrophoresis and transferred to polyvinylidene fluoride membranes. The membranes were blocked using 5% dried skimmed milk powder diluted in TBS with Tween-20 at room temperature for 2 h. Rabbit anti-human ROCK1 (ab45171) and rabbit anti-human GAPDH (ab181602) antibodies were obtained from Abcam (Cambridge, UK) and incubated with the membranes at 4°C. All primary antibodies were used at a dilution of 1:1,000. The following day, the membranes were washed three times with TBS containing Tween-20 and incubated with horseradish peroxidase (HRP)-conjugated anti-rabbit IgG secondary antibody (ab205718; Abcam). Immunoblots were detected using the Immobilon Western Chemiluminescent HRP Substrate (Millipore).
Statistical Analysis
Each experiment included three biological replicates, and the obtained results were presented as the mean ± standard deviation. All statistical tests justified as appropriate and the data meet the assumptions of the tests. In in vivo study, all data conforms to the normal distribution. Comparisons between two groups were performed using Student’s t-test. Multiple comparisons were conducted using one-way analysis of variance together with Dunnett’s post hoc test. Pearson correlation analysis was used to assess the correlation between KCNMB2-AS1 and miR-374a-3p expression levels. A P-value of <0.05 was considered statistically significant.
Results
The lncRNA KCNMB2-AS1 Executes Oncogenic Actions in NSCLC
Gene expression profiling interactive analysis (GEPIA; http://gepia.cancer-pku.cn/) was used to examine the expression pattern of lncRNAs in TCGA and GTEx databases and identify lncRNAs associated with NSCLC. KCNMB2-AS1was found to be significantly upregulated in lung adenocarcinoma and lung squamous cell carcinoma tissues compared with that in normal tissues (Figure 1A). To verify this observation, 61 pairs of NSCLC tissues and adjacent non-tumor lung tissues were collected and analyzed using RT-qPCR for the detection of KCNMB2-AS1 expression. Significantly elevated KCNMB2-AS1 expression was verified in NSCLC tissues relative to that in adjacent non-tumor lung tissues (Figure 1B). In addition, KCNMB2-AS1expression was analyzed in four NSCLC cell lines: A549, SK-MES-1, H522, and H460. RT-qPCR analysis results indicated that KCNMB2-AS1 expression was higher in all four NSCLC cell lines than that in BEAS-2B cells (Figure 1C). We then examined the correlation between KCNMB2-AS1 and clinicopathological factors in patients with NSCLC. As exhibited in Table 2, a high KCNMB2-AS1 expression was closely related with the lymph node metastasis, but manifested none association with gender, age, tumor size, differentiation or TNM stage. GEPIA was also used to evaluate the clinical value of KCNMB2-AS1 expression in NSCLC. The analysis showed no obvious correlation between KCNMB2-AS1 expression and tumor stage (Figure 1D), overall survival (Figure 1E), or disease-free survival (Figure 1F) in NSCLC. We also analyzed the clinical samples collected by ourselves as validation to determine the correlation between KCNMB2-AS1 and the prognosis of the patients with NSCLC. The data depicted that KCNMB2-AS1 expression was not related with overall survival (Figure 1G), or disease-free survival (Figure 1H) in NSCLC.
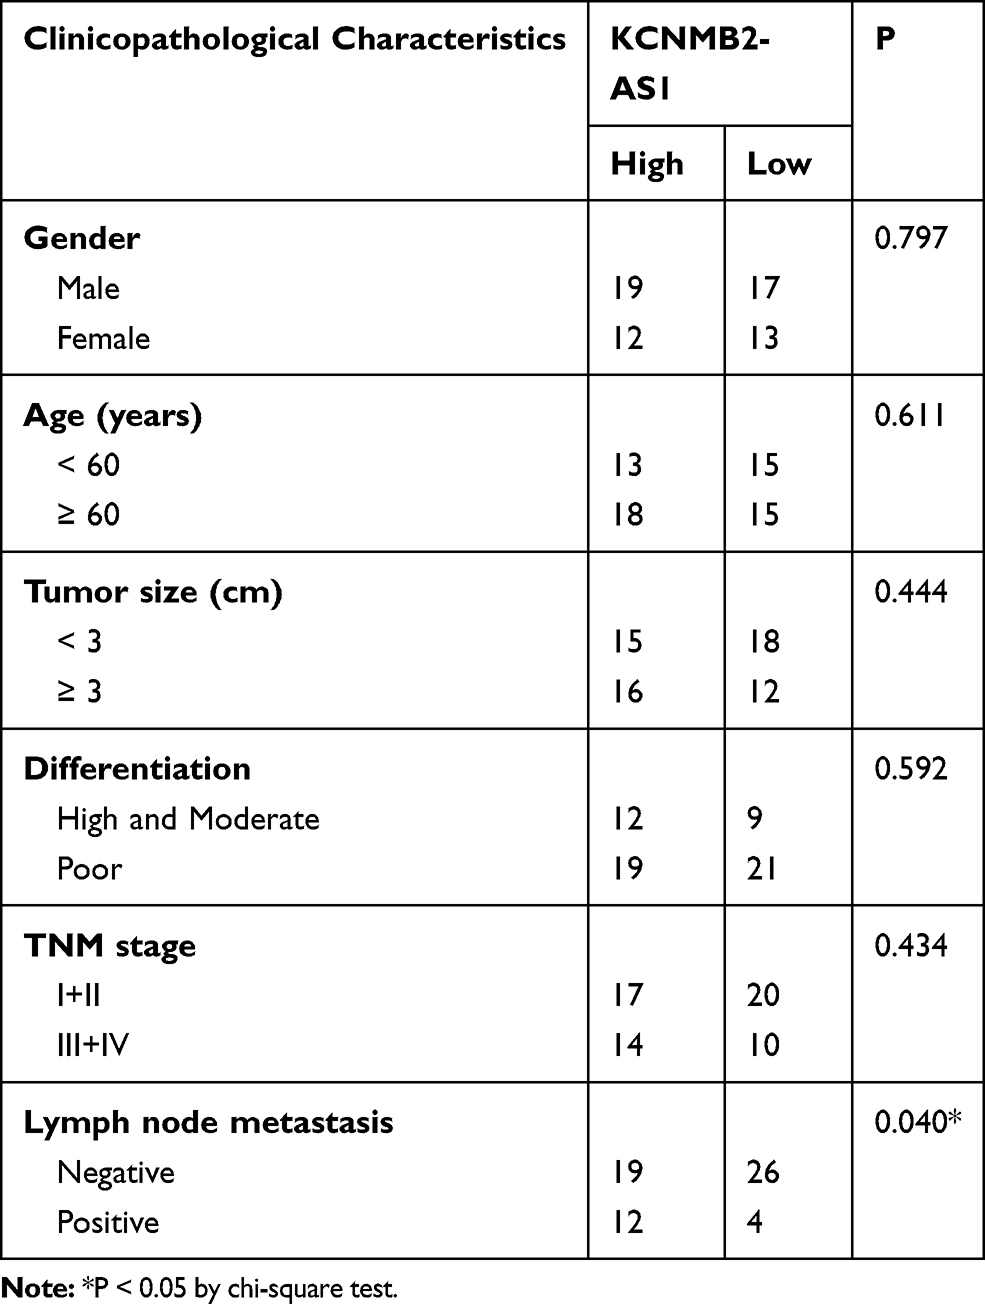 |
Table 2 The Correlations Between KCNMB2-AS1 and Clinicopathological Characteristics in NSCLC |
 |
Figure 1 KCNMB2-AS1 is upregulated in NSCLC. (A) KCNMB2-AS1 expression in lung adenocarcinoma and lung squamous cell carcinoma was analyzed using GEPIA. (B) The relative expression level of KCNMB2-AS1 was detected in 61 pairs of NSCLC tissues and adjacent non-tumor lung tissues using RT-qPCR. (C) RT-qPCR was conducted to determine KCNMB2-AS1 expression in four NSCLC cell lines (A549, SK-MES-1, H522, and H460), with the human nontumorigenic bronchial epithelial cell line BEAS-2B as the control. (D–F) GEPIA was used to determine the correlation between KCNMB2-AS1 expression and tumor stage, overall survival, and disease-free survival in patients with NSCLC. (G, H) The correlation between KCNMB2-AS1 expression and overall survival, or disease-free survival in the 61 NSCLC patients was examined. **P < 0.01. |
To test the biological functions of KCNMB2-AS1 in NSCLC, KCNMB2-AS1expression was silenced in H460 and SK-MES-1 cells using siRNAs. si-KCNMB2-AS1#1 and si-KCNMB2-AS1#3 were used in the following experiments because they exhibited the highest silencing efficiency among the three siRNAs (Figure 2A). The CCK-8 assay results revealed that the proliferation of H460 and SK-MES-1 cells was evidently reduced after KCNMB2-AS1 knockdown (Figure 2B). In addition, flow cytometry analysis was used to detect cell apoptosis, and the results demonstrated that KCNMB2-AS1 deficiency notably increased the apoptosis rate of H460 and SK-MES-1 cells (Figure 2C). Furthermore, Transwell cell migration and invasion assays were performed to examine whether KCNMB2-AS1 affects cell migration and invasion in NSCLC. As shown in Figure 2D and E, the migration and invasion abilities of cells in the si-KCNMB2-AS1 group were clearly impaired compared with those of cells in the si-NC group. Collectively, these results suggest that KCNMB2-AS1 is upregulated in NSCLC and exerts tumor-promoting actions during NSCLC progression.
 |
Figure 2 Downregulation of KCNMB2-AS1 expression suppressed NSCLC cell proliferation, migration, and invasion and facilitated cell apoptosis. (A) Three different siRNAs were constructed to silence KCNMB2-AS1 expression in H460 and SK-MES-1 cells. (B) The proliferative ability of H460 and SK-MES-1 cells was assessed using CCK-8 assay after si-KCNMB2-AS1 or si-NC transfection. (C) Flow cytometry analysis was performed to assess apoptosis of H460 and SK-MES-1 cells after transfection with si-KCNMB2-AS1 or si-NC. (D, E) Migration and invasion abilities were measured using Transwell cell migration and invasion assays (x200 magnification) in H460 and SK-MES-1 cells with or without KCNMB2-AS1 knockdown. *P < 0.05 and **P < 0.01. |
KCNMB2-AS1 is a Molecular Sponge for miR-374a-3p in NSCLC Cells
To clarify how KCNMB2-AS1 contributes to the malignancy of NSCLC, the subcellular localization of KCNMB2-AS1 was predicted using lncLocator (http://www.csbio.sjtu.edu.cn/bioinf/lncLocator/). KCNMB2-AS1 was predicted to be mainly localized in the cytoplasm (Figure 3A). Nuclear/cytoplasmic fractionation followed by RT-qPCR analysis further confirmed this prediction (Figure 3B), suggesting that KCNMB2-AS1 may serve as a ceRNA for specific miRNAs. Bioinformatics prediction was conducted to identify miRNAs with complementary base pairing to KCNMB2-AS1. In total, four miRNAs, including miR-676-3p, miR-3194-3p, miR-374a-3p, and miR-122-5p, were predicted to have relevant binding sites in KCNMB2-AS1.
 |
Figure 3 KCNMB2-AS1 serves as a ceRNA and sponges miR-374a-3p in NSCLC cells. (A) The subcellular localization of KCNMB2-AS1 predicted by lncLocator. (B) Nuclear/cytoplasmic fractionation and RT-qPCR analysis were used to evaluate the distribution of KCNMB2-AS1 in H460 and SK-MES-1 cells. (C) RT-qPCR analysis was performed to detect miR-676-3p, miR-3194-3p, miR-374a-3p, and miR-122-5p expression in KCNMB2-AS1-silenced H460 and SK-MES-1 cells. (D) miR-374a-3p expression in 61 pairs of NSCLC tissues and adjacent non-tumor lung tissues was measured using RT-qPCR. (E) Pearson correlation analysis of KCNMB2-AS1 and miR-374a-3p expression in NSCLC tissues. (F) The wild-type and mutant miR-374a-3p binding sites within the sequences of KCNMB2-AS1. (G) Luciferase reporter assays were conducted to measure the luciferase activity in H460 and SK-MES-1 cells after cotransfection with miR-374a-3p mimic or miR-NC and KCNMB2-AS1-wt or KCNMB2-AS1-mut. (H) The degree of KCNMB2-AS1 and miR-374a-3p enrichment by the Ago2 antibody in H460 and SK-MES-1 cells was examined using RIP assays. (I) Expression of KCNMB2-AS1 was detected in H460 and SK-MES-1 cells after miR-374a-3p overexpression using RT-qPCR. **P < 0.01. |
RT-qPCR was conducted to detect putative miRNA candidates of KCNMB2-AS1 in H460 and SK-MES-1 cells following KCNMB2-AS1 silencing. Downregulation of KCNMB2-AS1 expression led to increased levels of miR-374a-3p in H460 and SK-MES-1 cells, whereas the expression of the other three miRNAs was unaffected by si-KCNMB2-AS1 introduction (Figure 3C). Furthermore, miR-374a-3p was weakly expressed in NSCLC tissues (Figure 3D) and exhibited a negative correlation with KCNMB2-AS1 expression (Figure 3E; r = −0.6957, P < 0.0001).
A luciferase reporter assay was performed for target investigation. Luciferase reporter plasmids KCNMB2-AS1-wt and KCNMB2-AS1-mut harboring wild-type and mutant miR-374a-3p binding sites (Figure 3F) were constructed and cotransfected with miR-374a-3p mimic or miR-NC into H460 and SK-MES-1 cells. The luciferase activity of KCNMB2-AS1-wt was inhibited by miR-374a-3p upregulation in H460 and SK-MES-1 cells. However, miR-374a-3p mimic had no impact on the luciferase activity of KCNMB2-AS1-mut (Figure 3G). Moreover, miR-374a-3p and KCNMB2-AS1 were dramatically enriched by the Ago2 antibody in H460 and SK-MES-1 cells, suggesting the potential endogenous direct interaction between miR-374a-3p and KCNMB2-AS1 (Figure 3H). To explore whether miR-374a-3p can affect KCNMB2-AS1expression, the relative expression of KCNMB2-AS1 was detected in NSCLC cells after activating miR-374a-3p. The results were shown that transfection with miR-374a-3p mimic did not alter the expression of KCNMB2-AS1 in H460 and SK-MES-1 cells (Figure 3I). Collectively, these results suggest that KCNMB2-AS1 competitively sponges miR-374a-3p in NSCLC cells.
ROCK1 Expression is Positively Regulated by KCNMB2-AS1 via miR-374a-3p in NSCLC Cells
We next examined in detail the roles of miR-374a-3p in NSCLC cells. miR-374a-3p mimic or miR-NC was transfected into H460 and SK-MES-1 cells, and the RT-qPCR results confirmed the substantial overexpression of miR-374a-3p in miR-374a-3p mimic-transfected cells (Figure 4A). Transfection with miR-374a-3p mimic caused a clear reduction of H460 and SK-MES-1 cell proliferation, as demonstrated by the CCK-8 assay results (Figure 4B). Flow cytometry analysis further revealed that exogenous miR-374a-3p expression promoted the apoptosis of H460 and SK-MES-1 cells (Figure 4C). Furthermore, the migration (Figure 4D) and invasion (Figure 4E) abilities of H460 and SK-MES-1 cells were evidently suppressed by miR-374a-3p overexpression.
 |
Figure 4 miR-374a-3p overexpression inhibits NSCLC cell proliferation, migration, invasion but induces cell apoptosis. (A) RT-qPCR was used to determine the expression levels of miR-374a-3p in H460 and SK-MES-1 cells after the introduction of miR-374a-3p mimic or miR-NC. (B, C) CCK-8 assays and flow cytometry analyses were used to determine the effects of miR-374a-3p upregulation on the proliferation and apoptosis of H460 and SK-MES-1 cells, respectively. (D, E) Transwell cell migration and invasion assays were performed to explore the migration and invasion abilities of H460 and SK-MES-1 cells transfected with miR-374a-3p mimic or miR-NC (x200 magnification). **P < 0.01. |
The bioinformatics tools miRDB and TargetScan were used to identify the putative targets of miR-374a-3p. miR-374a-3p was predicted to interact with ROCK1 via complementary sequences (Figure 5A), and because of its critical roles in NSCLC tumorigenesis, ROCK1 was selected for further investigation. A luciferase reporter assay was conducted to determine whether ROCK1 was a functional target of miR-374a-3p. Ectopic miR-374a-3p expression significantly decreased the luciferase activity of ROCK1-wt in H460 and SK-MES-1 cells, whereas the luciferase activity of ROCK1-mut was unchanged following miR-374a-3p mimic transfection (Figure 5B). To further evaluate the potential interaction between miR-374a-3p and ROCK1, ROCK1 expression was detected in miR-374a-3p mimic-transfected or miR-NC-transfected H460 and SK-MES-1 cells. RT-qPCR and Western blotting results showed that miR-374a-3p upregulation obviously downregulated ROCK1 mRNA (Figure 5C) and protein (Figure 5D) expression in H460 and SK-MES-1 cells. Additionally, ROCK1 mRNA expression was upregulated in NSCLC tissues compared with that in adjacent non-tumor lung tissues (Figure 5E) and was inversely related to miR-374a-3p expression in NSCLC tissues (Figure 5F; r = −0.6498, P < 0.0001).
 |
Figure 5 KCNMB2-AS1 regulates ROCK1 expression via miR-374a-3p in NSCLC cells. (A) The potential wild-type and mutant sequences of miR-374a-3p within the 3ʹ-UTR sequences of ROCK1. (B) Luciferase activities were determined after cotransfection with miR-374a-3p mimic or miR-NC and ROCK1-wt or ROCK-mut in H460 and SK-MES-1 cells. (C, D) After transfection with miR-374a-3p mimic or miR-NC, the mRNA and protein expressions of ROCK1 in H460 and SK-MES-1 cells were analyzed using RT-qPCR and Western blotting, respectively. (E) RT-qPCR was used to determine ROCK1 mRNA expression in 61 pairs of NSCLC tissues and adjacent non-tumor lung tissues. (F) The relationship between miR-374a-3p and ROCK1 mRNA expression in NSCLC tissues was assessed using Pearson correlation analysis. (G, H) After transfection with si-KCNMB2-AS1 or si-NC, RT-qPCR and Western blotting were conducted to examine changes in ROCK1 mRNA and protein expression, respectively. (I, J) si-KCNMB2-AS1, along with miR-374a-3p inhibitor or NC inhibitor, was cotransfected into H460 and SK-MES-1 cells. ROCK1 mRNA and protein levels were determined using RT-qPCR and Western blotting, respectively. (K) The correlation between KCNMB2-AS1 and ROCK1 mRNA expression in NSCLC tissues was assessed using Pearson correlation analysis. **P < 0.01. |
The effects of KCNMB2-AS1 depletion on ROCK1 expression in NSCLC cells were determined using RT-qPCR and Western blotting. In KCNMB2-AS1-deficient H460 and SK-MES-1 cells, ROCK1 expression was decreased at both the mRNA (Figure 5G) and protein (Figure 5H) levels. Rescue experiments were performed to evaluate the role of miR-374a-3p in the regulation of ROCK1 expression by KCNMB2-AS1 in NSCLC cells. The si-KCNMB2-AS1-mediated downregulation of ROCK1 mRNA (Figure 5I) and protein (Figure 5J) expression levels were prominently reversed in H460 and SK-MES-1 cells after miR-374a-3p inhibitor cotransfection. Additionally, a positive correlation between KCNMB2-AS1 and ROCK1 expression in NSCLC tissues was validated using Pearson correlation analysis (Figure 5K; r = 0.6715, P < 0.0001). Altogether, ROCK1 was a direct target of miR-374a-3p in NSCLC, and KCNMB2-AS1 positively regulated ROCK1 expression by sponging miR-374a-3p.
Loss of KCNMB2-AS1 Inhibits NSCLC Cells via the miR-374a-3p/ROCK1 Axis
Rescue experiments were performed to further assess the ability of the miR-374a-3p/ROCK1 axis to regulate KCNMB2-AS1-mediated pro-oncogenic actions in NSCLC cells.
First, miR-374a-3p was demonstrated to be decreased in H460 and SK-MES-1 cells after miR-374a-3p inhibitor transfection (Figure 6A). Next, KCNMB2-AS1-deficient H460 and SK-MES-1 cells were cotransfected with miR-374a-3p inhibitor or NC inhibitor. The proliferation of H460 and SK-MES-1 cells was significantly hindered following treatment with si-KCNMB2-AS1, whereas the suppressed cell proliferation ability was recovered after cotransfection with miR-374a-3p inhibitor (Figure 6B). Furthermore, loss of KCNMB2-AS1evidently facilitated cell apoptosis (Figure 6C) and attenuated H460 and SK-MES-1 cell migration (Figure 6D) and invasion (Figure 6E), whereas miR-374a-3p inhibitor cotransfection counteracted these effects.
 |
Figure 6 miR-374a-3p inhibitor reverses the effects of si-KCNMB2-AS1 on NSCLC cells. (A) RT-qPCR analysis showed the expression of miR-374a-3p in H460 and SK-MES-1 cells transfected with miR-374a-3p inhibitor or NC inhibitor. (B, C) si-KCNMB2-AS1 was cotransfected with miR-374a-3p inhibitor or NC inhibitor into H460 and SK-MES-1 cells. CCK-8 assay and flow cytometry were performed to detect cell proliferation and apoptosis in different groups. (D, E) The migration and invasion abilities of H460 and SK-MES-1 cells treated as described above were examined using Transwell cell migration and invasion assays (x200 magnification). *P < 0.05 and **P < 0.01. |
To perform rescue experiments, ROCK1 expression was restored in KCNMB2-AS1-silenced H460 and SK-MES-1 cells. The efficiency of pcDNA3.1-ROCK1 transfection was determined by Western blotting (Figure 7A). Restoration of ROCK1 expression partly abrogated the suppression of H460 and SK-MES-1 cell proliferation (Figure 7B) and the promotion of cell apoptosis (Figure 7C) induced by KCNMB2-AS1 silencing. The addition of pcDNA3.1-ROCK1 recovered the migration (Figure 7D) and invasion (Figure 7E) abilities of H460 and SK-MES-1 cells that were suppressed by KCNMB2-AS1 silencing. Taken together, these results suggest that KCNMB2-AS1enhances NSCLC oncogenicity by regulating the miR-374a-3p/ROCK1 axis.
 |
Figure 7 The effects of KCNMB2-AS1 knockdown on NSCLC cells are reversed by pcDNA3.1-ROCK1. (A) ROCK1 protein expression was examined using Western blotting in H460 and SK-MES-1 cells transfected with pcDNA3.1-ROCK1 or pcDNA3.1. (B–E) si-KCNMB2-AS1, along with pcDNA3.1-ROCK1 or pcDNA3.1, was transfected into H460 and SK-MES-1 cells, and cell proliferation, apoptosis, migration, and invasion were detected using CCK-8, flow cytometry, Transwell migration, and Transwell invasion assays (x200 magnification), respectively. *P < 0.05 and **P < 0.01. |
KCNMB2-AS1 Knockdown Prevents Tumor Growth of NSCLC Cells in vivo
After the identification of the biological roles of KCNMB2-AS1 in vitro, a tumor xenograft model was generated to verify the cancer-promoting actions of KCNMB2-AS1 in NSCLC cells in vivo. H460 cells stably transfected with sh-KCNMB2-AS1 or sh-NC were subcutaneously injected into nude mice. The KCNMB2-AS1-silenced group showed significantly reduced tumor growth compared with the sh-NC group (Figure 8A and B). In addition, tumor weights of the sh-KCNMB2-AS1 group were evidently lower relative to those in the sh-NC group (Figure 8C). All tumor xenografts were harvested at 4 weeks after cell injection, and molecular analysis was performed to determine KCNMB2-AS1, miR-374a-3p, and ROCK1 expression. RT-qPCR analysis indicated that KCNMB2-AS1 expression remained low (Figure 8D), whereas the expression of miR-374a-3p was elevated (Figure 8E) in the tumors originating from KCNMB2-AS1-depleted H460 cells. Furthermore, the ROCK1 protein expression was downregulated by KCNMB2-AS1 silencing (Figure 8F), which was consistent with the in vitro results. Moreover, HE staining delineated that the tumor xenografts were derived from H460 cells (Figure 8G). The immunohistochemistry also confirmed that Ki-67 was decreased whereas cleaved Caspase-3 was increased in the KCNMB2-AS1-depleted tumor xenografts (Figure 8H). Thus, KCNMB2-AS1 downregulation inhibited the tumor growth of NSCLC cells in vivo.
 |
Figure 8 Loss of KCNMB2-AS1 impairs NSCLC cell tumor growth in vivo. (A) Tumor growth curves were plotted according to the tumor volumes measured weekly. (B) Representative images of the tumor xenografts formed from sh-KCNMB2-AS1 or sh-NC stably-transfected H460 cells. (C) After 4 weeks, all mice were euthanized, and the tumor xenografts were excised and weighed. (D, E) KCNMB2-AS1 and miR-374a-3p expression levels in the tumor xenografts were measured using RT-qPCR. (F) Western blotting was conducted to detect the protein level of ROCK1 in tumor xenografts. (G) HE staining was conducted in the tumor xenografts. (H) The immunohistochemistry was employed to detect Ki-67 and cleaved Caspase-3 in tumor xenografts. **P < 0.01. |
Discussion
In recent years, emerging evidence has verified the important roles played by lncRNAs in the occurrence and development of NSCLC.22–24 Several lncRNAs are dysregulated in NSCLC, and they exert cancer-promoting or cancer-inhibiting roles during regulation of the malignant characteristics of NSCLC cells.25–27 Therefore, the exploration of tumor-associated lncRNAs in NSCLC carcinogenesis and progression may be helpful in the development of more effective NSCLC therapies. Currently, the expression status and detailed functions of most lncRNAs in NSCLC remain largely unclear; thus, the study of lncRNAs in NSCLC is urgent and necessary despite significant advances in this field.
KCNMB2-AS1expression is correlated with the overall survival of patients with endometrial cancer.28 However, the expression profile and precise functions of KCNMB2-AS1 in NSCLC remain unknown. In this study, GEPIA of the TCGA and GTEx databases was performed to analyze the expression of KCNMB2-AS1 in NSCLC. The results revealed that KCNMB2-AS1 expression was upregulated in lung adenocarcinoma and lung squamous cell carcinoma tissues. RT-qPCR was conducted to confirm this finding and showed an increased expression level of KCNMB2-AS1 in NSCLC tissues relative to that in non-tumor lung tissues. Various experiments were conducted to determine the influences of KCNMB2-AS1 silencing on the malignant processes in NSCLC cells in vitro and in vivo. After KCNMB2-AS1 silencing, the proliferation, migration, and invasion abilities of NSCLC cells were hindered. Additionally, KCNMB2-AS1 knockdown promoted apoptosis of NSCLC cells in vitro and decreased tumor growth in vivo.
The possible mechanisms by which KCNMB2-AS1 exhibits oncogenic functions during NSCLC progression were elucidated in detail. Recent studies identified that lncRNAs are implicated in tumorigenesis via different mechanisms, depending mostly on their subcellular localization.29,30 The ceRNA theory proposed in recent years postulates that lncRNAs can competitively bind to miRNA response elements and serve as a molecular sponge for miRNAs, thereby regulating the expression of corresponding target mRNAs.31 In this study, the distribution of KCNMB2-AS1 in NSCLC cells was first predicted by lncLocator, and the results showed that KCNMB2-AS1 was mainly located in the cytoplasm. Subsequently, nuclear/cytoplasmic fractionation assays performed to separate the nuclear and cytoplasmic fractions of NSCLC cells and analyze the relative proportion of KCNMB2-AS1 in these fractions demonstrated that KCNMB2-AS1was mainly distributed in the cytoplasm of NSCLC cells.
Next, miRNA complementary base pairing with KCNMB2-AS1 was predicted using bioinformatics analysis. miR-374a-3p was identified to be a potential miRNA targeting KCNMB2-AS1. RT-qPCR results confirmed that KCNMB2-AS1 interference increased the expression of miR-374a-3p in NSCLC cells. Further investigations revealed that miR-374a-3p was weakly expressed in NSCLC tissues and exhibited an inverse correlation with KCNMB2-AS1 expression. Furthermore, KCNMB2-AS1 interacted with miR-374a-3p via complementary gene sequences, as evidenced by luciferase reporter and RIP assay results. After identifying ROCK1 as a direct target of KCNMB2-AS1, we next determined whether KCNMB2-AS1 affects ROCK1 expression via miR-374a-3p. The results showed that KCNMB2-AS1 deficiency resulted in a substantial decrease in ROCK1 mRNA and protein expression in NSCLC cells, and cotransfection with miR-374a-3p inhibitor abrogated these impacts. These results provided sufficient evidence that KCNMB2-AS1 serves as an endogenous sponge of miR-374a-3p and consequently increases ROCK1 expression in NSCLC cells.
ROCK1 is located on 18q11.1 and is an essential downstream effector of Rho small guanosine 5ʹ-triphosphatases.32–34 ROCK1 has been demonstrated to be upregulated in NSCLC and validated as a critical regulator of cancer genesis and progression.35,36 Here, our results showed that ROCK1 was regulated by the KCNMB2-AS1/miR-374a-3p axis in NSCLC cells. Furthermore, increasing the activity of the miR-374a-3p/ROCK1 axis attenuated KCNMB2-AS1 silencing-induced inhibition of NSCLC progression. Collectively, a novel ceRNA model was defined in which KCNMB2-AS1 functions as a molecular sponge to competitively adsorb miR-374a-3p with ROCK1 in NSCLC cells, thereby resulting in the suppression of miR-374a-3p and recovering ROCK1 expression and activities. Hence, any alteration in the KCNMB2-AS1/miR-374a-3p/ROCK1 pathway may contribute to the pathologic processes in NSCLC.
In this study, we explored the correlation between KCNMB2-AS1 and miR-374a-3p in NSCLC tissues. Also, the correlation between miR-374a-3p and ROCK1 in NSCLC tissues was also tested. However, we did not investigate the correlation between KCNMB2-AS1 and miR-374a-3p as well as miR-374a-3p and ROCK1 in TCGA. It was a limitation of our study, and we will resolve it in the near future.
Conclusion
In summary, our data revealed the involvement of KCNMB2-AS1 in accelerating the progression of NSCLC by regulating the miR-374a-3p/ROCK1 axis. These results may have a positive significance for the identification of novel therapeutic targets for the management of NSCLC in the future.
Consent for Publication
Not applicable.
Funding
There is no funding to report.
Disclosure
The authors declare that they have no conflicts of interest for this work.
References
1. Bray F, Ferlay J, Soerjomataram I, Siegel RL, Torre LA, Jemal A. Global cancer statistics 2018: GLOBOCAN estimates of incidence and mortality worldwide for 36 cancers in 185 countries. CA Cancer J Clin. 2018;68(6):394–424.
2. Heist RS, Engelman JA. SnapShot: non-small cell lung cancer. Cancer Cell. 2012;21(3):448 e442. doi:10.1016/j.ccr.2012.03.007
3. Verdecchia A, Francisci S, Brenner H, et al. Recent cancer survival in Europe: a 2000-02 period analysis of EUROCARE-4 data. Lancet Oncol. 2007;8(9):784–796. doi:10.1016/S1470-2045(07)70246-2
4. Miller YE. Pathogenesis of lung cancer: 100 year report. Am J Respir Cell Mol Biol. 2005;33(3):216–223. doi:10.1165/rcmb.2005-0158OE
5. Koudelakova V, Kneblova M, Trojanec R, Drabek J, Hajduch M. Non-small cell lung cancer–genetic predictors. Biomed Pap Med Fac Univ Palacky Olomouc Czech Repub. 2013;157(2):125–136. doi:10.5507/bp.2013.034
6. New M, Keith R. Early detection and chemoprevention of lung cancer. F1000Research. 2018;7:61. doi:10.12688/f1000research.12433.1
7. Mercer TR, Dinger ME, Mattick JS. Long non-coding RNAs: insights into functions. Nat Rev Genet. 2009;10(3):155–159. doi:10.1038/nrg2521
8. Prensner JR, Chinnaiyan AM. The emergence of lncRNAs in cancer biology. Cancer Discov. 2011;1(5):391–407. doi:10.1158/2159-8290.CD-11-0209
9. Sun X, Haider Ali MSS, Moran M. The role of interactions of long non-coding RNAs and heterogeneous nuclear ribonucleoproteins in regulating cellular functions. Biochem J. 2017;474(17):2925–2935. doi:10.1042/BCJ20170280
10. Zhang X, Wang W, Zhu W, et al. Mechanisms and functions of long non-coding RNAs at multiple regulatory levels. Int J Mol Sci. 2019;20:22.
11. Fang Y, Fullwood MJ. Roles, functions, and mechanisms of long non-coding RNAs in cancer. Genomics Proteomics Bioinformatics. 2016;14(1):42–54. doi:10.1016/j.gpb.2015.09.006
12. Wu R, Su Y, Wu H, Dai Y, Zhao M, Lu Q. Characters, functions and clinical perspectives of long non-coding RNAs. Mol Genetics Genomics. 2016;291(3):1013–1033. doi:10.1007/s00438-016-1179-y
13. Wei S, Wang K, Huang X, Zhao Z, Zhao Z. LncRNA MALAT1 contributes to non-small cell lung cancer progression via modulating miR-200a-3p/programmed death-ligand 1 axis. Int J Immunopathol Pharmacol. 2019;33:2058738419859699. doi:10.1177/2058738419859699
14. Nie W, Ge HJ, Yang XQ, et al. LncRNA-UCA1 exerts oncogenic functions in non-small cell lung cancer by targeting miR-193a-3p. Cancer Lett. 2016;371(1):99–106. doi:10.1016/j.canlet.2015.11.024
15. Yang J, Lin X, Jiang W, Wu J, Lin L. lncRNA LEF1-AS1 promotes malignancy in non-small-cell lung cancer by modulating the miR-489/SOX4 axis. DNA Cell Biol. 2019;38(9):1013–1021. doi:10.1089/dna.2019.4717
16. He R, Zhang FH, Shen N. LncRNA FEZF1-AS1 enhances epithelial-mesenchymal transition (EMT) through suppressing E-cadherin and regulating WNT pathway in non-small cell lung cancer (NSCLC). Biomed Pharmacother/Biomedecine & Pharmacotherapie. 2017;95:331–338. doi:10.1016/j.biopha.2017.08.057
17. Wu D, Li Y, Zhang H, Hu X. Knockdown of Lncrna PVT1 enhances radiosensitivity in non-small cell lung cancer by sponging Mir-195. Cell Physiol Biochem. 2017;42(6):2453–2466. doi:10.1159/000480209
18. Zhang Y, Yang Q, Wang S. MicroRNAs: a new key in lung cancer. Cancer Chemother Pharmacol. 2014;74(6):1105–1111. doi:10.1007/s00280-014-2559-9
19. Tay Y, Rinn J, Pandolfi PP. The multilayered complexity of ceRNA crosstalk and competition. Nature. 2014;505(7483):344–352. doi:10.1038/nature12986
20. Tan JY, Sirey T, Honti F, et al. Extensive microRNA-mediated crosstalk between lncRNAs and mRNAs in mouse embryonic stem cells. Genome Res. 2015;25(5):655–666. doi:10.1101/gr.181974.114
21. Liang Y, Zhang C, Ma MH, Dai DQ. Identification and prediction of novel non-coding and coding RNA-associated competing endogenous RNA networks in colorectal cancer. World j Gastroenterol. 2018;24(46):5259–5270. doi:10.3748/wjg.v24.i46.5259
22. Jiang C, Yang Y, Yang Y, et al. Long noncoding RNA (lncRNA) HOTAIR affects tumorigenesis and metastasis of non-small cell lung cancer by upregulating miR-613. Oncol Res. 2018;26(5):725–734. doi:10.3727/096504017X15119467381615
23. Bai Y, Zhang G, Chu H, Li P, Li J. The positive feedback loop of lncRNA DANCR/miR-138/Sox4 facilitates malignancy in non-small cell lung cancer. Am J Cancer Res. 2019;9(2):270–284.
24. Tang H, Han X, Li M, Li T, Hao Y. Linc00221 modulates cisplatin resistance in non-small-cell lung cancer via sponging miR-519a. Biochimie. 2019;162:134–143. doi:10.1016/j.biochi.2019.04.019
25. Shen Q, Jiang Y. LncRNA NNT-AS1 promotes the proliferation, and invasion of lung cancer cells via regulating miR-129-5p expression. Biomed Pharmacother/Biomedecine & Pharmacotherapie. 2018;105:176–181. doi:10.1016/j.biopha.2018.05.123
26. Yang X, Zhang W, Cheng SQ, Yang RL. High expression of lncRNA GACAT3 inhibits invasion and metastasis of non-small cell lung cancer to enhance the effect of radiotherapy. Eur Rev Med Pharmacol Sci. 2018;22(5):1315–1322.
27. Yang Y, Jiang C, Yang Y, et al. Silencing of LncRNA-HOTAIR decreases drug resistance of non-small cell lung cancer cells by inactivating autophagy via suppressing the phosphorylation of ULK1. Biochem Biophys Res Commun. 2018;497(4):1003–1010. doi:10.1016/j.bbrc.2018.02.141
28. Tang H, Wu Z, Zhang Y, et al. Identification and function analysis of a five-long noncoding RNA prognostic signature for endometrial cancer patients. DNA Cell Biol. 2019;38(12):1480–1498. doi:10.1089/dna.2019.4944
29. Qu J, Li M, Zhong W, Hu C. Competing endogenous RNA in cancer: a new pattern of gene expression regulation. Int J Clin Exp Med. 2015;8(10):17110–17116.
30. Qi X, Zhang DH, Wu N, Xiao JH, Wang X, Ma W. ceRNA in cancer: possible functions and clinical implications. J Med Genet. 2015;52(10):710–718. doi:10.1136/jmedgenet-2015-103334
31. Wang W, Lou W, Ding B, et al. A novel mRNA-miRNA-lncRNA competing endogenous RNA triple sub-network associated with prognosis of pancreatic cancer. Aging. 2019;11(9):2610–2627. doi:10.18632/aging.101933
32. Zhang C, Zhang S, Zhang Z, He J, Xu Y, Liu S. ROCK has a crucial role in regulating prostate tumor growth through interaction with c-Myc. Oncogene. 2014;33(49):5582–5591. doi:10.1038/onc.2013.505
33. Rossman KL, Der CJ, Sondek J. GEF means go: turning on RHO GTPases with guanine nucleotide-exchange factors. Nat Rev Mol Cell Biol. 2005;6(2):167–180. doi:10.1038/nrm1587
34. Patel RA, Forinash KD, Pireddu R, et al. RKI-1447 is a potent inhibitor of the Rho-associated ROCK kinases with anti-invasive and antitumor activities in breast cancer. Cancer Res. 2012;72(19):5025–5034. doi:10.1158/0008-5472.CAN-12-0954
35. Hu C, Zhou H, Liu Y, et al. ROCK1 promotes migration and invasion of non-small-cell lung cancer cells through the PTEN/PI3K/FAK pathway. Int J Oncol. 2019;55(4):833–844.
36. Tang H, Du W, Jiang Y, Li H, Bo H, Song S. Upregulated expression of ROCK1 promotes cell proliferation by functioning as a target of miR-335-5p in non-small cell lung cancer. J Cell Physiol. 2019. doi:10.1002/jcp.28886
 © 2020 The Author(s). This work is published and licensed by Dove Medical Press Limited. The
full terms of this license are available at https://www.dovepress.com/terms
and incorporate the Creative Commons Attribution
- Non Commercial (unported, 3.0) License.
By accessing the work you hereby accept the Terms. Non-commercial uses of the work are permitted
without any further permission from Dove Medical Press Limited, provided the work is properly
attributed. For permission for commercial use of this work, please see paragraphs 4.2 and 5 of our Terms.
© 2020 The Author(s). This work is published and licensed by Dove Medical Press Limited. The
full terms of this license are available at https://www.dovepress.com/terms
and incorporate the Creative Commons Attribution
- Non Commercial (unported, 3.0) License.
By accessing the work you hereby accept the Terms. Non-commercial uses of the work are permitted
without any further permission from Dove Medical Press Limited, provided the work is properly
attributed. For permission for commercial use of this work, please see paragraphs 4.2 and 5 of our Terms.