Back to Journals » International Journal of General Medicine » Volume 15
Long Non-Coding RNA Signatures Associated with Ferroptosis Predict Prognosis in Colorectal Cancer
Authors Li N ![]() , Shen J
, Shen J ![]() , Qiao X, Gao Y
, Qiao X, Gao Y ![]() , Su HB
, Su HB ![]() , Zhang S
, Zhang S ![]()
Received 5 August 2021
Accepted for publication 10 December 2021
Published 4 January 2022 Volume 2022:15 Pages 33—43
DOI https://doi.org/10.2147/IJGM.S331378
Checked for plagiarism Yes
Review by Single anonymous peer review
Peer reviewer comments 2
Editor who approved publication: Dr Scott Fraser
Na Li,1 Jiangli Shen,1 Ximin Qiao,2 Yuan Gao,3 Hong-Bo Su,4 Shuai Zhang5
1Department of Anorectal Surgery, Xianyang Central Hospital, Xianyang, Shaanxi Province, People’s Republic of China; 2Dean’s Office, Xianyang Central Hospital, Xianyang, Shaanxi Province, People’s Republic of China; 3Surgery Department, Xianyang Central Hospital, Xianyang, Shaanxi Province, People’s Republic of China; 4The Second Ward of the Anorectal Hospital, Xi’an Hospital of TCM, Xi’an, Shaanxi Province, People’s Republic of China; 5Journal Editorial Board, Hebei University of Chinese Medicine, Hebei, People’s Republic of China
Correspondence: Hong-Bo Su; Shuai Zhang Email [email protected]; [email protected]
Background: Currently, colorectal cancer has become a common gastrointestinal malignancy that usually occurs in the colon and rectum, and ferroptosis plays a vital role in the pathology and progression of colorectal tumors.
Methods: A total of 627 patients (51 normal and 644 tumor samples) from The Cancer Genome Atlas (TCGA)-COAD and TCGA-READ were included in the study. Lasso and Cox’s regression was employed to analyze the characteristic lncRNAs in colorectal cancer samples, and a distinctive prognostic model of ferroptosis-related lncRNAs was established. By analyzing the divergence between the high and low-risk groups of ferroptosis-related lncRNAs, 15 characteristic lncRNAs related to the prognosis of colorectal cancer were evaluated. Kaplan–Meier analysis, operation characteristic curve (ROC), nomogram, and gene set enrichment analyses (GSEA) further confirmed the validity of the characteristic prognostic model with ferroptosis-related lncRNAs.
Results: Kaplan–Meier analysis confirmed a high-risk group of ferroptosis-related lncRNA interrelated with a poor prognosis in colorectal cancer. AUC estimates of 1 -, 3 -, and 5-year survival rates for ferroptosis-related lncRNA characteristic models were 0.745, 0.767 and 0.789. GSEA analysis showed that immune and malignancy-related pathways were active in the high-risk score group. In addition, differential analyses of immune function, including Checkpoint, cytolytic, HLA, and T cell co-inhibition, differed significantly betwixt low - and high-risk groups.CD160, TNFRSF18, CD27, PDCD1, CD200R1, ADORA2A, TNFRSF14, LAIR1, CD244, CD40, TNFRSF4, CD70, TNFSF14, TNFRSF25, CD276, HHLA2, VTCN1, LAG3, TNFSF18, and other immune checkpoints had different expressions betwixt the high- and low-risk group.
Conclusion: Fifteen kinds of lncRNAs with different expressions (AP003555.1, AC099850.3, AL031985.3, LINC01857, STPG3-AS1, AL137782.1, AC124067.4, AC012313.5, AC083900.1, AC010973.2, ALMS1-IT1, AC013652.1, AC133540.1, AP006621.2, AC018653.3) were closely associated with poor prognosis of colorectal cancer. These indicators were significantly correlated with the overall survival (OS) rate and could be used as prognostic evaluation criteria.
Keywords: colorectal cancer, ferroptosis, lncRNAs, immune infiltration, TCGA
Introduction
Colorectal cancer (CRC) ranks fourth in Global Cancer Epidemic Survey, with mortality of 900,000 per year. Standard treatments include endoscopic and surgical local excision, preoperative radiotherapy, palliative chemotherapy, targeting, and immunization treatment.1 These new treatment regimens have improved overall survival for patients with colorectal cancer. But unfortunately, most patients already had metastatic carcinomas at the time of diagnosis, and colorectal cancer remains a disease with a high mortality rate. Immune checkpoint inhibitors are used to treat patients with high microsatellite instability (DMR-MSI-H) metastatic colorectal tumors. However, this is not practical for other types of colorectal cancer. The therapeutic effect was undesirable.2 Systemic chemotherapy usually has minimal efficacy and severe systemic adverse reactions. Immunotherapy and targeted therapies are more effective and less toxic than standard chemotherapy regimens.
Studies showed that Iron could both promote the proliferation and death of tumor cells. Reactive oxygen species (ROS) and nuclear factor erythroid 2-related factor 2 (Nrf2) promote the ramification of Iron on the Warburg effect of colorectal tumor cells and even inhibit the sensibility of ferroptosis. Hemoglobin could enhance inflammation and inhibit tumor suppression of the P53 gene,3 promoting cytotoxicity and ROS, inducing carcinoma cell proliferation. In addition, studies have shown potential pathways of ferroptosis-related lncRNAs, including MAPK signaling pathways, mTOR signaling pathways, and glutathione metabolism pathways. In a separate survey of TCGA-COAD, seven ferroptosis-related lncRNA characteristics (ARRDC1-AS1, OIP5-AS1, etc.) were constructed.4 LINC01503 is associated with autophagy, promoting the miR-4492/FOXK1 signaling pathway5 to regulate the proliferation and metastasis of colorectal tumor cells. LncRNA OIP5-AS1 can improve the radiotherapy sensitivity of CRC cells.6
As is known to all, very few systematically scientific studies have existed to evaluate the characteristics of ferroptosis-related lncRNA among colorectal cancer patients and its correlation with the overall survival rate. This study established the predictive models with differentially expressed ferroptosis-related lncRNA characteristics based on the TCGA data. Subsequently, we discussed the ferroptosis-related N6-methyladenosine (m6A) mRNA and the efficacy of immune response in predicting the course of colorectal cancer.
Methods and Materials
Data Collection and Processing
Download and collate expression and clinical data: through the open-access TCGA-COAD and TCGA-READ database, the RNA coding sequence data of 627 patients (51 normal and 644 tumor samples) were obtained. The collected clinical characteristics (Table 1) of colorectal cancer patients included gender, age, TMN, survival status, and survival time. The grading of tumors from TCGA-COAD and TCGA-READ were classified as UNKNOWN, so filtered out the indicator.
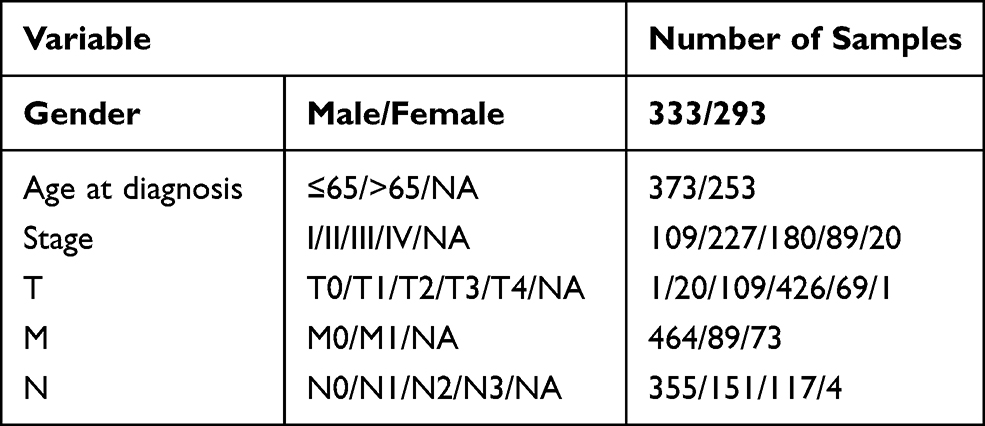 |
Table 1 TCGA Data Information Centralizes the Clinical and Medical Characteristics of Patients |
We have downloaded all ferroptosis-related markers from FerrDb,7 and then retained 246 genes that matched gene signatures in the TCGA-COAD and TCGA-READ data frame (Table S1). Ferroptosis-related gene expression levels were screened with setting conditions as FDR<0.05 and |log2FC|≥1. Pearson’s correlation was employed to assess the relationship betwixt ferroptosis- associated gene and lncRNA from TCGA-COAD and TCGA-READ. Under the condition of the correlation coefficient |R2|>0.4 and P<0.01, and through co-expression analysis, we found ferroptosis Significantly related lncRNAs with co-expression of related genes.
We applied to GO analysis and KEGG analysis of ferroptosis-associated gene and lncRNA related to up and downregulation of ferroptosis. The ggplot2 package of R software as input to analyze the biological processes, molecular functions, cellular components, and KEGG signaling pathways affected by the differentially expressed ferroptosis-associated lncRNA. Verify the model’s accuracy through survival curve, ROC curve, nomogram, independent predictive analysis, Decision Curve Analysis (DCA), etc.
The Development Trend of Prognostic Characteristics of Ferroptosis-Associated lncRNAs
With the co-expression method to predict ferroptosis-related lncRNAs, we perform survival analysis on these lncRNAs, find prognostic-related lncRNAs, and construct a predictive model. We use Lasso regression and Cox regression model analyses to build the attributes of ferroptosis-associated lncRNAs, according to the risk score (index lncRNA1 × lncRNA1 expression) (index lncRNA2 × lncRNA2 expression) + … + (index lncRNA × expression lncRNA). The risk score of individual colorectal cancer patients was also assessed. According to the median value, the lncRNAs are divided into high and low-risk groups. The low-risk group was smaller than the median, and the high-risk group was significantly higher than the median.
DCA Diagrams of Different Risk Prediction Models
We used decision curve analysis R package- ggDCA to construct four diagnostic models: (1): prognostic characteristics of ferroptosis -associated lncRNAs model; (2): age parameter model; (3): gender parameter model (4): clinical staging parameter model. The DCA curve evaluated the clinical diagnostic value of the four models.
Predictive Analysis Nomogram
We carried out a GSEA analysis to detail the characteristics of lncRNAs in KEGG. P<0.05, and the false discovery rate (FDR) <0.25, statistically significant. A nomogram with the factors of colorectal cancer was constructed to predict and analyze the 1, 3, and 5-year OS of colorectal carcinoma patients. We use survival and RMS packages of R software to draw a nomogram based on the construction of the Cox proportional hazard regression model.
Effects of Low Risk and the High-Risk Group on Immune Function, Immune Checkpoint, and m6A mRNA
CIBERSORT,8 ESTIMATE,9 MCPcounter,10 single-sample gene set enrichment analysis (ssGSEA),11 and TIMER12 optimization algorithms to assess somatic cell composition or somatic immune response between the high- and the low-risk score group. The application of a heatmap reveals the difference in the immune reaction under different optimization algorithms. Further, ssGSEA was utilized to quantitatively analyze the immune subgroups of malignant tumor-infiltrating cells between the two groups to assess their immune function. Then, the immune checkpoint genes and methylation genes in the high and low-risk groups were further analyzed.
Data Analysis
R 4.0.2 software package13 was used to analyze the data. The Wilcoxon test and the non-matched Student’s t-test were applied to analyze independent variables’ standard normal distribution and non-standard normal distribution. The Benjamini-Hochberg method is adopted to distinguish lncRNAs with different expressions based on FDR. We use the R language GSVA package and Single Sample Gene Set Enrichment Analysis (ssGSEA) to quantify the infiltration level of 24 immune cell subtypes, to determine the difference of 24 immune cell subtypes between high and low-risk groups. We used the actual ROC and decision curve analysis (DCA)14 to evaluate the sensitivity and non-specificity of the characteristics of colorectal cancer after the differentiation and contrast with other clinical medical pathophysiology. Logistic regression analysis and Heatmap were used to assess the relationship betwixt ferroptosis-associated lncRNA with clinical medical pathology. Kaplan-Meier survival analysis was used to determine the survival analysis of colorectal cancer patients according to the characteristics of ferroptosis-associated lncRNA. P < 0.05, statistically significant.
Results
Enrichment Analysis of Ferroptosis-Associated Genes
Sixty-seven ferroptosis-related differential genes (including 26 down-regulated and 41 Upregulating genes), as shown in Table S2. The biological process involved cellular reaction to chemical stress, oxidative stress, oxygen levels, hypoxia, and ketone, carboxylic acid biosynthetic processes. The cell components are mainly in the following regions: basolateral plasma membrane, apical part of the cell, basal plasma membrane, basal part of the cell, microvillus membrane, apical plasma membrane. These differential genes show the following Molecular functions: sterol binding, protein self-association, oxidoreductase activity, acting on peroxide as acceptor, pyridoxal phosphate binding, vitamin B6 binding, potassium channel regulator activity, and cytokine receptor binding. Ferroptosis-associated genes are mainly enriched the following pathway: fluid shear stress and atherosclerosis pathway, central carbon metabolism in cancer pathway, ferroptosis pathway, microRNAs in cancer pathway, glutathione metabolism pathway, HIF-1 signaling pathway, renal cell carcinoma pathway, p53 signaling pathway, alanine pathway, aspartate and glutamate metabolism pathway, bladder cancer pathway, rheumatoid arthritis pathway, and mTOR signaling pathway, as shown in Figure 1 and Table S3.
 |
Figure 1 GO and KEGG analysis of ferroptosis-related differentially expressed genes (DEGs) linked with TCGA-COAD and TCGA-READ data frames for colorectal cancer samples. (A) Perform a GO analysis of these DEGs. (B) KEGG analysis related to these DEGs. |
Predictive Characteristics of lncRNA Based on Ferroptosis
The limma package of the R language was applied. Under the condition of the correlation coefficient |R2|>0.4 and P<0.01, and through co-expression analysis, we found 693 ferroptosis-related lncRNAs, as shown in Table S4. The univariate analysis identified 41 significantly different lncRNAs. These lncRNAs were used to construct multivariate Cox analysis. 15 kinds of lncRNAs with different expressions (AP003555.1, AC099850.3, AL031985.3, LINC01857, STPG3-AS1, AL137782.1, AC124067.4, AC012313.5, AC083900.1, AC010973.2, ALMS1-IT1, AC013652.1, AC133540.1, AP006621.2, AC018653.3) were independent prognostic factors for colorectal cancer (Table S5). Therefore, we counted the risk score and constructed predictive characteristics of those lncRNAs.
Survival Outcome and Multi-Independent Variable Examination
Kaplan-Meier analysis displayed that the high-risk group of prognostic ferroptosis-associated lncRNAs model corresponded to the lower survival rate (P<0.001, Figure 2A). The AUC of prognostic ferroptosis-related lncRNAs is 0.745 at one year, which is better than the traditional clinical-pathological characteristics (AUC=0.681) in the predictive analysis of colorectal cancer (Figure 2B and E). From the patients increasing risk score (Figure 2C), the median value of the risk score is used as the dividing line. The low-risk group is green, and the high-risk group is red. The higher the patient’s risk score, the lower the patient’s survival rate. Interestingly, the Heatmap of the low-risk group and the high-risk group showed that the expression of AP003555.1, LINC01857, STPG3-AS1, AC083900.1, AC010973.2, ALMS1-IT1, AC013652.1, AC133540.1, AP006621.2, and AC018653.3 increased in a high-risk group, while the expression of AC099850.3, AL031985.3, AL137782.1, AC124067.4, and AC012313.5 decreased in a high-risk group (Figures 2F and 3). Prognostic ferroptosis-associated lncRNAs model’s AUC estimates for 1, 3, and 5-year survival rates were 0.745, 0.767, and 0.789 (Figure 2D). Ferroptosis -associated lncRNAs model (HR: 1.200, 95CI: 1.153–1.249) and tumor stages (HR: 2.063, 95CI: 1.674–2.543), were the independent factors of Overall survival (OS) for colorectal cancer patients (Figure 4A), which proved by Univariate COX analysis. Multivariate cox analysis showed that prognostic characteristics of the ferroptosis-associated lncRNAs model (HR: 1.181, 95CI: 1.129–1.236) and their tumor stages (HR: 2.105, 95CI: 1.695–2.614) are also independent factors of OS in colorectal cancer patients (Figure 4B). Figure 4C shows the correlation between lncRNA and mRNA. As shown on the clinical correlation heatmap (Figure 3), red represents high-risk groups, and blue represents low-risk groups.AP003555.1, LINC01857, STPG3-AS1, AC083900.1, AC010973.2, ALMS1-IT1, AC013652.1, AC133540.1, AP006621.2, and AC018653.3 increased in high-risk group, while the expression level of AC099850.3, AL031985.3, AL137782.1, AC124067.4 and AC012313.5 decreased in high-risk group. There were significant differences in clinical lymph node invasion and metastasis, stage, and survival status betwixt high-risk and low-risk groups. In other words, predictive characteristics of the ferroptosis-associated lncRNAs model significantly impact clinical lymph node invasion and metastasis, stage, and survival status (P<0.05). The clinician can use the nomogram to predict the survival probability of each research subject. As shown in Figure 5, the Total Point of the current patient is 224 points, and the predicted survival probabilities for the next 1, 3, and 5 years are 12.3%, 5.97%, and 2.37%, respectively. The mixed nomogram combines clinical pathology characteristics. The predictive features of new ferroptosis-associated lncRNAs are reliable and accurate in clinical medical management for patients with colorectal cancer.
 |
Figure 2 A prognostic characteristic ferroptosis-related lncRNAs’ model assessment based on Colorectal cancer samples from the TCGA-COAD and READ data frame. (A) Survival curves for the two groups with high and low-risk scores. The year is represented by the abscissa, while the survival rate is represented by the ordinate. P<0.05, denotes statistical significance. (B) The AUC value has four different clinical parameters setting (a prognostic characteristic ferroptosis-related lncRNAs, age, gender, clinical stage). The abscissa denotes 1-specificity, while the ordinate represents sensitivity. AUC≈1.0 represents an ideal inspection index; AUC 0.7–0.9 indicates a high-test accuracy value; AUC=0.5 represents that the test has no diagnostic value. (C) The effect of high- and low-risk score groups in the prognostic ferroptosis-related lncRNAs model on survival time and survival status. The abscissa is for the patients to gradually improve their risk score; the high-risk score group is in red, and the low-risk score group is in green. The number of death samples increases the risk score. (D) The AUC values of a characteristic prognostic model of lncRNAs associated with ferroptosis at 1, 3, and 5-years. The ordinate represents sensitivity, and the abscissa represents 1-specificity. AUC≈1.0: An ideal inspection index; AUC 0.7–0.9: has a high-test accuracy value; AUC=0.5: the test has no diagnostic value. (E) DCA of 4 clinical parameter modes (a prognostic characteristic ferroptosis-related lncRNAs, age, gender, clinical stage). The risk threshold probability is represented by abscissa in the figure: in the risk assessment tool, the probability of a patient being diagnosed with colorectal cancer is recorded as Pi; when Pi reaches a certain threshold (denoted as Pt), it is defined as positive, and treatment measures are taken. The decision number model is based on the patient’s benefit after treatment and untreated loss (harm). The ordinate represents the net benefit, which is the patient’s benefit from treatment minus the loss caused by untreated. (F) The heat map shows the high and low-risk score groups related to the expression level of the prognostic ferroptosis-related lncRNAs among colorectal cancer samples. The abscissa represents the high- and low-risk score groups, pink represents the low-risk score group, blue represents the high-risk score group, and the ordinate represents the expression level of characteristic prognostic lncRNAs associated with ferroptosis in the samples; P<0.05, statistically significant. |
 |
Figure 3 Clinical correlation heatmap, with red denoting high-risk score group, and blue denoting low-risk score group. The main abscissa represents the high- and low-risk groups are represented by primary abscissa, with blue representing the low-risk score group, and red representing the high-risk score group. In addition, the abscissa stratification includes tumor TNM stage, age, gender, survival status, survival time, and pathological stage; the ordinate represents the expression level of characteristic prognostic lncRNAs associated with ferroptosis in the samples. T: the scope and size of the primary tumor; N: the dissemination of lymph nodes; M: Whether there is metastasis, M0 means that there is no metastasis, and M1 means that there is distant metastasis. Unknown: missing clinical data in the TCGA data frame; stge: stage; fustat: survival status; futime: survival time. *P<0.05, ***P<0.001. |
 |
Figure 4 Cox analysis of the ferroptosis-related lncRNA distinctive prognostic model. (A) Univariate Cox analysis, P<0.05, statistically significant. (B) Multivariate Cox analysis. P<0.05, statistically significant. (C) Relationship between characteristic prognostic ferroptosis-related lncRNAs and mRNAs expression. |
 |
Figure 5 Based on the total score the nomogram predicts the probability of survival (including the points of clinical factors and the risk score of characteristic ferroptosis-related lncRNAs). ***P<0.001. |
Gene Set Enrichment Analyses (GSEA)
Through GSEA, those prognostic lncRNAs could adjust immunity, and intestinal immune networks for IgA production pathway, pathway in cancer, PPAR signaling pathway, Notch signaling pathway, JAK-STAT signaling pathway, colorectal cancer, MAPK signaling pathway, and VEGF signaling pathway (Figure 6 and Table S6).
 |
Figure 6 GSEA was used to identify the ferroptosis-related lncRNAs. The high-risk group was considerably enriched in the intestinal immune network for IGA production, pathways in cancer, PPAR signaling, NOTCH signaling, STAT signaling, colon cancer signaling, MAPK signaling, and VEGF signaling. |
Effects of Low Risk and the High-Risk Group on Immune Function, Immune Checkpoint, and m6A mRNA
According to the optimization algorithms of CIBERSORT, ESTIMATE, MCP counter, ssGSEA, and TIMER, the correlation analysis of immune cells (Figure 7). Blue represents low-risk groups; red represents high-risk groups; the ordinate represents immune cells. Different colors represent other software prediction methods. Macrophages m2, M1, memory B cells, immune score, microenvironment score, endothelial cells, and T cells (CD8 +, Tregs, CD4 + central memory, and CD4 + effect memory) increased significantly in the high-risk group. The immune function betwixt the low-risk and the high-risk group (Figure 8A) are significant differences between the two groups. Immune cell functions, including Checkpoint, cytolytic, HLA, T cell co-inhibition, were significantly enhanced among the high-risk groups (Figure 8A, P<0.05). Due to the necessity of immunotherapy based on checkpoint inhibitors, we further discussed the difference analysis between low-risk and high-risk groups at immune checkpoints. The expression levels of CD160, TNFRSF18, CD27, PDCD1, CD200R1, ADORA2A, TNFRSF14, LAIR1, CD244, CD40, TNFRSF4, CD70, TNFSF14, TNFRSF25, CD276, VTCN1, LAG3, TNFSF18, in the high-risk group was significantly higher than the low-risk group (Figure 8B, P<0.05).On the contrary, the expression of HHLA2 in the high-risk group was markedly lower than that in the low-risk group (Figure 8B, P<0.05). The expression level of m6a-related mRNA between the two groups revealed the YTHDF2, YTHDC1, YTHDC2, FTO, RBM15, METTL14, YTHDF1, ZC3H13 in the high-risk group was significantly lower than the low-risk group (Figure 9, P<0.05). In contrast, the expression level of METTL3 in the high-risk group was substantially higher than in the low-risk group (Figure 9, P<0.05).
 |
Figure 7 Differences in immune function between high-risk and low-risk populations were analyzed using a heatmap (based on CIBERSORT, ESTIMATE, MCPcounter, ssGSEA, TIMER algorithm). The low-risk group is represented by blue on the horizontal axis; While the high-risk group is represented by red on the horizontal axis. The vertical axis represents the immune cells. Various hues represent various software forecasting approaches. |
 |
Figure 8 Immunological function and immune checkpoints in the high-risk and low-risk groups were compared. (A) Immune cell subsets and immune function difference between high-risk and low-risk groups. The immune-related activities in colorectal cancer are shown by the abscissa, and the scores of these functions are represented by the ordinate. *P<0.05, **P<0.01, ***P<0.001. (B) Perform immune checkpoint difference analysis on the high and low-risk scores group. The abscissa represents the immune checkpoint-related genes in colorectal cancer, and the ordinate represents its expression. *P<0.05, **P<0.01, ***P<0.001. Abbreviation: ns, not significant. |
 |
Figure 9 The expression of m6A-related genes in colorectal cancer samples from high-risk and low-risk score groups. The abscissa indicates m6A-related genes in colorectal cancer, and the ordinate reflects the amount of gene expression; *P<0.05, **P<0.01, ***P<0.001. Abbreviation: ns, not significant. |
Discussion
TNM stage is a clinical evaluation index significantly related to the prognosis of colorectal cancer. At the same time, it also guides clinical treatment. Ferroptosis can participate in the resistance of many types of malignant tumor cells to radiation and chemotherapy. Therefore, it might be a new cancer treatment. This scientific research used bioinformatics methods to study the expression profile changes of differential genes related to ferroptosis in colorectal cancer. Forty-one lncRNAs identified to significantly associate with the prognosis of colorectal cancer through univariate analysis from 693 ferroptosis-related lncRNAs. We further identified 15 differentially expressed lncRNAs related to prognosis, survival time, and status and constructed a risk model that can effectively predict prognosis. The AUC of this lncRNAs model were 0.745, 0.767, and 0.789 at 1, 3, and 5-year survival rates, which is better than the clinical-pathological characteristics (AUC=0.681). Subsequently, the DCA curve evaluates the clinical diagnostic value of this ferroptosis-associated lncRNAs model is better than that of age, gender, clinical staging parameter model. New regulatory genes of ferroptosis discovered in the past few years, such as ATG7, CYBB, ACSL3, SLC7A11, TFRC, etc. Interestingly, lncRNAs play a prominent role in adjusting the expression level of these factors, as shown in our study (Figure 4C). 67 DEGs (Table S2) participate in the following cancer-related pathways: the carbon metabolism pathway in the management center of cancer, ferroptosis, microRNAs in cancer, p53 signaling pathway, mTOR signaling pathway, etc.
LncRNA plays a vital role in epigenetic regulation and many other life activities, which has a regulatory effect on mRNA and can affect mRNA expression and splicing.15,16 Some of the antisense lncRNAs can bind to mRNA to regulate gene silencing, transcription, and mRNA stability. In addition, lncRNAs are cis-correlated with mRNA, and lncRNAs are correlated with the expression levels of protein-coding genes between samples (to predict the trans correlation).17 The expression levels of seven lncRNAs, including LINC01137 and ARHGEF26-AS1, in lung adenocarcinoma (LUAD) cell lines, were detected by molecular, cellular experiments. The results showed that LINC01137 upregulated, and ArhGEF26-AS1 down-regulated in LUAD cells. Seven lncRNA-associated ferroptosis can be used as diagnostic and prognostic biomarkers for LUAD tumors.18 Up to date, there have not been many scientific studies on the efficacy evaluation of ferroptosis-associated lncRNAs in the prognosis of solid tumors, especially colorectal cancer. This paper is likely to give a precious perspective on the manipulation of colorectal cancer in the future.
Here, lncRNAs associated with different expressions are divided into high-risk and low-risk categories to explore their potential effects in colorectal cancer. The differences in immune infiltrating cells, immune checkpoints, and m6A-related genes between the high and low risks of the prediction model were analyzed. Ferroptosis synergistically improves immune checkpoint inhibitors. The immunogenic form of cell death is characterized by the release of immune stimulation, including injury-associated molecular patterns (DAMPs).19 These molecular adjuvants help to activate the antigen-presenting cells and devour the cancer cells.22 Very few scientific studies discussed the Immune checkpoint of CD160, TNFRSF18, CD27, PDCD1, CD200R1, ADORA2A, TNFRSF14, LAIR1, CD244, CD40, TNFRSF4, CD70, TNFSF14, TNFRSF25, CD276, HHLA2, VTCN1, LAG3, TNFSF18 and ferroptosis-related LncRNAs. Upregulating ALMS1-IT1 can trigger the cyclin-dependent kinase pathway, promoting the malignant progression of lung adenocarcinoma (LUAD). LINC01857 regulates miR-141-3p/MAP4K4 in diffuse large B-cell lymphoma,20 increases PI3K/mTOR pathway activity in DLBCL, enhances the metastatic ability of gastric cancer cells, and leads to poor prognosis in patients,21 which can also lead to glioma, breast cancer, and other tumors. Previous studies have shown that LINC01857 promotes H3K27AC and CREB1 transcriptional expression by increasing CREBBP aggregation in the CREB1 promoter region,22 promoting breast cancer progression. HHLA2(B7H7/B7-H5/B7y) is a newly discovered B7 family member that regulates the function of human T cells.23 HHLA2 in the high-risk group was lower than in the low-risk group (Figure 8B, P<0.05). HHLA2 has an immunosuppressive reaction in the tumor microenvironment. The expression of HHLA2 is closely related to two related prognostic factors - clinic stage and lymph node-positive.23 At the same time, T cells (CD8 +, Tregs, CD4 + central memory, and CD4 + effect memory) significantly increased in the high-risk group. In immune cell functions, T cell co inhibition is active in high-risk groups. Treg infiltration, T cell activation, and survival in the tumor microenvironment leads to individual differences in the prognosis of patients with colorectal cancer. In contrast, the expression level of METTL3 in the high-risk group was substantially higher than in the low-risk group (Figure 9, P<0.05). Evidence shows that METTL3 can regulate the translation efficiency of various oncogenes and promote the proliferation and invasion of lung cancer cells.24
Ferroptosis is a newly discovered mechanism of cell death, which is likely to give a new insight into cancer treatment strategy.25 This scientific research explores the biomarkers of ferroptosis that could predict and analyze colorectal cancer, which could benefit cancer treatment exploration. Nevertheless, if the conditions are permitted, it would be perfect and essential to verify the prognosis prediction model established in this study.
Conclusion
15 kinds of lncRNAs with different expressions (AP003555.1, AC099850.3, AL031985.3, LINC01857, STPG3-AS1, AL137782.1, AC124067.4, AC012313.5, AC083900.1, AC010973.2, ALMS1-IT1, AC013652.1, AC133540.1, AP006621.2, AC018653.3) were closely associated with poor prognosis of colorectal cancer. These indicators were significantly correlated with OS rate and could be used as prognostic evaluation criteria.
Ethics Approval
As for human datasets TCGA-COAD and TCGA-READ datasets, we re-analyzed the open-access sections, and the local or original ethics committees required no ethical approval.
Acknowledgment
Thanks to Zhao’s team (Official Wechat Account: SCIPhD) of ShengXinZhuShou for suggestions and English editing on the manuscript.
Disclosure
The authors have declared no conflicts of interest.
References
1. Dekker E, Tanis PJ, Vleugels JLA, Kasi PM, Wallace MB. Colorectal cancer. Lancet. 2019;394:1467–1480. doi:10.1016/S0140-6736(19)32319-0
2. Smith KM, Desai J. Nivolumab for the treatment of colorectal cancer. Expert Rev Anticancer Ther. 2018;18:611–618. doi:10.1080/14737140.2018.1480942
3. Gamage SMK, Lee KTW, Dissabandara DLO, Lam AK, Gopalan V. Dual role of heme iron in cancer; promotor of carcinogenesis and an inducer of tumor suppression. Exp Mol Pathol. 2021;120:104642. doi:10.1016/j.yexmp.2021.104642
4. Cai HJ, Zhuang ZC, Wu Y, et al. Development and validation of a ferroptosis-related lncRNAs prognosis signature in colon cancer. Bosn J Basic Med Sci. 2021;21(5):569–576. doi:10.17305/bjbms.2020.5617
5. Lu SR, Li Q, Lu JL, Liu C, Xu X, Li JZ. Long non-coding RNA LINC01503 promotes colorectal cancer cell proliferation and invasion by regulating miR-4492/FOXK1 signaling. Exp Ther Med. 2018;16:4879–4885. doi:10.3892/etm.2018.6775
6. Zou Y, Yao S, Chen X, et al. LncRNA OIP5-AS1 regulates radioresistance by targeting DYRK1A through miR-369-3p in colorectal cancer cells. Eur J Cell Biol. 2018;97:369–378. doi:10.1016/j.ejcb.2018.04.005
7. Zhou N, Bao J. FerrDb: a manually curated resource for regulators and markers of ferroptosis and ferroptosis-disease associations. Database. 2020;2020:baaa021. doi:10.1093/database/baaa021
8. Chen B, Khodadoust MS, Liu CL, Newman AM, Alizadeh AA. Profiling tumor-infiltrating immune cells with CIBERSORT. Methods Mol Biol. 2018;1711:243–259.
9. Yoshihara K, Shahmoradgoli M, Martínez E, et al. Inferring tumor purity and stromal and immune cell admixture from expression data. Nat Commun. 2013;4:2612. doi:10.1038/ncomms3612
10. Shi J, Jiang D, Yang S, et al. LPAR1, correlated with immune infiltrates, is a potential prognostic biomarker in prostate cancer. Front Oncol. 2020;10:846. doi:10.3389/fonc.2020.00846
11. Ye L, Zhang T, Kang Z, et al. Tumor-infiltrating immune cells act as a marker for prognosis in colorectal cancer. Front Immunol. 2019;10:2368. doi:10.3389/fimmu.2019.02368
12. Li T, Fan J, Wang B, et al. TIMER: a web server for comprehensive analysis of tumor-infiltrating immune cells. Cancer Res. 2017;77:e108–e110. doi:10.1158/0008-5472.CAN-17-0307
13. Sepulveda JL. Using R and bioconductor in clinical genomics and transcriptomics. J Mol Diagn. 2020;22:3–20. doi:10.1016/j.jmoldx.2019.08.006
14. Van Calster B, Wynants L, Verbeek JFM, et al. Reporting and interpreting decision curve analysis: a guide for investigators. Eur Urol. 2018;74:796–804. doi:10.1016/j.eururo.2018.08.038
15. Si X, Zang R, Zhang E, et al. LncRNA H19 confers chemoresistance in ERα-positive breast cancer through epigenetic silencing of the pro-apoptotic gene BIK. Oncotarget. 2016;7(49):81452–81462. doi:10.18632/oncotarget.13263
16. Kopp F, Mendell JT. Functional classification and experimental dissection of long noncoding RNAs. Cell. 2018;172:393–407. doi:10.1016/j.cell.2018.01.011
17. Yan P, Luo S, Lu JY, Shen X. Cis- and trans-acting lncRNAs in pluripotency and reprogramming. Curr Opin Genet Dev. 2017;46:170–178. doi:10.1016/j.gde.2017.07.009
18. Yao J, Chen X, Liu X, Li R, Zhou X, Qu Y. Characterization of a ferroptosis and iron-metabolism related lncRNA signature in lung adenocarcinoma. Cancer Cell Int. 2021;21:340. doi:10.1186/s12935-021-02027-2
19. Ahmed A, Tait SWG. Targeting immunogenic cell death in cancer. Mol Oncol. 2020;14:2994–3006. doi:10.1002/1878-0261.12851
20. Li Q, Li B, Lu CL, Wang JY, Gao M, Gao W. LncRNA LINC01857 promotes cell growth and diminishes apoptosis via PI3K/mTOR pathway and EMT process by regulating miR-141-3p/MAP4K4 axis in diffuse large B-cell lymphoma. Cancer Gene Ther. 2021;28(9):1046–1057. doi:10.1038/s41417-020-00267-4
21. Chen GR, Sun W, Zheng K, Zhu W. LINC01857 promotes the development of gastric cancer by regulating microRNA-200b. Eur Rev Med Pharmacol Sci. 2020;24:3648–3656. doi:10.26355/eurrev_202004_20827
22. Xiong Y, Gu Y, Wang F, et al. LINC01857 as an oncogene regulates CREB1 activation by interacting with CREBBP in breast cancer. J Cell Physiol. 2019;234:14031–14039. doi:10.1002/jcp.28090
23. Janakiram M, Chinai JM, Fineberg S, et al. Expression, clinical significance, and receptor identification of the newest B7 family member HHLA2 protein. Clin Cancer Res. 2015;21(10):2359–2366. doi:10.1158/1078-0432.CCR-14-1495
24. Lin S, Choe J, Du P, Triboulet R, Gregory RI. The m(6)A methyltransferase METTL3 promotes translation in human cancer cells. Mol Cell. 2016;62(3):335–345. doi:10.1016/j.molcel.2016.03.021
25. Yuan Y, Ni S, Zhuge A, Li B, Li L. Iron regulates the Warburg effect and ferroptosis in colorectal cancer. Front Oncol. 2021;11:614778. doi:10.3389/fonc.2021.614778
 © 2022 The Author(s). This work is published and licensed by Dove Medical Press Limited. The
full terms of this license are available at https://www.dovepress.com/terms
and incorporate the Creative Commons Attribution
- Non Commercial (unported, 3.0) License.
By accessing the work you hereby accept the Terms. Non-commercial uses of the work are permitted
without any further permission from Dove Medical Press Limited, provided the work is properly
attributed. For permission for commercial use of this work, please see paragraphs 4.2 and 5 of our Terms.
© 2022 The Author(s). This work is published and licensed by Dove Medical Press Limited. The
full terms of this license are available at https://www.dovepress.com/terms
and incorporate the Creative Commons Attribution
- Non Commercial (unported, 3.0) License.
By accessing the work you hereby accept the Terms. Non-commercial uses of the work are permitted
without any further permission from Dove Medical Press Limited, provided the work is properly
attributed. For permission for commercial use of this work, please see paragraphs 4.2 and 5 of our Terms.