")
Back to Journals » Journal of Hepatocellular Carcinoma » Volume 11
LncRNA MEG3 Reduces the Ratio of M2/M1 Macrophages Through the HuR/CCL5 Axis in Hepatocellular Carcinoma
Authors Wei H, Wu X, Huang L, Long C, Lu Q, Huang Z, Huang Y, Li W, Pu J
Received 9 November 2023
Accepted for publication 7 February 2024
Published 11 March 2024 Volume 2024:11 Pages 543—562
DOI https://doi.org/10.2147/JHC.S449090
Checked for plagiarism Yes
Review by Single anonymous peer review
Peer reviewer comments 2
Editor who approved publication: Dr Ahmed Kaseb
Huamei Wei,1,* Xianjian Wu,2,* Lizheng Huang,3,* Chen Long,3 Qi Lu,3 Zheng Huang,3 Yanyan Huang,3 Wenchuan Li,2 Jian Pu2
1Department of Pathology, Affiliated Hospital of Youjiang Medical University for Nationalities, Baise, Guangxi, People’s Republic of China; 2Department of Hepatobiliary Surgery, Affiliated Hospital of Youjiang Medical University for Nationalities, Baise, Guangxi, People’s Republic of China; 3Graduate College of Youjiang Medical University for Nationalities, Baise, Guangxi, People’s Republic of China
*These authors contributed equally to this work
Correspondence: Jian Pu, Affiliated Hospital of Youjiang Medical University for Nationalities, No. 18 Zhongshan Two Road, Baise, Guangxi, 533000, People’s Republic of China, Email [email protected]
Objective: Tumor-associated macrophages play a crucial role in the development of hepatocellular carcinoma (HCC). Our study aimed to investigate the relationship between long coding RNA (lncRNA) maternally expressed gene 3 (MEG3), RNA-binding protein human antigen R (HuR), and messenger RNA C–C motif chemokine 5 (CCL5) in the modulation of M1 and M2 macrophage polarization in HCC.
Methods: To induce M1 or M2 polarization, LPS/IFNγ- or IL4/IL13 were used to treat bone marrow derived macrophages (BMDMs). The localization of MEG3 in M1 and M2 macrophages was assessed using fluorescence in situ hybridization assay. Expression levels of MEG3, HuR, CCL5, M1, and M2 markers were measured by RT-qPCR or immunofluorescence staining. Flow cytometry was performed to determine the proportion of F4/80+CD206+ and F4/80+CD68+ cells. RNA pulldown assay was performed to detect the binding of lncRNA MEG3 and HuR. The impacts of HuR on CCL5 stability and activity of CCL5 promoter were evaluated using actinomycin D treatment and luciferase reporter assay. Cell migration, invasiveness, and angiogenesis were assessed using transwell migration and invasion assays and a tube formation assay. A mixture of Huh-7 cells and macrophages were injected into nude mice to explore the effect of MEG3 on tumorigenesis.
Results: MEG3 promoted M1-like polarization while dampening M2-like polarization of BMDMs. MEG3 bound to HuR in M1 and M2 macrophages. HuR downregulated CCL5 by inhibiting CCL5 transcription in macrophages. In addition, overexpression of MEG3 suppressed cell metastasis, invasion, and angiogenesis by obstructing macrophage M2 polarization. MEG3 inhibited tumorigenesis in HCC via promotion of M1-like polarization and inhibition of M2-like polarization. Rescue experiments showed that depletion of CCL5 in M2 macrophages reversed MEG3-induced suppressive effect on cell migration, invasion, and tube formation.
Conclusion: MEG3 suppresses HCC progression by promoting M1-like while inhibiting M2-like macrophage polarization via binding to HuR and thus upregulating CCL5.
Keywords: hepatocellular carcinoma, maternally expressed gene 3, macrophage polarization, human antigen R, C-C motif chemokine 5
Introduction
Hepatocellular carcinoma (HCC) ranks sixth among the most common malignant tumors worldwide.1 Metastasis and recurrence are two main factors obstructing HCC treatment.2 Tumor microenvironment (TME) contributes to tumor tissue formation, metastasis, and survival by harboring tumor cells.3–5 Despite cancer cells, TEM is also formed by immune cells, endothelial cells, stromal cells, and cancer-associated fibroblasts.6 Tumor-associated macrophages (TAMs) are main components of the TME and are associated with the survival of patients diagnosed with HCC.7 Monocytes produced in the bone marrow or spleen infiltrate tumors and differentiate into TAMs.8 Under different stimulations, monocytes differentiate into macrophages with antitumor property (M1-like) or tumor promoting capacity (M2-like). Macrophages with an M2-like phenotype promote tumor growth by reducing cytotoxic cell populations such as natural killer cells and CD8+ T cells.8 At present, main interventions for TAM-based antitumor therapy include inhibiting macrophage recruitment, enhancing M1 antitumor activity, suppressing M2 tumor-promoting activity, and inducing TAM apoptosis and death.8 Previous studies have revealed that HCC in C4 subtype is characterized by enrichment of M2 macrophages and inhibition of the Th1 CD4+ T cell response.9,10 D-lactate remodels immunosuppressive TME in HCC by transforming M2 TAMs to M1.11 Therefore, targeting the function and polarization of TAM can be developed as effective therapeutic strategies against HCC.
Long non-coding RNAs (lncRNAs) are a class of ncRNAs (>200 nucleotides) without protein-coding ability because of their lack of reading structures of indispensable length.12 Substantial evidence has demonstrated the vital roles of lncRNAs in the regulation of a variety of cellular biological behaviors such as cell invasiveness, glycolysis, growth, and migration.13 Many lncRNAs, such as DUBR,14 MAPKAPK5-AS1,15 lnc-CTHCC,16 and GASAL1,17 have been validated as oncogenes in HCC. Additionally, lncRNAs can promote macrophage recruitment to influence angiogenesis and metastasis in different types of cancers, including HCC.18–20 The regulatory effects of lncRNAs on the expression of genes have been found at both transcriptional and post-transcriptional levels, through which they are implicated in the pathogenesis of human diseases, including cancers.21–23 For example, lncRNA HMMR-AS1 facilitates HCC progression by promoting M2 polarization of macrophages and targeting the miR-147a/ARID3A axis.18 LINC00662 promotes M2 macrophage polarization via the activation of Wnt/β-catenin signaling in HCC.24 LncRNA maternally expressed gene 3 (MEG3) is widely distributed in the breast, spleen, ovary, placenta, adrenal gland, and brain and is downregulated in gallbladder cancer,25 liver cancer,26 lung cancer,27 and oral cancer.28 In addition, silencing of MEG3 has been shown to promote drug resistance in various malignancies.29,30 Although the suppressive effect of MEG3 on HCC has been demonstrated in both in vivo and in vitro studies,31 whether MEG3 exerts its function by participating in the interaction between HCC cells and macrophages remains unknown.
Human antigen R (HuR) is also known as embryonic lethal abnormal vision-like 1 (ELAVL1). As an RNA-binding protein (RBP), HuR plays a vital regulatory role at the post-transcriptional level in multiple carcinomas32,33 and has the potential to be a therapeutic target for liver diseases.34 LncRNA ADORA2A-AS1 has been demonstrated to restrain HCC progression by competitively binding to HuR and thus altering FSCN1 expression and inactivating PI3K/Akt signaling.35 LncRNA MALAT1 and HuR binds to CD133 promoter region to regulate CD133 expression and hinders epithelial–mesenchymal transition (EMT) in breast cancer.36 Bioinformatics analysis revealed that MEG3 has a binding site with HuR, and lncRNA MEG3 was previously reported to bind to HuR and thus regulate M1 polarization of microglia in acute spinal cord injury.37 Therefore, we inferred that MEG3 might participate in macrophage polarization by binding to HuR in HCC cells.
Chemokine (C–C motif) ligand 5 (CCL5) belongs to the CC subfamily of chemokines.38 CCL5, also known as RANTES, acts as a chemokine to participate in inflammation and immune response. It is a double-edged sword in cancer. On the one hand, CCL5 augments anticancer immunity by recruiting anti-tumor T cells, macrophages, and dendritic cells to the tumor microenvironment. On the other hand, CCL5 can work together with CCR5 to promote tumor progression through diverse mechanisms.39 Bioinformatics analysis reveals that low CCL5 expression correlates to poor prognosis in patients with liver cancer, which implies the anti-cancer role of CCL5 in liver cancer. HuR has been reported to weaken CCL5 expression by inhibiting CCL5 transcription in breast cancer, thereby hampering the recruitment of macrophages into tumor spheroids.40 Therefore, the correlation between HuR and CCL5 was also investigated in the present study through exploring the effect of HuR on CCL5 mRNA expression and stability in macrophages.
Consequently, the present study aims to investigate the role of lncRNA MEG3 in macrophage polarization and HCC cell behavior. In vivo studies were carried out to evaluate the influence of macrophages and MEG3 alteration on tumorigenesis in HCC. This study may provide a potential therapeutic strategy for the prevention and treatment of HCC.
Materials and Methods
Cell Culture
Human HCC cell line Huh-7 (HTX2559C, iCell, Shenzhen, China) and human umbilical vein endothelial cells (HUVECs; 354,151, Nan Ying Science, Hangzhou, China) were maintained in a humidified 37 °C incubator with 5% carbon dioxide. Cells without mycoplasma contamination were cultured in Dulbecco’s modified Eagle’s medium (DMEM; iCell-128-0001, iCell, Shanghai, China) containing 10% fetal bovine serum (FBS; SH30406.02IR30-45, Hyclone, BIOCREATIVE, Beijing, China) and 1% penicillin/streptomycin (Sigma-Aldrich, St. Louis, USA).
Isolation and Differentiation of Bone Marrow Derived Macrophages (BMDMs)
The preparation of BMDM from mice was performed as previously described.41,42 C57BL/6 mice (Cavens Biotechnology, Changzhou, China), aged 12 weeks, were sterilized with 75% ethanol after sacrifice via cervical dislocation. The muscle and skin tissues from the bones of the hind legs were removed before cutting the bones from both ends. A 5-mL syringe was used to wash the bones with the medium. BMDMs were obtained after culturing bone marrow cells in DMEM containing 10% FBS and treated with 50 ng/mL M-CSF. Animal experiments were approved by the Affiliated Hospital of Youjiang Medical University for Nationalities (YYFY-LL-2022-112). Animals were maintained following the Guide for the Care and Use of Laboratory Animals formulated by the National Institutes of Health.
Cell Transfection
Adenoviruses that contain short hairpin RNA targeting MEG3 (Adv-sh-MEG3), HuR (sh HuR1/2), or CCL5 (Adv-sh-CCL5) were transfected into BMDMs to knockdown MEG3, HuR, or CCL5 expression. The adenovirus containing full sequence of MEG3 was utilized to amplify MEG3 expression. These plasmids and their corresponding controls (Adv-sh-NC, Adv-NC, and shctrl) were synthesized by GenePharma (Shanghai, China) and were transfected into BMDMs at a concentration of 50 nmol. Cell transfection was performed with Lipofectamine 2000 (Invitrogen, Carlsbad, USA) for 48 h.
RNA Isolation and Reverse Transcription Quantitative Polymerase Chain Reaction (RT-qPCR) Analysis
Total RNA was extracted from BMDMs using TRIzol Reagent (19201ES60; Yeasen, Shanghai, China), and cDNA was synthesized by reverse transcribing 1 μg of RNA in a final volume of 20 μL using a Reverse Transcription Kit (Takara, Japan). The qPCR was performed using SYBR Premix Ex Taq (Takara) on Applied Biosystems 7500 (Thermo Fisher, Foster City, USA) under thermocycling conditions of 95 °C for 5 min, followed by 45 cycles of 95 °C for 10s and 55 °C for 30s. Relative gene expression was calculated using the 2−ΔΔCT method and normalized to the internal reference, glyceraldehyde 3-phosphate dehydrogenase (GAPDH).43 The sequences of primers are shown in Table 1.
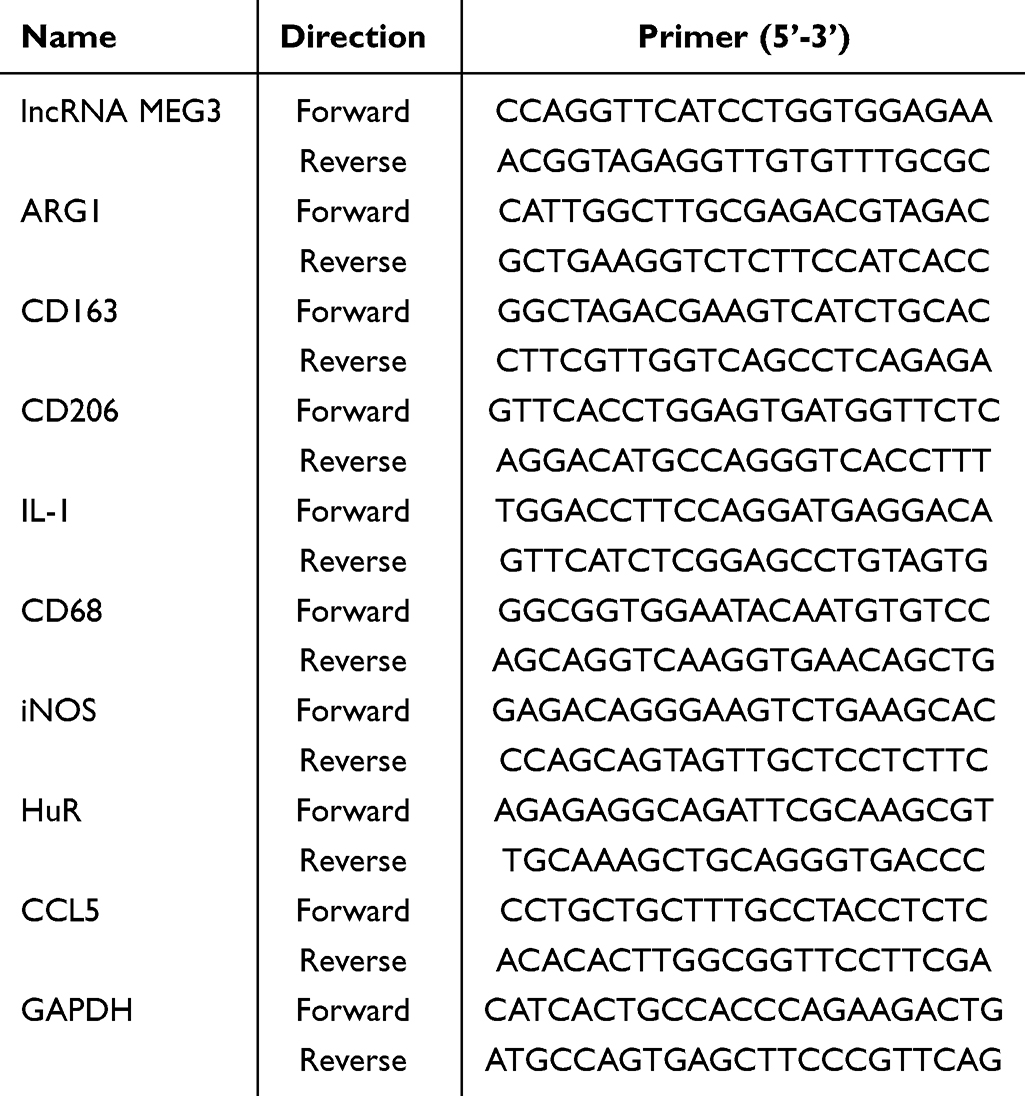 |
Table 1 Primer Sequence Used in This Study |
Conditioned Medium Collection
Macrophage polarization was induced by treating BMDMs with 10 ng/mL of IL4/IL13 (M2 macrophage polarization) or 10 ng/mL of LPS/IFNγ (M1 macrophage polarization) for 48 h. Then, polarized BMDMs were incubated with serum-free medium for 24 h. After that, supernatants of the serum-free medium were collected as conditioned medium. The conditioned medium was stored at −80°C until use.
Flow Cytometry
Digested BMDMs (5 × 10⁴) were collected and blocked with 3% bovine serum albumin. These cells were incubated with FITC-conjugated F4/80 (#ab60343, 1/100, Abcam, Cambridge, UK), PE-conjugated CD68 (#ab216701, 1/1000, Abcam), or PE-conjugated CD206 (#MR5D3, 1/100, Thermo Fisher) according to the manufacturer’s instructions.
Fluorescence in situ Hybridization (FISH) Assay
After being fixed with 4% paraformaldehyde for 15 min, the cells were rinsed with phosphate buffered saline (PBS) and permeabilized with Triton X-100 (0.4%, 15 min), followed by incubation with a prehybridization buffer. Hybridization buffer warmed to 37 °C was used to replace the prehybridization buffer and mixed with FISH probes of lncRNA MEG3. Next, cell incubation was performed at room temperature in a humidified incubator overnight. The chamber was rinsed thrice with 4×SSC (0.068 M citric acid, 0.6 M NaCl, pH 7.0) in darkness followed by DAPI staining of nuclei for 10 min away from light. Images of the cells were captured using a confocal microscope (FV1000; Olympus, Tokyo, Japan).
RNA Pull-Down Assay
Biotin-labelled probes for MEG3 sense (Bio-MEG3 sense) and MEG3 antisense (Bio-MEG3 antisense) were synthesized by Sangon Biotech (Shanghai, China). Probes were transfected at a concentration of 50 nM into M1- and M2-like macrophages for 48 h. Cells were lysed in specific lysis buffer, and the harvested cell lysate was incubated at 4 °C with M-280 streptavidin magnetic beads (11205D, Invitrogen) overnight. The beads were rinsed twice with a precooled lysis buffer, and the precipitated proteins were quantified by Western blot analysis.
Western Blot Analysis
BMDMs were lysed with radio immunoprecipitation lysis buffer supplemented with protease inhibitors to extract total proteins, and protein contents were quantified with bicinchoninic acid method. Next, the proteins were electrophoresed using 10% sodium dodecyl sulfate polyacrylamide gels and transferred into polyvinylidene fluoride membranes (200 mA, 1.5 h). The membrane was blocked at room temperature in 5% nonfat milk powder for 60 min. The membrane was rinsed with Tris buffered saline with Tween-20 three times (5 min each) and then probed at 4 °C with primary antibodies, including anti-HuR (ab200342, 1:1000), anti-nucleolin (ab129200, 1:10,000), anti-CCL5 (ab189841, 1:2000), and anti-β-actin (ab115777, 1:200), overnight with slow shaking. After washing with TBST three times (5 min/wash), HRP Anti-Rabbit IgG secondary antibody (ab288151, 1:2000) was added and the membrane was incubated for 1 h. All antibodies were purchased from Abcam, Inc. (Cambridge, UK). Proteins were visualized using a chemiluminescence detection system (Pierce, Rockford, USA). The gray value of each target protein was quantified using ImageJ software (NIH, USA) with normalization to the loading control β-actin.
Luciferase Reporter Assay
BMDMs with M1- or M2-like polarization were co-transfected with the pGL3-basic vector containing the CCL5 core promoter and pRL-SV40 using Rotifect (Carl Roth GmbH, Karlsruhe, Germany) according to the manufacturer’s instructions. Forty-eight hours later, cells were lysed and the activities of Renilla and firefly luciferase activities were determined using a Dual Luciferase assay kit (Promega, Mannheim, Germany). Firefly luciferase activity was normalized to the Renilla luciferase activity.
Transwell Assay
Transwell assays were performed using a 24-well Transwell chamber pre-coated with (Transwell invasion assay) or without (Transwell migration assay) Matrigel (M3870, Solarbio, Beijing, China). Transwell membranes (8 μm pore size, Corning Incorporated, Corning, USA) were used to separate the Transwell chambers for both assays. Huh-7 cells (2 × 10⁵) were inoculated into the upper chamber, and the culture medium (500 μL) supplemented with 10% FBS was added to the bottom chamber. Forty-eight hours later, 4% paraformaldehyde was used for filter fixation, and the cells on the upper side of the membrane were removed with cotton swabs. The cells that migrated or invaded the bottom chamber were stained with crystal violet (Sigma Aldrich, St. Louis, USA) and photographed in five randomly selected fields. The number of migrated or invaded cells was then counted.
Tube Formation Assay
HUVECs were plated at a density of 3×10⁵ cells/well in 12-well plates and incubated at 37 °C with Matrigel (500 µL) for 2 h. HUVECs were cultured for 6 h in abovementioned conditioned medium containing IL4/IL13-treated BMDMs, and the number of tubes formed was determined after photographing six randomly selected optical fields from each well.
In vivo Assay
BALB/c nude mice (18 ± 3 g, 7-week-old) were purchased from Beijing Vital River Laboratory Animal Technology Co., Ltd. (Beijing, China). All animal experiments were approved by the Affiliated Hospital of Youjiang Medical University for Nationalities (YYFY-LL-2022-112) and performed according to the Guide for the Care and Use of Laboratory Animals formulated by the National Institutes of Health. Eighteen mice were randomly assigned to three groups (n = 6/group): Huh-7, Huh-7 + BMDMs + Adv-NC, and Huh-7 + BMDMs + Adv-MEG3. In the first group, Huh-7 cells (1 × 10⁶) were subcutaneously planted into the armpits of mice. In the last two groups, Huh-7 cells (1 × 10⁶) were mixed with BMDMs (3 × 10⁶) containing Adv-NC or Adv-MEG3 and then implanted into mice in the same way. Thirty days later, body weight was recorded, and then mice were sacrificed via anesthesia and cervical dislocation. Then, the tumor tissues were collected from the mice and weighed.
Immunofluorescent Staining
The harvested tumor tissues were rinsed with PBS and fixed with 4% paraformaldehyde for 24 h. Thirty percent sucrose was used for tumor tissue dehydration at 4 °C overnight. The dehydrated tissues were frozen in an optimal cutting temperature compound and sliced into 8-mm sections. Next, tumor tissues were stained with anti-CD206 (24,595, 1:500, Cell signaling, Danvers, USA) and anti-CD68 (97,778, Cell signaling) at 4°C overnight. The sections were then incubated at 37 °C with secondary antibody for 60 min. Slides were observed under an inverted fluorescence microscope (FSX100; Olympus).
Bioinformatical Analysis
The potential RNA binding proteins that may be regulated by lncRNA MEG3 were predicted with ENCORI databases (http://starbase.sysu.edu.cn/index.php) with the screening criteria of clipExpNum≥3. The expression of lncRNA MEG3 in liver hepatocellular carcinoma (LIHC) tissues and corresponding normal samples was analyzed using the GEPIA (http://gepia.cancer-pku.cn/) and ENCORI databases. Kaplan-Meier Plotter (http://kmplot.com/analysis/index.php?p=background) was used for survival analysis of LIHC patients with high or low gene (MEG3, HuR, and CCL5) expression. The expression correlation between MEG3 and CCL5 in LIHC samples was analyzed using GEPIA (http://gepia.cancer-pku.cn/).
Tissue Sampling
HCC tissues and non-tumor tissues were collected from 32 patients diagnosed with HCC and undergoing surgical resections in the Affiliated Hospital of Youjiang Medical University for Nationalities (YYFY-LL-2022-112). These patients had received neither radiotherapy nor chemotherapy before section. Written informed consent was obtained from all patients. The protocol used in the study was approved by the Affiliated Hospital of Youjiang Medical University for Nationalities Institutional Review Board. Pathological diagnostics were independently determined by two pathologists.
Statistical Analysis
GraphPad Prism 6 (GraphPad, La Jolla, USA) and SPSS 18.0 (SPSS, Armonk, USA) were used to analyze the experimental statistics from three biological and technical replications. Student’s t-test (comparison between two groups) or one-way analysis of variance followed by Turkey’s post hoc test (comparisons among multiple groups) were utilized to process the data. Experimental data are expressed as the mean ± standard deviation (SD). Statistical significance was deemed when p value was less than 0.05.
Results
LncRNA MEG3 is Dysregulated in M1 and M2 Macrophages
Bone marrow derived macrophages (BMDMs) were treated with 10 ng/mL LPS/IFNγ for 48 h to induce M1 subtype. The percentage of F4/80+CD68+ cells was significantly increased following LPS/IFNγ treatment, suggesting the effective induction of M1 macrophage polarization (Figure 1A). The expression of lncRNA MEG3 was detected using RT-qPCR analysis, which revealed that LPS/IFNγ induction led to a significant increase in lncRNA MEG3 expression compared to that in the control group (Figure 1B). These results imply that MEG3 may exert a potential function in M1 macrophage polarization. To further investigate the role of MEG3 in macrophage polarization, 10 ng/mL IL4/IL13 was used to treat BMDMs for 48 h to induce the M2 subtype. As shown in Figure 1C, IL4/IL13 treatment markedly increased the percentage of F4/80+CD206+ cells, demonstrating the successful induction of M2 macrophage polarization. In addition, after IL4/IL13 induction, MEG3 expression levels were considerably reduced compared with those in the control group (Figure 1D). Subsequently, FISH assays were performed to determine the expression and distribution of MEG3 in BMDMs. LPS/IFNγ elevated MEG3 expression in the cytoplasm of BMDMs in a time-dependent manner (Figure 1E and F). In contrast, IL4/IL13 suppressed the expression of MEG3 in the cytoplasm with the passage of time (Figure 1G and H). These data indicate that MEG3 is upregulated in M1 macrophages and downregulated in M2 macrophages, indicating the potential participation of MEG3 in macrophage polarization.
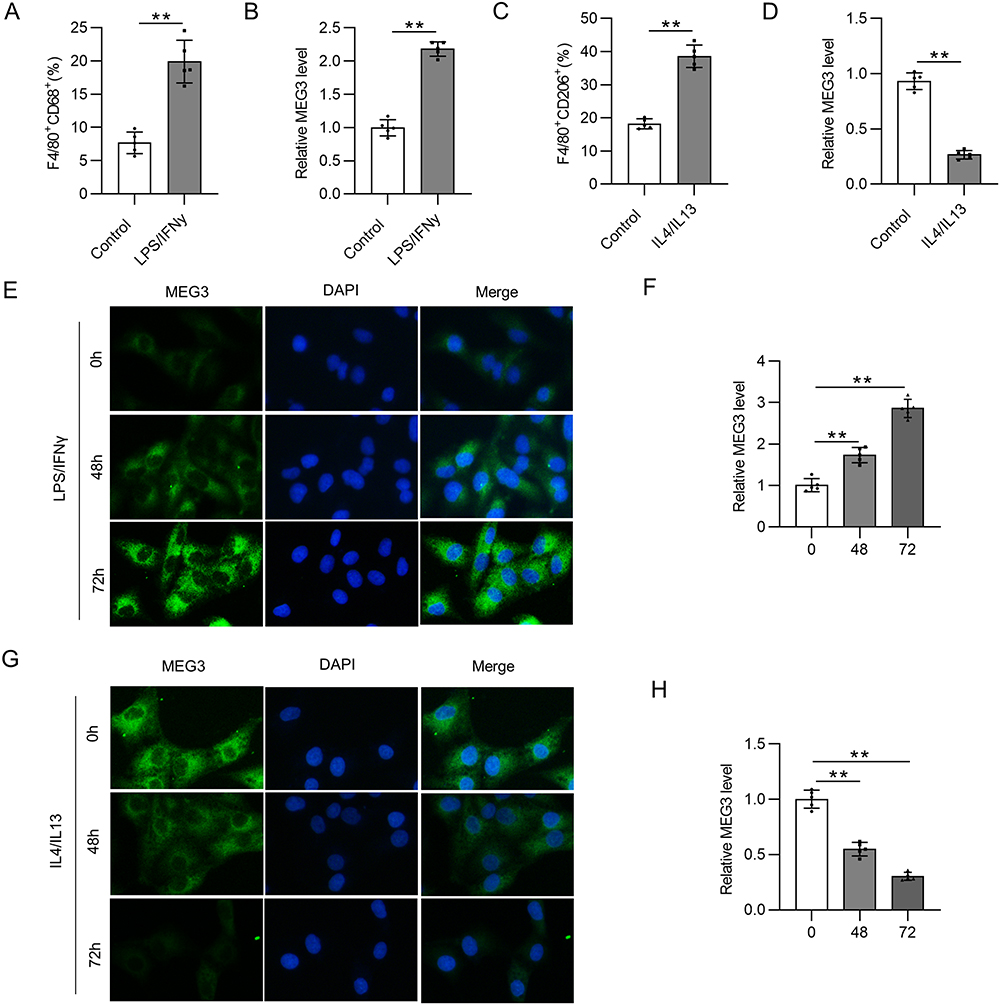 |
Figure 1 LncRNA MEG3 is engaged in the process of macrophage polarization. BMDMs were treated with 10 ng/mL LPS/IFNγ or IL4/IL13 for 48 h. (A) To assess M1 phenotype polarization after LPS/IFNγ treatment, flow cytometry was performed to calculate the percentage of F4/80+CD68+ cells in BMDMs. (B) Relative MEG3 level in LPS/IFNγ-treated BMDMs was quantified by RT-qPCR analysis. (C) To evaluate M2-like polarization of BMDMs after IL4/IL13 stimulation, the proportion of F4/80+CD206+ cells was analyzed using flow cytometry. (D) RT-qPCR was conducted to measure MEG3 expression in IL4/IL13-stimulated BMDMs. (E and F) MEG3 distribution and expression in LPS/IFNγ-treated BMDMs at 0, 48, and 72 h were tested by FISH. (G and H) At the three timepoints, MEG3 level in IL4/IL13-treated BMDMs was detected by FISH. **p<0.01. |
LncRNA MEG3 Overexpression Inhibits M2 Macrophage Polarization
To explore the biological function of lncRNA MEG3 in M2-like polarized macrophages, MEG3 was overexpressed in IL4/IL13-treated BMDMs through transfection of Adv-MEG3. As shown in Figure 2A, Adv-MEG3 transfection effectively augmented MEG3 levels in the Adv-MEG3 group relative to those in the Adv-NC group. The proportion of F4/80+CD206+ cells was elevated by IL4/IL13 treatment, and the trend was suppressed in response to MEG3 overexpression (Figure 2B and C). The results indicated the restraint of MEG3 to M2 macrophage polarization. To further confirm this finding, mRNA expression of M2 macrophage phenotype markers was examined. We found that M2 markers were highly expressed in IL4/IL13-treated BMDMs, and the alterations were reversed by overexpressed MEG3 (Figure 2D–F). These results suggest that MEG3 inhibits M2 macrophage polarization.
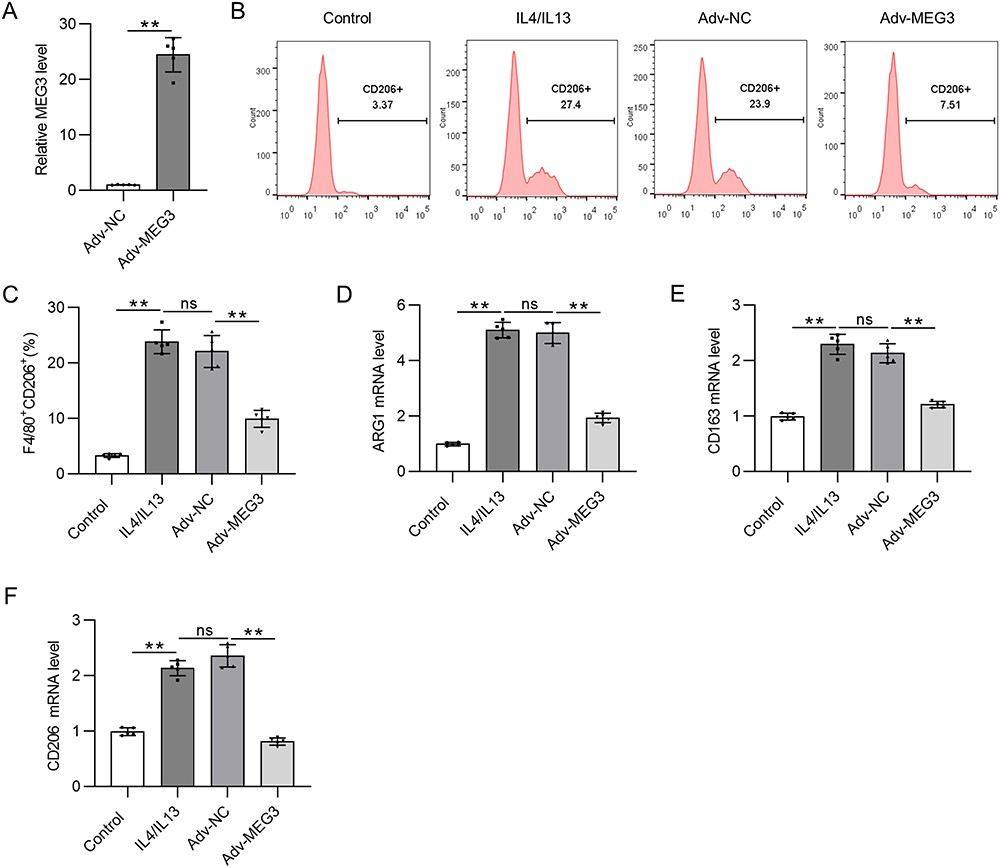 |
Figure 2 Overexpressed lncRNA MEG3 suppresses M2 macrophage polarization. BMDMs were transfected with Adv-MEG3/Adv-NC and treated with IL4/IL-13 to induce M2 polarization at the same time. (A) PCR analysis was performed to measure the overexpression efficiency of Adv-MEG3. (B and C) To evaluate M2 polarization, F4/80+CD206+ cell percentage was measured using flow cytometry analysis. (D–F) The mRNA levels of M2 polarization markers (ARG1, CD163, and CD206) in BMDMs were quantified by RT-qPCR. **p<0.01. Abbreviation: ns, not significant. |
LncRNA MEG3 Promotes M1 Macrophage Polarization
Since MEG3 is upregulated in M1-like polarized macrophages, Adv-sh-MEG3 was transfected to BMDMs treated with LPS/IFNγ to silence MEG3 expression and thus to explore the function of MEG3 in M1 macrophages. LPS/IFNγ treatment and Adv-sh-MEG3 transfection were performed at the same time. Figure 3A shows that Adv-sh-MEG3 successfully weakened MEG3 level in M1 macrophages. Silencing of lncRNA MEG3 resulted in a notable decrease in the percentage of F4/80+CD68+ cells compared to cell number in LPS/IFNγ + Adv-sh-NC group (Figure 3B and C). In addition, the upregulation of M1 markers (IL-1, CD68, and iNOS) mediated by LPS/IFNγ was countervailed by MEG3 deficiency (Figure 3D–F). These results imply that the silencing of MEG3 dampens M1 macrophage polarization. That is, MEG3 promotes M1 macrophage polarization.
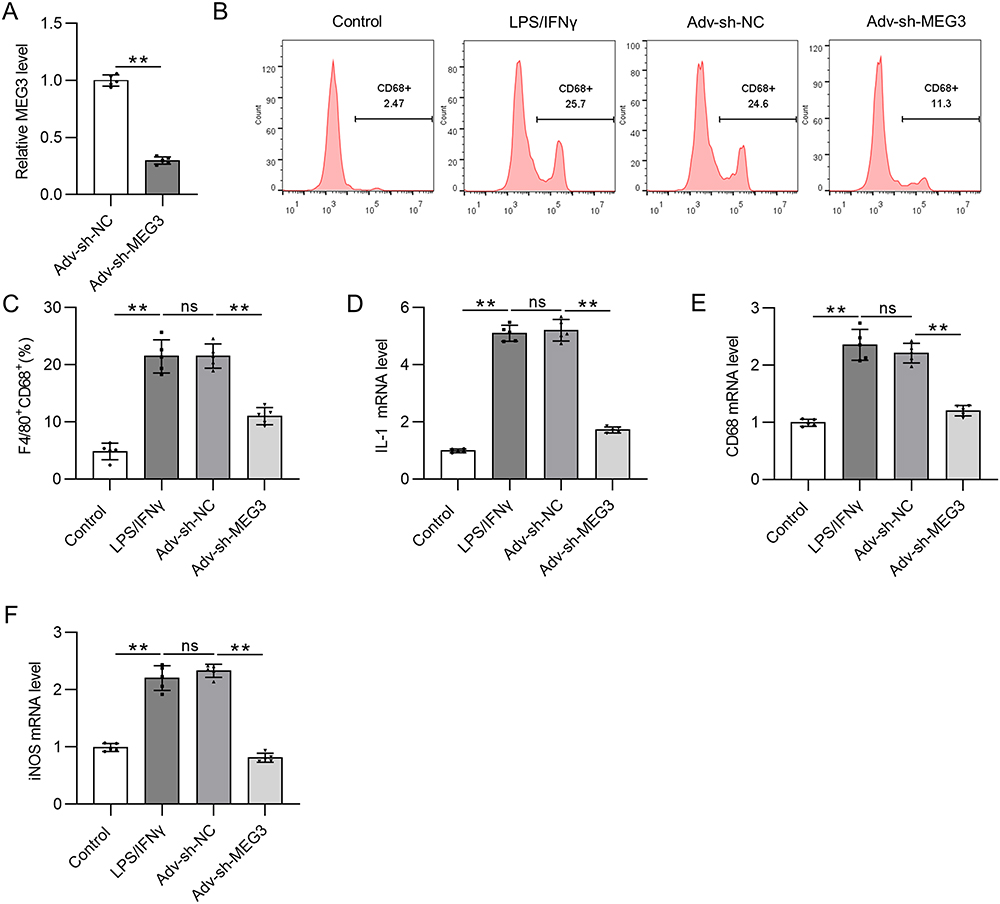 |
Figure 3 LncRNA MEG3 promotes M1 macrophage polarization. To induce M1 polarization, LPS/IFNγ was utilized to treat BMDMs. At the same time, BMDMs were transfected with Adv-sh-MEG3 or Adv-sh-NC to explore the impact of MEG3 on M1-like polarization. (A) The knockdown efficiency of Adv-sh-MEG3 in M1-phenotype BMDMs was tested by RT-qPCR. (B and C) To assess M1 macrophage polarization, flow cytometry was conducted to measure F4/80+CD68+ cell proportion. (D–F) The mRNA levels of M1 polarization markers (IL-1, CD68, and iNOS) in BMDMs of indicated groups were measured by PCR. **p<0.01. Abbreviation: ns, not significant. |
LncRNA MEG3 Binds to HuR in M1- and M2-Like Macrophages
It has been reported that lncRNAs can act as molecular scaffolds to modulate the expression of downstream genes by binding to different proteins.44 Therefore, the starBase website was searched to identify potential RBPs for MEG3. Under the search criterion of clipExpNum≥3, nine RBPs including HNRNPA2B1, TAF15, UPF1, MBNL2, IGF2BP2, ELAVL1, ADAR, DGCR8, and FUS were predicted as the candidate RBPs for lncRNA MEG3 (Figure 4A). ELAVL1/HuR is a ubiquitous RBP that can enhance mRNA stability and thus induce the expression of numerous lncRNAs,44 and can be regulated by lncRNA MEG3 in BV2 cells.37 An RNA pull-down assay was performed to detect the possible relationship between MEG3 and HuR. The results show that HuR was enriched in the Bio-MEG3 sense group relative to that in the Bio-MEG3 antisense group (Figure 4B), suggesting that MEG3 strongly binds to HuR in M1- and M2-polarized BMDMs. Moreover, upregulation of MEG3 significantly reduced HuR expression at both the mRNA and protein levels (Figure 4C and D). These data suggest that MEG3 directly binds to HuR and inversely regulates HuR expression in M1 and M2 macrophages.
 |
Figure 4 LncRNA MEG3 binds to HuR in BMDMs with M1 or M2 phenotype. (A) The potential RBPs regulated by lncRNA MEG3 were predicted using starBase database. ELAVL1 (also known as HuR) was identified. (B) RNA pulldown assay and Western blot were performed to validate the combination between HuR and MEG3 in BMDMs treated with IL4/IL13 (M2 phenotype) or LPS/IFNγ (M1 phenotype). (C) PCR was performed to measure the mRNA expression of HuR in M1 and M2 macrophages transfected with Adv-NC and Adv-MEG3. (D) HuR protein expression in Adv-NC and Adv-MEG3 groups was quantified by Western blot. **p<0.01. |
HuR Downregulates CCL5 by Inhibiting CCL5 Transcription in M1 and M2 Macrophages
lncRNAs have been shown to maintain mRNA stability by recruiting RBPs at the post-transcriptional level.37 HuR-repressed CCL5 transcription in breast cancer cells is mediated by an interferon-stimulated response element in the CCL5 promoter.40 Based on these findings, we hypothesized that MEG3 regulates CCL5 expression by interacting with HuR. To validate this hypothesis, HuR expression was silenced by transfection of shRNAs targeting HuR (sh HuR1/2) in BMDMs. RT-qPCR analysis revealed that both shRNAs considerably reduced HuR mRNA and protein expression in BMDMs (Figure 5A and B). Since sh HuR1 showed a more significant knockdown efficiency on HuR protein level, sh HuR1 was selected for the following experiments. As expected, CCL5 mRNA levels were elevated when HuR was depleted in BMDMs (Figure 5C). Actinomycin D was used to block de novo transcription to determine CCL5 mRNA stability. It was clearly observed that HuR deficiency did not affect CCL5 mRNA stability (Figure 5D). However, HuR depletion significantly enhanced CCL5 promoter activity compared to that in the sh-control group (Figure 5E). Therefore, we concluded that HuR suppresses CCL5 expression in BMDMs by repressing CCL5 transcription.
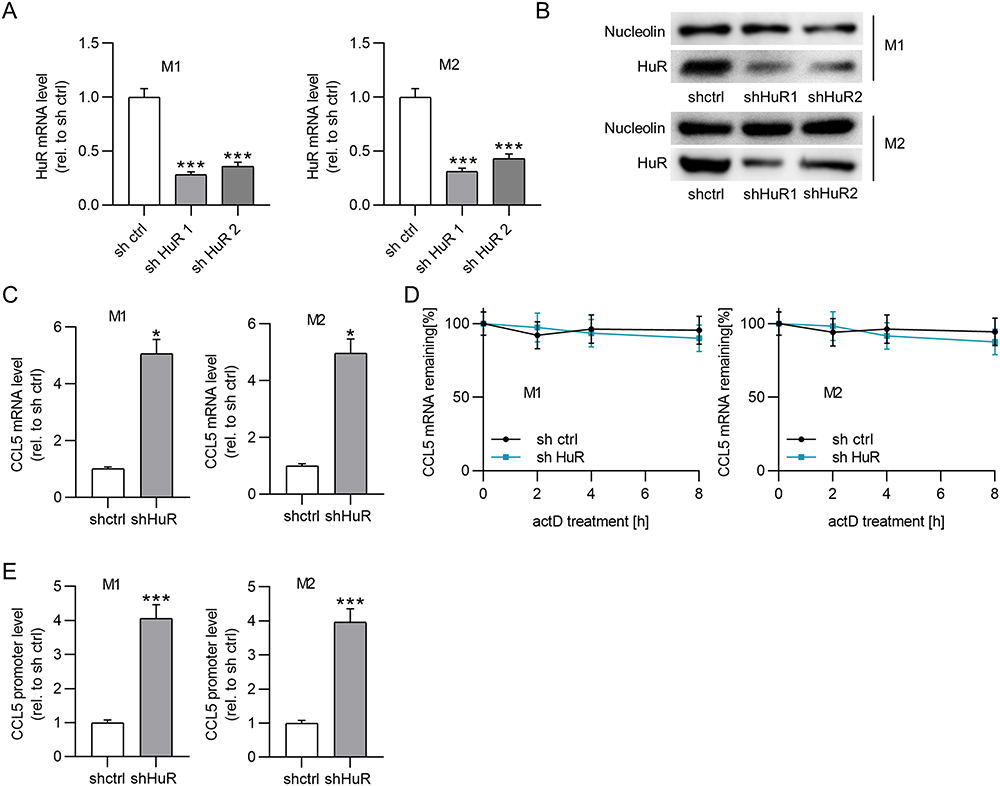 |
Figure 5 HuR reduces CCL5 expression by inhibiting CCL5 transcription. (A and B) PCR and Western blot were conducted to measure the knockdown efficacy of HuR in BMDMs treated with IL4/IL13 or LPS/IFNγ. (C) The effect of HuR depletion on CCL5 mRNA expression in M1 or M2 macrophages was measured by PCR. (D) The influence of HuR deficiency on CCL5 stability was evaluated by actD treatment. (E) Luciferase reporter assays were performed to detect the impact of HuR knockdown on the activity of CCL5 promoter. *p<0.05, ***p<0.001. |
Upregulation of lncRNA MEG3 Represses Cell Metastasis and Angiogenesis by Inhibiting Macrophage M2 Polarization
To confirm whether elevation of lncRNA MEG3 affected macrophage polarization to regulate HCC cellular behavior, a transwell migration assay was first conducted to assess the impact of macrophages and MEG3 on the migratory ability of tumor cells. BMDMs were treated with IL4/IL13 to induce M2 macrophage polarization and were transfected with Adv-MEG3 at the same time, followed by a collection of conditioned medium. Huh-7 cells were cultured in a conditioned medium for 48 h to determine the impact of lncRNA MEG3 on cancer cell migration. The results illustrated that M2 macrophage polarization enhanced the migratory and invasive abilities of Huh-7 cells, and the alteration was inhibited after transfection with Adv-MEG3 (Figure 6A–D). Additionally, the effect of MEG3 upregulation on angiogenesis was evaluated using a tube formation assay. As Figure 6E and F presented, the number of formed tubes was markedly increased in the context of M2 macrophage polarization, and the increase was suppressed by MEG3 overexpression. These results revealed that upregulation of lncRNA MEG3 hinders HCC cell migration, invasiveness, and angiogenesis by inhibiting macrophage M2 polarization.
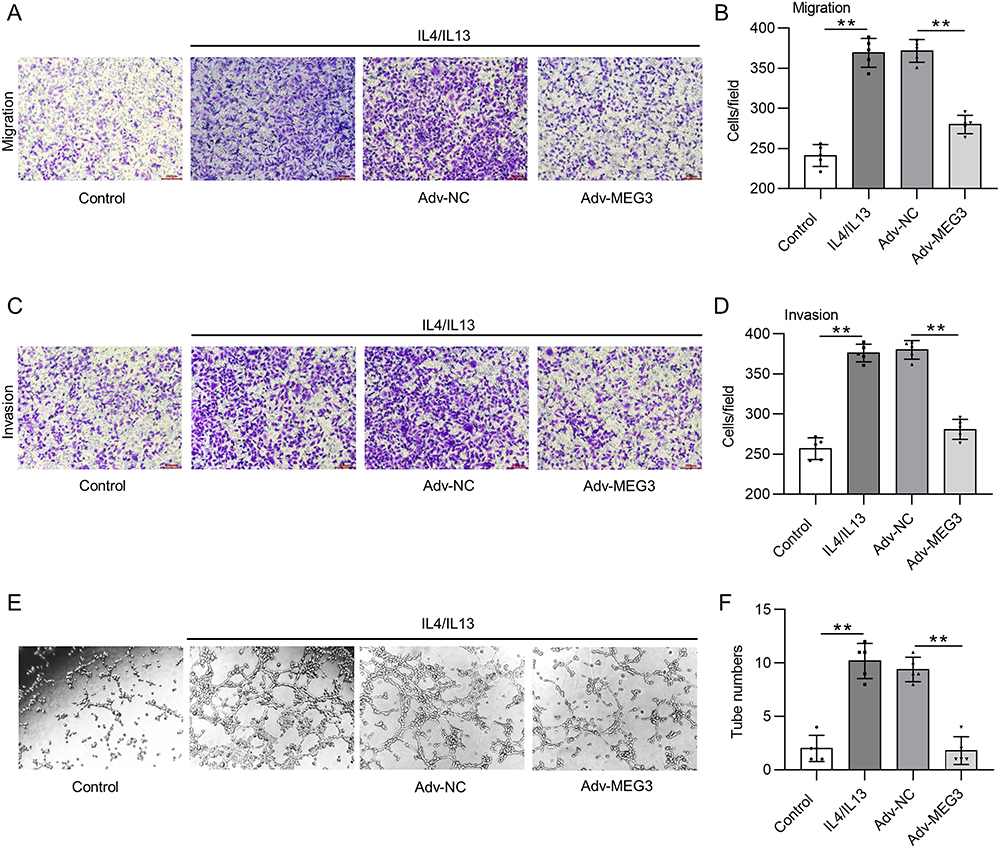 |
Figure 6 Upregulation of lncRNA MEG3 suppresses cell metastasis and angiogenesis by inhibiting macrophage M2 polarization. Conditioned medium from BMDMs was used to culture Huh-7 cells for 24 h. (A–D) Cell migration and invasiveness in control group, IL4/IL13 group, IL4/IL13 + Adv-NC group, and IL4/IL13 + Adv-MEG3 group were measured by Transwell assays. (E and F) Tube formation assays were conducted to evaluate angiogenesis in indicated groups, and formed tubes were quantified. **p<0.01. |
LncRNA MEG3 Overexpression Suppresses Tumorigenesis in vivo
In vivo experiments were carried out to investigate the influence of MEG3 overexpression and macrophage polarization on tumorigenesis in HCC. After BMDMs were transfected with Adv-MEG3 or Adv-NC, a mixture of BMDMs and Huh-7 cells was subcutaneously implanted into the armpits of nude mice for 30 days. The implantation of BMDMs containing Adv-NC markedly increased tumor size and weight in mice compared with those in mice only implanted with Huh-7 cells (Figure 7A and 7B). Meanwhile, overexpression of MEG3 in BMDMs led to decreased tumor size and weight compared with those in BMDMs + Adv-NC group (Figure 7A and B). The body weight was not significantly altered among three groups (Figure 7C). CD206 was upregulated in mice injected with Huh-7 cells and BMDMs containing ADV-NC compared with that in mice only implanted with Huh-7 cells, and the change was reversed by MEG3 overexpression in vivo (Figure 7D). CD68 was also highly expressed in mice injected with Huh-7 cells and BMDMs + Adv-NC, and the upregulation of CD68 was enhanced in mice with BMDMs + Adv-MEG3 (Figure 7E). Moreover, BMDM + Adv-NC implantation resulted in high levels of M2 markers (CD163, CD206, and ARG1) in tumors, and the trend was reduced by MEG3 overexpression (Figure 7F). The mRNA levels of M1 markers (CD68, IL-1, and iNOS) in tumors were augmented by BMDM implantation, and the changes were enhanced by MEG3 overexpression in vivo (Figure 7G). The findings revealed that MEG3 suppressed M2-like polarization while promoting M1-like polarization in vivo.
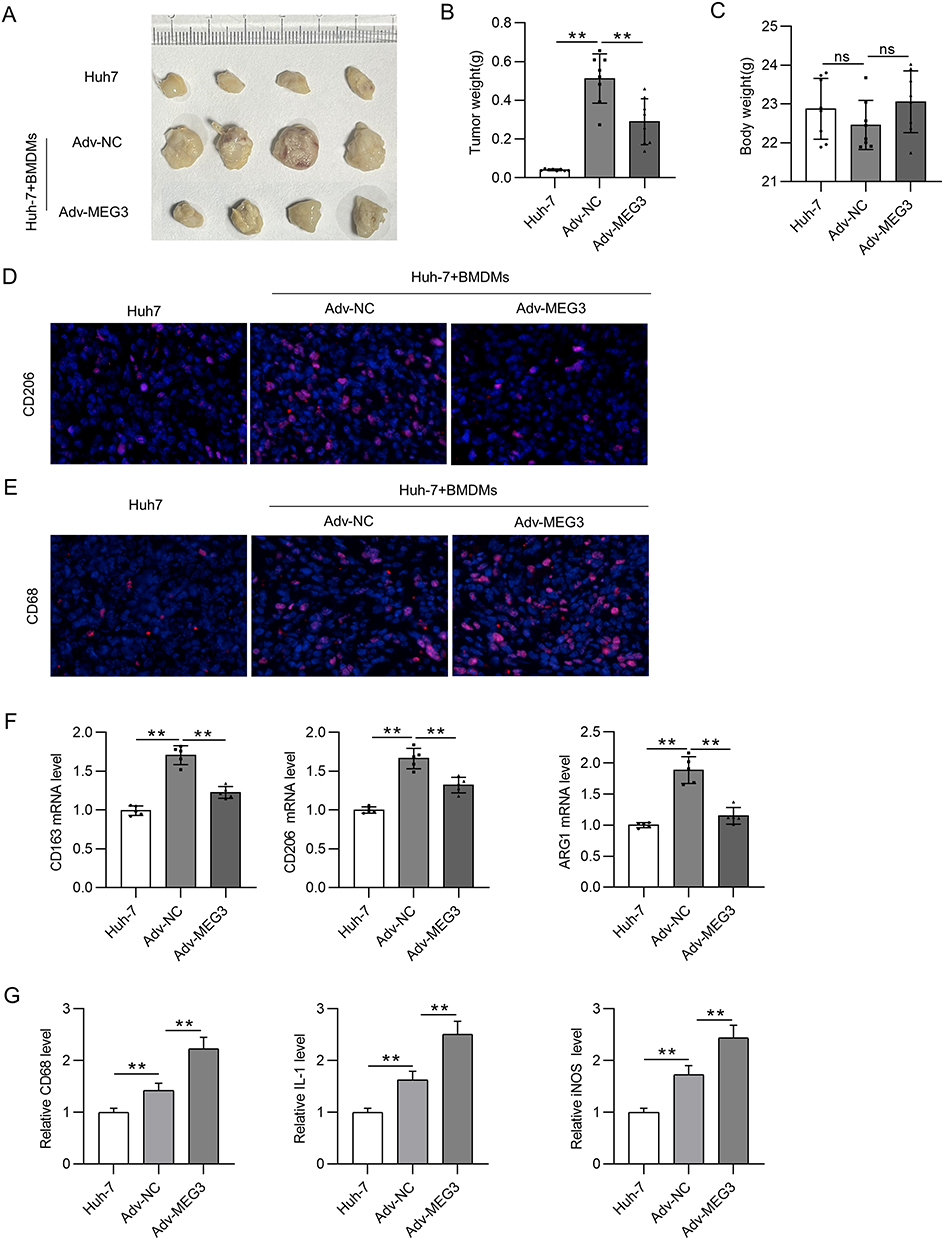 |
Figure 7 LncRNA MEG3 inhibits tumorigenesis in vivo. Huh-7 cells and BMDMs transfected with Adv-MEG3/Adv-NC were subcutaneously planted into the armpits of mice. Thirty days later, mice were sacrificed. (A) An image is provided to show the size of harvested tumors in Huh-7 group, Huh-7 + BMDMs + Adv-NC group, and Huh-7 + BMDMs + Adv-MEG group. (B and C) Tumor weight and body weight in each group were compared. (D and E) Immunofluorescent staining was performed to detect CD206 and CD68 expression in tumor tissues of each group. (F) The mRNA levels of M2 polarization markers were quantified by RT-qPCR. (G) RT-qPCR was performed to analyze the mRNA levels of M1 polarization markers in tumor tissues. **p<0.01. ns: not significant. |
CCL5 Depletion Reverses the Suppressive Effect of Adv-MEG3 on HCC Cell Malignancy
A series of rescue experiments were performed to verify whether MEG3 hinders HCC cellular development by upregulating CCL5 expression. Accordingly, CCL5 expression was inhibited by Adv-shCCL5 at both the mRNA and protein levels in IL-4/IL-13-treated BMDMs, that is, in M2 macrophages (Figure 8A–C). The results of the transwell assay showed that Adv-MEG3 suppressed the migration and invasiveness of Huh-7 cells in the context of M2 macrophage polarization, and these changes were reversed by CCL5 deficiency (Figure 8D–G). Similarly, the number of tubes was reduced by MEG3 suppression, and the decrease was rescued by silencing CCL5 under the condition of M2 macrophage polarization (Figure 8H and I). Overall, CCL5 knockdown reversed the inhibitory effect of MEG3 overexpression on cell migration, invasion, and angiogenesis in response to M2 macrophage polarization.
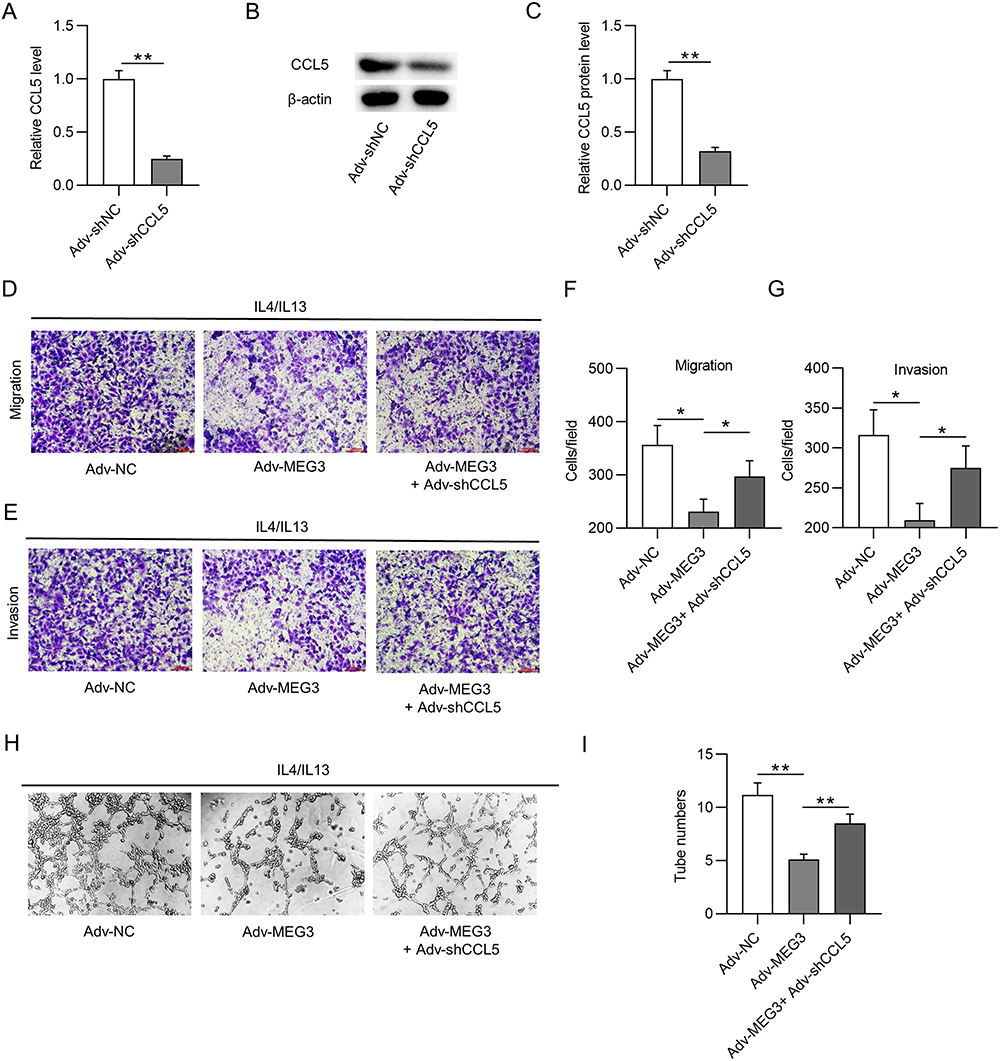 |
Figure 8 CCL5 depletion reverses the suppressive effect of Adv-MEG3 on HCC malignant cell behavior. (A–C) RT-qPCR and Western blot were conducted to quantify CCL5 mRNA and protein levels in M2-like macrophages transfected with Adv-shCCL5 or Adv-shNC. (D–G) Transwell assays were carried out for measurement of cell migration and invasion in Adv-NC, Adv-MEG3, and Adv-MEG3+ Adv-shCCL5 groups. (H and I) Tube formation assays were conducted to explore the influence of MEG3 and/or CCL5 on angiogenesis in the context of M2-like macrophage polarization. *p<0.05, **p<0.01. |
Expression, Correlation, and Prognosis of MEG3, HuR, and CCL5 in HCC Tissues
MEG3 is poorly expressed in LIHC samples, whereas HuR (also known as ELAVL1) is highly expressed in LIHC tissues (Figure 9A and B). In addition, there exists a positive correlation between MEG3 and CCL5 expression in LIHC tissues (Figure 9C). Moreover, it was clearly noted that a low level of MEG3 or CCL5 is associated with a poor survival outcome in LIHC patients, whereas a high level of HuR predicts a poor prognosis in LIHC patients (Figure 9D–F). Then, PCR was performed to measure MEG3, HuR, and CCL5 expression in HCC tissues. Consistent with results of bioinformatics analysis, MEG3 and CCL5 displayed low expression while HuR showed a high mRNA level in HCC tissues (Figure 10A–C). Spearman correlation analysis revealed that MEG3 expression was inversely associated with HuR expression in HCC tissues (Figure 10D). HuR expression also correlated with CCL5 expression in HCC samples in a negative manner (Figure 10E). MEG3 expression was positively related to CCL5 expression (Figure 10F). The findings further verified the conclusions from cellular experiments.
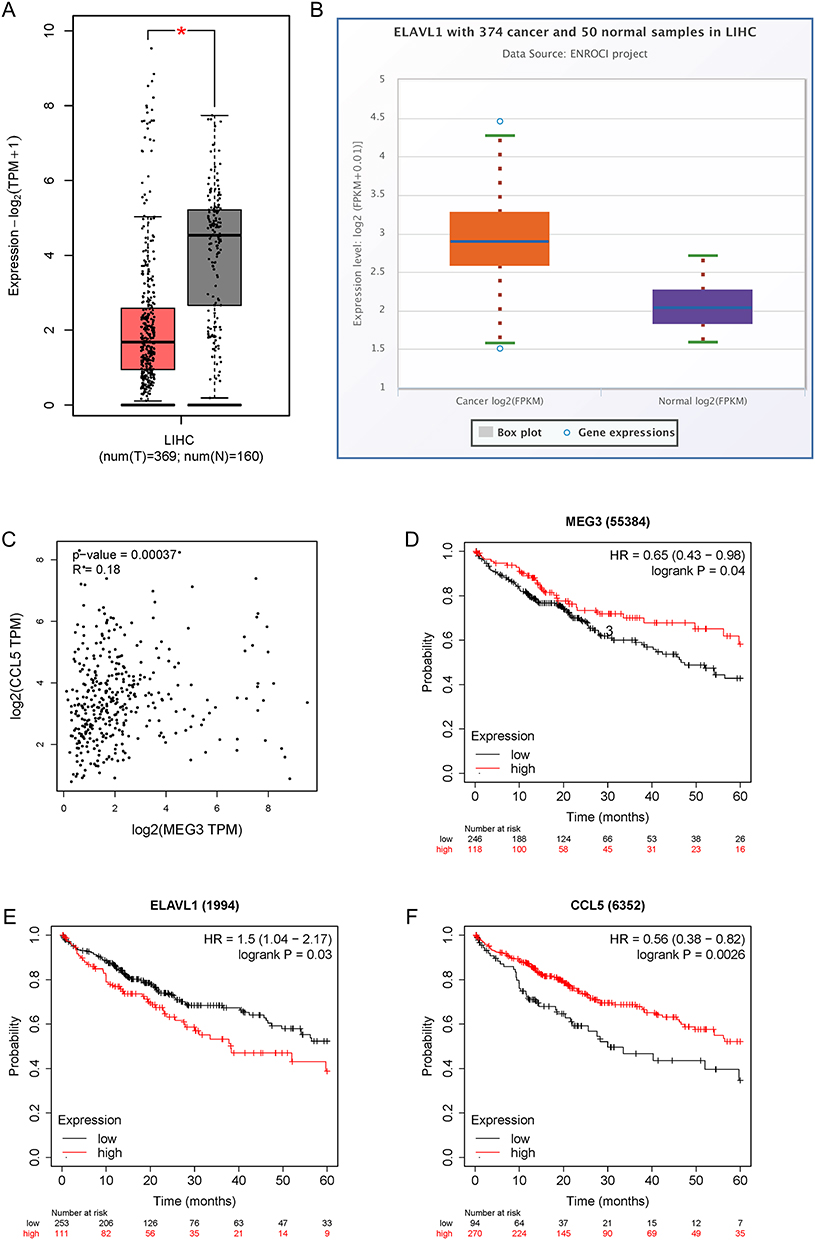 |
Figure 9 The predictive values of MEG3, HuR, and CCL5 in HCC. (A) MEG3 expression in LIHC tissues and normal samples was predicted with GEPIA. (B) ELAVL1 (HuR) expression in LIHC tissues and normal samples was analyzed in the starBase database. (C) The correlation between MEG3 expression and CCL5 expression in LIHC tissues was predicted by GEPIA. (D–F) The influence of MEG3, ELAVL1, or CCL5 on the prognosis of LIHC patients was evaluated by Kaplan-Meier Plotter analysis. *p<0.05. |
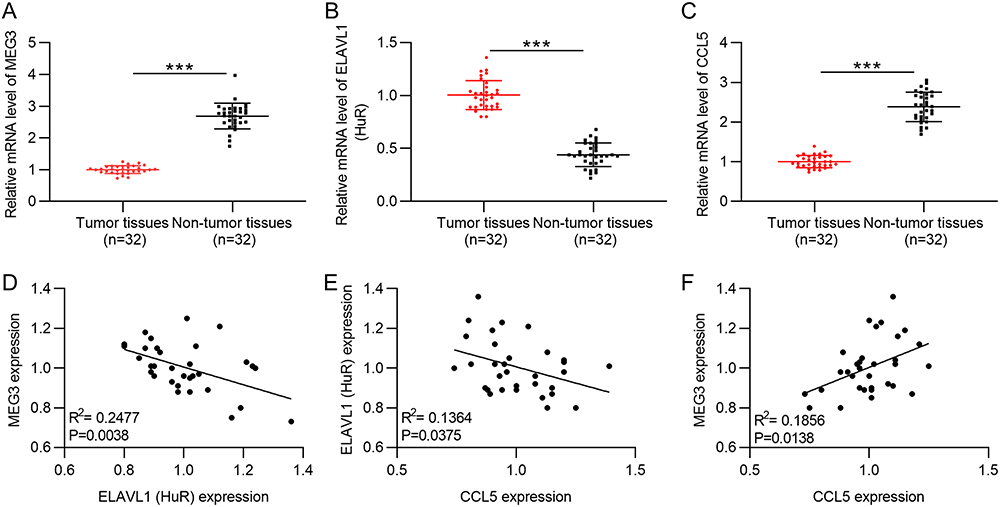 |
Figure 10 Expression and correlation verification of MEG3, HuR, and CCL5 in HCC samples. (A–C) RT-qPCR was performed to measure MEG3, HuR, and CCL5 expression in HCC samples (n=32) and non-tumor samples (n=32). (D–F) Spearman correlation analysis was performed to analyze the expression correlation between MEG3 and HuR (D), that between HuR and CCL5 (E), and that between MEG3 and CCL5 (F). ***p<0.001. |
LncRNA MEG3 Inhibits HCC Malignant Cell Behavior by Regulating M1 and M2 Macrophage Polarization via Binding to HuR and Upregulation of CCL5
The findings in the study were summarized in a plot. MEG3 that distributed in nucleus of BMDMs interacts with the RNA binding protein HuR to influence the stability of CCL5 promoter. MEG3 promotes M1-like polarization and inhibits M2 phenotype polarization of BMDMs. In this way, HCC cell migration and invasion as well as HUVEC angiogenesis were suppressed (Figure 11).
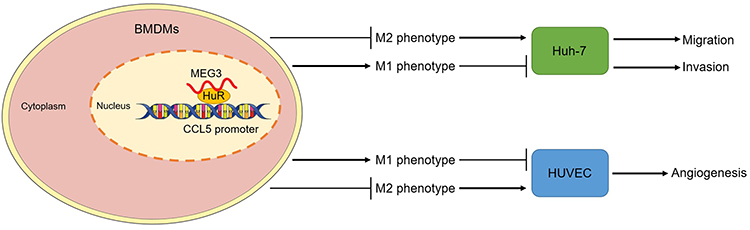 |
Figure 11 LncRNA MEG3 inhibits HCC malignant cell behavior by regulating M1 and M2 macrophage polarization via binding to HuR and upregulation of CCL5. A diagram was provided to elucidate how MEG3 regulates HCC malignant cell behavior by regulating HuR and CCL5 in nucleus of BMDMs with M1- or M2-like polarization. |
Discussion
HCC is a life-threatening malignant cancer that is often diagnosed at an advanced stage when the tumor is unresectable, making therapeutic options limited.45 In complex cancer microenvironment, M2 macrophages are closely related to HCC progression and tumor growth.45 However, few studies have deciphered the role of lncRNAs in mediating macrophage polarization in HCC. In the present study, lncRNA MEG3 reduced the ratio of M2/M1 macrophages and thereby suppressed cell migration, invasion, and angiogenesis by binding to HuR and upregulating CCL5.
LncRNAs have been demonstrated to participate in a series of pathological and physiological processes, such as tumorigenesis, cell death, and proliferation.46 Recently, increasing attention has been paid to the role of lncRNAs in cell–cell interactions between tumor cells and immune cells such as macrophages. For example, lncRNA LNMAT1 recruits macrophages into tumors by upregulating CCL2, thereby contributing to lymphatic metastasis in bladder cancer.19 The transport of RPPH1 into macrophages promotes macrophage M2 polarization, which facilitates the proliferation and metastasis of colorectal cancer cells.47 In this study, we found that overexpression of lncRNA MEG3 inhibited M2 macrophage polarization, as manifested by reduced levels of ARG1, CD163, and CD206 in IL-4/IL-13-treated BMDMs. ARG1 is an arginase highly expressed in M2 macrophages.48 CD163 and CD206 are hallmarks of the M2 cell membrane surface in phagocytosis and pathogens.49 Silencing of MEG3 also attenuated M1 macrophage polarization, as demonstrated by reduced mRNA levels of IL-1, CD68, and iNOS in LPS/IFNγ-induced BMDMs transfected with Adv-sh-MEG3. As a heavily glycosylated glycoprotein, CD68 is highly expressed in M1 macrophages and mononuclear phagocytes.50 iNOS is a major component of the antimicrobial effector machinery, which is expressed at high levels in M1 macrophages, similar to IL-1.51 Furthermore, overexpression of MEG3 repressed M2 macrophage polarization-induced Huh-7 cell migration and invasion as well as angiogenesis of HUVECs. Additionally, tumor growth was hindered after the subcutaneous implantation of a mixture of Huh-7 cells and Adv-MEG3-transfected BMDMs into nude mice.
LncRNAs can regulate the behavior of cancer cells by binding to various proteins or acting as molecular scaffolds to regulate cancer-related genes. For example, lncRNA RP11-138J23.1 enhances the metastatic and proliferative abilities of gastric cancer cells by increasing VAV3 mRNA stability via interaction with HuR.52 The lncRNA ADORA2A-AS1 displays antitumor effects in HCC by binding to HuR and inhibiting the FSCN1/AKT axis.35 Through bioinformatic analysis in this study, nine RBPs were identified with a high probability of binding to MEG3. Since lncRNA MEG3 has been demonstrated to regulate microglial M1 polarization by binding to HuR,37 we explored the possible relationship between MEG3 and HuR. Results showed that MEG3 and HuR were enriched in immunoprecipitation, and HuR expression was downregulated in BMDMs upon MEG3 elevation, suggesting that MEG3 binds to HuR in macrophages.
It has been reported that HuR primarily works at the post-transcriptional level, which can enhance the translation and/or mRNA stability of its target genes.53 CCL5 plays a fundamental role in inflammation by recruiting leukocytes to inflammatory sites. However, in recent years, CCL5 has been found to be secreted by tumor cells and plays an important role in human cancers. It has been verified that CCL5 can stimulate the formation of immunosuppressive microenvironment, promote the metastasis and formation of new blood vessels.54 CCL5 targets the p65/STAT3-CSN5-PD-L1 axis to facilitate the immune escape of colorectal cancer cells.55 In addition, CCL5 derived from cancer-associated fibroblasts facilitates lung metastasis in HCC via the activation of the HIF1α/ZEB1 pathway.56 Previous studies validated that CCL5 possesses an important function in the polarization and recruitment of macrophages, and CCL5 can also be negatively regulated by HuR in HCC cells.40,57 The current work reported that knockdown of HuR had almost no effect on the stability of CCL5 but significantly reduced the mRNA level and promoter activity of CCL5 in BMDMs. Furthermore, rescue experiments showed that CCL5 silencing reversed the inhibitory effect of MEG3 on Huh-7 cell migration and invasion as well as HUVEC angiogenesis in response to M2 macrophage polarization.
Macrophages can act as targets and tools in cancer treatment because TAMs exert essential functions in angiogenesis, cancer cell proliferation, metastasis, extracellular matrix remodeling, and immunosuppression. If TAMs are appropriately activated, macrophages play a beneficial role in cancer therapy by promoting the phagocytosis of cancer cells and participating bidirectional interactions with immune system.58 There are two types of macrophage-targeted strategies. One refers to inhibition of cytokines and chemokines implicated with the recruitment and polarization of tumor-promoting myeloid cells. Another one is activating the antitumorigenic or immune-stimulating function of macrophages.58,59 The present study not only verified the influence of macrophages on cancer cell metastasis and angiogenesis, but also explored genes aberrantly expressed in macrophages and provided a novel regulatory axis (MEG3/HuR/CCL5) that involved in the communication between macrophages and HCC cells. Overexpressing MEG3 in BMDMs facilitates M1 macrophage polarization while suppressing M2-like polarization, thereby activating the antitumorigenic role of macrophages. Targeting macrophage polarization by altering MEG3 expression can be developed as a promising therapeutic strategy against HCC. In the future, the effect of MEG3 on immune-stimulating function of macrophages and related mechanism should be deeply investigated to comprehensively reveal the role of MEG3 in macrophages-cancer cell interaction.
Conclusion
In conclusion, this study is the first to report that MEG3 suppresses cell migration, invasiveness, and angiogenesis in HCC by reducing the ratio of M2/M1 macrophages by targeting the HuR/CCL5 axis. Our findings indicate that MEG3 may be a therapeutic target in HCC treatment by participating in macrophage-cancer cell interaction. However, further studies are needed to identify other possible mechanisms of action of lncRNA MEG3.
Animal Studies
In accordance with the protocols of the Affiliated Hospital of Youjiang Medical University for Nationalities and the “Guide for the Care and Use of Laboratory Animals” of the National Institute of Health in China.
Approval of the Research Protocol
All animal experiments were performed in accordance with the protocols of the Affiliated Hospital of Youjiang Medical University for Nationalities (YYFY-LL-2022-112) and the “Guide for the Care and Use of Laboratory Animals” of the National Institute of Health in China.
Data Sharing Statement
The datasets used in this study are available from the corresponding author upon reasonable request.
Funding
This work was supported by the Guangxi Science and Technology Project (Grant no.GK-AA21196004) and the high-level personnel project of the Affiliated Hospital of Youjiang Medical University for Nationalities (Grant no.R202210307).
Disclosure
The authors report no conflicts of interest in this work.
References
1. Brown ZJ, Tsilimigras DI, Ruff SM, et al. Management of hepatocellular carcinoma: a review. JAMA Surg. 2023;158(4):410–420. doi:10.1001/jamasurg.2022.7989
2. Jiang H, Cao H-J, Ma N, et al. Chromatin remodeling factor ARID2 suppresses hepatocellular carcinoma metastasis via DNMT1-Snail axis. Proc Natl Acad Sci U S A. 2020;117(9):4770–4780. doi:10.1073/pnas.1914937117
3. Li X, Wang J. Mechanical tumor microenvironment and transduction: cytoskeleton mediates cancer cell invasion and metastasis. Int J Biol Sci. 2020;16(12):2014–2028. doi:10.7150/ijbs.44943
4. Hinshaw DC, Shevde LA. The tumor microenvironment innately modulates cancer progression. Cancer Res. 2019;79(18):4557–4566. doi:10.1158/0008-5472.CAN-18-3962
5. Arneth B. Tumor Microenvironment. Medicina. 2019;56(1):1. doi:10.3390/medicina56010015
6. Oura K, Morishita A, Tani J, et al. Tumor immune microenvironment and immunosuppressive therapy in hepatocellular carcinoma: a review. Int J Mol Sci. 2021;22(11):5801. doi:10.3390/ijms22115801
7. Yin Z, Huang J, Ma T, et al. Macrophages activating chemokine (C-X-C motif) ligand 8/miR-17 cluster modulate hepatocellular carcinoma cell growth and metastasis. Am J Transl Res. 2017;9(5):2403–2411.
8. Arvanitakis K, Koletsa T, Mitroulis I, et al. Tumor-associated macrophages in hepatocellular carcinoma pathogenesis, prognosis and therapy. Cancers. 2022;14(1):226. doi:10.3390/cancers14010226
9. Hilmi M, Neuzillet C, Calderaro J, et al. Angiogenesis and immune checkpoint inhibitors as therapies for hepatocellular carcinoma: current knowledge and future research directions. J Immunother Cancer. 2019;7(1):333. doi:10.1186/s40425-019-0824-5
10. Zhou D, Luan J, Huang C, et al. Tumor-associated macrophages in hepatocellular carcinoma: friend or foe? Gut Liver. 2021;15(4):500–516. doi:10.5009/gnl20223
11. Han S, Bao X, Zou Y, et al. d -lactate modulates M2 tumor-associated macrophages and remodels immunosuppressive tumor microenvironment for hepatocellular carcinoma. Sci Adv. 2023;9(29):eadg2697. doi:10.1126/sciadv.adg2697
12. Liu B, Yao P, Xiao F, et al. MYBL2-induced PITPNA-AS1 upregulates SIK2 to exert oncogenic function in triple-negative breast cancer through miR-520d-5p and DDX54. J Transl Med. 2021;19(1):333. doi:10.1186/s12967-021-02956-6
13. Lu L, Huang J, Mo J, et al. Exosomal lncRNA TUG1 from cancer-associated fibroblasts promotes liver cancer cell migration, invasion, and glycolysis by regulating the miR-524-5p/SIX1 axis. Cell Mol Biol Lett. 2022;27(1):17. doi:10.1186/s11658-022-00309-9
14. Liu S, Bu X, Kan A, et al. SP1-induced lncRNA DUBR promotes stemness and oxaliplatin resistance of hepatocellular carcinoma via E2F1-CIP2A feedback. Cancer Lett. 2022;528:16–30. doi:10.1016/j.canlet.2021.12.026
15. Tao L, Li D, Mu S, et al. LncRNA MAPKAPK5_AS1 facilitates cell proliferation in hepatitis B virus -related hepatocellular carcinoma. Lab Invest. 2022;102(5):494–504. doi:10.1038/s41374-022-00731-9
16. Xia A, Yuan W, Wang Q, et al. The cancer-testis lncRNA lnc-CTHCC promotes hepatocellular carcinogenesis by binding hnRNP K and activating YAP1 transcription. Nat Cancer. 2022;3(2):203–218. doi:10.1038/s43018-021-00315-4
17. Shen C, Li J, Zhang Q, et al. LncRNA GASAL1 promotes hepatocellular carcinoma progression by up-regulating USP10-stabilized PCNA. Exp Cell Res. 2022;415(1):112973. doi:10.1016/j.yexcr.2021.112973
18. Wang X, Zhou Y, Dong K, et al. Exosomal lncRNA HMMR-AS1 mediates macrophage polarization through miR-147a/ARID3A axis under hypoxia and affects the progression of hepatocellular carcinoma. Environ Toxicol. 2022;37(6):1357–1372. doi:10.1002/tox.23489
19. Chen C, He W, Huang J, et al. LNMAT1 promotes lymphatic metastasis of bladder cancer via CCL2 dependent macrophage recruitment. Nat Commun. 2018;9(1):3826. doi:10.1038/s41467-018-06152-x
20. Huang JK, Ma L, Song W-H, et al. LncRNA-MALAT1 promotes angiogenesis of thyroid cancer by modulating tumor-associated macrophage FGF2 protein secretion. J Cell Biochem. 2017;118(12):4821–4830. doi:10.1002/jcb.26153
21. Wang X, Song X, Glass CK, et al. The long arm of long noncoding RNAs: roles as sensors regulating gene transcriptional programs. Cold Spring Harb Perspect Biol. 2011;3(1):a003756. doi:10.1101/cshperspect.a003756
22. Vance KW, Ponting CP. Transcriptional regulatory functions of nuclear long noncoding RNAs. Trends Genet. 2014;30(8):348–355. doi:10.1016/j.tig.2014.06.001
23. Shi X, Sun M, Liu H, et al. Long non-coding RNAs: a new frontier in the study of human diseases. Cancer Lett. 2013;339(2):159–166. doi:10.1016/j.canlet.2013.06.013
24. Tian X, Wu Y, Yang Y, et al. Long noncoding RNA LINC00662 promotes M2 macrophage polarization and hepatocellular carcinoma progression via activating Wnt/β-catenin signaling. Mol Oncol. 2020;14(2):462–483. doi:10.1002/1878-0261.12606
25. Li DQ, Ding Y-R, Che J-H, et al. Tumor suppressive lncRNA MEG3 binds to EZH2 and enhances CXCL3 methylation in gallbladder cancer. Neoplasma. 2022;69(3):538–549. doi:10.4149/neo_2022_210726N1046
26. Zheng Q, Lin Z, Xu J, et al. Long noncoding RNA MEG3 suppresses liver cancer cells growth through inhibiting β-catenin by activating PKM2 and inactivating PTEN. Cell Death Dis. 2018;9(3):253. doi:10.1038/s41419-018-0305-7
27. Yang Z, Wang Z, Duan Y. LncRNA MEG3 inhibits non-small cell lung cancer via interaction with DKC1 protein. Oncol Lett. 2020;20(3):2183–2190. doi:10.3892/ol.2020.11770
28. Chen PY, Hsieh P-L, Peng C-Y, et al. LncRNA MEG3 inhibits self-renewal and invasion abilities of oral cancer stem cells by sponging miR-421. J Formos Med Assoc. 2021;120(4):1137–1142. doi:10.1016/j.jfma.2020.09.006
29. Ma B, Gao Z, Lou J, et al. Long non‑coding RNA MEG3 contributes to cisplatin‑induced apoptosis via inhibition of autophagy in human glioma cells. Mol Med Rep. 2017;16(3):2946–2952. doi:10.3892/mmr.2017.6897
30. Wang P, Chen D, Ma H, et al. LncRNA MEG3 enhances cisplatin sensitivity in non-small cell lung cancer by regulating miR-21-5p/SOX7 axis. Onco Targets Ther. 2017;10:5137–5149. doi:10.2147/OTT.S146423
31. Zhang Y, Liu J, Lv Y, et al. LncRNA meg3 suppresses hepatocellular carcinoma in vitro and vivo studies. Am J Transl Res. 2019;11(7):4089–4099.
32. Jakstaite A, Maziukiene A, Silkuniene G, et al. HuR mediated post-transcriptional regulation as a new potential adjuvant therapeutic target in chemotherapy for pancreatic cancer. World J Gastroenterol. 2015;21(46):13004–13019. doi:10.3748/wjg.v21.i46.13004
33. Blanco FF, Jimbo M, Wulfkuhle J, et al. The mRNA-binding protein HuR promotes hypoxia-induced chemoresistance through posttranscriptional regulation of the proto-oncogene PIM1 in pancreatic cancer cells. Oncogene. 2016;35(19):2529–2541. doi:10.1038/onc.2015.325
34. Liu R, Wu K, Li Y, et al. Human antigen R: a potential therapeutic target for liver diseases. Pharmacol Res. 2020;155:104684. doi:10.1016/j.phrs.2020.104684
35. Pu J, Zhang Y, Wang A, et al. ADORA2A-AS1 restricts hepatocellular carcinoma progression via binding HuR and Repressing FSCN1/AKT axis. Front Oncol. 2021;11:754835. doi:10.3389/fonc.2021.754835
36. Latorre E, Carelli S, Raimondi I, et al. The ribonucleic complex HuR-MALAT1 represses CD133 expression and suppresses epithelial-mesenchymal transition in breast cancer. Cancer Res. 2016;76(9):2626–2636. doi:10.1158/0008-5472.CAN-15-2018
37. Zhou HJ, Wang L-Q, Zhan R-Y, et al. lncRNA MEG3 restrained the M1 polarization of microglia in acute spinal cord injury through the HuR/A20/NF-axis. Brain Pathol. 2022;32(5):e13070. doi:10.1111/bpa.13070
38. Huang R, Guo L, Gao M, et al. Research trends and regulation of CCL5 in prostate cancer. Onco Targets Ther. 2021;14:1417–1427. doi:10.2147/OTT.S279189
39. Aldinucci D, Borghese C, Casagrande N. The CCL5/CCR5 axis in cancer progression. Cancers. 2020;12(7):1765. doi:10.3390/cancers12071765
40. Brauß TF, Winslow S, Lampe S, et al. The RNA-binding protein HuR inhibits expression of CCL5 and limits recruitment of macrophages into tumors. Mol, Carcinog. 2017;56(12):2620–2629. doi:10.1002/mc.22706
41. Toda G, Yamauchi T, Kadowaki T, et al. Preparation and culture of bone marrow-derived macrophages from mice for functional analysis. STAR Protoc. 2021;2(1):100246. doi:10.1016/j.xpro.2020.100246
42. Zong S, Dai W, Guo X, et al. LncRNA-SNHG1 promotes macrophage M2-like polarization and contributes to breast cancer growth and metastasis. Aging. 2021;13(19):23169–23181. doi:10.18632/aging.203609
43. Livak KJ, Schmittgen TD. Analysis of relative gene expression data using real-time quantitative PCR and the 2(-Delta Delta C(T)) Method. Methods. 2001;25(4):402–408. doi:10.1006/meth.2001.1262
44. Priyanka P, Sharma M, Das S, et al. The lncRNA HMS recruits RNA-binding protein HuR to stabilize the 3’-UTR of HOXC10 mRNA. J Biol Chem. 2021;297(2):100997. doi:10.1016/j.jbc.2021.100997
45. Chen J, Huang Z-B, Liao C-J, et al. LncRNA TP73-AS1/miR-539/MMP-8 axis modulates M2 macrophage polarization in hepatocellular carcinoma via TGF-β1 signaling. Cell Signal. 2020;75:109738. doi:10.1016/j.cellsig.2020.109738
46. Xie C, Li SY, Fang JH, Zhu Y, Yang JE. Functional long non-coding RNAs in hepatocellular carcinoma. Cancer Lett. 2021;500:281–291.
47. Liang ZX, Liu H-S, Wang F-W, et al. LncRNA RPPH1 promotes colorectal cancer metastasis by interacting with TUBB3 and by promoting exosomes-mediated macrophage M2 polarization. Cell Death Dis. 2019;10(11):829. doi:10.1038/s41419-019-2077-0
48. Arlauckas SP, Garren SB, Garris CS, et al. Arg1 expression defines immunosuppressive subsets of tumor-associated macrophages. Theranostics. 2018;8(21):5842–5854. doi:10.7150/thno.26888
49. Wang S, Cao M, Xu S, et al. Luteolin alters macrophage polarization to inhibit inflammation. Inflammation. 2020;43(1):95–108. doi:10.1007/s10753-019-01099-7
50. Chistiakov DA, Killingsworth MC, Myasoedova VA, et al. CD68/macrosialin: not just a histochemical marker. Lab Invest. 2017;97(1):4–13. doi:10.1038/labinvest.2016.116
51. Gan ZS, Wang -Q-Q, Li J-H, et al. Iron reduces M1 macrophage polarization in RAW264.7 Macrophages Associated with Inhibition of STAT1. Mediators Inflamm. 2017;2017:8570818. doi:10.1155/2017/8570818
52. Xu Y, Yu X, Xu J, et al. LncRNA RP11-138J23.1 contributes to gastric cancer progression by interacting with RNA-Binding Protein HuR. Front Oncol. 2022;12:848406. doi:10.3389/fonc.2022.848406
53. Hinman MN, Lou H. Diverse molecular functions of Hu proteins. Cell Mol Life Sci. 2008;65(20):3168–3181. doi:10.1007/s00018-008-8252-6
54. Candido J, Hagemann T. Cancer-related inflammation. J Clin Immunol. 2013;33(Suppl 1):S79–84. doi:10.1007/s10875-012-9847-0
55. Liu C, Yao Z, Wang J, et al. Macrophage-derived CCL5 facilitates immune escape of colorectal cancer cells via the p65/STAT3-CSN5-PD-L1 pathway. Cell Death Differ. 2020;27(6):1765–1781. doi:10.1038/s41418-019-0460-0
56. Xu H, Zhao J, Li J, et al. Cancer associated fibroblast-derived CCL5 promotes hepatocellular carcinoma metastasis through activating HIF1α/ZEB1 axis. Cell Death Dis. 2022;13(5):478. doi:10.1038/s41419-022-04935-1
57. Walens A, DiMarco AV, Lupo R, Kroger BR, Damrauer JS, Alvarez JV. CCL5 promotes breast cancer recurrence through macrophage recruitment in residual tumors. Elife. 2019;8:e43653.
58. Mantovani A, Allavena P, Marchesi F, et al. Macrophages as tools and targets in cancer therapy. Nat Rev Drug Discov. 2022;21(11):799–820. doi:10.1038/s41573-022-00520-5
59. Chen S, Saeed AFUH, Liu Q, et al. Macrophages in immunoregulation and therapeutics. Signal Transduct Target Ther. 2023;8(1):207. doi:10.1038/s41392-023-01452-1
 © 2024 The Author(s). This work is published and licensed by Dove Medical Press Limited. The
full terms of this license are available at https://www.dovepress.com/terms.php
and incorporate the Creative Commons Attribution
- Non Commercial (unported, v3.0) License.
By accessing the work you hereby accept the Terms. Non-commercial uses of the work are permitted
without any further permission from Dove Medical Press Limited, provided the work is properly
attributed. For permission for commercial use of this work, please see paragraphs 4.2 and 5 of our Terms.
© 2024 The Author(s). This work is published and licensed by Dove Medical Press Limited. The
full terms of this license are available at https://www.dovepress.com/terms.php
and incorporate the Creative Commons Attribution
- Non Commercial (unported, v3.0) License.
By accessing the work you hereby accept the Terms. Non-commercial uses of the work are permitted
without any further permission from Dove Medical Press Limited, provided the work is properly
attributed. For permission for commercial use of this work, please see paragraphs 4.2 and 5 of our Terms.
Recommended articles
LncRNA MEG3 Inhibits Tumor Progression by Modulating Macrophage Phenotypic Polarization via miR-145-5p/DAB2 Axis in Hepatocellular Carcinoma
Wei Q, Liu G, Huang Z, Huang Y, Huang L, Huang Z, Wu X, Wei H, Pu J
Journal of Hepatocellular Carcinoma 2023, 10:1019-1035
Published Date: 5 July 2023