")
Back to Journals » Journal of Hepatocellular Carcinoma » Volume 10
Liver Regeneration-Related Genes of Nontumor Liver Tissues Predict the Prognosis of Patients with Hepatocellular Carcinoma
Authors Xu Y, Li Y, Lu Y, Wang W, Lian Z, Wu Z, Li B, Yu D
Received 8 September 2023
Accepted for publication 22 November 2023
Published 7 December 2023 Volume 2023:10 Pages 2197—2209
DOI https://doi.org/10.2147/JHC.S433688
Checked for plagiarism Yes
Review by Single anonymous peer review
Peer reviewer comments 2
Editor who approved publication: Dr David Gerber
Yanchao Xu,1,* Yunzheng Li,2,* Yanjun Lu,3,* Weihong Wang,1 Zhaowu Lian,3 Zijie Wu,4 Binghua Li,1 Decai Yu1– 3
1Department of Hepatobiliary Surgery, Nanjing Drum Tower Hospital Clinical College of Jiangsu University, Nanjing, People’s Republic of China; 2State Key Laboratory of Pharmaceutical Biotechnology, Division of Hepatobiliary and Transplantation Surgery, Department of General Surgery, Affiliated Drum Tower Hospital, Medical School of Nanjing University, Nanjing, 210008, People’s Republic of China; 3Department of Hepatobiliary Surgery, Affiliated Drum Tower Hospital, Nanjing University of Chinese Medicine, Nanjing, People’s Republic of China; 4Jiangsu Key Laboratory of Druggability of Biopharmaceuticals and State Key Laboratory of Natural Medicines, School of Life Science and Technology, China Pharmaceutical University, Nanjing, People’s Republic of China
*These authors contributed equally to this work
Correspondence: Binghua Li; Decai Yu, Tel +86025-83106666, Fax +86025-68183912, Email [email protected]; [email protected]
Background: Hepatocellular carcinoma (HCC) is one of the most serious malignant tumors threatening human life with a high mortality rate. The liver regenerative capacity after hepatectomy in early-stage HCC patients is influenced by various factors, including surgical methods and energy metabolism. This study aims to provide a prognostic model based on genes related to liver regeneration that can predict the prognosis of non-tumor tissues in HCC patients.
Patients and Methods: A total of 584 non-tumor tissues from HCC patients were collected from three independent databases. Kaplan-Meier survival curves were used to identify prognostic liver-regeneration genes. Subsequently, a prognostic indicator, designated as the Liver Regeneration score (LR score), was determined using single-sample gene set enrichment analysis (ssGSEA). Independent cohorts were used to verify the relationship between LR score and prognosis in non-tumor tissues of HCC patients. Furthermore, a liver regeneration-related model was established to validate key genes identified through LASSO Cox regression analysis.
Results: We constructed a gene set comprising 24 liver regeneration-related genes, and the LR score was utilized to predict the prognosis of HCC patients based on its levels in non-tumor tissues. In non-tumor tissues of HCC patients, higher LR scores were associated with improved prognosis. Higher LR scores in non-tumor tissues indicate improved liver metabolism in HCC patients, revealed by Enrichment analysis. LASSO Cox regression analysis identified two key genes, DHTKD1 (dehydrogenase E1 and transketolase domain containing 1) and PHYH (phytanoyl-CoA 2-hydroxylase), and higher expression levels of these genes in non-tumor tissues were correlated with better prognosis. The expression levels of these two genes also changed corresponding to the progression of liver regeneration.
Conclusion: In summary, our study has introduced a novel LR gene signature for HCC patients, providing a predictive model for estimating clinical prognosis from non-tumor tissues. The LR score demonstrates promise as a reliable indicator for predicting overall survival in HCC.
Keywords: hepatocellular carcinoma, HCC, non-tumor tissue, liver regeneration, prognosis
Introduction
Hepatocellular carcinoma (HCC) stands as the third leading cause of cancer-related deaths worldwide.1 While radiofrequency ablation (RFA) or resection serves as the primary treatment for early-stage HCC patients, the majority of HCC patients are diagnosed at intermediate and advanced stages, resulting in limited treatment options.2,3 Despite these interventions, the 5-year survival rate for patients undergoing radical hepatectomy remains around 40%.4 Genomic and transcriptional heterogeneity of HCC has been associated with relapse, drug resistance, and poor prognosis.5 In view of these challenges, there is an urgent imperative to identify novel prognostic biomarkers capable of determining the prognosis of HCC patients.
Liver regeneration (LR) is a unique and extremely highly complex process that involves various signaling pathways, ultimately leading to tissue reconstruction and functional recovery.6,7 Due to the liver’s remarkable regenerative capacity, partial hepatectomy (PH) serves as a crucial therapeutic approach for liver diseases,8 especially in the early stage of HCC.2 The regeneration ability of the remaining liver tissue after surgery is closely related associated with the restoration of liver structure and function.9
Many previous studies have established prognostic models in tumor tissues of HCC patients, and effective prognostic models have been established in multiple directions of biological metabolism10 and tumor immunity.11,12 Previously, our group also constructed similar models based on the gene expression patterns of HCC tumor tissues.13 However, few studies have specifically examined non-tumor tissues14,15 for predicting the prognosis of HCC patients. No previous studies have focused on liver regeneration in non-tumor tissues.
Normal tissue adjacent to the tumor (NAT), also known as non-tumor tissue, represents an intermediate state between healthy liver tissue and the tumor.16,17 Non-tumor tissues are frequently used as controls in tumor studies and have been found to harbor genes related to HCC survival in formalin-fixed and paraffin-embedded samples.18 However, the correlation between the regenerative capacity of residual liver tissue correlates with the prognosis of patients with resectable HCC remains unexplored.
In this study, we aimed to investigate whether the LR gene signature could serve as a prognostic gene set for patient survival using non-tumor tissues of HCC patients. We established a prognostic signature based on 24 LR genes utilizing the non-tumor tissues from the GSE14520 dataset, which was subsequently validated using non-tumor tissues from the International Cancer Genome Consortium (ICGC) and The National Cancer Institute’s Clinical Proteomic Tumor Analysis Consortium (CPTAC) datasets. Additionally, to further elucidate the underlying biological mechanisms involved in this signature, we identified and confirmed the key genes influencing liver regeneration and prognosis.
Materials and Methods
Data Acquisition
Data were obtained from GEO (Gene Expression Omnibus, https://www.ncbi.nlm.nih.gov/geo/), ICGC (International Cancer Genome Consortium, https://dcc.icgc.org/), and CPTAC (Clinical Proteomic Tumor Analysis Consortium, https://proteomics.cancer.gov/programs/cptac), HCC patient cohorts with survival data and gene expression profiles in tumor and non-tumor tissues were searched. Three cohorts with more than 150 non-tumor tissues (n>150) were included, including the GSE14520 cohort, ICGC-LIHC cohort and CPTAC-LIHC cohort. Notably, samples with incomplete clinical data were excluded. Finally, 228 HCC non-tumor tissue samples from the GSE14520 dataset were used as the training set, 197 HCC non-tumor samples from the ICGC dataset and 159 HCC non-tumor samples from the CPTAC dataset were used as the validation set. Liver regeneration datasets were also obtained from GEO, and RNA sequencing data of two mouse liver regeneration with different time points were GSE110404 and GSE181761.
Identification and Construction of Candidate Prognostic LR-Related Genes
First, The Bioconductor package “edgeR”19 (version 3.36.0) was used for differential expression analysis of liver regeneration samples at two-time points in GSE110404 and GSE181761 at the RNA level and calculate the foldchange and FDR value for RNA-seq data, and the selection criteria of genes was p-value <0.05. The resulting differential genes were transformed into human orthologs the R package “biomaRt” (version 2.50.3). Differently expressed genes (DEGs) in the tumor tissue samples and non-tumor tissue samples from microarray data GSE14520 were screened using the ‘limma’ (version 3.50.3) package of R software. The threshold for the DEGs was set as a |log2fold change (FC)| value >0 and a Padj <0.001. The core LR genes were further screened, and the genes related to prognosis in both tumor and non-tumor tissues were screened in GSE14520 dataset by using R package ‘survival’ (version 3.5–5). Subsequently, human liver regeneration-related genes, DEGs and prognosis-related genes were intersected, and 24 differentially expressed liver regeneration-related (DELRGs) genes were obtained (Figure 1). At the end of the study, two key liver regeneration genes were identified by least absolute shrinkage and selection operator (LASSO) Cox regression analysis using the “glmnet” R package.20
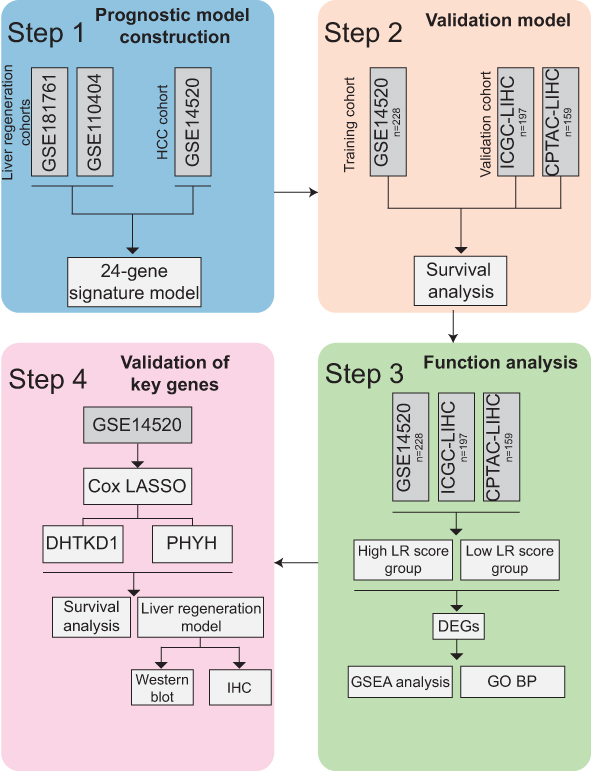 |
Figure 1 Schematic diagram of the study design. |
Establishment and Validation of the LR Score Signature
In order to establish a prognostic indicator for predicting overall survival probability, 24 DELRGs gene set, and used R packages “GSEABase” and “GSVA” to perform ssGSEA scores on non-tumor tissues in the three datasets, and the obtained scores were LR scores.21 Then, patients in each dataset were classified into the high LR score and low LR score groups by the median value. Principal component analysis (PCA) was performed to test the clustering effect of the LR score, and Kaplan–Meier survival curves were plotted to determine the survival prediction function of the LR score in all three cohorts in the study. The survival curve was generated by the R survminer (version 0.4.9) package.
Functional Enrichment Analysis and GSEA
GSEA, Gene Ontology (GO) and Kyoto Encyclopedia of Genes and Genomes (KEGG) analyses were performed using the R package “clusterProfiler”22 (version 4.8.1) in R4.3.0. The differentially expressed genes grouped by high and low LR score were subjected to Kyoto Encyclopedia of Genes and Genomes (KEGG) analyses using the R enrichR package. Gene set enrichment analysis (GSEA) was used to analyze the biological functions of DEGs between high and low LR score groups, which involved ‘GO’ and ‘KEGG’ as the reference database with |NES| > 1.5 and FDR q-value < 0.1.21 Subsequently, among the DEGs grouped by high and low LR, up-regulated genes for further analysis. The analysis technique ‘GO’ from R package “clusterProfler” was used to further analyze the GO pathway of DEGs up-regulated (|log2FC| >0, P value<0.05) in the high and low LR score groups.
Experimental Model of Liver Regeneration
C57BL6/J male mice (6–8 weeks old) were purchased from GemPharmatech Co., Ltd. Animal care protocols and experiments were performed in accordance with the Guide for the Care and Use of Laboratory Animals and approved by the Institutional Animal Care and Use Committee of Experimental Animal Center of Drum Tower Hospital, China (2022AE01019). 2/3 partial Hepatectomy (PH) was performed as described by Claudia Mitchell and Holger Willenbring.23 The left lateral and median lobes, which comprise 70% of the liver, were ligated and resected. The control group consisted of mice undergoing a sham operation, while the experimental groups were defined at different time points (1, 3, 5, 7 days) post-operation, each group comprising 5 mice. The sham group (n=5) served as the control, where only the abdominal cavity was opened without any liver manipulation. Mice from each group (n=5) were euthanized at various time points after partial hepatectomy (PH), and their livers were harvested. The liver/body weight ratio was measured, and a portion of the liver tissue was snap-frozen in liquid nitrogen and stored at − 80° for further analysis, and another portion of the liver tissue was fixed in 4% paraformaldehyde (PFA) and paraffin-embedded for further analysis.
Western Blot Analysis
Proteins were isolated using RIPA lysis buffer (#P0013B, Beyotime Biotechnology) and qualified using a BCA detection kit (#E112-02, Vazyme, Nanjing, China) following the manufacturer’s protocol. Equal amounts of protein were separated by SDS-PAGE, electrophoretically transferred onto a polyvinylidene difluoride membrane (#IPVH00010, Millipore), and blocked with 5% nonfat milk in Tris Buffered saline for 1 hour at room temperature. The membrane was incubated overnight at 4 °C with rabbit anti-DHTKD1 (1:1000, Cat No.27493-1-AP, Proteintech), anti-PHYH (1:1000, Cat No.12858-1-AP, Proteintech), anti-PCNA (1:20,000, Cat No.10205-2-AP, Proteintech) in TBS. And this was followed by washing and incubation with secondary antibodies for 1 h at room temperature. Protein bands were detected using an enhanced chemi-luminescence reagent (#E422-02, Vazyme, Nanjing, China).
Immunohistochemistry (IHC)
Liver tissues were fixed in 4% paraformaldehyde and embedded in paraffin. 4 mm thick serial sections were prepared, followed by deparaffinization, blocking, and overnight incubation at 4°C with primary antibodies, including rabbit anti-DHTKD1 (1:500, Cat No. 27493-1-AP, Proteintech), anti-PHYH (1:200, Cat No. 12858-1-AP, Proteintech), and anti-Ki67 (1:1000, Cat No. 28074-1-AP, Proteintech). Subsequently, a horseradish peroxidase-labeled secondary antibody was applied.
Statistical Analysis
The quantitative data were analyzed with Student’s t-test and Mann–Whitney U-test. The paired t-test or Wilcoxon signed-rank test was used for paired samples to perform between-group statistical comparisons. One-Way Repeated Measures ANOVA was conducted to compare liver/body weight ratio results. Survival curves were estimated by the Kaplan-Meier method. The Log rank test was used to determine the statistical differences between survival curves. Statistical analysis and data visualization were carried out using the R/Bioconductor software packages. Statistical analysis was performed using Prism (version 9.4.0; GraphPad), or R (version 4.3.0). The data were plotted as mean ± standard deviation (SD). Statistical significance set at p < 0.05, ns > 0.05, and denoted by asterisks (*p<0.05, **p<0.01, ***p<0.001 and ****p<0.0001).
Results
Identification of Prognostic Liver Regeneration-Related Genes in Non-Tumor Tissues of HCC
To establish a gene set capturing the liver regeneration capacity, we initially identified 1177 differentially expressed genes associated with liver regeneration from the published mouse liver regeneration datasets GSE110404 and GSE181761 (Supplementary Table 1). A total of 1043 genes related to liver regeneration were obtained (Supplementary Table 1). Subsequently, in the GSE14520 dataset, we screened for prognostic genes in both tumor and non-tumor tissues (Supplementary Table 1). Next, we performed a differential analysis between tumor and adjacent non-tumor tissues in the GSE14520 dataset, resulting in the identification of differentially expressed genes (Supplementary Table 1). This analysis resulted in a gene set comprising 24 differentially expressed liver regeneration-related genes (DELRGs) (Figure 2A). Among these 24 DELRGs, 7 were up-regulated and 17 were down-regulated in tumor tissues (Figure 2B). To further validate these findings, we examined the expression of the 24 DELRGs in the transcriptome database ICGC-LIHC and proteome database CPTAC-LIHC (Supplementary Figure 1A and B). Additionally, we explored the correlations of these genes in non-tumor tissues from the GSE14520 dataset (Figure 2C), selecting them as key marker genes for subsequent modeling. To future validate the liver regeneration reflection capability of the 24 DELRGs, we utilized the GSE18842124 dataset and applied sssGSEA to score the samples. The resulting score was termed the “LR score”. We observed a significant increase in the LR score 36 hours after partial hepatectomy (PH), providing further validation that our 24 DELRGs can effectively represent the biological behavior of liver regeneration (Figure 2D).
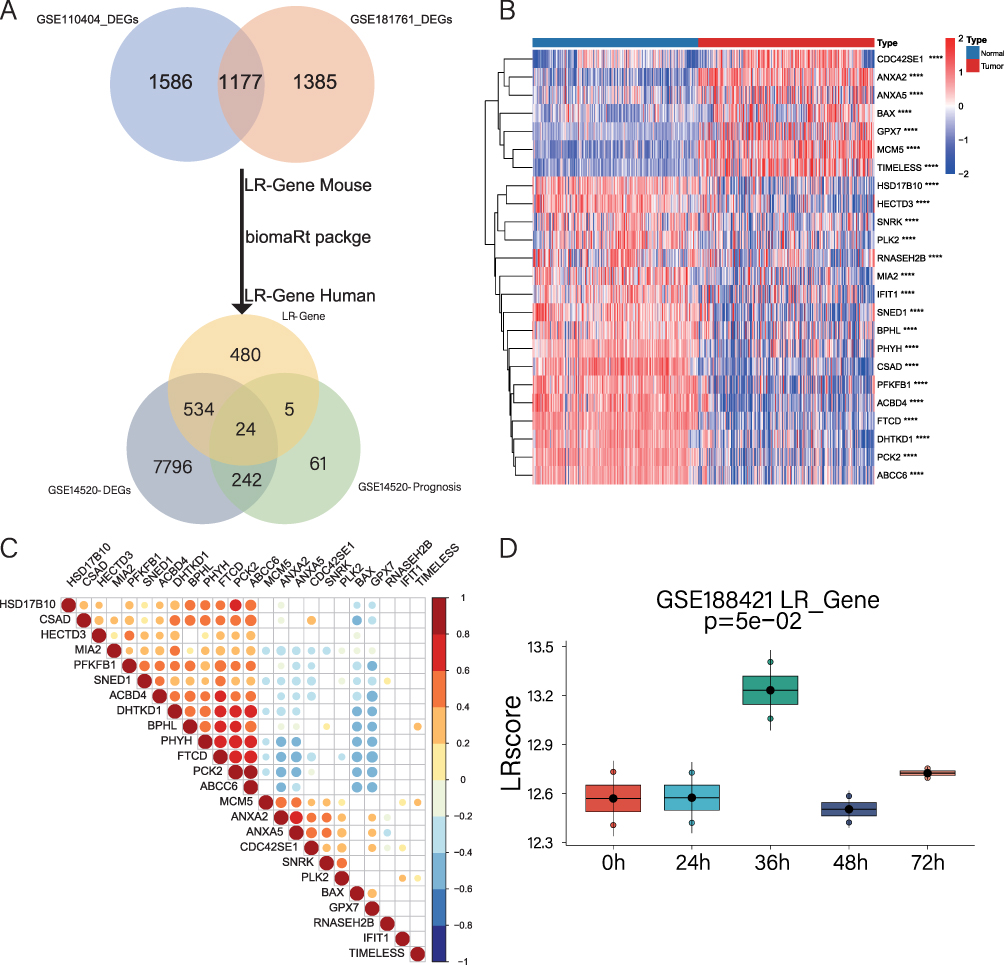 |
Figure 2 Identification of DELRGs and construction of LR scores. (A). Venn diagram shows the screening process of the 24 DELRGs. (B). Heat map of the expression of 24 DELRGs in GSE14520 dataset. (C). The correlation of 24 DELRGs in non-tumor tissues from the GSE14520 dataset is shown. (D). LR scores were validated in the GSE188421 dataset and presented as box plots. |
LR Score Effectively Predicts Prognosis of HCC Patients in Non-Tumor Tissues
To verify the applicability of the LR score in predicting the survival probability of HCC patients, we divided the non-tumor tissues from the GSE14520 training set and the two validation sets (ICGC-LIHC and CPTAC-LIHC) into high LR score subgroups and low LR score subgroups based on the median value. The data was then visualized by a two-dimensional PCA map (Figure 3A). As expected, the number of deaths among patients with HCC significantly decreased as the LR score increased in all cohorts (Figure 3B and C). Furthermore, in the KM analysis, we observed that patients with higher LR scores had a higher probability of OS (Figure 3D, GSE14520, p=0.034; ICGC-LIHC, p=0.005; CPTAC-LIHC, p=0.019). These results indicated a significant decrease in the number of HCC-related deaths among individuals with high LR scores. Additionally, the correlation table between the LR score and clinical indicators of non-tumor tissues also proved that certain clinical indicators were more favorable in patients with high LR scores (Table 1).
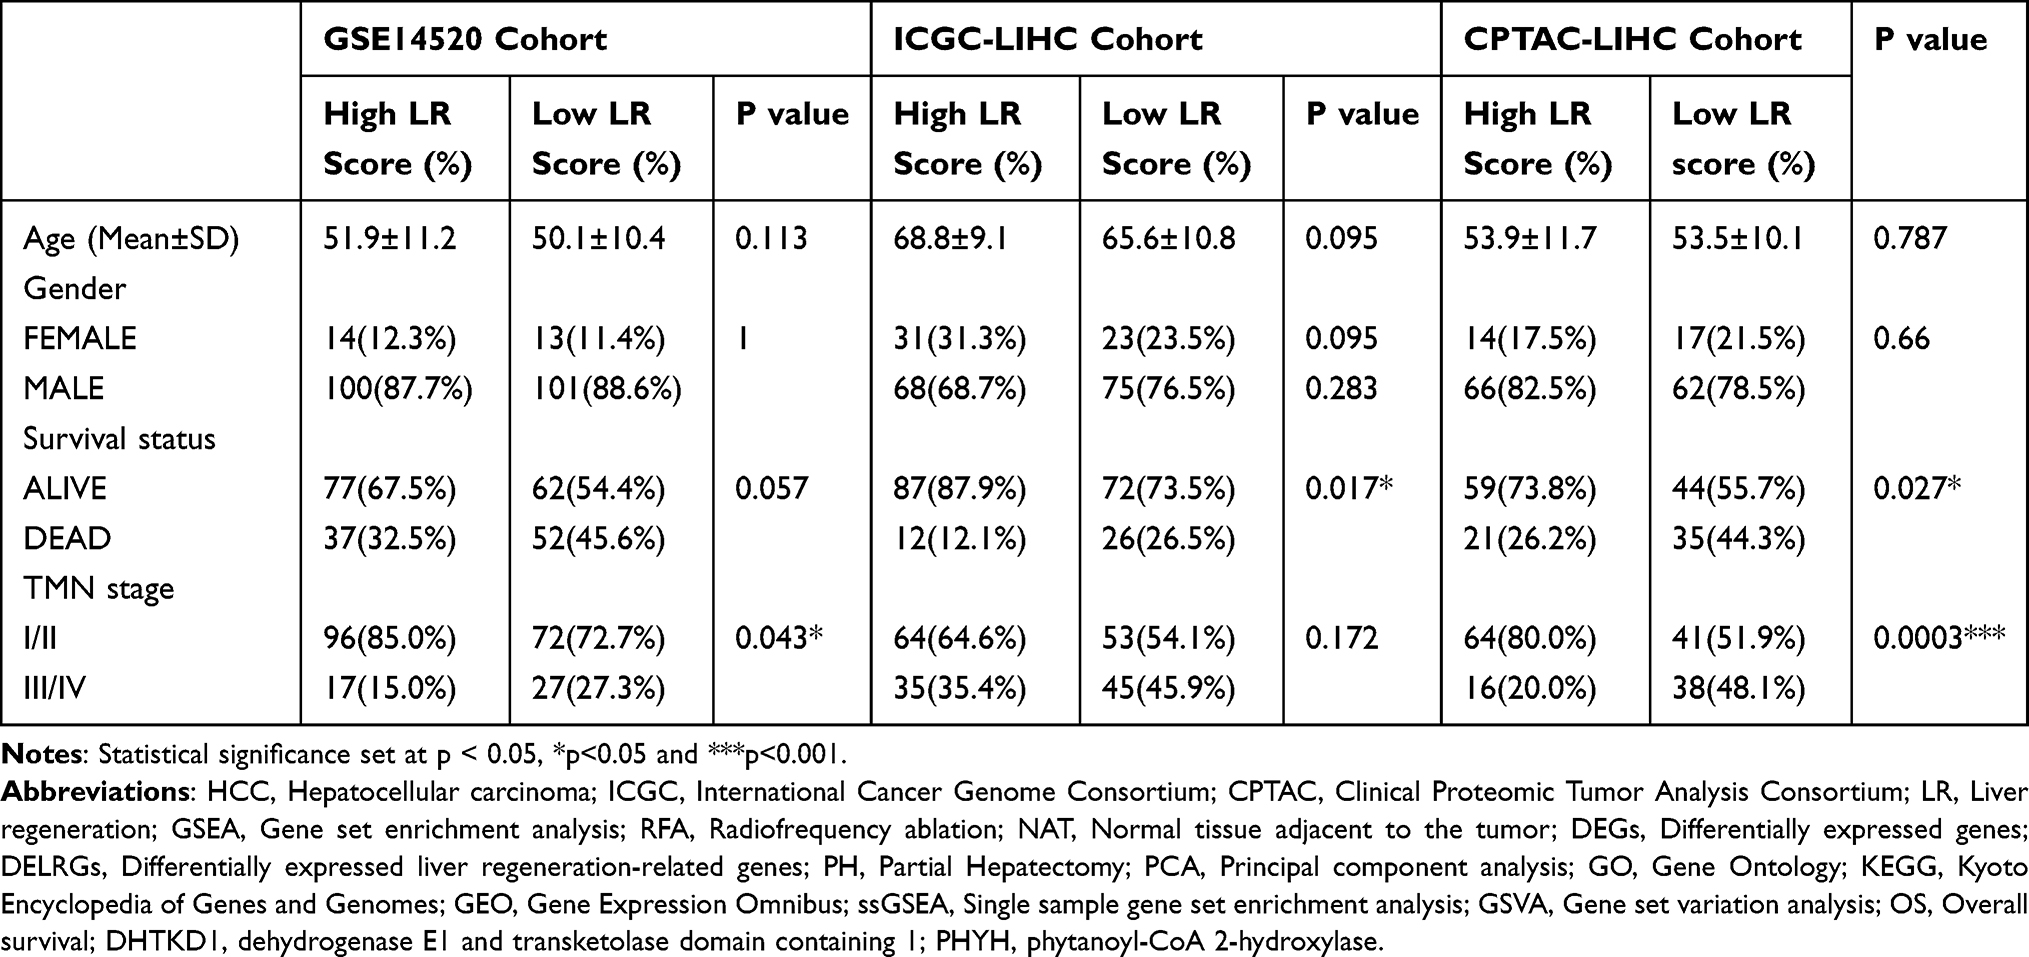 |
Table 1 Clinical Characteristics of HCC Patients in High and Low LR Scores in This Study |
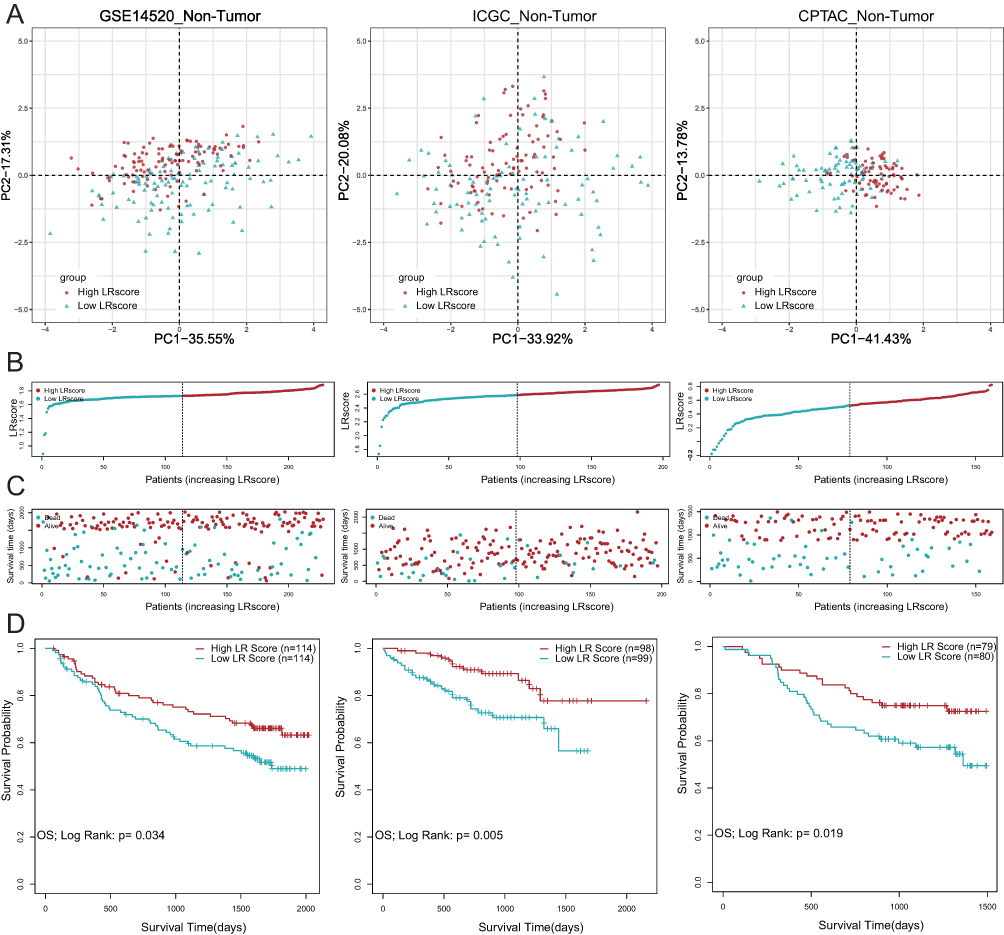 |
Figure 3 Establishment and validation of LR gene signature to predict clinical outcome for HCC patients. (A) Principal component analysis (PCA) based on LR score levels in non-tumor tissues in GSE14520, ICGC-LIHC and CPTAC-LIHC. (B and C) Distribution of patient survival status and survival time according to the LR score in non-tumor tissues in GSE14520, ICGC-LIHC and CPTAC-LIHC. (D) Overall survival curves in non-tumor tissues in GSE14520, ICGC-LIHC and CPTAC-LIHC. |
Biological Characteristics of LR Score Groups
Based on the previous results indicating varying patient outcomes depending on LR score, we aimed to investigate the underlying mechanisms contributing to this phenomenon. To achieve this, we conducted functional enrichment analyses using the CPTAC-LIHC data. We identified 3353 genes as differential genes based on the LR score grouping (Supplementary Table 2). Subsequently, GO and KEGG enrichment analyses showed that “carboxylic acid metabolic process”, “amino acid metabolic process”, “steroid metabolic process”, “fatty acid metabolic process”, “cellular response to xenobiotic stimulus” and “lipid metabolic process” were upregulated in patients with high LR scores. Conversely, pathways associated with “cell-substrate junction” were downregulated in high LR score patients, as indicated by the GSEA analysis (Figure 4A). Additionally, KEGG pathways correlated with “Glycine, serine and threonine metabolism”, among others, were all upregulated in high LR score patients, as revealed by GSEA (Figure 4B). GO enrichment analysis of the upregulated DEGs (|log2FC|>0), such as “small molecule catabolic process” were upregulated in the high LR score group, suggesting that non-tumor tissues in this group exhibited similarities to healthy liver status (Figure 4C).
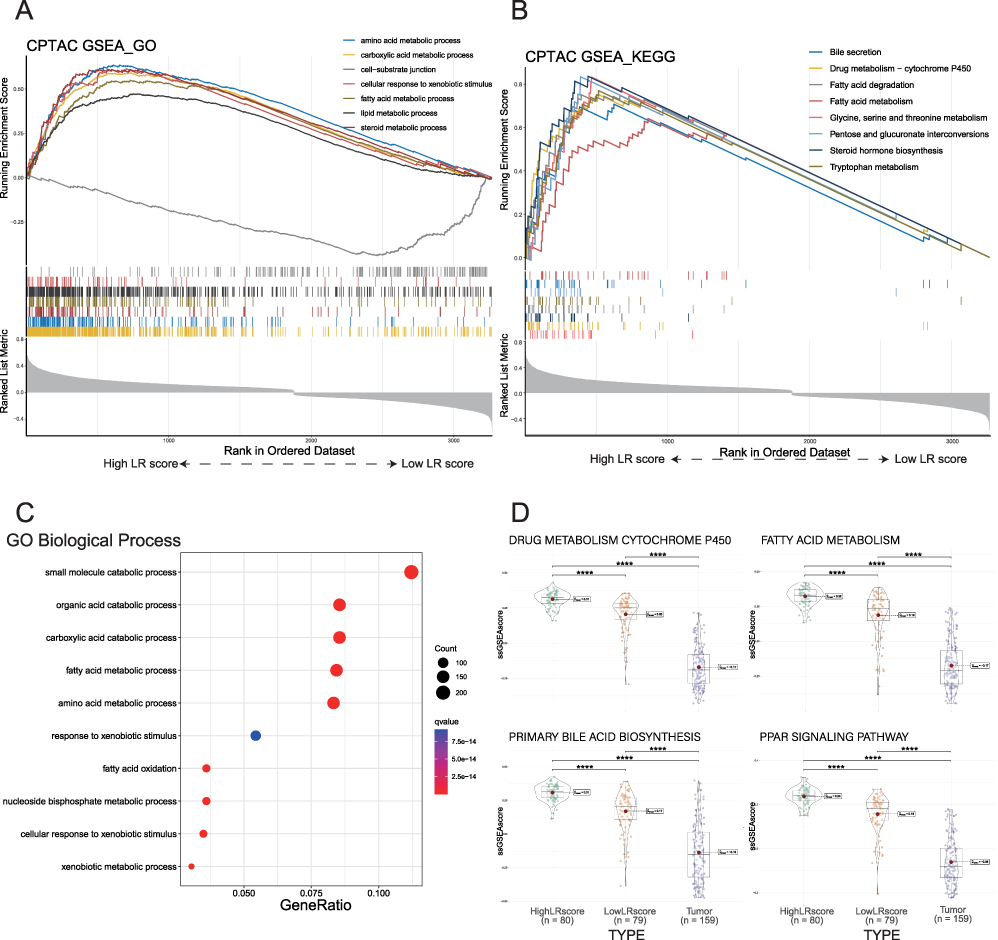 |
Figure 4 Functional analysis of DEGs between high and low LR score groups in non-tumor tissues. (A). Seven representative GO pathways were enriched in the high LR score group by GSEA analysis. (B). Eight representative upregulated KEGG pathways in the high LR score group by GSEA analysis. (C). GO BP enrichment analysis was performed for upregulated DEGs between high and low LR score groups. (D). The ssGSEA scores of the three categories of tissues in the four KEGG representative pathways are presented as violin plots. |
Among the KEGG pathways examined, “drug metabolism cytochrome P450”, “fatty acid metabolism”, “primary bile acid biosynthesis” and “PPAR signaling pathway” were not only related to liver metabolism but also played a role in liver regeneration.25–28 We selected these four pathways for further validation. We sorted the paired tumor tissues with high and low LR score groups (Figure 4D). The low LR score group had a lower ssGSEA score in these four pathways, suggesting that the low LR score group more closely resembles tumor tissue. It was highly concordant with our findings on non-tumor tissues from GSE14520 and ICGC-LIHC datasets (Supplementary Figure 2A–D). This further supports the conclusion that tissues with higher LR scores exhibit biological behavior more akin to that of normal liver tissue.
The Key LR Score Genes: DHTKD1 and PHYH Play Important Roles in the Prognosis of Non-Tumor Tissues
To identify hub genes contributing to prognosis in non-tumor tissues, we divided the non-tumor tissues from GSE14520 into groups based on LR score and analyzed the expression of levels of the 24 DELRGs in the gene set (Figure 5A). Among them, 18 genes exhibited significant differential expression between high and low groups (P<0.05). In the validation set (ICGC-LIHC/CPTAC-LIHC), 14 DELRGs were also differentially expressed between high and low LR score groups (Supplementary Figure 3A), underscoring the importance of these genes in liver regeneration and prognosis. Using LASSO COX regression analysis, we further selected 2 DELRGs, dehydrogenase E1 and transketolase domain containing 1 (DHTKD1) and phytanoyl-CoA 2-hydroxylase (PHYH), for further examination (Figure 5B and C). Both DHTKD1 (p=0.0077) and PHYH (p=0.0061) were strongly associated with prognosis in non-tumor tissues of GSE14520 (Figure 5D). Validation was also performed in the validation dataset (CPTAC-LIHC/ICGC-LIHC), where DHTKD1 showed prognostic significance in non-tumor tissues of ICGC-LIHC (p=0.0119) and PHYH showed prognostic significance in non-tumor tissues of CPTAC-LIHC (p=0.0354) (Supplementary Figure 3B and C). Notably, higher expression levels of both DHTKD1 and PHYH were associated with better prognosis, suggesting their positive roles in the overall prognosis of HCC.
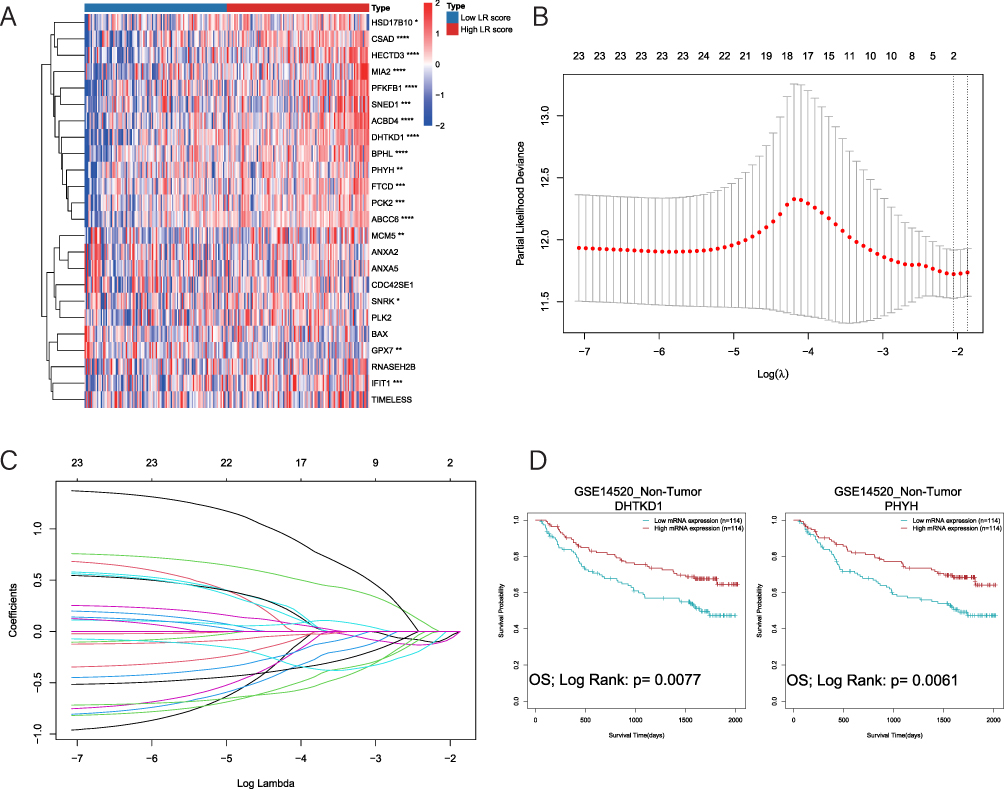 |
Figure 5 DHTKD1 and PHYH play important roles in the prognosis of non-tumor tissues. (A). Heat map of the expression of 24 DELRGs in the high and low LR score group in non-tumor tissues of the GSE14520 dataset. (B and C). 2 signature LR genes were selected by LASSO Cox regression analysis. (D). Higher expression of DHTKD1 and PHYH has better prognosis in non-tumor tissues of the GSE14520 dataset. |
Validation of DHTKD1 and PHYH Roles in Experimental Model of Liver Regeneration
To investigate the role of DHTKD1 and PHYH in liver regeneration, we established a mouse model of 70% hepatectomy (PH) for further experimentation (Figure 6A). Liver tissues were collected at 0, 1, 3, 5, and 7 days after surgery to examine the regenerative process (Figure 6B). The liver underwent significant regeneration at multiple time points after PH, as evidenced by the liver body weight ratio (Figure 6C). Initially, we used Western blot analysis to assess the expression levels of DHTKD1 and PHYH, with PCNA serving as a quality control measure (Figure 6D). During the proliferation phase, both DHTKD1 and PHYH exhibited decreased expression levels, which subsequently returned to normal levels during the termination phase.29,30 Subsequently, to further validate these findings, we performed immunohistochemical staining of liver tissue using Ki67 as a marker of proliferation. The results obtained were consistent with the Western blot analysis (Figure 6E). Notably, both DHTKD1 and PHYH demonstrated downregulation at 3 days after PH, followed by a recovery to normal levels at 7 days after PH. These results suggest that DHTKD1 and PHYH may play integral roles in the proliferative and termination phases of liver regeneration.
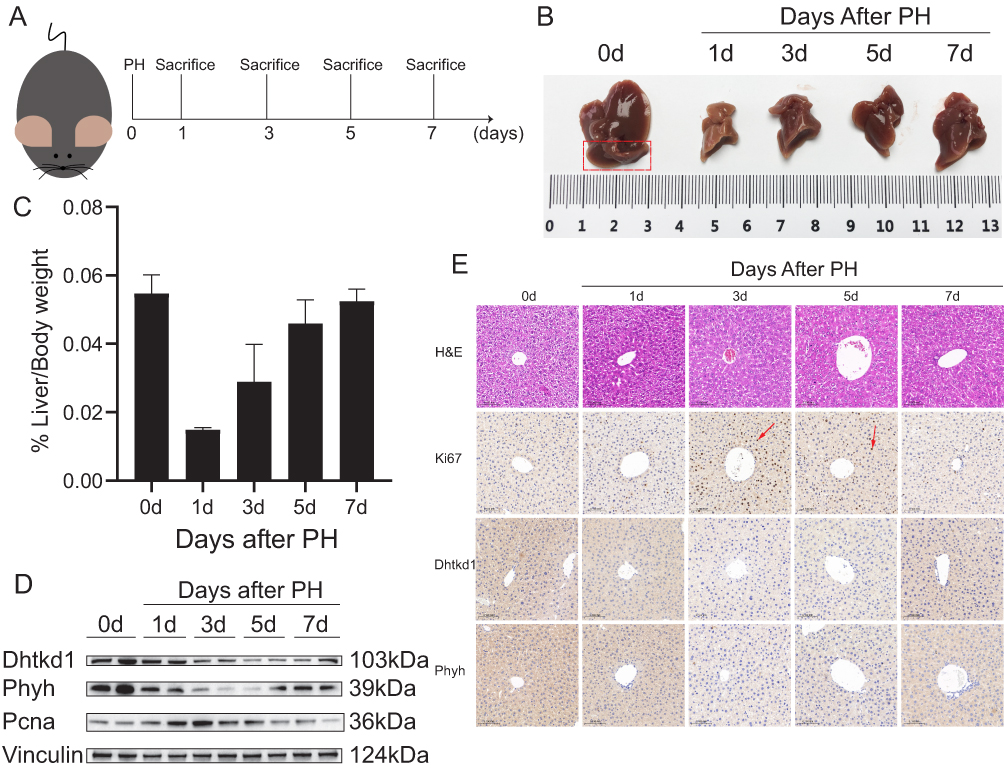 |
Figure 6 Validation of DHTKD1 and PHYH in experimental model of liver regeneration. (A). Schematic illustration of the experimental design of the mouse model. (B). Mouse livers on days 0, 1, 3, 5, and 7 after PH showed differences in liver size at different time points in liver regeneration. (C). Liver/Body weight ratio at different time points. (D). The expression of DHTKD1 and PHYH in liver tissue at different time points after PH was detected by Western blot. (E). H&E staining, Ki-67 staining of mouse livers after PH and the validation of DHTKD1 and PHYH expression. Scale bar: 0.100 mm. |
Discussion
Despite the completion of hepatectomy, the risk of recurrence remains in HCC patients. Effective and accurate biomarkers are essential for determining patient prognosis. However, previous studies have primarily focused on HCC tumor tissues, often overlooking the potential significance of non-tumor tissues, with only a limited number of studies exploring adjacent tissues.15 In recent studies, researchers commonly explore the association between gene sets and prognosis using HCC tumor tissues. For instance, in lysosome-related genes,31 glycolysis, gluconeogenesis,10 and immune infiltration aspects,32 they construct a prognostic model to predict the prognosis of HCC patients. In recent research concerning non-tumor tissues and the prognosis of HCC patients, researchers have emphasized a particular subtype of liver cancer, namely hepatitis B-related hepatocellular carcinoma. They have identified specific proteins for prognostic analysis.15 Notably, these studies offer the advantage of concentrating on diverse gene sets and leveraging a substantial number of cohorts for model validation. In this study, we utilized a set of 24 liver regeneration-related genes to predict the prognosis of HCC patients using non-tumor tissues. Remarkably, we found that patients with high LR scores had better prognoses and were more similar to healthy liver tissue, which is consistent with Gao’s view: non-tumor tissues exhibited biological behavior similar to that of healthy liver tissue.33 Previous studies have also shown that biomarkers in non-tumor tissues are associated with HCC progression, metastasis, and survival.34 “Bile secretion”26 “Drug metabolism-cytochrome P450”28 and “Fatty acid degradation”25 were all up-regulated in the high LR score group, indicating better metabolic function in their non-tumor tissues. These findings suggest that these pathways were worthy directions in future liver regeneration research.
Liver regeneration is a complex process involving many metabolic pathways.7 Typically, liver regeneration is categorized into three phases: initiation phase, proliferation phase and termination phase.29,30 While extensive research has focused on each phase, Xue35 examined the termination stage of liver regeneration. They identified the involvement of pathways such as “cell-cell adhesion”, “translation” and “oxidation-reduction process” pathways that play a role in the termination stage. The “cell-cell adhesion” pathway was also enriched in our study and found to be downregulated in the high LR score group across two datasets (Supplementary Table 3). This suggests that the liver cell structure is more stable and the liver regeneration function is better in the high LR score group. Two genes, DHTKD1 and PHYH, which were downregulated at the early stage of liver regeneration (days 1–3 post-PH) and returned to normal levels at the termination stage, were identified in this study (Figure 6D and E). DHTKD1 is known to be involved in amino acid metabolism, particularly lysine metabolism,36 and plays a role in glycolipid metabolism. DHTKD1 is a key regulator of mitochondrial metabolism, influencing lysine metabolism, energy production, and ROS balance.37 Previous research has also shown that DHTKD1 is associated with energy metabolism. The role of DHTKD1 in liver regeneration and its relationship with metabolism warrant further investigation.
The role of PHYH, a peroxisomal enzyme, in lipid-related pathways is still not fully understood, despite the established importance of peroxisomes in various lipid-related processes.38 However, it has been demonstrated that PHYH, as a PTS2-containing protein, serves as a substrate of TYSND2, affecting peroxisomal localization.39 PHYH catalyzes the first stage of the peroxisomal α-oxidation pathway. However, it has been shown that PHYH, as a PTS2-containing protein, is a substrate of TYSND2 and affects peroxisomal localization. PHYH catalyzes the initial step of the peroxisomal α-oxidation pathway. Deficiency of PHYH leads to the accumulation of the branched-chain fatty acid phytate, resulting in hepatic steatosis and dysfunction in peroxisomal metabolism.40 Notably, PHYH has been identified as a potential biomarker for predicting the prognosis of several cancers. Consistent with our study, higher expression of PHYH is associated with better prognosis in head and neck squamous cell carcinoma (HNSCC) and renal clear cell carcinoma (CCRCC).41–43 Additionally, PHYH is highly expressed in ischemia-reperfusion injury (IRI) and holds potential as a diagnostic biomarker for IRI.44 In our study, we observed that higher expression of PHYH in non-tumor tissues of HCC patients correlated with better prognosis. Both DHTKD1 and PHYH are proteins related to metabolism, but it remains unknown whether they participate in the metabolic reprogramming of tumors, which could influence the biological behavior of normal tissues. This remains a challenge for future research.
Despite the advantages of the current study, there are some limitations. While we have established a connection between liver regeneration-related genes, non-tumor tissues, and HCC prognosis, further experiments and additional cohorts are necessary to validate our findings. Furthermore, although we have demonstrated the involvement of two key LR genes in HCC prognosis in non-tumor tissues, more genes with similar functions and their underlying mechanisms require exploration. Additionally, the search for additional biomarkers, including serological markers, is essential for predicting the prognosis of HCC patients. We will continue to incorporate emerging data and validate our proposed signature in future studies.
Conclusion
In conclusion, the liver regeneration-related genes presented in this study are practical prognostic indicators that can be used to assess the survival outcome of patients with HCC by non-tumor tissues, with significant differences. Furthermore, this study identified two representative key genes that can indicate the prognosis of non-tumor tissues and the capacity for liver regeneration.
Data Sharing Statement
All data supporting the findings of this study are available within the paper and its supplementary information.
Ethics Statement
This study conformed to the principles outlined in the Declaration of Helsinki (World Medical Association Declaration of Helsinki). Approval for this retrospective observational study was obtained from the Ethics Committee of Nanjing Drum Tower Hospital, and the need to obtain informed consent was waived. Animal care protocols and experiments were performed in accordance with the Guide for the Care and Use of Laboratory Animals and approved by the Institutional Animal Care and Use Committee of Experimental Animal Center of Drum Tower Hospital, China (2022AE01019).
Author Contributions
All authors made a significant contribution to the work reported, whether that is in the conception, study design, execution, acquisition of data, analysis and interpretation, or in all these areas; took part in drafting, revising or critically reviewing the article; gave final approval of the version to be published; have agreed on the journal to which the article has been submitted; and agree to be accountable for all aspects of the work.
Funding
This work was supported by grants from the National Natural Science Foundation of China (No. 82002509, 82173129), the Special Fund of Nanjing Health Science and Technology Development (No. YKK21079), the Start-up Funding for Talent Introduction of Drum Tower Hospital (RC2023-032), the China Postdoctoral Science Foundation (no. 2023M731622) and the Fundings for Clinical Trials from the Affiliated Drum Tower Hospital, Medical School of Nanjing University (2021-LCYJ-MS-12).
Disclosure
The authors declare that they have no competing interests.
References
1. Sung H, Ferlay J, Siegel RL, et al. Global cancer statistics 2020: globocan estimates of incidence and mortality worldwide for 36 cancers in 185 countries. CA Cancer J Clin. 2021;71(3):209–249. doi:10.3322/caac.21660
2. Kulik L, El-Serag HB. Epidemiology and management of hepatocellular carcinoma. Gastroenterology. 2019;156(2):477–491 e1. doi:10.1053/j.gastro.2018.08.065
3. Doycheva I, Thuluvath PJ. Systemic therapy for advanced hepatocellular carcinoma: an update of a rapidly evolving field. J Clin Exp Hepatol. 2019;9(5):588–596. doi:10.1016/j.jceh.2019.07.012
4. Goh EL, Chidambaram S, Ma S. Laparoscopic vs open hepatectomy for hepatocellular carcinoma in patients with cirrhosis: a meta-analysis of the long-term survival outcomes. Int J Surg. 2018;50:35–42. doi:10.1016/j.ijsu.2017.12.021
5. Xu LX, He MH, Dai ZH, et al. Genomic and transcriptional heterogeneity of multifocal hepatocellular carcinoma. Ann Oncol. 2019;30(6):990–997. doi:10.1093/annonc/mdz103
6. Fausto N, Campbell JS, Riehle KJ. Liver regeneration. Hepatology. 2006;43(2 Suppl 1):S45–53. doi:10.1002/hep.20969
7. Michalopoulos GK, Bhushan B. Liver regeneration: biological and pathological mechanisms and implications. Nat Rev Gastroenterol Hepatol. 2021;18(1):40–55. doi:10.1038/s41575-020-0342-4
8. Kwon YJ, Lee KG, Choi D. Clinical implications of advances in liver regeneration. Clin Mol Hepatol. 2015;21(1):7–13. doi:10.3350/cmh.2015.21.1.7
9. Yagi S, Hirata M, Miyachi Y, Uemoto S. Liver regeneration after hepatectomy and partial liver transplantation. Int J Mol Sci. 2020;21(21):8414. doi:10.3390/ijms21218414
10. Chen D, Aierken A, Li H, Chen R, Ren L, Wang K. Identification of subclusters and prognostic genes based on glycolysis/gluconeogenesis in hepatocellular carcinoma. Front Immunol. 2023;14. doi:10.3389/fimmu.2023.1232390
11. Peng X, Shi Y, Zhang B, Xu C, Lang J. Establishment of nucleic acid sensing pathways-based model in predicting response to immunotherapy and targeted drug in hepatitis virus-related hepatocellular carcinoma. J Med Virol. 2023;95(9): e29084.
12. Afra F, Mahboobipour AA, Salehi Farid A, Ala M. Recent progress in the immunotherapy of hepatocellular carcinoma: non-coding RNA-based immunotherapy may improve the outcome. Biomed Pharmacother. 2023;165:115104. doi:10.1016/j.biopha.2023.115104
13. Li B, Xu T, Liu C, et al. Liver-enriched genes are associated with the prognosis of patients with hepatocellular carcinoma. Sci Rep. 2018;8(1):11197. doi:10.1038/s41598-018-29237-5
14. Gong J, Li R, Chen Y, et al. HCC subtypes based on the activity changes of immunologic and hallmark gene sets in tumor and nontumor tissues. Briefings Bioinf. 2021;22(5). doi:10.1093/bib/bbaa427
15. Lin P, Wen DY, Pang JS, et al. Proteomics profiling of nontumor liver tissues identifies prognostic biomarkers in hepatitis B-related hepatocellular carcinoma. J Med Virol. 2023;95(1):e27732. doi:10.1002/jmv.27732
16. Aran D, Camarda R, Odegaard J, et al. Comprehensive analysis of normal adjacent to tumor transcriptomes. Nat Commun. 2017;8(1):1077. doi:10.1038/s41467-017-01027-z
17. Jakubek YA, Chang K, Sivakumar S, et al. Large-scale analysis of acquired chromosomal alterations in non-tumor samples from patients with cancer. Nat Biotechnol. 2020;38(1):90–96. doi:10.1038/s41587-019-0297-6
18. Hoshida Y, Villanueva A, Kobayashi M, et al. Gene expression in fixed tissues and outcome in hepatocellular carcinoma. N Engl J Med. 2008;359(19):1995–2004. doi:10.1056/NEJMoa0804525
19. McCarthy DJ, Chen Y, Smyth GK. Differential expression analysis of multifactor RNA-Seq experiments with respect to biological variation. Nucleic Acids Res. 2012;40(10):4288–4297. doi:10.1093/nar/gks042
20. Friedman J, Hastie T, Tibshirani R. Regularization paths for generalized linear models via coordinate descent. J Stat Softw. 2010;33(1):1–22. doi:10.18637/jss.v033.i01
21. Subramanian A, Tamayo P, Mootha VK, et al. Gene set enrichment analysis: a knowledge-based approach for interpreting genome-wide expression profiles. Proc Natl Acad Sci U S A. 2005;102(43):15545–15550. doi:10.1073/pnas.0506580102
22. Yu G, Wang LG, Han Y, He QY. clusterProfiler: an R package for comparing biological themes among gene clusters. OMICS. 2012;16(5):284–287. doi:10.1089/omi.2011.0118
23. Mitchell C, Willenbring H. A reproducible and well-tolerated method for 2/3 partial hepatectomy in mice. Nat Protoc. 2008;3(7):1167–1170. doi:10.1038/nprot.2008.80
24. Chen Y, Chen L, Wu X, et al. Acute liver steatosis translationally controls the epigenetic regulator MIER1 to promote liver regeneration in a study with male mice. Nat Commun. 2023;14(1):1521. doi:10.1038/s41467-023-37247-9
25. Caldez MJ, Bjorklund M, Kaldis P. Cell cycle regulation in NAFLD: when imbalanced metabolism limits cell division. Hepatol Int. 2020;14(4):463–474. doi:10.1007/s12072-020-10066-6
26. Li G, Guo GL. Farnesoid X receptor, the bile acid sensing nuclear receptor, in liver regeneration. Acta Pharm Sin B. 2015;5(2):93–98. doi:10.1016/j.apsb.2015.01.005
27. Jia Y, Viswakarma N, Reddy JK. Med1 subunit of the mediator complex in nuclear receptor-regulated energy metabolism, liver regeneration, and hepatocarcinogenesis. Gene Expr. 2014;16(2):63–75. doi:10.3727/105221614X13919976902219
28. Braeuning A. Regulation of cytochrome P450 expression by Ras- and beta-catenin-dependent signaling. Curr Drug Metab. 2009;10(2):138–158. doi:10.2174/138920009787522160
29. Yang H, Guo J, Jin W, Chang C, Guo X, Xu C. A combined proteomic and metabolomic analyses of the priming phase during rat liver regeneration. Arch Biochem Biophys. 2020;693:108567. doi:10.1016/j.abb.2020.108567
30. Abu Rmilah A, Zhou W, Nelson E, Lin L, Amiot B, Nyberg SL. Understanding the marvels behind liver regeneration. Wiley Interdiscip Rev Dev Biol. 2019;8(3):e340. doi:10.1002/wdev.340
31. Li H, Li J, Qu X, et al. Establishment and validation of a novel lysosome-related gene signature for predicting prognosis and immune landscape in hepatocellular carcinoma. J Cancer Res Clin Oncol. 2023;149(19):17543–17557. doi:10.1007/s00432-023-05477-5
32. Wu R, Gao Y, Zhao X, et al. Tumor biology, immune infiltration and liver function define seven hepatocellular carcinoma subtypes linked to distinct drivers, survival and drug response. Comput Biol Med. 2023:167. doi:10.1016/j.compbiomed.2023.107593
33. Zhu H, Lin Y, Lu D, et al. Proteomics of adjacent-to-tumor samples uncovers clinically relevant biological events in hepatocellular carcinoma. Natl Sci Rev. 2023. doi:10.1093/nsr/nwad167
34. Budhu A, Forgues M, Ye QH, et al. Prediction of venous metastases, recurrence, and prognosis in hepatocellular carcinoma based on a unique immune response signature of the liver microenvironment. Cancer Cell. 2006;10(2):99–111. doi:10.1016/j.ccr.2006.06.016
35. Wu J, Liu H, Wang H, et al. iTRAQ-based quantitative proteomic analysis of the liver regeneration termination phase after partial hepatectomy in mice. J Proteomics. 2022;267:104688. doi:10.1016/j.jprot.2022.104688
36. Xu WY, Shen Y, Zhu H, et al. 2-Aminoadipic acid protects against obesity and diabetes. J Endocrinol. 2019;243(2):111–123. doi:10.1530/joe-19-0157
37. Bezerra GA, Foster WR, Bailey HJ, et al. Crystal structure and interaction studies of human DHTKD1 provide insight into a mitochondrial megacomplex in lysine catabolism. IUCrJ. 2020;7(Pt 4):693–706. doi:10.1107/S205225252000696X
38. Morvay PL, Baes M, Van Veldhoven PP. Differential activities of peroxisomes along the mouse intestinal epithelium. Cell Biochem Funct. 2017;35(3):144–155. doi:10.1002/cbf.3255
39. Mizuno Y, Ninomiya Y, Nakachi Y, et al. Tysnd1 deficiency in mice interferes with the peroxisomal localization of PTS2 enzymes, causing lipid metabolic abnormalities and male infertility. PLoS Genet. 2013;9(2):e1003286. doi:10.1371/journal.pgen.1003286
40. Ferdinandusse S, Zomer AW, Komen JC, et al. Ataxia with loss of Purkinje cells in a mouse model for refsum disease. Proc Natl Acad Sci U S A. 2008;105(46):17712–17717. doi:10.1073/pnas.0806066105
41. Qian L, Zhou C, Wang K, Li L, Xia W, Fan Y. An investigation of the prognostic role of genes related to lipid metabolism in head and neck squamous cell carcinoma. Int J Genomics. 2023;2023:9708282. doi:10.1155/2023/9708282
42. Zhengqi Q, Zezhi G, Lei J, He Q, Jinyao P, Ying A. Prognostic role of PHYH for overall survival (OS) in clear cell renal cell carcinoma (ccRCC). Eur J Med Res. 2021;26(1):9. doi:10.1186/s40001-021-00482-1
43. Xiong Y, Si Y, Feng Y, Zhuo S, Cui B, Zhang Z. Prognostic value of lipid metabolism-related genes in head and neck squamous cell carcinoma. Immun Inflamm Dis. 2021;9(1):196–209. doi:10.1002/iid3.379
44. Xu R, Jiang W, Liu Y, et al. Single cell sequencing coupled with bioinformatics reveals PHYH as a potential biomarker in kidney ischemia reperfusion injury. Biochem Biophys Res Commun. 2022;602:156–162. doi:10.1016/j.bbrc.2022.02.095
 © 2023 The Author(s). This work is published and licensed by Dove Medical Press Limited. The full terms of this license are available at https://www.dovepress.com/terms.php and incorporate the Creative Commons Attribution - Non Commercial (unported, v3.0) License.
By accessing the work you hereby accept the Terms. Non-commercial uses of the work are permitted without any further permission from Dove Medical Press Limited, provided the work is properly attributed. For permission for commercial use of this work, please see paragraphs 4.2 and 5 of our Terms.
© 2023 The Author(s). This work is published and licensed by Dove Medical Press Limited. The full terms of this license are available at https://www.dovepress.com/terms.php and incorporate the Creative Commons Attribution - Non Commercial (unported, v3.0) License.
By accessing the work you hereby accept the Terms. Non-commercial uses of the work are permitted without any further permission from Dove Medical Press Limited, provided the work is properly attributed. For permission for commercial use of this work, please see paragraphs 4.2 and 5 of our Terms.