Back to Journals » International Journal of Nanomedicine » Volume 16
Lipoparticles for Synergistic Chemo-Photodynamic Therapy to Ovarian Carcinoma Cells: In vitro and in vivo Assessments
Authors Ali S, Amin MU, Tariq I, Sohail MF, Ali MY, Preis E, Ambreen G, Pinnapireddy SR, Jedelská J ![]() , Schäfer J
, Schäfer J ![]() , Bakowsky U
, Bakowsky U ![]()
Received 10 October 2020
Accepted for publication 17 December 2020
Published 11 February 2021 Volume 2021:16 Pages 951—976
DOI https://doi.org/10.2147/IJN.S285950
Checked for plagiarism Yes
Review by Single anonymous peer review
Peer reviewer comments 3
Editor who approved publication: Dr Thomas Webster
Sajid Ali,1 Muhammad Umair Amin,1,2 Imran Tariq,1,3 Muhammad Farhan Sohail,4,5 Muhammad Yasir Ali,1,6 Eduard Preis,1 Ghazala Ambreen,1 Shashank Reddy Pinnapireddy,1 Jarmila Jedelská,1 Jens Schäfer,1 Udo Bakowsky1
1Department of Pharmaceutics and Biopharmaceutics, University of Marburg, Marburg, Germany; 2Faculty of Pharmacy, The University of Lahore, Lahore, Pakistan; 3Punjab University College of Pharmacy, University of the Punjab, Allama Iqbal Campus, Lahore, Pakistan; 4Riphah Institute of Pharmaceutical Sciences (RIPS), Riphah International University, Lahore, Pakistan; 5Department of Pharmacy, Faculty of Health and Medical Science, University of Copenhagen, Copenhagen, Denmark; 6Faculty of Pharmaceutical Sciences, GC University Faisalabad, Faisalabad, Pakistan
Correspondence: Udo Bakowsky
Department of Pharmaceutics and Biopharmaceutics, University of Marburg, Robert Koch Str. 4, Marburg, 35037, Germany
Tel + 49 6421 28 25884
Fax + 49 6421 28 27016
Email [email protected]
Purpose: Lipoparticles are the core-shell type lipid-polymer hybrid systems comprising polymeric nanoparticle core enveloped by single or multiple pegylated lipid layers (shell), thereby melding the biomimetic properties of long-circulating vesicles as well as the mechanical advantages of the nanoparticles. The present study was aimed at the development of such an integrated system, combining the photodynamic and chemotherapeutic approaches for the treatment of multidrug-resistant cancers.
Methods: For this rationale, two different sized Pirarubicin (THP) loaded poly lactic-co-glycolic acid (PLGA) nanoparticles were prepared by emulsion solvent evaporation technique, whereas liposomes containing Temoporfin (mTHPC) were prepared by lipid film hydration method. Physicochemical and morphological characterizations were done using dynamic light scattering, laser doppler anemometry, atomic force microscopy, and transmission electron microscopy. The quantitative assessment of cell damage was determined using MTT and reactive oxygen species (ROS) assay. The biocompatibility of the nanoformulations was evaluated with serum stability testing, haemocompatibility as well as acute in vivo toxicity using female albino (BALB/c) mice.
Results and Conclusion: The mean hydrodynamic diameter of the formulations was found between 108.80 ± 2.10 to 405.70 ± 10.00 nm with the zeta (ζ) potential ranging from − 12.70 ± 1.20 to 5.90 ± 1.10 mV. Based on the physicochemical evaluations, the selected THP nanoparticles were coated with mTHPC liposomes to produce lipid-coated nanoparticles (LCNPs). A significant (p< 0.001) cytotoxicity synergism was evident in LCNPs when irradiated at 652 nm, using an LED device. No incidence of genotoxicity was observed as seen with the comet assay. The LCNPs decreased the generalized in vivo toxicity as compared to the free drugs and was evident from the serum biochemical profile, visceral body index, liver function tests as well as renal function tests. The histopathological examinations of the vital organs revealed no significant evidence of toxicity suggesting the safety and efficacy of our lipid-polymer hybrid system.
Keywords: atomic force microscopy, FACS, in vivo, in vitro cytotoxicity, lipid-polymer hybrid nanoparticles, photodynamic therapy, PLGA nanoparticles, TEM
Introduction
The combination therapy is referred to as the simultaneous administration of two or more pharmacologically active moieties which can alter the different signaling pathways in the infectious sites.1 The anticancer combination therapy has been proved to be an effective treatment strategy than the delivery of the single drug modality. This therapy can significantly reduce the side effects, increase the treatment efficacy, and potentially overcome the multidrug resistance, which could be a major limiting factor to the success of anticancer chemotherapy.2,3 To accomplish an effective enhancement, both the therapeutic moieties (with the different mechanisms of actions) shall be co-localized in the cancer cells. In such therapeutic systems, the increased potency of the anticancer drugs can be observed at the lower effective dose that corresponds to the reduction in the cancer cell viability or tumor volume as compared to two separate administered treatments.2 The combination of chemotherapy and photodynamic therapy has emerged as a promising strategy for the treatment of the cancer.
Pirarubicin ([2″R]‐4′‐O‐tetrahydropyranyl‐doxorubicin; THP) is an anthracycline derivative that inhibits type II topoisomerase and DNA polymerase. It is used for the treatment of a variety of cancers such as head, neck, breast, and lymphomas. THP is a pyranyl derivative of doxorubicin involving the generation of reactive oxygen species (ROS). Due to the presence of the pyranyl group and its lipophilic properties, it exhibits a more potent anticancer activity and faster cellular uptake than doxorubicin.4 The limitation of the THP mediated chemotherapy is the indiscriminate distribution into normal body tissues and organs before its delivery to the tumor thus causing adverse effects such as bone marrow suppression and cardiac and renal toxicity. All these adverse effects limit the use of THP in clinical settings.5 The pharmacokinetic parameters of THP can be modified by encapsulating it into a nanoparticulate system thus reducing the side effects and increasing the efficacy of the system. Nanocarriers composed of PLGA (Poly-D, L-lactide-co-glycolide) have been investigated to carry the drugs to their designated site of action. Being biocompatible and biodegradable, PLGA nanoparticles are interesting vehicles for the systemic delivery of THP.6
Temoporfin (Meso-tetrahyroxyphenyl chlorine; mTHPC) is one of the most potent second-generation photosensitizers used for the treatment of a variety of clinical disorders. After being administered, the mTHPC can be preferentially localized into the tumor tissue by exploiting the tumor′s EPR (enhanced permeability and retention) effect. After being activated by a specific wavelength (652 nm), it produces free radicals and singlet oxygen species that caused the destruction of cancer cells.7 However, its hydrophobic nature, poor aqueous solubility, and low bioavailability limit its application in anticancer therapies.8 To overcome these potential issues, the liposomal formulation of mTHPC was developed where it is encapsulated in a hydrophobic milieu thus increasing the bioavailability of the drug.
The present study was focused on the development of novel lipid-coated biodegradable nanoparticles (LCNP) consisting of a nanoparticle core surrounded by a liposomal membrane (Figure 1). This nanocarrier system was developed to provide a synergistic therapy to the cancer cells by concurrently delivering two different drugs. THP and mTHPC loaded formulations were evaluated using dynamic light scattering (DLS) and laser doppler anemometry (LDA) for size distribution and surface charge, respectively. Morphological characterizations were carried out using atomic force microscopy (AFM) and transmission electron microscopy (TEM). Besides, the in vitro cell viability assay was conducted using ovarian carcinoma (SK-OV-3) cells and IC50 values for the THP loaded PLGA nanoparticles, mTHPC loaded liposomes, as well as lipid-coated nanoparticles (LCNPs), were calculated. In vitro hemocompatibility using activated partial thromboplastin time (aPTT) and ex-vivo hemolysis assay was determined. Stability studies in simulated physiological conditions were also performed. Acute in vivo toxicity assessment including blood biochemistry and histopathological examinations were conducted using albino female albino (BALB/c) mice.
 |
Figure 1 Schematic illustration of the preparation of lipid enveloped biodegradable nanoparticles. |
Materials and Methods
Materials
Pirarubicin ([2″R]‐4′‐O‐tetrahydropyranyl‐doxorubicin; THP) (98% pure) was purchased from Selleckchem (Absource diagnostics, München, Deutschland). Temoporfin (5, 10, 15, 20-tetrakis (3-hydroxyphenyl) chlorin; mTHPC) was procured from Cayman chemicals (Hamburg, Germany). 1,2-dipalmitoyl-sn-glycero-3-phosphatidylcholine (DPPC); 1,2-dipalmitoyl-sn-glycero-3-phosphoethanolamine-N-[methoxy(polyethylene glycol)-5000] (DPPE-mPEG5000) and 2-dipalmitoyl-sn-glycero-3-phospho-(1′-rac-glycerol) (sodium salt) (DPPG) were obtained as gift sample from Lipoid GmbH (Ludwigshafen, Germany). PLGA (Resomer® RG 503 H, Poly (D, L-lactide-co-glycolide)) was supplied by Evonik (Essen, Germany). Poly (vinyl alcohol) (PVA, Mowiol 4–88) was purchased from Kuraray (Hattersheim, Germany). Polysorbate 80 (Tween 80); 3-(4,5-dimethylthiazol-2yl)-2,5-diphenyltetrazolium bromide (MTT) and 2′,7′-dichlorodihydrofluorescein diacetate (H2DCFDA) were obtained from Sigma Aldrich Chemie GmbH (Taufkirchen, Germany). Fetal calf serum (FCS) and Iscove’s modified medium (IMDM) were purchased from Capricon scientific (Ebsdorfergrund, Germany). Dimethyl sulfoxide (DMSO) was procured from Carl Roth GmbH & Co. (Karlsruhe, Germany). HPLC grade Organic solvents (chloroform (CHCl3), methanol (MeOH), ethanol (EtOH), Ethyl acetate) were obtained from VWR International (Darmstadt, Germany). Sterile filtered ultra-pure (PureLab flex-4 dispenser, ELGA Lab water, High Wycombe, UK) water was used for all the experiments. Phosphate buffered saline (PBS) pH 7.4 was freshly prepared, sterile filtered, and stored in the fridge for further use.
Cell Culture
The human wild type ovarian adenocarcinoma cell line (SK-OV-3) was procured from ATCC (American type culture collection, Manassas, USA). The cell line was cultivated in the Iscove’s modified Dulbecco’s medium (IMDM) (Capricorn Scientific, Ebsdorfergrund, Germany) supplemented with 10% fetal calm serum (FCS) (Sigma-Aldrich/Merck, Darmstadt, Germany) and MEM non-essential amino acids (Gibco™, Thermo-Fischer). The cells were cultured at 37°C and 7% CO2 under humid conditions. The medium was replenished every other day and the cells were grown as a monolayer and sub-cultured upon 80% confluency.
Preparation of THP Loaded Nanoparticles
THP loaded PLGA nanoparticles and unloaded (blank) nanoparticles were prepared using the emulsion solvent evaporation technique as described by Kumar et al.9 Briefly, the THP stock solution was prepared by dissolving THP in ethyl acetate at a concentration of 1 mg/mL. One hundred milligrams of PLGA was dissolved in 5 mL of ethyl acetate containing 2 mg THP. The polymer-drug solution (organic phase) was then passed through a 0.2 µm nylon syringe filter (Pall Corporation, New York, USA) and was then added dropwise into the 0.30% or 1% (w/v) PVA solution (aqueous phase) to prepare two different sized nanoparticles. The formed o/w emulsion was then homogenized at 15,000 rpm using Ultra-Turrax with 18G stainless steel dispersing head (IKA-Werke, Staufen, Germany) for 10 min. One milliliter of chitosan (0.10%) was added to the formed nano-emulsion. The nanoprecipitation was amplified by the addition of ultrapure water dropwise to make up the volume to 30 mL. The organic phase was allowed to evaporate overnight by continuous stirring at room temperature to form the nanoparticle suspension. Similar procedure was followed to prepare the blank nanoparticles except for the addition of the THP stock solution. The following day, after the complete evaporation of the organic solvent, the nanoparticle suspension was centrifuged at 2000x g for 45 s using Eppendorf centrifuge 4518 (Eppendorf, Hamburg, Germany) to remove any formed flakes or agglomerates. The resultant pellet was discarded and the supernatant was washed with water to separate the unentrapped drug from the nanoparticles. The washing of the nanoparticles was done twice at 16000x g for 20 min. The nanoparticles suspension was then freeze-dried using Christ Beta 1–8LSC lyophilizer (Martin Christ Gefriertrocknungsanlagen GmbH Osterode am Harz, Germany) using 0.2% PVA as a cryoprotectant. The lyophilized nanoparticles were stored at 2–8°C until further analysis.10
Preparation of mTHPC Liposomes
The mTHPC loaded liposomes were formulated using Bangham′s conventional film hydration method.11 Briefly, DPPC, DPPG, and DPPE-mPEG5000 (85:10:5) were dissolved in a chloroform/methanol mixture. For drug-loaded liposomes, mTHPC was added to the lipid mixture at a ratio of 1:20. The organic solvents were evaporated using a rotary evaporator (Heidolph Laborota 4000 efficient, Heidolph Instruments, -Schwabach, Germany) equipped with a vacuum pump at 45°C. The film hydration was done using 1 mL PBS (pH 7.4) and thoroughly agitated to form the liposomes. The pre-formed liposomes were then sonicated in a bath-type sonicator (Elmasonic P, Elma Schmidbauer, Singen, Germany) for 10 min. The obtained multilamellar liposomes (MLVs) were extruded 21 times through a 100 nm polycarbonate membrane filter using Avanti mini-extruder® (Avanti Polar Lipids, Alabama, USA) to obtain unilamellar liposomes. The extruded liposomes were stored at 4°C until further analysis.12
Preparation of Lipid Enveloped Nanoparticles
The stoichiometry describes the relationship (typically a ratio) between the relative quantities of the substances taking part in a particular reaction or forming a compound.13 To optimize the stoichiometry of mTHPC liposomes and THP loaded polymeric nanoparticles, different liposome: NP mass ratios were attempted and were then optimized to 1:100. The lipid layer on the particle surface was formed using the fusion method. Briefly, an appropriate amount of mTHPC loaded liposomes was added to the THP loaded PLGA nanoparticle suspension and mixed thoroughly. The mixture was then sonicated for 20 min followed by incubation at room temperature for 1 h, resulting in the spontaneous fusion of self-organized lipid bilayer on the nanoparticle surface.6,13
Particle Size Distribution and ζ Potential
The hydrodynamic diameter and zeta potential (ζ) of the mTHPC loaded liposomes, THP loaded nanoparticles and lipid enveloped PLGA nanoparticles were analyzed using dynamic light scattering (DLS) and laser doppler anemometry (LDA) respectively using Zetasizer Nano ZS (Malvern Panalytica GmbH, Kassel, Germany). The instrument was equipped with a 10 mW HeNe laser at a wavelength of 633 nm at 25ºC and scattered light detection at 173°. Laser attenuation and measurement positions were automatically adjusted by the instrument with each measurement. The average particle diameter, polydispersity index (PDI), and surface charge of the particles were always measured using disposable capillary cell (DTS1060, Malvern Instruments) for all the samples by diluting (1:100) with purified water. For the analysis of data, the viscosity (0.88 mPa.s) and the refractive index of water (1.33) were taken into account.14,15 Data are expressed as mean ± S.D from the measurement of three independent samples (n=3) with each measurement comprising of 15–100 individual runs.
Encapsulation Efficiency (E.E)
For mTHPC loaded liposomes, the encapsulation efficiency was determined using the solvent extraction method. Briefly, 0.20 mL of the liposomal formulation was centrifuged in an air-driven ultracentrifuge Airfuge® (Beckman Coulter GmbH, Krefeld, Germany) for 90 min at 20 PSIG (60,000 rcf) using polyallomer microcentrifuge tubes (Beckman Coulter GmbH, Krefeld, Germany). The supernatant was separated and the pellet was resuspended in 0.20 mL of ethanol. Similarly, an equal volume of ethanol was added to the supernatant. The amount of mTHPC encapsulated was quantified from both solutions using a UV/VIS spectrophotometer (UV mini 1240, Shimadzu, Japan) at 420 nm.16 Liposomes having the same lipid composition without mTHPC were considered blank. The calibration curve for mTHPC was constructed in both ethanol and ethanol/water (1:1).
The encapsulation efficiency from the THP loaded PLGA nanoparticles was determined also by the solvent extracting technique. Briefly, 1 mL of freshly prepared nanoparticle suspension was centrifuged at 16000x g for 20 min using Eppendorf centrifuge 4518 (Eppendorf, Hamburg, Germany) to separate the unentrapped drug. The supernatant was withdrawn and an equal volume of acetonitrile was added to the supernatant. Similarly, the nanoparticle pellet was dissolved by the addition of 1 mL acetonitrile and sonicated for 15 min for the complete extraction of the drug. The absorbance from both of the solutions was determined using a UV/VIS spectrophotometer (UV mini 1240, Shimadzu, Japan) at 230 nm. Nanoparticles without drug were taken as a blank control. The amount of drug encapsulated was quantified using the calibration curves constructed in the same solvent systems with known THP concentrations.10
The percentage of drug encapsulated was calculated using the formula:10
Additionally, the % LC was also determined by the formula:
Atomic Force Microscopy (AFM)
For AFM studies, the nanoformulations were diluted to 1:100 with the water. One hundred microliters of diluted sample dispersion was placed on the silicon chip mounted on the glass slide and left to settle down for 20 min. The supernatant was then removed by aspiration using a lint-free wipe (Kimtech Science, Kimberly-Clark Europe Limited) and the sample was allowed to dry. AFM measurements were performed using vibration damped (i4 Series – Active Vibration Isolation, Accurion GmbH, Göttingen, Germany) NanoWizard®-3 NanoScience AFM system (JPK BioAFM, Bruker Nano GmbH, Berlin, Germany). HQ: NSC14/AL_BS (Mikromasch Europe, Wetzlar, Germany) cantilever tips with a resonance frequency of 160 kHz and nominal force constant of 5 N/m were used for the liposome measurements while HQ: NSC16/AL_BS with a resonance frequency of 190 kHz and force constant of 45 N/m were used for THP loaded PLGA nanoparticles and lipid-coated nanoparticles. The scan speed was adjusted between 0.5 and 1.5 Hz. These measurements were performed using the intermittent contact mode in the air to avoid sample disruption. The images were visualized using height measured, lock in amplitude as well as lock in-phase mode.17 The raw images were processed with JPK data processing software.
Transmission Electron Microscopy (TEM)
For the TEM analysis, the samples were diluted to 1:50 with water. Fifteen microliters of the diluted formulation was mounted on the 300 mesh formvar coated carbon-supported 0.03 mm copper grids (Plano GmbH, Wetzlar, Germany). The sample was allowed to stand for 5 min. The supernatant was then removed and the samples were negatively stained by adding 15 μL of 2% uranyl acetate on the copper grid (for contrast under the microscope) and allowed to incubate for 2 min. After the incubation is over, the excess of uranyl acetate was removed using wet tissue. The samples were then analyzed under the JEM-1400 Transmission Electron Microscope (Jeol Ltd; Tokyo, Japan). The TEM was equipped with a high-resolution retractable CCD camera (Gatan Inc., Pleasanton, USA) and was operated at an accelerating voltage of 120 kV with a beam current of 75 μA.18
In vitro Drug Release Profile
The release profile of THP loaded nanoparticles was carried out in PBS (pH 7.4) containing 1% tween 80 (v/v). Briefly, freshly prepared nanoparticles were washed as described earlier and the nanoparticle pellet containing 0.50 mg of THP was then resuspended in 5 mL of PBS (pH 7.4) with 1% tween 80 and placed in a shaking incubator (KS 4000 IC, IKA Werke, Staufen, Germany) at 100 rpm and 37°C. For the following 7 days, 0.50 mL of the sample was withdrawn at specified time intervals. The sample was centrifuged at 15000x g for 10 min and the supernatant was separated. To assure the sink conditions, the pellet was resuspended in fresh PBS (pH 7.4) containing 1% tween 80 and returned to the original nanoparticle suspension. The amount of THP in the supernatant was analyzed spectrophotometrically using a US/VIS spectrophotometer (UV mini 1240, Shimadzu, Japan) at 230 nm. At the end of the experiment, the nanoparticle pellet was dissolved in the acetonitrile and the amount of drug remained in the nanoparticles was also determined. For all the measurements, a background subtraction with blank PLGA nanoparticles (without drug) processed in the same way was carried out.10,19 The drug release data were fitted to different kinetic models using DDSolver.
In vitro Cytotoxicity Synergism
In vitro cell viability was determined using MTT assay. Briefly, SK-OV-3 cells were seeded in the clear flat bottom 96 well plates (Nunclon Delta, Thermo Fischer Scientific GmbH, Dreieich, Germany) at a density of 10,000 cells/0.35 cm2 (per well) and were allowed to adhere overnight. The following day, the cells were incubated with different concentrations of THP loaded nanoparticles (200 nm and 400 nm), mTHPC loaded liposomes as well as free THP and free mTHPC (dissolved in DMSO) and were incubated for 4 h. Post incubation, the formulations were replaced with the fresh medium. The plates incubated with THP nanoparticles and free THP were returned directly to the incubator while the plates incubated with mTHPC liposomes and free mTHPC were irradiated with different light fluences (ie, 50 mJ.cm−2 and 350 mJ.cm−2) at a wavelength of λ=652 nm before placing them back to the incubator.20 The next day, the medium was replaced with the fresh medium containing MTT dye (2 mg.mL−1) and incubated again for 4 h. The resultant formazan crystals were dissolved using DMSO. The absorbance was recorded at 570 nm using FLUOStar Optima plate reader (BMG Labtech, Ortenberg, Germany). The cell viability of the untreated cells (blank) was considered to be 100%. The experiment was repeated in triplicate and the cell viability of treated cells was determined.21 Consequently, the respective IC50 values were calculated from the data obtained from the cytotoxicity assay.
Based on the results obtained from the physicochemical characterizations, in vitro drug release profile, and cell viability assay, THP nanoparticles with an average hydrodynamic diameter of 200 nm were considered to be the optimal size for further studies. Consequently, these nanoparticles were coated with mTHPC liposomes (containing DPPC/DPPG/mPEG5000-DPPE in different molar ratios). The cell viability assay was also performed (as described previously) for the lipid-coated THP nanoparticles (LCNP) for the combined delivery of the mTHPC and THP to the cancer cells.
Assessment of Reactive Oxygen Species (ROS)
The quantitative assessment of the ROS was determined using 2′,7′-dichlorofluorescein diacetate (H2DCFDA, Abcam, Berlin, Germany) according to the supplier’s manual with slight modifications.22 H2DCFDA is a fluorescent dye and free radical scavenger used to detect the ROS generated by the investigative substances. Briefly, SK-OV-3 cells were seeded in the clear bottom, dark walled 96 well microtiter plates at a density of 25,000 cells per well. The cells were allowed to grow overnight. After the cell’s stabilization, the next day, the cells were washed with Dulbecco`s PBS (pH 7.4) supplemented with Ca2+/Mg2+. The cells were then treated with H2DCFDA at a concentration of 25 µM for 1 h at 37 °C. Post incubation, the cells were washed again to remove any unbound dye. The cells were incubated with free drugs or different formulations (at a corresponding mTHPC and THP concentration of 5 µM and 50 µM, respectively) for 4 h. After the incubation is over, the formulations were replaced with the fresh medium. The cells were then irradiated at a light dose of 0.50 J.cm−2. The cell lysis was done using cell culture lysis reagent (Promega, Mannheim, Germany) and the resultant fluorescence was recorded at λex 485 nm/λem 520 nm using FLUOStar Optima plate reader (BMG Labtech, Ortenberg, Germany).11
Hemolysis Assay
To determine the biocompatibility and hemolytic potential of our formulations, an ex vivo hemolysis assay was performed as described previously.23 Briefly, with prior consent from the donor, 10 mL of the blood was drawn into the EDTA-containing tubes to prevent the coagulation and centrifuged at 500× g for 5 min to get RBCs pellet. The plasma was aspirated and the RBC pellet was then washed three times with Dulbecco PBS (pH 7.4) and diluted to a 1:50 ratio with PBS (pH 7.4). Afterward, 100 µL RBC suspension per well was seeded in a 96 well plate. The RBCs were then incubated with formulations to be tested in a V- bottom shaped microtiter plates for 1 h at 37 °C and were placed in an orbital shaker KS4000 IC (IKA Werke, Staufen, Germany). Post incubation, the supernatant was collected following centrifugation of the plates. The absorbance of the supernatant was recorded at 540 nm using FLUOStar Optima plate reader (BMG Labtech, Ortenberg, Germany). Sterile filtered normal saline (0.9% NaCl) and Triton™ X-100 (TX™-100) were used as positive and negative controls, respectively. The absorbance value obtained from the TX™-100 was considered to be 100% hemolysis. The percentage of hemolysis was calculated using the formula.24
Whereas:
AbSample = Absorbance of sample; AbNC = Absorbance of Negative control; AbPC = Absorbance of positive control
Activated Partial Thromboplastin Time Test (aPTT)
To assess the influence of our formulations on the coagulation time of the blood, the aPTT test was performed in the Coatron M1 coagulation analyzer as described earlier.14 Briefly, blood plasma was separated from the fresh blood after centrifugation at 5000x g for 5 min. The blood plasma (25 µL) was then mixed with an equal amount of the formulation to be tested and 25 µL of the aPTT reagent. The coagulation factors were then activated by the addition of 25 µM pre-warmed CaCl2. The clotting time (s) was recorded after the confirmation of blood coagulation spectrophotometrically.
In vitro Genotoxicity Assessment
The genotoxic perspective of our nanoformulations was evaluated employing in vitro comet assay on SK-OV-3 cells as described.25,26 Briefly, 1,00,000 cells per well were seeded into a six-well plate and were allowed to adhere overnight. The following day, the cells were incubated with specified concentrations of our test formulations for 4 h at 37 °C. After the incubation is over, fresh medium was added to the cells. To avoid any false positive response, the cells were irradiated at an equitoxic light dose to produce 80% cell viability. The treated cells were then returned to the incubator for 12 h. The next day, the cells were trypsinized and centrifuged for 5 min at 1000x g. The obtained cell pellet was washed twice using sterile Dulbecco PBS (pH 7.4) and cell density was adjusted to 80,000 cells.mL−1. Twenty-five microliters of the cell suspension was mixed with 75 µL of 1% of prewarm low melting agarose (LMA) (Merck, Germany). The mixture was applied to the super frost glass slides previously coated with 1% normal melting agarose (NMA). The slides were placed on an ice block for 10 min until solidified. The cell membrane lysis was done by submerging the slides overnight in a cold lysis solution (300 mm NaOH, 1.2 M NaCl, 2% DMSO, and 1% TXTM-100). The slides were then transferred to the electrophoresis tank containing alkaline electrophoresis buffer (300 mM NaOH and 1mM EDTA). Electrophoresis was performed for 30 min at 250 mA current and 25 V in Thermo Hybrid Electro 4 gel system (Thermo Electron Corporation, Ulm, Germany). The slides were neutralized by washing the slides with double distilled water. The cell fixation was then done by submerging the slides into the 70% ethanol for 20 min. Subsequently, the cells were stained with SYBR® safe DNA staining dye for 20 min. Finally, the slides were washed with double distilled water to remove any unbound stains. The comet analysis was done under a fluorescence microscope (CKX-53 Olympus, USA). The results were analyzed using the Comet Assay IV® software. Fifty individual comets were scored for each formulation.27
Cellular Uptake Pathway Analysis
In order to determine the uptake mechanism by the cells, SK-OV-3 cells were seeded into a 96 well plate at a seeding density of 10,000 cells/well and were allowed to adhere overnight by maintaining at 37 °C and 5% CO2. The next day, the cells were washed with PBS (pH 7.4) supplemented with Ca2+/Mg2+. The cells were then pre-incubated with the inhibitors of the vesicular uptake pathway (ie, Chlorpromazine 30 µM and Filipin-III 15 µM) for 1 h. After incubation, the formulations were added to the cells and were again incubated for a total of 4 h. Post incubation, the samples were replaced by fresh medium, and irradiation was done at a light dose of 0.50 J.cm−2. Subsequently, the cells were incubated again for 24 h. Un-irradiated plates were taken as the dark control. The following day, cell viability was determined using MTT assay as described previously.10,28
Apoptosis Assay
The cell apoptosis assay was performed using flow cytometry FITC annexin V (human vascular anticoagulant) according to the manufacturer protocol with slight modifications. Briefly, 90,000 SK-OV-3 cells per well were seeded in 12-well culture plates and were allowed to adhere overnight. Post stabilization, the cells were incubated with the formulations at a concentration of 1.50 µM of mTHPC loaded liposomes, 15 µM of THP loaded nanoparticles, and similar concentrations of the lipid-coated nanoparticles containing mTHPC and THP to get 60% cell viability. The cells were then incubated for 4 h. Post incubation, the formulations were replaced with the fresh medium. The cells were irradiated with a light dose of 0.05 J.cm−2 at 652 nm (except for THP loaded nanoparticles and free THP). The cells without any treatment were taken as a negative control. The plates were then returned to the incubator for overnight. The following day, cells were trypsinized, washed with ice-cold PBS (pH 7.4) without Ca2+/Mg2+, and resuspended in 1X binding buffer. Fifty microliters of binding buffer supplemented with 1 µL (10 µg.mL−1) of FITC annexin V were gently mixed with an equal volume of the cell suspension and incubated at room temperature for 15 min under dark conditions. After the incubation, 300 µL of binding buffer containing 0.4 µL (2 mg.mL−1) of propidium iodide (PI) was added and placed in ice for 5 min. The apoptosis analysis was then conducted by flow cytometry (Guava® easyCyteTM, Millipore Sigma, USA). The data were processed by FlowJo® v. 10.6 software.29
Stability Studies in Simulated Conditions
To study the stability of the formulations in the physiological conditions, 0.20 mL of formulations (ie, mTHPC-LP, THP NP 200 nm, and LCNPs) were mixed with 1 mL of 60% FCS (diluted in PBS pH 7.4) to get a volume ratio of 5. Similarly, 1 mL PBS (pH 7.4) was mixed with 0.20 mL of each formulation to get the same volume ratio of 5. All the mixtures were then incubated for 24 h in a shaking incubator at 100 rpm and 37 °C. In the control experiments, only PBS (pH 7.4) was mixed with FCS keeping the other parameters constant. The samples were withdrawn at specific time intervals, diluted with purified water (1:20), and measured using Nano ZS Zetasizer. The results were obtained for three independent formulations.10,30
In vivo Acute Toxicity Assessment
In vivo acute toxicity studies were determined in mice for 7 days as per Organization for Economic Cooperation and Development (OECD) 425 guidelines, except that i.v. administration was used. All the experiments were performed as per defined protocols approved by the bioethical committee of Riphah Institute of Pharmaceutical Sciences, Riphah International University, Lahore. Briefly, healthy female albino (BALB/c) mice weighing 30–35 g with an age of 8–10 weeks were obtained from the animal house and were randomly assigned into 6 groups with each group comprising 3 animals (n= 3).31 All the animals were provided free access to water and commercial laboratory food (ad libitum). They were housed in a controlled environment (Temperature: 22 ± 2 °C, Humidity: 60 ± 10% with a 12 h light/dark cycle). The group 1 and group 2 were administered with free mTHPC (dissolved in 0.10% DMSO) and mTHPC loaded liposomes, respectively (mTHPC dose equivalent to 0.15 mg.kg−1 body weight32). Similarly, Group 3 and group 4 were treated with free THP (dissolved in 0.1% DMSO) and THP loaded nanoparticles, respectively (THP dose equivalent to 5 mg.kg−1 body weight33). Group 5 was treated with lipid-coated nanoparticles (at mTHPC/THP equivalent doses as described previously) and group 6 was treated with normal saline (considered as the control group). The formulations were administered in two equally divided doses (viz day 1 and 3) intravenously via tail vein using a 21-gauge needle. The animals were kept under observation for 1–7 days for any sign of changes in the body weight, visual observations of mortality, behavioral patterns (eg, skin and fur, eyes, salivation, respiration, consistency of feces, urine color, sleep patterns, convulsions, and coma, etc.), any sign of illness throughout the study period. After 7 days of observations, the blood was withdrawn for blood biochemical analysis, and the mice were euthanized for tissue histological studies.24
Blood Biomarker Assay
In an attempt to determine the toxicity of our formulations on the mice’s blood, serum biochemical indexes were analyzed. After 7 days post-exposure, blood from each mouse was withdrawn under anesthesia into a sterile tube via thoracic puncture. To separate the plasma, the blood was centrifuged at 1200x g for 10 min, using the centrifuge (Centurion Scientific, Chichester, UK). The supernatant was removed carefully and stored at −20 °C until further analysis. Serum biochemical markers including renal function tests (RFTs), liver function tests (LFTs) including bilirubin level, creatinine level, blood urea, total protein, and cholesterol level were performed using a serum biochemical marker analyzer (MicroLab 300, Merck, Germany). Hematological investigations were conducted on the heparinized part of the blood. Complete blood screening including total erythrocyte count (TEC), hemoglobin concentration (Hb), mean corpuscular volume (MCV), hematocrit (HCT), mean corpuscular hemoglobin (MCH), mean corpuscular hemoglobin concentration (MCHC), total leucocyte count (TLC), platelet count as well as mean platelet volume (MPV) were performed using a hematology analyzer (Icon-3, Norma Instruments, Budapest, Hungary).34
Body Visceral Index
Body visceral index is a vital tool to evaluate any toxic effect of the nanoformulations on mice’s organs after repeated administrations. Change in body organ weight was determined at the end of the treatment (post 7 days). The animals were euthanized by cervical dislocation method and vital body organs (ie, heart, kidney, liver, and lungs) were removed, washed carefully with sterile normal saline, and weighed. The organ weights were then compared with the body organ weights of the control group to determine the organ body weight index using the formula.35,36
Histopathological Examinations
In order to examine any pathological changes (ie, abnormalities or lesions) induced by our formulations, histopathological examinations were done as described. Briefly, after sacrificing the animal, the vital organs were removed and washed carefully with normal saline. The organs were immediately placed in 10% formalin solution. The organs were then embedded into the paraffin blocks and sliced carefully into 0.50 µm thin tissue sections using a rotary microtome (Hunan Kaida Scientific Instruments, Changsha, China). The sections were then fixed onto the glass slides and stained with hematoxylin-eosin periodic acid Schiff (PAS) stain (H&E stain). The slides were examined microscopically and photos were taken using a microscope (Olympus BX51M, Tokyo, Japan).37
Statistical Analysis
Non-linear curve fitting functions were applied on normalized dose–response cell viability data obtained from the MTT assay and the IC50 values were calculated. All the experiments were performed in triplicate unless otherwise stated and results are expressed as mean ± SD. Two-way analysis of variance (ANOVA) with Dunnett′s test (multiple comparisons against a control group) was performed for the comparison of percentage viability obtained from cytotoxicity assays. One-way ANOVA with post hoc test (Dunnett’s multiple comparisons against control) was performed on the rest of the data using Graph Pad Prism 5. Significance levels of p<0.05 were considered for the rejection of the nulls hypothesis.
Results and Discussion
Physicochemical Characterizations
In the current study, PLGA nanoparticles were prepared utilizing the emulsion solvent evaporation technique. Two different sizes of THP loaded PLGA nanoparticles (ie, 200 nm and 400 nm) were prepared to compare their physicochemical properties and efficacy against the cancer cells. After the pilot study, depending on the particle size, the PVA concentrations were optimized to be 1% and 0.30% to produce 200 nm and 400 nm particles respectively, while maintaining all the other parameters constant. The particle size distribution and their surface charges are exhibited in Table 1. It can be observed that THP NP 200 nm showed a homogenous population with a narrow size distribution of 194.90 ± 2.70 nm and a low polydispersity index of 0.08 ± 0.02 as compared to THP NP 400 nm. This was due to the presence of a higher concentration of the emulsifier in 200 nm NP causing the formation of stable emulsion with smaller and uniform droplet size, leading to the formation of smaller sized nanoparticles with low polydispersity index. The lower concentration of PVA in THP NP 400 nm not only produced a higher particle size of 373.40 ± 8.80 nm but the polydispersity index was also high indicating a bimodal distribution of particles (ie, 0.23 ± 0.02).9 The addition of the THP in the nanoparticle formulations produced a slight increase in the particle size (10–15 nm approximately) and size distribution. All the nanoparticle formulations exhibited a positive surface charge ranging from 8.30 ± 1.60 mV to 10.50 ± 1.70 mV, owing to the presence of a small amount of chitosan in the formulations (Supplementary Figure S1–S4).
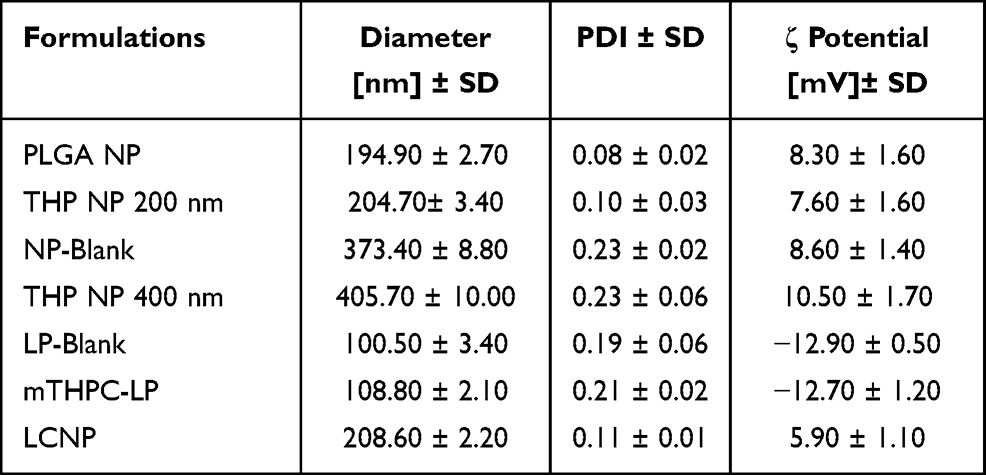 |
Table 1 Physicochemical Properties of THP Loaded PLGA Nanoparticles, mTHPC Loaded Liposomes, and Lipid-Coated Nanoparticles (LCNP). Each THP Loaded PLGA Nanoparticle Contains 2 mg of THP and 100 mg of PLGA, While Each Liposome Consists of 0.50 mg of mTHPC in 10 mg of Total Lipids. Hydrodynamic Diameter is Expressed as a Function of Particle Size Distribution by Intensity. Values are Expressed as Mean ± S.D for Three Independent Measurements (n=3) |
The composition of prepared liposomes and their physicochemical properties are presented in Table 1. The hydrodynamic diameter was in the nanometric range (100.50 ± 3.40 nm) with a PDI of 0.19 ± 0.06 representing the narrow monomodal distribution of liposomal vesicles. mTHPC loaded liposomes showed a slightly higher hydrodynamic diameter and PDI. This could be due to the fact that mTHPC orientate itself in the bilayer membrane and interacts with the polar heads of lipids through the hydrogen bonding leading to a slight increase in vesicle size.38 Liposomal formulation possessed an overall negative zeta potential (−12.90 ± 0.50 mV) (Supplementary Figure S5–S6). The lipid enveloped nanoparticles (LCNP) were produced by coating the THP NP 200 nm with the mTHPC loaded PEGylate liposome (ie, DPPC/DPPG/mPEG5000-DPPE). The hydrodynamic diameter of LCNP was found to be 208.60 ± 2.20 nm with no significant increase in the PDI (Supplementary Figure S7). A small increase in the hydrodynamic diameter (ie, 4 nm) of the LCNP was observed when compared to uncoated PLGA NP. Assuming the thickness of the lipid membrane to be about 4–5 nm, our results were in line with the previous experiments done by our workgroup.6
Encapsulation Efficiency (EE%)
The encapsulation efficiencies of the THP loaded PLGA nanoparticles and mTHPC loaded liposomes were determined using the solvent extraction method. For this purpose, unentrapped drugs from the nanoparticles and liposomes were removed using centrifugation and ultracentrifugation techniques, respectively. A direct method of dissolving the nanoparticle or liposomal drug pellet was used and ultimately the actual amount of THP in PLGA nanoparticles and mTHPC in liposomes was measured. Being a highly lipophilic molecule, mTHPC tends to align itself in the hydrophobic milieu (non-polar region) of the liposome and showed an overall high drug loading of 80.50 ± 5.10%.38,39 Similarly, the optimized nanoparticle formulations also showed a relatively high encapsulation with THP NP 200 nm showing an EE of 86.50 ± 4.50% and THP NP 400 nm showing EE of 74.30 ± 5.4%. This higher EE can be explained due to the fact that both, the THP and PLGA are soluble in ethyl acetate employed for the nanoparticle preparation.10,40 The loading capacity of the THP NP 200 nm, THP NP 400 nm and mTHPC-LP was found to be 1.92 ± 0.32%, 1.65 ± 0.68% and 4.02 ± 0.41%, respectively.
Morphological Characterizations
Morphological characterizations were conducted using atomic force microscopy (AFM) and transmission electron microscopy (TEM). AFM studies were conducted using intermittent contact mode and images were acquired in height measured trace, lock in amplitude as well as in lock in-phase mode. Figure 2 shows the typical AFM monographs of mTHPC loaded liposomes, THP loaded nanoparticles (200 nm and 400 nm), and lipid-coated polymeric nanoparticles. The AFM micrographs revealed perfectly round shaped liposomes and nanoparticles. The height measured view was used to analyze the size distribution parameters of the liposomes and nanoparticles. Some irregularly shaped liposomes also tend to spread on the silicon surface like a sheet of lipid monolayer that might be due to the liposomal disruption during the preparation of samples. The AFM size investigations were in correlation with the hydrodynamic diameter obtained from DLS studies. A uniform distribution of the THP NP 200 nm (Figure 2Aa1) with a smooth surface can be seen, which represents the unimodal distribution of the nanoparticles in the formulation.17,41 Whereas THP NP 400 nm showed a tendency to aggregate forming clusters (Figure 2Aa2). This explains the broad range of particle sizes and the high polydispersity observed. This agglomeration tendency was likely due to insufficient steric stabilization by the PVA. The lipid layer on the nanoparticle surface can also be visualized with AFM images (Figure 2B). In some places, the nanoparticles are not completely covered with the lipid bilayer and show some gaps in between the coating. The thickness of the absorbed lipid bilayer was determined from these gaps and was found to be in the range (ie, 4–5 nm) (Figure 2C).6
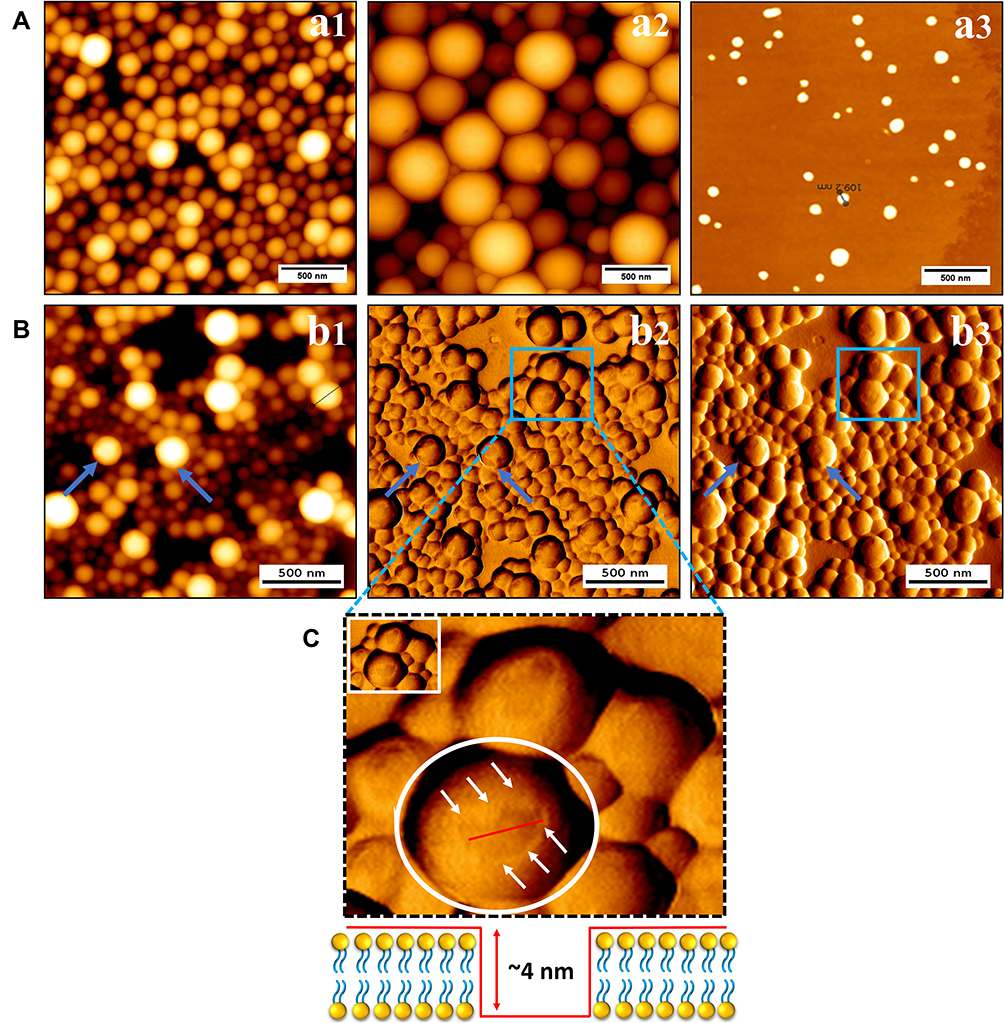 |
Figure 2 Illustration of surface morphology of (A): a1) THP NP 200 nm; a2) THP NP 400 nm and a3) mTHPC-LP using AFM. Pane (B) represents the AFM micrographs of lipid-coated nanoparticles b1) height measured view; b2) lock-in amplitude view and b3) lock-in phase view. (C) AFM cross-sectional profile of the lipoparticles demonstrating the lipid thickness around the PLGA nanoparticles. HQ:NSC14/AL_BS cantilevers tips were used for the liposomes while HQ: NSC16/AL_BS were used for the uncoated and coated nanoparticles. The scale bar represents 500 nm scale. |
Transmission electron microscopy (TEM) is the most widely used technique to study the size, shape, and morphology of the carrier system. TEM allows the imaging of the liposomes and nanoparticles in their original form, without further need of the sample modification (eg, labeling, fixation, etc.). The samples were negatively stained using 2% uranyl acetate. Figure 3 shows the representative TEM micrographs of the mTHPC loaded liposomes (Figure 3A), THP NP 200 nm (Figure 3B), and lipid-coated nanoparticles (Figure 3C). TEM observations revealed mostly circular unilamellar lipid vesicles.11 Besides, some irregularly shaped liposomes can also be seen in the formulation which could be caused by the quick drying of the liposomes during the staining process as the PEG conjugated DPPE and DPPC were stained using dye to enhance electron density. Furthermore, polymeric nanoparticles with a lipid layer adsorbed on their surface as a dim ring surrounding the polymeric core-shell of hybrid carriers can also be observed.42 This lipid coating is the result of the non-covalent weak electrostatic attraction between the anionic lipid bilayer and cationic surface of polymeric nanoparticle core. The size of these liposomes and lipid-coated vesicles obtained by TEM micrographs was in good agreement with the size distribution obtained by particle size analyzer.40,43
 |
Figure 3 Typical TEM micrographs of nanoformulations including (A) mTHPC-LP; (B) THP NP 200 nm and (C) LCNPs. The samples were stained with 2% uranyl acetate for 5 min prior to imaging. The scale bar represents a 250 nm scale. |
In vitro Drug Release Profile
The in vitro drug release from the THP loaded PLGA nanoparticles was conducted in PBS (pH 7.4) containing 1% tween 80. Tween 80 is a common nonionic emulsifier used to enhance the solubilization of the hydrophobic drugs by the formation of the micelles. Because of the very low aqueous solubility of THP, the addition of this solubility enhancing component was necessitated to ensure the sink conditions and to achieve detectable UV/VIS concentrations during the release studies.10 The drug release mechanisms are important in the drug-polymer formulations because of the proposed applications in sustained drug delivery. Kumari et al44 have described different drug release mechanisms from PLGA nanoparticles including (a) the desorption of the drug absorbed to the particle surface, (b) diffusion through the nanoparticle matrix, (c) erosion of nanoparticle matrix, and (d) combination of diffusion and erosion. To manipulate the drug release from the polymer matrix, a complete understanding of these mechanisms is required.44 The drug release from the PLGA nanoparticles is shown in Figure 4. It is evident from the graph that the THP loaded PLGA nanoparticles followed a typical biphasic drug release pattern from the nanoparticle matrix with an initial burst release of 40% for THP NP 200 nm and 32% for THP NP 400 nm within the first 24 h. This burst release was followed by a sustained release of the drug from the polymer matrix for 7 days. This initial phase of drug release is mainly attributed to desorption or diffusion of the drug located at the large surface of the nanoparticles or loosely bound with the polymer matrix. The remaining unreleased drug was assumed to be tightly associated with PLGA molecules and/or well entrapped within the nanoparticle matrix and occurs mainly by diffusion or erosion of the matrix under sink conditions. If the diffusion of a drug is faster than the matrix erosion, the mechanism of release is then largely controlled by a diffusion process.45 It was also observed that THP NP 400 nm showed a lower cumulative drug release of 57% till the end of the experiment contrary to the THP NP 200 nm which showed a relatively higher cumulative release of 72%. This could be explained by the fact that in the case of smaller nanoparticles, the greater surface area produces a higher number of drug molecules at the surface of nanoparticles ready for faster release.46 To discern the release mechanism, the drug release data were fitted in the different kinetic models including zero order, 1st order, Higuchi as well as the Korsmeyer-Peppas model. The release data from the formulations were best fitted to the Korsmeyer-Peppas equation based on the correlation coefficient (r2 values) as shown in Table 2. The model assumes that the drug is uniformly distributed inside the matrix and follows the Fickian diffusion mechanism for its release, as the value of release exponent (n) is less than 0.5.
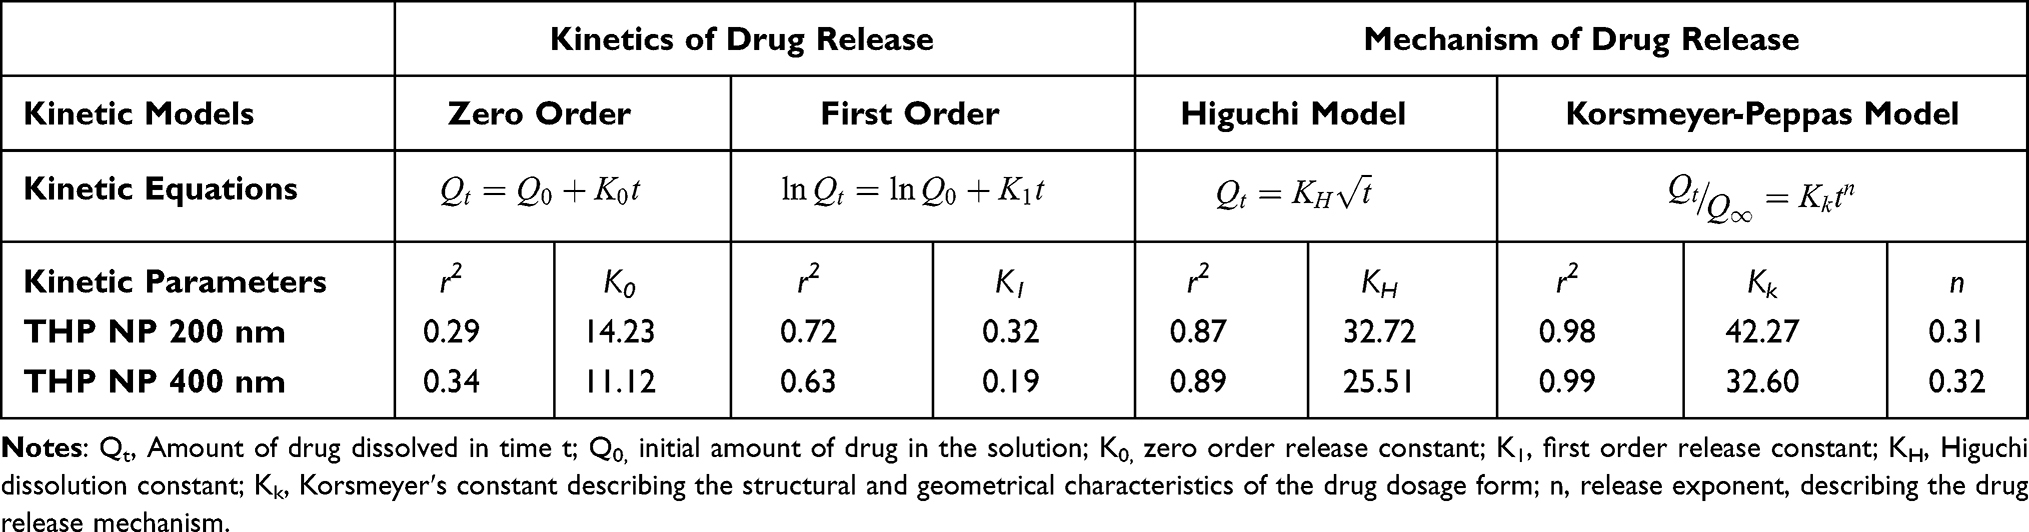 |
Table 2 In vitro Release Kinetics and Mechanism from THP Loaded PLGA Nanoparticles |
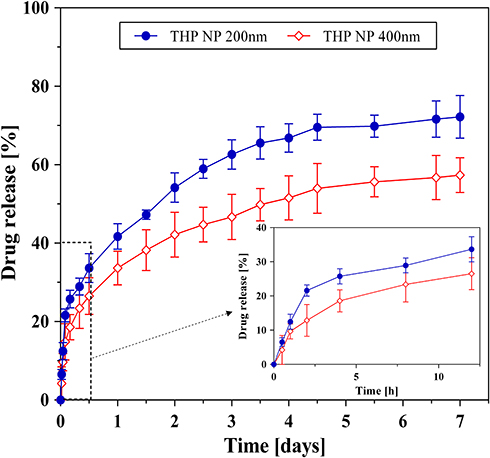 |
Figure 4 Cumulative release [%] of THP from PLGA nanoparticles in PBS (pH 7.4) containing 1% v/v tween 80% to assure sink conditions. The samples were withdrawn at specified time intervals were analyzed spectrophotometrically. |
In vitro Cytotoxicity Synergism
The in vitro cytotoxicity synergism of LCNPs, as well as the cell viability of the SK-OV-3 cells after being treated with THP loaded PLGA nanoparticles (200 nm and 400 nm), mTHPC loaded liposomes, and free THP/mTHPC (dissolved in DMSO) was determined using MTT assay. It was done by incubating the cells in the presence of different concentrations of the nanoformulations as well as of the free drugs for 4 h. This was followed by subsequent irradiation of the cells at λ=652 nm (except for free THP and THP loaded nanoparticles). The results of the cytotoxicity assay are expressed in Figure 5 and Table 3. It is evident from the results (Figure 5A) that the presence of free THP or THP loaded biodegradable nanoparticles (200 nm and 400 nm) caused a reduction in the SK-OV-3 cell viability with the highest reduction at the dose of 100 µM. The highest cytotoxicity was produced by free THP (72.26 ± 5.40%) followed by THP NP 200 nm (62.14 ± 3.13%). The least effect was observed with THP NP 400 nm with the cell viability still recorded at 52.56 ± 5.50%. This can be attributed to the slower uptake of the larger particles (ie, 400 nm) as the particle size ranging from 100 to 200 nm are appropriate for effective cellular uptake and consequently for the higher anticancer activity. It was also observed that free THP dissolved in the DMSO showed higher cytotoxicity as compared to nanoparticles, which could be referred to as the controlled release properties of PLGA nanoparticles as the rate-limiting step.
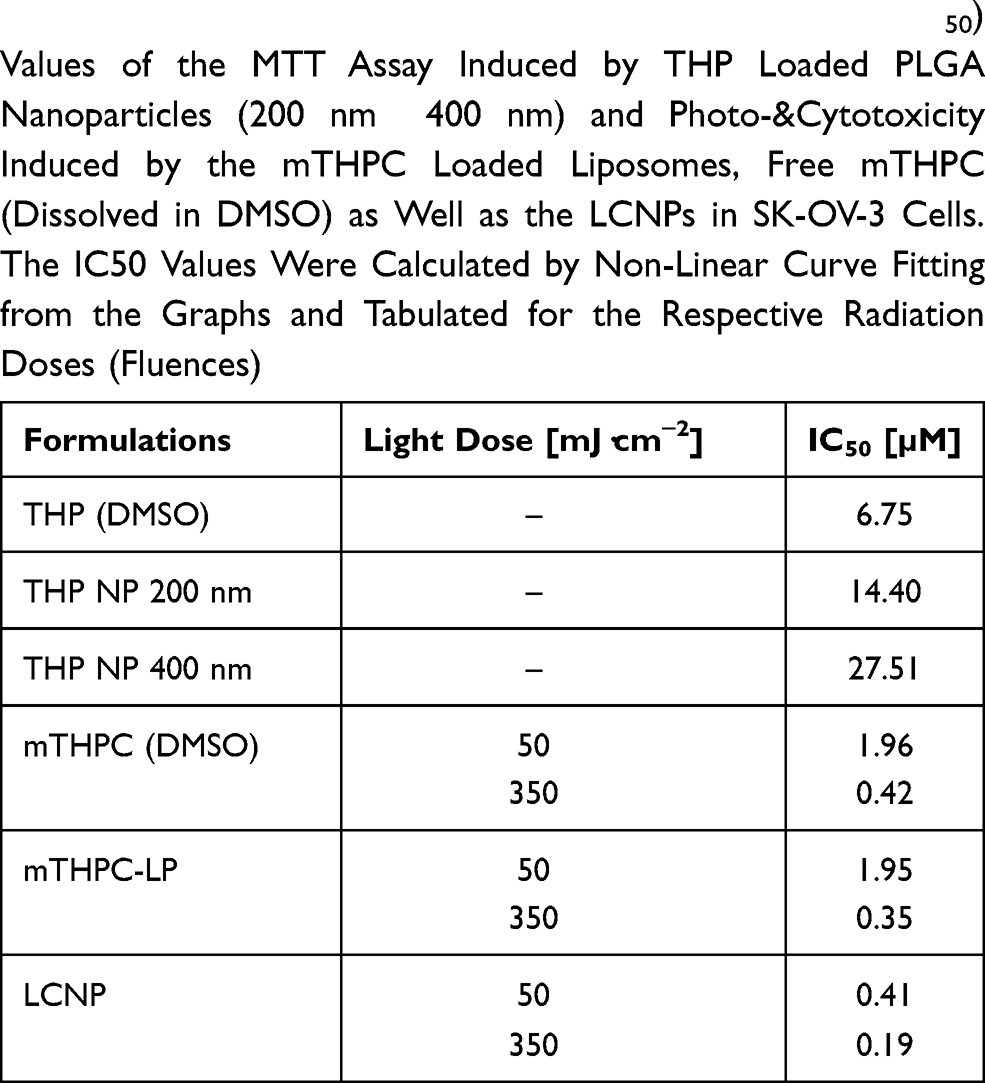 |
Table 3 The Half-Maximal Inhibitory Concentration (IC50) Values of the MTT Assay Induced by THP Loaded PLGA Nanoparticles (200 nm & 400 nm) and Photo-Cytotoxicity Induced by the mTHPC Loaded Liposomes, Free mTHPC (Dissolved in DMSO) as Well as the LCNPs in SK-OV-3 Cells. The IC50 Values Were Calculated by Non-Linear Curve Fitting from the Graphs and Tabulated for the Respective Radiation Doses (Fluences) |
 |
Figure 5 Dose–response curves representing the cell viability of SK-OV-3 carcinoma cells. Cytotoxicity induced by (A) THP loaded nanoparticles (200 nm and 400 nm) and free THP; dark and photo cytotoxicity induced by (B) free mTHPC; (C) mTHPC-LP, and (D) lipid-coated nanoparticles (LCNP). In all cases, the free drug was dissolved in 0.10% DMSO. The cells were incubated for 4 h with the formulations at 37°C and then irradiated (except A) with radiation fluence of 50 mJ.cm−2 and 350 mJ.cm−2 at λ=652 nm. The dark was used as the negative control and represents cells without irradiation. Each value is represented as the mean ± SD for three independent experiments (n=3). |
The treatment of the cells with free mTHPC (dissolved in 0.10% DMSO) without subsequent irradiation resulted in a slight reduction of cell viability (18.51 ± 1.87%). This dark toxicity was evident only at the highest mTHPC concentration (ie, 5 µM) (Figure 5B). Contrary to this, mTHPC did not show any dark toxicity when encapsulated in a liposomal formulation suggesting the safety of the formulation (Figure 5C). These findings were also in accordance with the previous studies conducted by our research group. It is also evident that with the increase in light fluence, the cell viability continuously decreased ending up at 18–20% at 350 mJ.cm−2.47 Similar results were obtained when the mTHPC encapsulated liposome was coated over THP loaded PLGA nanoparticles. The LCNPs without succeeding irradiation exhibited cell viability of 32.20 ± 1.30% which was relatively less as compared to the THP NP 200 nm alone (ie, 37.80 ± 3.10%). This effect can be attributed to higher cellular uptake of the lipid-coated particles as compared to the uncoated nanoparticles.48 The dose–response cell viability curves obtained from the LCNPs treated cells manifested higher cell destruction as compared to mTHPC liposomes or THP nanoparticles (200 nm) alone (Figure 5D). This higher anticancer effect can be credited to the synergistic effect produced by both the drugs combined in one nanocarrier system.36 The half-maximal inhibitory concentration (IC50) of the formulations was also reduced proportionally, as the light or drug dose into the cells was increased. The statistical evaluation using two-way ANOVA with Dunnett’s multiple comparisons showed that the PDT effect produced by different light fluences differed significantly (p<0.001) to the unirradiated samples.
Assessment of Reactive Oxygen Species (ROS)
The production of ROS has a very crucial effect on the results of combination therapy as the high production of ROS induces significant damage to the biomolecules (ie, nucleic acids, proteins, etc.) in the cancer cells. To determine the effect of combination therapy on the intracellular ROS production in the SK-OV-3 cells, the ROS assay was performed. For this purpose, one of the commonly used molecular probe H2DCF (2′, 7′-dichlorodihydrofluorescein) was used. The esterified form of this dye is non-fluorescent and cell-permeable, thus can enter the cells freely. Inside the cell, it gets deacetylated into the cell impermeable dye by the action of cell-bound esterases and then gets oxidized by intracellular ROS into a green fluorescent DCF (2′, 7′-dichlorofluorescein).49 The fluorescence intensity corresponds to the ROS production is then detected using fluorescence microscopy. The data obtained from the production of ROS after being treated with formulations and free drugs is shown in Figure 6. In our experiments, the irradiated liposomal formulation or free mTHPC (dissolved in DMSO) produced increased levels of intracellular ROS as compared to unirradiated samples (dark). These findings were in line with the cytotoxicity experiments in which unirradiated formulations or free drug did not produce a significant reduction in cell viability.22 The highest amount of ROS was produced by PEGylated liposomes coated over the THP loaded nanoparticles giving a synergistic effect for the production of ROS. The reason for higher ROS production by the lipid-coated nanoparticles could be the higher cellular uptake of these particles as compared to uncoated particles.48 The fact that the highest damage to the cancer cells was done by lipid-coated THP nanoparticles could be explained by this higher ROS production. As expected, the amount of ROS produced by uncoated THP nanoparticles and free THP, before and after irradiation remained the same and no significant difference in the ROS levels was observed.
 |
Figure 6 Production of ROS in response to mTHPC loaded liposomes, free mTHPC (DMSO), THP loaded PLGA nanoparticles (200 nm), free THP (DMSO), and lipid-coated polymeric nanoparticles (LCNP). H2DCFDA (25 µM) was used as a free radical quenching fluorescent dye. The cells were incubated with the formulations or free drugs (at a corresponding mTHPC and THP concentration of 5 µM and 50 µM, respectively) for 4 h at 37°C. Subsequent radiation was performed at a light dose of 0.5 J.cm−2 (λ = 652 nm). Blank represents the non-illuminated cells whereas TBHP (50 μM) was used as a positive control. All the measurements were performed in triplicate and values were expressed as mean ± S.D (n=3). P values (p < 0.05) were considered significant and expressed as ***p< 0.001. |
Hemocompatibility Assay
Hemocompatibility of the synthesized nano-formulations is a significant criterion for pharmaceutical and biomedical applications. It involves the necessary evaluation of the hemolytic potential of drug formulations with blood components which would, in turn, determine their therapeutic efficacy and in vivo fate. These studies also serve as a critical link between in vitro and in vivo studies because the data obtained from these studies can be used to tailor the dosage form for the in vivo experiments. The hemolytic potential of our drug formulations was assessed to evaluate their safe concentrations that can be administered intravenously. It was done by estimation of the hemoglobin release after erythrocyte damage caused by drug formulations. The atmospheric oxygen then converts this hemoglobin into oxyhemoglobin which can be detected spectrophotometrically.50 In our study, it was observed that both of the free drugs showed a relatively higher hemolytic effect (ie, 14% and 20% for free mTHPC and THP, respectively) even at a lower dose, while the degree of hemolytic toxicity exhibited by all the formulations was less than 10% including lipid-coated nanoparticles (ie, 8.93%). This indicates that our formulations were less hemotoxic and had improved biocompatibility with the blood components (Figure 7). The aPTT test was performed to evaluate the effect of formulations on the coagulation time of blood. An increase in aPTT time was observed in the case of free drugs (127.7 s and 60.2 s for THP and mTHPC, respectively). It is important to consider that the aPTT values above 50 s are clinically significant while the value above 70 s indicates continuous bleeding and hemorrhage. Contrary to the free drugs, the coagulation time depicted by the nanoformulations was found to between 39.5 and 46.8 s which was well under the standard range.51,52 The aPTT values exhibited by the drug formulations were also comparable to that of the blank (ie, 37.2 s). These findings suggested that our nanoformulations were biocompatible as well as non-toxic for i.v. injection.
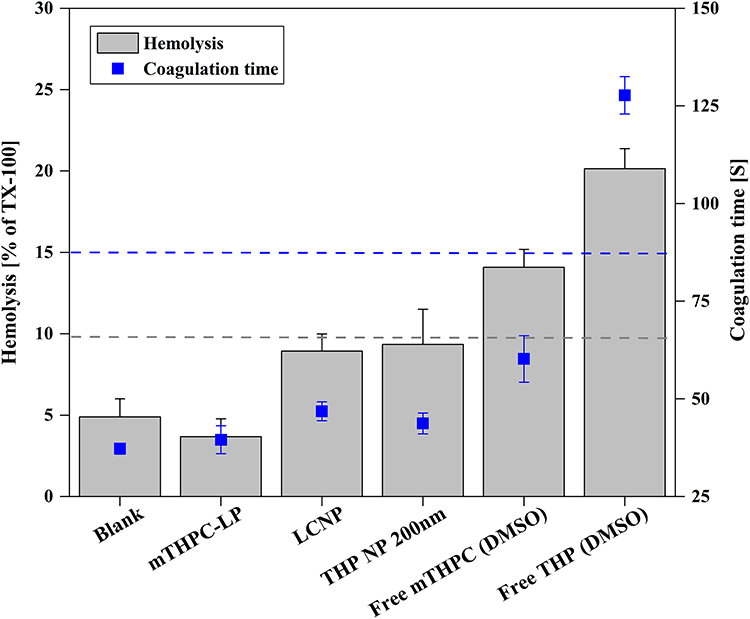 |
Figure 7 Hemocompatibility assessment; hemolysis assay (grey bars) and aPTT assay (blue points) of mTHPC loaded liposomes, THP loaded PLGA nanoparticles (200 nm), lipid-coated nanoparticles (LCNP) and free mTHPC/THP (dissolved in DMSO). Triton™ X-100 was used as a positive control for hemolysis assay and was considered as 100% hemolysis. Blood plasma was considered as blank in the case of hemolysis assay while erythrocytes were considered as blank in the aPTT test. All the samples were measured in triplicate and the values were expressed as mean ± S.D (n = 3). |
Alkaline Comet Assay
Alkaline comet assay also referred to as single-cell gel electrophoresis (SCGE) is a simple and sensitive yet most extensively used technique for DNA damage (DNA strand breaks) assessment in eukaryotic cells. It has achieved the status of a standard test to explore the safety of the drug formulations. The test is based on the fact that the integrity of the cellular components gets compromised on exposure to genotoxic chemicals. DNA chromosomes get damaged on long-term exposure and after segregation, they move towards the anode under the influence of electricity. This movement is detected by fluorescence microscopy and is regarded as the tail moment.25,26 The measure of this tail moment is indexed as the degree of DNA damage. The results of the comet assay are shown in Figure 8. It is evident from the results obtained that the highest genotoxicity was caused by the free drugs (free THP and mTHPC) when exposed to the SK-OV-3 cells but still categorized in the class-II damage (5–20%; low damage). On the other hand, none of the formulations, including the lipid-coated nanoparticles induced any direct DNA damage and were classified under class-I (0–5%; no DNA damage) as observed from the olive tail moment data.27 From the data, it was concluded that irradiation of the SK-OV-3 cells after treatment with a low drug or light dose did not cause any significant DNA fragmentation and there was no apparent increase in the olive tail. Tail lengths of different comets were statistically analyzed using one-way ANOVA. Dunnett’s post hoc test with multiple comparisons against control (blank) was used to compare the results. The results were significant when compared to control with a p-value of <0.05. The % DNA in the comet tail was almost the same as one of the negative controls, even though a statistically significant effect was observed. In conclusion, the present study clearly indicated that the lipid-coated PLGA nanoparticles can be used clinically with no or minimum incidence of genetic toxicity if accumulated in peripheral organs in a small amount.
 |
Figure 8 (A) Distribution of comet tail and (B) fluorescence micrographs of genotoxicity to SK-OV-3 cells obtained from alkaline comet assay. The cells were incubated with mTHPC loaded liposomes, THP loaded PLGA nanoparticles (200 nm), LCNP, and free mTHPC/free THP (dissolved in 0.10% DMSO) for 4 h at an equitoxic dose. Irradiation was performed at a light dose of 0.05 Jcm−2. Each value is represented as the mean ± S.D for three independent experiments. For the statistical analysis, the comparison was done against the untreated cells. P values (p < 0.05) were considered significant and expressed as ***p< 0.001. |
Cellular Uptake Pathway Analysis
To study the internalization mechanism of nanoformulations in the SK-OV-3 cells, the inhibitors of the cellular uptake pathways were used. Two major pathways utilized for the internalization of the nanocarriers includes the clathrin-dependent endocytosis and caveolin dependent pathway. Clathrin-dependent endocytosis is selectively obstructed by chlorpromazine which acts by inhibiting the formation of clathrin-coated vesicles that are formed by the clathrin-coated pits leading to the formation of endosomes which ultimately fuse with the lysosomes. Chlorpromazine is also supposed to interfere with the intracellular processing of the clathrin. Caveolin dependent mechanism is inhibited by Filipin-III. It is a macrolide antibiotic derived from the Streptomyces filipensis and acts by interfering with cholesterol mediated endocytic functions thereby inhibiting the lipid raft or caveolae endocytosis.10 Figure 9 demonstrates that incubating the cells without nanoformulations and/or with inhibitors only did not cause any decline in the cell viability. Whereas the cells incubated with nanoformulations without any inhibition showed a substantial reduction in cell viability. Furthermore, when the cells were preincubated with chlorpromazine, a considerable increase in the cell viability was observed due to the inhibition of the clathrin-dependent uptake pathway. Additional incubation with Filipin-III showed relatively less inhibition of nanoformulations uptake. This inference leads to the presumption that nanoformulations uptake occurred mainly through clathrin-mediated endocytosis. None of the inhibitors was able to minimize the uptake of the free mTHPC and/or free THP (dissolved in DMSO). This result leads to the inference that the free drugs were not internalized by any of the said mechanisms. Instead, they were taken up by the cells through the diffusion process. These findings are in agreement with the earlier studies elaborating that the lipid particles are mainly internalized via clathrin-dependent pathways and are highly dependent on cell type.21,53
 |
Figure 9 Cellular uptake mechanism of the nanoformulations in SK-OV-3 cells in the presence of specific inhibitors (ie, 15 µM Filipin III and 30 µM Chlorpromazine). After pre-incubation with the inhibitors, the cells were then incubated with mTHPC loaded formulations (mTHPC-LP & LCNP) or free mTHPC (dissolved in DMSO) at a concentration of 1.5 μM as well the THP loaded formulations (THP NP 200 nm and LCNP) or free THP (dissolved in DMSO) at a concentration equivalent to 50 μM for 4 h. The irradiation was performed at a light dose of 0.5 Jcm−2 (for mTHPC loaded formulations). The viability of untreated cells was considered as 100%. Blank represents cells without any inhibitor. Values are represented as the mean ± SD for three independent experiments. P values (p < 0.05) were considered significant and expressed as ***p< 0.001. |
Apoptosis Assay
Apoptosis also known as programmed cell death, is a normal process of the health and development of multicellular organisms. Unlike necrosis, which is considered as accidental or traumatic cell death and is mainly caused by acute cellular injury, apoptosis is a well-regulated and controlled process and gives advantages during the life cycle. It is mainly characterized by morphological and biochemical changes including the compaction and fragmentation of the nuclear chromatin, cell surface blebbing, shrinkage of the cytoplasm, and the loss of membrane asymmetry.54,55 To evaluate the synergistic apoptosis by flow cytometry (fluorescence-activated cell sorting: FACS), group one of the cells was treated with mTHPC loaded liposomes and group two was treated with free mTHPC (dissolved in DMSO). Similarly, the 3rd group was treated with the THP loaded PLGA nanoparticles (200 nm) while group four was treated with the free THP (dissolved in DMSO). For the synergistic effect, group five was treated with the lipid-coated nanoparticles. The cells without any treatment but with the sequential irradiation as that of the other groups were considered as the negative control. The results of the apoptosis assay are expressed in Figure 10 and represents the typical FACS micrographs of the flow cytometry. It was noticed that combining the cell treatment in the form of LCNPs had a pronounced apoptotic effect in the SK-OV-3 cells as compared to treatment with a nanocarrier having only one drug. The results also demonstrated that the cells which were treated with free mTHPC, mTHPC-LP, free THP, or THP NP 200 nm manifested 54.57%, 39.37%, 58.22%, and 54.39% apoptotic cells (early + late apoptosis; Q1+Q2) respectively. On the other hand, a synergistic treatment subsequently increased the cell apoptosis, ie, 70.71% which was comparable to the combined cellular apoptosis produced by the mTHPC-LP and THP-NP treatment. This could be attributed to the increased amount of ROS generated due to combined chemo-photodynamic effect of LCNPs induced a synergistic apoptotic effect in the cells.56,57 These results were also in a good correlation with the results obtained from the quantitative ROS assessment and cell viability data obtained previously.
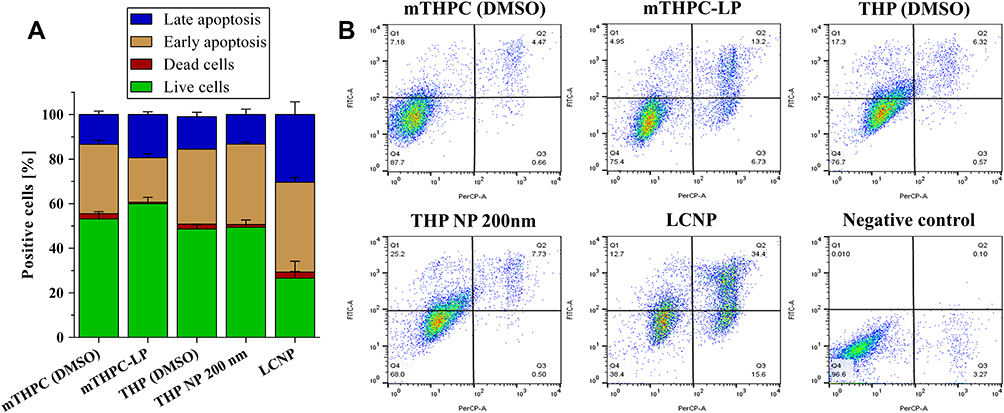 |
Figure 10 (A) Graphical representation (B) FACS micrographs of apoptosis assay by flow cytometry in SK-OV-3 cell line by nanoformulations (mTHPC-LP, THP NP 200 nm, and LCNP) as well as with free drugs (mTHPC/THP; dissolved in DMSO). Graphical representation of % positive cells are described as; top left (Q1) = early apoptotic cells, top right (Q2) = late apoptotic cells, bottom right (Q3) = dead cells, and bottom left (Q4) = the healthy cells. The cells irradiated with equivalent light dose and without any treatment were considered as the negative control. |
Stability Studies
Serum stability studies were performed to check the effect of serum protein on the formulations. The stability of the particles is based not only on the physical characteristics of the encapsulated agent and the carrier system but also on the biological environment in which they are placed. The adsorption of serum proteins on the formulations was estimated by DLS and LDA analysis. In order to simulate the physiological conditions, the formulations were incubated with 60% FCS and PBS (pH 7.4) (Table 4) in a shaking incubator at 37℃. The results manifested a reduction in the particle size of the formulations after being incubated in the serum for 24 h. (Table 5). The decrease in hydrodynamic diameter of the particles could be due to the fact that serum proteins interact with the particles via osmotic forces causing the shrinkage of the particle size.58 Furthermore, this could also be attributed to the release of surface-bound drug (eg, THP) due to particle erosion, resulting in decreased particle size.10,59 Interestingly, the zeta potential of THP NP 200 nm and lipid-coated PLGA particles was negative when placed in 60% serum, suggesting the adsorption of serum proteins. This result could be attributed to the fact that the serum is composed of negatively charged proteins which tend to adsorb more on the surface of the charged particle as compared to the neutral ones, resulting in the reduction of the surface charge.60 The increase in the PDI of the particles can be attributed to the reduction of the homogeneity of formulations. The changes in PDI were independent of the particle size.
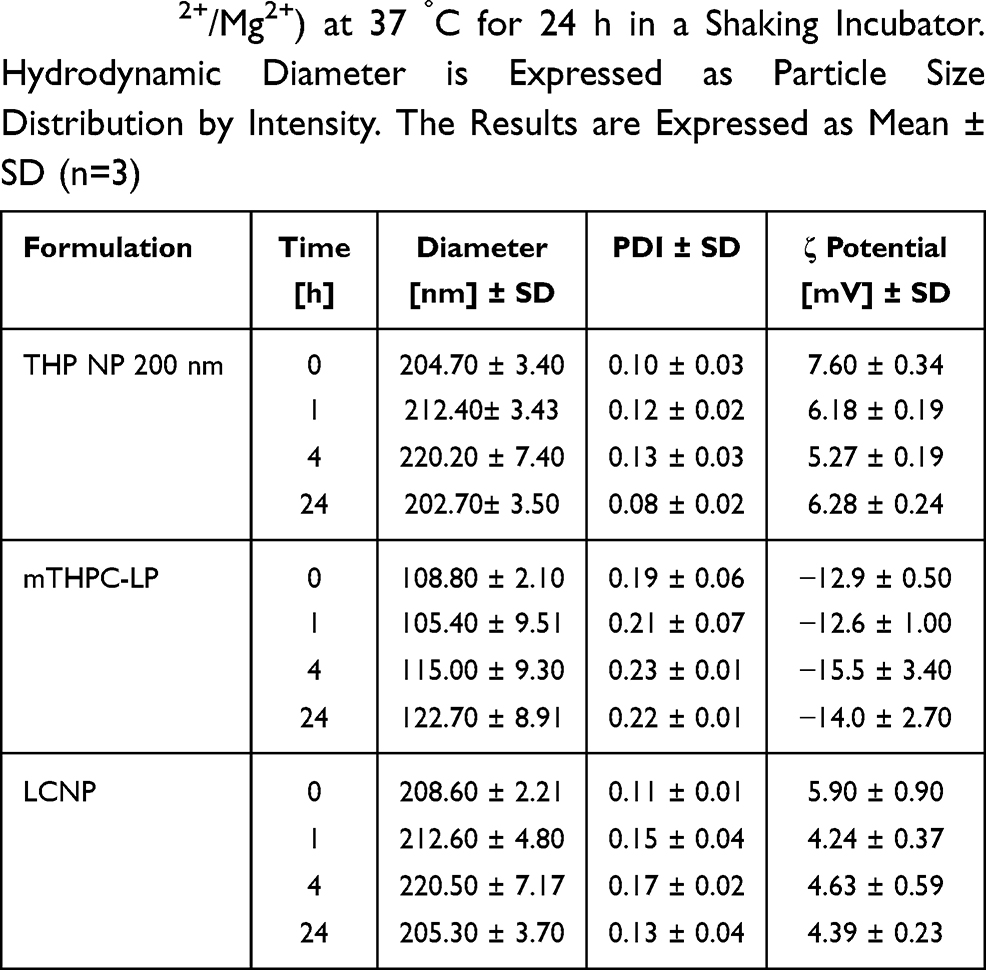 |
Table 4 The Changes in the Physicochemical Parameters of THP Loaded PLGA Nanoparticles, mTHPC Encapsulated Liposomes, and LCNPs. The Formulations Were Incubated with PBS (pH 7.4; without Ca2+/Mg2+) at 37 °C for 24 h in a Shaking Incubator. Hydrodynamic Diameter is Expressed as Particle Size Distribution by Intensity. The Results are Expressed as Mean ± SD (n=3) |
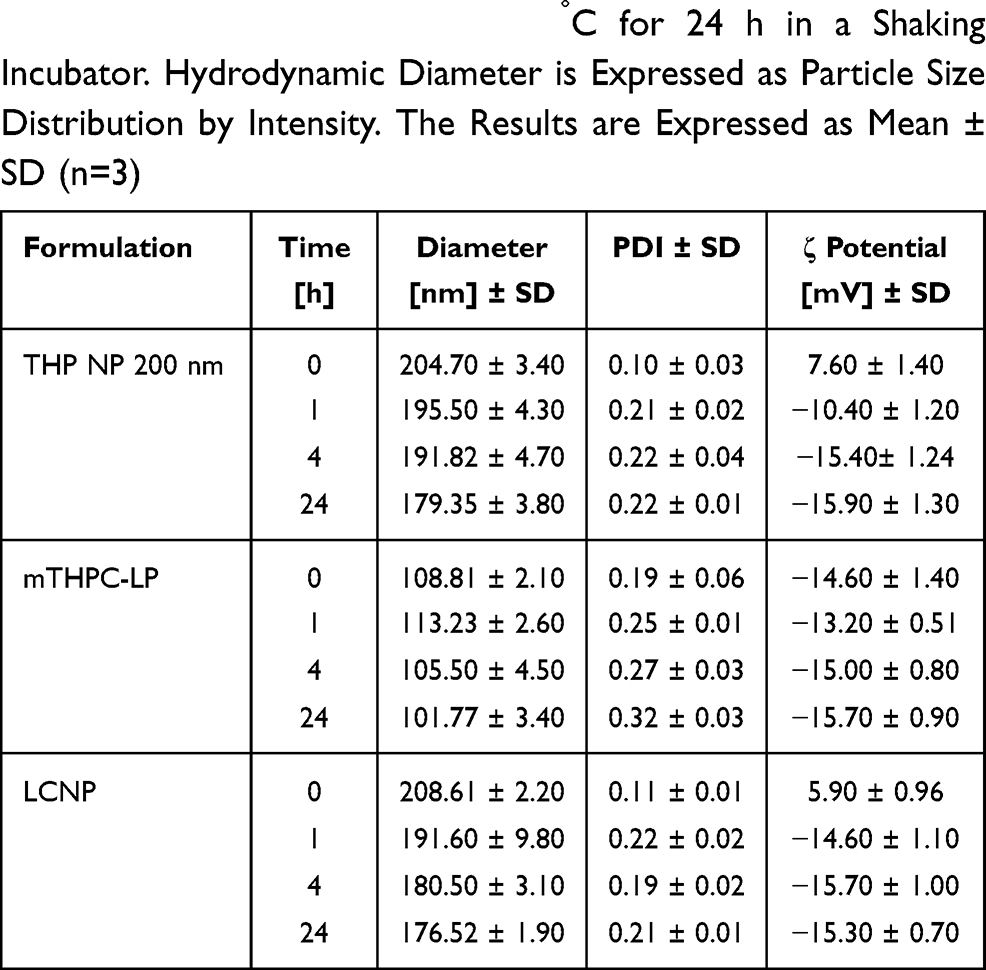 |
Table 5 The Changes in the Physicochemical Parameters of THP Loaded PLGA Nanoparticles, mTHPC Encapsulated Liposomes, and Lipid-Coated Nanoparticles. All the Formulations Were Incubated with FCS (60%) at 37 °C for 24 h in a Shaking Incubator. Hydrodynamic Diameter is Expressed as Particle Size Distribution by Intensity. The Results are Expressed as Mean ± SD (n=3) |
In vivo Acute Toxicity Assessment
The safety and tolerability of the nanoformulations were tested relative to the treatments in mice with weight loss, serum biochemical analysis, and histopathological examinations used as assessment parameters for the in vivo toxicity studies. The formulations were administered intravenously via tail vein to Swiss albino mice at a dose of 5 mg.kg−1 and 0.15 mg.kg−1 of body weight for THP and mTHPC, respectively.32,33 During 48 h of observation, the mice did not show any sign of toxicity as examined from the behavioral patterns, skin, urine color, respiration, and sleep patterns. The same parameters were monitored every day to examine any signs of toxicity. Throughout the course of the study, no mortality or any significant change in the body weight was observed confirming the safety of our nanoformulations. Post 7 days, the blood was collected and the mice were euthanized to remove the body organs for histopathological studies.24
Body Visceral Index
Body visceral index is considered as one of the effective indicators of chemically induced changes to the organs. The comparison of organ weight between the untreated and treated animal groups can be used to evaluate the toxicity profile of the drug formulations.61 Post 7 days of treatment, the organ-to-body weight ratios (visceral indices) of vital body organs including the liver, kidney, lungs, and heart were determined. After euthanizing the animals, the organs were removed carefully and washed with normal saline before weighing. Figure 11 represents the visceral body index of the test animals after necropsy. It was observed that there was a slight increase in liver weight when compared to the control group. The highest increase was marked in the case of free THP which can be credited to the THP treatment-related hepatocellular hypertrophy. The kidneys also showed a slight increase in the organ weight especially in the case of free THP, THP nanoparticles (200 nm) as well as in the case of free mTHPC. This increase can be attributed to tubular hypertrophy and may be associated with renal toxicity. The heart and lungs did not show any significant weight change and remained unaffected with all the treatments, which proposes the non-toxicity and biocompatibility of the formulations.
 |
Figure 11 The visceral body index [%] of untreated group (normal saline) and treated groups (free mTHPC, mTHPC-LP, LCNP, THP NP 200 nm, and free THP) performed after euthanizing the animals (Swiss albino mice) by cervical dislocation. Values are represented as mean ± S.D (n=3). P values (p < 0.05) were considered significant and expressed as ***p< 0.001. |
Biochemical Analysis
Biochemical indices are highly sensitive biomarkers to determine the clinical symptoms produced by the biological treatments (ie, formulations). Among these biomarkers, the liver function tests (LFTs) and renal function tests (RFTs) are the major indicators of proper liver and kidney functioning, respectively. The results of the biochemical analysis of mice blood after being treated with formulations are shown in Figure 12. The results depicted that the bilirubin level with formulations was not altered significantly except for the free THP and mTHPC. The bilirubin level was slightly higher in these treatments as compared to the control group but still fell within the acceptable limits.62 Aminotransferases are the standard measure of hepatotoxicity. In case of any cellular damage to hepatocytes, alanine aminotransferase (ALT) and aspartate aminotransferase (AST) tend to leak out into the blood circulation resulting in the increased systemic levels of these enzymes. AST was observed at the highest level in the mice treated with free THP (dissolved in DMSO) and THP NP 200 nm as compared to the mTHPC-LP and lipid-coated nanoparticles. The AST level was also slightly higher in the case of free mTHPC treated group when compared with the control group but statistically less significant as compared to free THP and THP NP 200 nm. ALT level was also increased in free mTHPC and free THP treated groups. These higher levels of both enzymes could be an indication of detoxification of the foreign particles and possible liver inflammation. In all other treatment groups, no significant change of ALT level was observed. Alkaline phosphatase (ALP) level was also significantly increased in all the treatment groups with the highest increase observed in the free THP treated group. This could possibly be the indicator of non-alcoholic fatty liver and cardiac problems.63
 |
Figure 12 Typical blood biochemical profile including liver function tests (LFTs); (A) ALT, (B) AST, (C) ALP, (D) creatinine, renal function tests (RFTs); (E) bilirubin, (F) uric acid, as well as (G) cholesterol and (H) total protein levels after being treated with the nanoformulations intravenously. Values are represented as mean ± S.D (n=3) and statistical significance is indicated as ***p < 0.001, **p< 0.01 and *p< 0.1. |
The results of RFTs manifested that the level of uric acid was moderately increased in the case of free THP as compared to the controlled group (Figure 12). Contrary to this, the uric acid level was slightly decreased in mTHPC-LP but fell within limits. Moreover, in all other treatment groups, the change in the level of these biomarkers remained statistically insignificant. The creatinine level was increased with free THP and free mTHPC (DMSO) when compared to the control, yet found within the limits. This slight increase in the level of these biomarkers could be a cause of renal hypertrophy and poor kidney functioning. With all other treatment groups, there was no significant variation in the creatinine level. The effect of the formulations was also investigated on serum lipid profile and total protein level (Figure 12). There was a significant increase in the cholesterol level with all the treatment groups except for mTHPC loaded liposomes but remained well within the normal range.64 The triglycerides level was also found within the normal limit in all the treatment groups and no significant changes were observed. There was also a slight increase in total protein level with free THP, THP NP 200 nm, and free mTHPC treatment but no significant difference with mTHPC-LP and LCNP treatment. All these results of the biochemical analysis were also in line with the results obtained from body visceral indices.
Hematological Analysis
Any foreign material including drug formulations when coming in contact with blood components may induce an acute inflammatory response resulting in complications to the pharmacotherapy. This necessitates the complete exploration of the possible toxicity potential of drug formulations and their carrier systems on the blood profile.36 The effect of our nanoformulations on the mice’s blood and its components was also evaluated through a complete blood count (CBC). The results of the hematological analysis are presented in Table 6. The results demonstrated that free THP damaged the RBCs integrity resulting in decreased total erythrocyte count (TEC) which resulted in the reduction of hemoglobin (Hb) level in the blood. TEC and Hb levels were also reduced in the free mTHPC treated group but less profound as compared to free THP (dissolved in DMSO). However, mTHPC-LP, LCNP, and THP NP 200 nm did not significantly affect the RBCs level when compared with the control (blank) group. These observations were also in accordance with the previous results obtained during the ex vivo hemolysis assay. Total leukocyte count (TLC) was also remarkably affected during treatment with free THP which can lead to neutropenia.64 This may be caused by bone marrow suppression resulting in a delayed inflammatory response. Free mTHPC also reduced the TLC but the effect was less intense as compared to free THP. These results call for the encapsulation of the free THP/mTHPC into relatively nontoxic carrier systems. The mTHPC-LP, THP NP 200 nm, and LCNP did not show a significant effect on WBCs. Other parameters including mean corpuscular volume (MCV), Hematocrit (HCT), mean corpuscular hemoglobin (MCH), mean corpuscular hemoglobin concentration (MCHC), platelets count and mean platelet volume (MPV) were also monitored and it was observed that all these parameters remained more or less unchanged in all the nanoformulations, depicting the safety of these formulations.
 |
Table 6 The Changes in Hematological Parameters in the Blood Serum of Albino Mice After Intravenous Administration of Free mTHPC (DMSO), mTHPC Loaded Liposomes, LCNP, THP PLGA Nanoparticles (200 Nm), Free THP (DMSO), and Normal Saline into the Tail Vein. After 7 Days of Treatment, Blood Was Withdrawn from the Mice and a Complete Blood Count Was Performed. The Values are Expressed as Mean ± S.D (n = 3) |
Histopathological Examinations
One of the major problems associated with the clinical use of the anticancer agents (eg, chemotherapeutics and photosensitizers) is the injuries to the peripheral tissues which can lead to multiple organ toxicity.4 In order to examine any signs of toxicity to the mice′s organs after being treated with our formulations, the biochemical analysis was accompanied by histological studies. The histological slide of vital organs (ie, heart, liver, kidney, and lungs) was prepared through the rotary microtome. The tissue sectioned were fixed on glass slides, stained with H&E stain, and observed under the microscope. For the H & E staining, the cell nucleus was stained blue with hematoxylin while the cell cytoplasm and extracellular matrix were stained pink by eosin. Normal cells appeared polygonal in shape with blue nuclei in spherical or spindle shape. The cytoplasm of the necrotic cells became pink amorphous material with their nucleus disappeared. Whereas the apoptotic cells shrank and turned around with the nucleus condensed and became darker.65 The images of the tissue sections are presented in Figure 13. From the figure, it can be observed that heart samples from all treatment groups appeared to be completely normal. There were no visible signs of inflammation, necrosis, or hyperthermia. The structure of the liver sections was also found to be normal and no changes in fat tissues were seen except for free THP. The free THP treated group showed some signs of the apoptotic cells with fibrosis, pyknosis (condensation of nuclei due to apoptosis) and hepatic lesions.66 No evidence of the necrotic bodies or hydrophobic degradation was found in any of the treatment groups. The kidney showed the signs of necrosis, apoptosis, as well as congestion of the renal tissue in the free THP and THP NP 200 nm, treated groups while other treatment groups remained unaffected. Moreover, small changes in the lung′s histology with the breakage of the lung′s fiber were also noticeable in free THP and THP NP 200 nm treated groups.65 In all the other treatment groups, normal alveolar and arteriolar structures were observed. These findings confirmed the safety of our lipid-coated particles as no evidence of the toxicity was visible in any of the histological studies.
 |
Figure 13 Histopathological analysis of various organs after treatment with free mTHPC, mTHPC-LP, THP NP 200 nm, LCNPs, and free THP. The animals treated with normal saline were taken as control (Blank). The tissues were stained with hematoxylin/eosin to assess the potential effects of treatments on the organ’s morphology and cellular damage. Black arrows show the sign of pyknosis while the red arrows represent the necrotic cells. All the acute toxicity studies were performed in accordance with OECD 425 guidelines except that i.v. administration was used. |
Conclusion
The tumor cells exploit multiple mechanisms to prevent the accumulation of the drugs into the cells resulting in drug resistance. This drug resistance is a key factor that limits the success of chemotherapy in the clinical setup. In the present study, combination chemo-photodynamic therapy using lipid encapsulated polymeric nanoparticles were employed against the ovarian carcinoma cells. A major advantage of these coated particles is the combination of two different therapeutic modalities in one carrier thereby limiting any type of toxicity associated with the use of different nanocarriers. mTHPC liposomes were formulated using the thin-film hydration method. These liposomes showed an effective drug loading as well as a higher photocytotoxicity as compared to free mTHPC. Two different sizes of THP nanoparticles (ie, 200 nm and 400 nm) were prepared using the solvent evaporation technique and their physicochemical parameters as well their cell viability studies were conducted. It was observed that THP NP 200 nm produced higher cytotoxicity as compared to THP NP 400 nm which can be attributed to the fact that the smaller nanoparticles are readily taken up by the cells as compared to larger nanoparticles (ie, 400 nm). Based on these parameters, mTHPC loaded liposomes were coated over the THP NP. The formed LCNPs exhibited better physicochemical properties as compared to free mTHPC and free THP such as improved biocompatibility profile, serum stability, as well as higher ROS production. The morphological characterizations using AFM and TEM revealed the complete coating of the nanoparticle’s surface with the lipid bilayer. The LCNPs when irradiated with different light fluences, also manifested a synergistic effect leading to a surpassed cytotoxicity profile. The comet assay did not show any sign of genotoxicity. The acute in vivo toxicity assessment of the optimized formulations containing 5 mg.kg−1 of THP and 0.15 mg.kg−1 of mTHPC, following intravenous administration, did not show any significant effect on the parameters, ie, serum biochemical analysis. The histopathological examination also revealed no sign of toxicity to the body organ tissue demonstrating the safety of the formulations. All of these observations suggested that surface modification of the polymeric nanoparticles with the lipid bilayer (ie, LCNPs) has great potential to serve as a versatile and efficient carrier system for the co-delivery of mTHPC and THP.
Acknowledgments
We would like to thank Mrs. Eva Mohr, Department of Pharmaceutics and Biopharmaceutics, Philipps University Marburg, for technical work and kind support throughout the research period. The authors would also like to express their gratitude to the German academic exchange services and the Higher education commission of Pakistan (DAAD/HEC) for providing the scholarship.
Disclosure
The authors report no conflicts of interest for this work.
References
1. Greco F, Vicent MJ. Combination therapy: opportunities and challenges for polymer–drug conjugates as anticancer nanomedicines. Adv Drug Deliv Rev. 2009;61(13):1203–1213. doi:10.1016/j.addr.2009.05.006
2. Pacardo DB, Ligler FS, Gu Z. Programmable nanomedicine: synergistic and sequential drug delivery systems. Nanoscale. 2015;7(8):3381–3391. doi:10.1039/C4NR07677J
3. Khdair A, Chen D, Patil Y, et al. Nanoparticle-mediated combination chemotherapy and photodynamic therapy overcomes tumor drug resistance. J Control Release. 2010;141(2):137–144. doi:10.1016/j.jconrel.2009.09.004
4. Zhou J, Zhang X, Li M, et al. Novel lipid hybrid albumin nanoparticle greatly lowered toxicity of pirarubicin. Mol Pharm. 2013;10(10):3832–3841. doi:10.1021/mp400303w
5. Nakamura H, Koziolová E, Etrych T, et al. Comparison between linear and star-like HPMA conjugated pirarubicin (THP) in pharmacokinetics and antitumor activity in tumor bearing mice. Eur J Pharm Biopharm. 2015;90:90–96. doi:10.1016/j.ejpb.2014.10.007
6. Schäfer J, Sitterberg J, Ehrhardt C, Kumar M, Bakowsky U A new drug vehicle-lipid coated biodegradable nanoparticles.
7. Senge MO. mTHPC–A drug on its way from second to third generation photosensitizer? Photodiagnosis Photodyn Ther. 2012;9(2):170–179. doi:10.1016/j.pdpdt.2011.10.001
8. Bovis MJ, Woodhams JH, Loizidou M, Scheglmann D, Bown SG, MacRobert AJ. Improved in vivo delivery of m-THPC via pegylated liposomes for use in photodynamic therapy. J Control Release. 2012;157(2):196–205. doi:10.1016/j.jconrel.2011.09.085
9. Kumar MR, Bakowsky U, Lehr C. Preparation and characterization of cationic PLGA nanospheres as DNA carriers. Biomaterials. 2004;25(10):1771–1777. doi:10.1016/j.biomaterials.2003.08.069
10. Duse L, Agel MR, Pinnapireddy SR, et al. Photodynamic therapy of ovarian carcinoma cells with curcumin-loaded biodegradable polymeric nanoparticles. Pharmaceutics. 2019;11(6):282. doi:10.3390/pharmaceutics11060282
11. Ali S, Amin MU, Ali MY, et al. Wavelength dependent photo-cytotoxicity to ovarian carcinoma cells using temoporfin loaded tetraether liposomes as efficient drug delivery system. Eur J Pharm Biopharm. 2020;150:50–65. doi:10.1016/j.ejpb.2020.03.008
12. Mahmoud G, Jedelská J, Omar SM, Strehlow B, Schneider M, Bakowsky U. Stabilized tetraether lipids based particles guided prophyrins photodynamic therapy. Drug Deliv. 2018;25(1):1526–1536. doi:10.1080/10717544.2018.1482970
13. Baghdan E, Pinnapireddy SR, Strehlow B, Engelhardt KH, Schäfer J, Bakowsky U. Lipid coated chitosan-DNA nanoparticles for enhanced gene delivery. Int J Pharm. 2018;535(1–2):473–479. doi:10.1016/j.ijpharm.2017.11.045
14. Pinnapireddy SR, Duse L, Strehlow B, Schäfer J, Bakowsky U. Composite liposome-PEI/nucleic acid lipopolyplexes for safe and efficient gene delivery and gene knockdown. Colloids Surf B Biointerfaces. 2017;158:93–101. doi:10.1016/j.colsurfb.2017.06.022
15. Bhatt P, Lalani R, Vhora I, et al. Liposomes encapsulating native and cyclodextrin enclosed paclitaxel: enhanced loading efficiency and its pharmacokinetic evaluation. Int J Pharm. 2018;536(1):95–107. doi:10.1016/j.ijpharm.2017.11.048
16. Reshetov V, Kachatkou D, Shmigol T, et al. Redistribution of meta-tetra (hydroxyphenyl) chlorin (m-THPC) from conventional and PEGylated liposomes to biological substrates. Photochem Photobiol Sci. 2011;10(6):911–919. doi:10.1039/c0pp00303d
17. Schaefer J, Schulze C, Marxer EEJ, et al. Atomic force microscopy and analytical ultracentrifugation for probing nanomaterial protein interactions. ACS Nano. 2012;6(6):4603–4614. doi:10.1021/nn202657q
18. Agel MR, Baghdan E, Pinnapireddy SR, Lehmann J, Schäfer J, Bakowsky U. Curcumin loaded nanoparticles as efficient photoactive formulations against gram-positive and gram-negative bacteria. Colloids Surf B Biointerfaces. 2019;178:460–468. doi:10.1016/j.colsurfb.2019.03.027
19. Ali MY, Tariq I, Sohail MF, et al. Selective anti-ErbB3 aptamer modified sorafenib microparticles: in vitro and in vivo toxicity assessment. Eur J Pharm Biopharm. 2019;145:42–53. doi:10.1016/j.ejpb.2019.10.003
20. Yow C, Chen J, Mak N, Cheung N, Leung A. Cellular uptake, subcellular localization and photodamaging effect of temoporfin (mTHPC) in nasopharyngeal carcinoma cells: comparison with hematoporphyrin derivative. Cancer Lett. 2000;157(2):123–131. doi:10.1016/S0304-3835(00)00453-5
21. Plenagl N, Duse L, Seitz BS, et al. Photodynamic therapy–hypericin tetraether liposome conjugates and their antitumor and antiangiogenic activity. Drug Deliv. 2019;26(1):23–33. doi:10.1080/10717544.2018.1531954
22. Duse L, Baghdan E, Pinnapireddy SR, et al. Preparation and characterization of curcumin loaded chitosan nanoparticles for photodynamic therapy. Physica Status Solidi (a). 2018;215(15):1700709. doi:10.1002/pssa.201700709
23. Evans BC, Nelson CE, Shann SY, et al. Ex vivo red blood cell hemolysis assay for the evaluation of pH-responsive endosomolytic agents for cytosolic delivery of biomacromolecular drugs. J Vis Exp. 2013;73:e50166.
24. Sohail MF, Sarwar HS, Javed I, et al. Cell to rodent: toxicological profiling of folate grafted thiomer enveloped nanoliposomes. Toxicol Res (Camb). 2017;6(6):814–821. doi:10.1039/C7TX00146K
25. Fairbairn DW, Olive PL, O’Neill KL. The comet assay: a comprehensive review. Mutat Res. 1995;339(1):37–59. doi:10.1016/0165-1110(94)00013-3
26. Yow C, Mak N, Szeto S, et al. Photocytotoxic and DNA damaging effect of temoporfin (mTHPC) and merocyanine 540 (MC540) on nasopharyngeal carcinoma cell. Toxicol Lett. 2000;115(1):53–61. doi:10.1016/S0378-4274(00)00174-0
27. Akhtar MF, Ashraf M, Anjum AA, et al. Textile industrial effluent induces mutagenicity and oxidative DNA damage and exploits oxidative stress biomarkers in rats. Environ Toxicol Pharmacol. 2016;41:180–186. doi:10.1016/j.etap.2015.11.022
28. Ali MY, Tariq I, Ali S, et al. Targeted ErbB3 Cancer Therapy: a synergistic approach to effectively combat cancer. Int J Pharm. 2019;575:118961. doi:10.1016/j.ijpharm.2019.118961
29. Tariq I, Ali MY, Sohail MF, et al. Lipodendriplexes mediated enhanced gene delivery: a cellular to pre-clinical investigation. Sci Rep. 2020;10(1):21446. doi:10.1038/s41598-020-78123-6
30. Senior J, Gregoriadis G. Stability of small unilamellar liposomes in serum and clearance from the circulation: the effect of the phospholipid and cholesterol components. Life Sci. 1982;30(24):2123–2136. doi:10.1016/0024-3205(82)90455-6
31. Saleem U, Ahmad B, Ahmad M, Erum A, Hussain K, Irfan Bukhari N. Is folklore use of Euphorbia helioscopia devoid of toxic effects? Drug Chem Toxicol. 2016;39(2):233–237. doi:10.3109/01480545.2015.1092040
32. Buchholz J, Kaser-Hotz B, Khan T, et al. Optimizing photodynamic therapy: in vivo pharmacokinetics of liposomal meta-(tetrahydroxyphenyl) chlorin in feline squamous cell carcinoma. Clin Cancer Res. 2005;11(20):7538–7544. doi:10.1158/1078-0432.CCR-05-0490
33. Kawano K, Takayama K, Nagai T, Maitani Y. Preparation and pharmacokinetics of pirarubicin loaded dehydration–rehydration vesicles. Int J Pharm. 2003;252(1–2):73–79. doi:10.1016/S0378-5173(02)00628-2
34. Vandebriel RJ, Tonk EC, de la Fonteyne-blankestijn LJ, et al. Immunotoxicity of silver nanoparticles in an intravenous 28-day repeated-dose toxicity study in rats. Part Fibre Toxicol. 2014;11(1):21. doi:10.1186/1743-8977-11-21
35. Venkatasubbu GD, Ramasamy S, Gaddam PR, Kumar J. Acute and subchronic toxicity analysis of surface modified paclitaxel attached hydroxyapatite and titanium dioxide nanoparticles. Int J Nanomedicine. 2015;10(Suppl 1):137. doi:10.2147/IJN.S79991
36. Sohail MF, Hussain SZ, Saeed H, et al. Polymeric nanocapsules embedded with ultra-small silver nanoclusters for synergistic pharmacology and improved oral delivery of Docetaxel. Sci Rep. 2018;8(1):13304. doi:10.1038/s41598-018-30749-3
37. Gautam M, Goel R. Toxicological study of Ocimum sanctum Linn leaves: hematological, biochemical, and histopathological studies. J Toxicol. 2014;2014. doi:10.1155/2014/135654
38. Li Y, Yang L. Driving forces for drug loading in drug carriers. J Microencapsul. 2015;32(3):255–272. doi:10.3109/02652048.2015.1010459
39. De Vetta M, González L, Nogueira JJ. Hydrogen bonding regulates the rigidity of liposome‐encapsulated chlorin photosensitizers. ChemistryOpen. 2018;7(6):475–483. doi:10.1002/open.201800050
40. Cheow WS, Hadinoto K. Factors affecting drug encapsulation and stability of lipid–polymer hybrid nanoparticles. Colloids Surf B Biointerfaces. 2011;85(2):214–220. doi:10.1016/j.colsurfb.201
41. Sitterberg J, Özcetin A, Ehrhardt C, Bakowsky U. Utilising atomic force microscopy for the characterisation of nanoscale drug delivery systems. Eur J Pharm Biopharm. 2010;74(1):2–13. doi:10.1016/j.ejpb.2009.09.005
42. Sengel-Turk CT, Hascicek C. Design of lipid-polymer hybrid nanoparticles for therapy of BPH: part I. Formulation optimization using a design of experiment approach. J Drug Deliv Sci Technol. 2017;39:16–27. doi:10.1016/j.jddst.2017.02.012
43. Zhang L, Zhang L. Lipid–polymer hybrid nanoparticles: synthesis, characterization and applications. Nano Life. 2010;1(01n02):163–173. doi:10.1142/S179398441000016X
44. Kumari A, Yadav SK, Yadav SC. Biodegradable polymeric nanoparticles based drug delivery systems. Colloids Surf B Biointerfaces. 2010;75(1):1–18. doi:10.1016/j.colsurfb.2009.09.001
45. Magenheim B, Levy M, Benita S. A new in vitro technique for the evaluation of drug release profile from colloidal carriers-ultrafiltration technique at low pressure. Int J Pharm. 1993;94(1–3):115–123. doi:10.1016/0378-5173(93)90015-8
46. Dinarvand R, Moghadam SH, Mohammadyari-Fard L, Atyabi F. Preparation of biodegradable microspheres and matrix devices containing naltrexone. AAPS PharmSciTech. 2003;4(3):45–54. doi:10.1208/pt040334
47. Reidy K, Campanile C, Muff R, Born W, Fuchs B. mTHPC‐mediated photodynamic therapy is effective in the metastatic human 143B osteosarcoma cells. Photochem Photobiol. 2012;88(3):721–727. doi:10.1111/j.1751-1097.2012.01096.x
48. Win KY, Feng -S-S. Effects of particle size and surface coating on cellular uptake of polymeric nanoparticles for oral delivery of anticancer drugs. Biomaterials. 2005;26(15):2713–2722. doi:10.1016/j.biomaterials.2004.07.050
49. McLennan HR, Degli Esposti M. The contribution of mitochondrial respiratory complexes to the production of reactive oxygen species. J Bioenerg Biomembr. 2000;32(2):153–162. doi:10.1023/A:1005507913372
50. Dobrovolskaia MA, McNeil SE. Handbook of Immunological Properties of Engineered Nanomaterials. Vol. 1. World Scientific; 2013.
51. Lenahan JG, Frye S, Phillips GE. Use of the activated partial thromboplastin time in the control of heparin administration. Clin Chem. 1966;12(5):263–268. doi:10.1093/clinchem/12.5.263
52. Wintrobe MM. Wintrobe’s Clinical Hematology. Vol. 1. Lippincott Williams & Wilkins; 2008.
53. Rejman J, Bragonzi A, Conese M. Role of clathrin-and caveolae-mediated endocytosis in gene transfer mediated by lipo-and polyplexes. Mol Ther. 2005;12(3):468–474. doi:10.1016/j.ymthe.2005.03.038
54. Allen RT, Hunter III WJ, Agrawal DK. Morphological and biochemical characterization and analysis of apoptosis. J Pharmacol Toxicol Methods. 1997;37(4):215–228. doi:10.1016/S1056-8719(97)00033-6
55. Darzynkiewicz Z, Juan G, Li X, Gorczyca W, Murakami T, Traganos F. Cytometry in cell necrobiology: analysis of apoptosis and accidental cell death (necrosis). Cytometry. 1997;27(1):1–20. doi:10.1002/(SICI)1097-0320(19970101)27:1<1::AID-CYTO2>3.0.CO;2-L
56. Simon H-U, Haj-Yehia A, Levi-Schaffer F. Role of reactive oxygen species (ROS) in apoptosis induction. Apoptosis. 2000;5(5):415–418. doi:10.1023/A:1009616228304
57. Liu S-Y, Song S-X, Lin L, Liu X. Molecular mechanism of cell apoptosis by paclitaxel and pirarubicin in a human osteosarcoma cell line. Chemotherapy. 2010;56(2):101–107. doi:10.1159/000305257
58. Wolfram J, Suri K, Yang Y, et al. Shrinkage of pegylated and non-pegylated liposomes in serum. Colloids Surf B Biointerfaces. 2014;114:294–300. doi:10.1016/j.colsurfb.2013.10.009
59. Nafee N, Schneider M, Schaefer UF, Lehr C-M. Relevance of the colloidal stability of chitosan/PLGA nanoparticles on their cytotoxicity profile. Int J Pharm. 2009;381(2):130–139. doi:10.1016/j.ijpharm.2009.04.049
60. Hasan W, Chu K, Gullapalli A, et al. Delivery of multiple siRNAs using lipid-coated PLGA nanoparticles for treatment of prostate cancer. Nano Lett. 2011;12(1):287–292. doi:10.1021/nl2035354
61. Sellers RS, Mortan D, Michael B, et al. Society of toxicologic pathology position paper: organ weight recommendations for toxicology studies. Toxicol Pathol. 2007;35(5):751–755. doi:10.1080/01926230701595300
62. Javed I, Hussain SZ, Shahzad A, et al. Lecithin-gold hybrid nanocarriers as efficient and pH selective vehicles for oral delivery of diacerein—in-vitro and in-vivo study. Colloids Surf B Biointerfaces. 2016;141:1–9. doi:10.1016/j.colsurfb.2016.01.022
63. Shi HB, Kong M, Chen G, et al. Compound pollen protein nutrient increases serum albumin in cirrhotic rats. Gastroenterol Res. 2010;3(6):253.
64. Adeyemi OS, Adewumi I. Biochemical evaluation of silver nanoparticles in wistar rats. Int Sch Res Notices. 2014;2014:1–8. doi:10.1155/2014/196091
65. Yi X, Lian X, Dong J, et al. Co-delivery of pirarubicin and paclitaxel by human serum albumin nanoparticles to enhance antitumor effect and reduce systemic toxicity in breast cancers. Mol Pharm. 2015;12(11):4085–4098. doi:10.1021/acs.molpharmaceut.5b00536
66. Inomata K, Tajima K, Yagi H, et al. A pre-clinical large animal model of sustained liver injury and regeneration stimulus. Sci Rep. 2018;8(1):14987. doi:10.1038/s41598-018-32889-y
 © 2021 The Author(s). This work is published and licensed by Dove Medical Press Limited. The
full terms of this license are available at https://www.dovepress.com/terms
and incorporate the Creative Commons Attribution
- Non Commercial (unported, 3.0) License.
By accessing the work you hereby accept the Terms. Non-commercial uses of the work are permitted
without any further permission from Dove Medical Press Limited, provided the work is properly
attributed. For permission for commercial use of this work, please see paragraphs 4.2 and 5 of our Terms.
© 2021 The Author(s). This work is published and licensed by Dove Medical Press Limited. The
full terms of this license are available at https://www.dovepress.com/terms
and incorporate the Creative Commons Attribution
- Non Commercial (unported, 3.0) License.
By accessing the work you hereby accept the Terms. Non-commercial uses of the work are permitted
without any further permission from Dove Medical Press Limited, provided the work is properly
attributed. For permission for commercial use of this work, please see paragraphs 4.2 and 5 of our Terms.