")
Back to Journals » International Journal of General Medicine » Volume 16
Lipocalin-2, Soluble Transferrin Receptor, and Erythropoietin in Anemia During Mild Renal Dysfunction
Authors Nahm CH , Lee MH , Fujii T , Fujii N , Choi JW
Received 7 June 2023
Accepted for publication 11 August 2023
Published 21 August 2023 Volume 2023:16 Pages 3603—3612
DOI https://doi.org/10.2147/IJGM.S422411
Checked for plagiarism Yes
Review by Single anonymous peer review
Peer reviewer comments 2
Editor who approved publication: Dr Scott Fraser
Chung Hyun Nahm,1 Moon Hee Lee,2 Tatsuyoshi Fujii,3 Noriyoshi Fujii,4 Jong Weon Choi1
1Department of Laboratory Medicine, College of Medicine, Inha University, Incheon, Republic of Korea; 2Department of Internal Medicine, College of Medicine, Inha University, Incheon, Republic of Korea; 3Department of Internal Medicine, Teikyo University Chiba Medical Center, Chiba, Japan; 4Department of Internal Medicine, Tsuchiura Kyodo General Hospital, Ibaraki, Japan
Correspondence: Jong Weon Choi, Department of Laboratory Medicine, College of Medicine, Inha University, Inhang-ro 27, Jung-gu, Incheon, 22332, Republic of Korea, Tel +82-32-890-2503, Fax +82-32-890-2529, Email [email protected]
Background: Mild renal dysfunction (MRD) is a common condition often associated with diabetes or inflammation and regarded as a risk factor for cardiovascular disease in patients with hypertension. Few studies have examined the role of lipocalin-2 (LCN2) as a regulator of iron and a contributor to anemia in MRD. The aim of this study was to investigate the relationship between LCN2, soluble transferrin receptor (sTfR), erythropoietin (EPO), reticulocyte production, and the prevalence of anemia in MRD.
Methods: A total of 235 subjects with MRD were evaluated. LCN2, sTfR, EPO, and iron levels were measured. Reticulocyte maturity index (RMI) and corrected LCN2 (cLCN2) values were calculated using reticulocyte subpopulations and the inflammation index, respectively.
Results: Subjects with LCN2 elevation had significantly higher sTfR and significantly lower RMI levels than those without LCN2 elevation. Compared to subjects without LCN2 elevation, those with LCN2 elevation exhibited significantly lower hemoglobin (12.9 ± 1.6 g/dL vs 14.0 ± 1.7 g/dL, p < 0.001) and more prevalent anemia (27.7% vs 13.3%, p = 0.008). Patients with anemia had significantly higher LCN2 and cLCN2 than those without anemia. LCN2 was positively correlated with sTfR and negatively correlated with RMI but not EPO. Elevated LCN2 led to a 1.3-fold increase in the prevalence of anemia (odds ratio: 1.302; 95% CI: 1.012– 2.527; p < 0.001).
Conclusion: LCN2 elevation may contribute to the development of anemia in MRD, particularly in conjunction with restricted iron availability and suppressed reticulocyte production.
Keywords: lipocalin-2, transferrin receptor, erythropoietin, renal dysfunction, anemia
Introduction
Mild renal dysfunction (MRD) usually causes no symptoms or only slight clinical manifestations; thus, it is often incidentally discovered and less seriously recognized. However, MRD is common in persons with diabetes, inflammation, or hypertension. In fact, MRD was detected in 10–40% of people with prolonged primary hypertension.1 Although MRD does not necessarily evolve into end-stage kidney disease, it is regarded as an independent risk factor for cardiovascular disease in patients with hypertension.2 MRD is closely related to several factors, such as dyslipidemia, older age, high blood pressure, and smoking status.3 In particular, systemic inflammation is an important component of the pathogenesis of renal dysfunction.4
Decreased kidney function is associated with a lower hemoglobin level and a higher prevalence of anemia.5 Anemia in kidney diseases is clinically important because it is closely related to the progression to chronic kidney diseases and increased cardiovascular comorbidities.6 Anemia in renal dysfunction is largely due to the insufficient production of erythropoietin (EPO), a hormone that stimulates erythropoietic activity in response to decreased oxygen levels.7 In patients with anemia, effective erythropoiesis can be monitored by quantitative measurement of reticulocyte subpopulations. The reticulocyte maturity index (RMI) is calculated from three reticulocyte subfractions, such as low-, middle-, and high-fluorescence reticulocytes (LFR, MFR, and HFR, respectively) and can be used as the earliest and most sensitive predictor for erythropoiesis.8
Lipocalin-2 (LCN2), also known as neutrophil gelatinase-associated lipocalin, is a small glycoprotein expressed in various tissues, including the kidney, lung, bone marrow, and adipose tissues.9 As LCN2 is upregulated shortly after renal tubular damage, it has been accepted as a promising marker for the early detection of acute kidney injury.10 However, plasma LCN2 levels are affected by inflammation. Recently, several studies reported that LCN2 is involved in the iron transport pathway and inhibits erythropoiesis by inducing apoptosis.11,12
Transferrin receptor (TfR) is a membrane glycoprotein receptor involved in iron transport through the binding of transferrin. Soluble TfR (sTfR), a cleaved form of the extracellular portion of TfR, reflects functional iron status.13 As sTfR is not affected by inflammatory conditions, it has been used to assess the iron status in patients with inflammation.14 An elevated sTfR level is usually observed in an iron-deficient state. Accordingly, serum sTfR levels are inversely correlated with the amount of iron available for erythropoiesis.15
Previous studies have largely focused on the clinical use of LCN2 as an indicator of acute kidney injury and a predictor of worsening kidney function in chronic renal diseases.9,10 However, limited studies have closely examined the effect of LCN2 on sTfR, RMI, and EPO in subjects with mildly reduced kidney function. Therefore, this study investigated the possible association between LCN2, sTfR, RMI, EPO, and the prevalence of anemia in persons with MRD. This study also evaluated whether LCN2 elevation is related to decreased iron availability and suppressed reticulocyte production.
Materials and Methods
Subject Populations
This cross-sectional observational study was performed on 235 participants (132 males and 103 females) with MRD who had no history of iron supplementation, lipid-lowering therapies, and hemodialysis. This study was conducted using the data obtained from patients who were diagnosed with MRD between January 2019 and June 2022 at Inha University Hospital. The participants’ age ranged from 48 to 71 years (mean age: 60.3 years). Age- and sex-matched healthy individuals (n = 92) without evidence of impaired kidney function, inflammation, and anemia were enrolled as the control group. MRD was defined as creatinine clearance (CrCl) of 60 to <90 mL/min or the presence of microalbuminuria.16 The following subjects were excluded from the study because their conditions may affect LCN2 and sTfR levels: (a) those with sepsis, malignancy, and stroke; (b) those with a history of recent surgery; (c) those with acute blood loss or blood transfusion; and (d) individuals who were pregnant. Subjects with incomplete data for the anthropometric measures and laboratory tests were also excluded from the analysis. Information for smoking history was obtained by reviewing medical records. This study protocol was approved by the institutional review board of Inha University Hospital (approval number: 2023-03-006), and written informed consent was obtained from the participants. This study was performed in accordance with the guidelines of the Declaration of Helsinki.
Measurement of Laboratory Parameters
Blood samples (7 mL) were collected from participants after fasting for at least eight hours. All laboratory measurements were performed using blood samples obtained before treatment. Samples were centrifuged at 2500×g for 20 min and immediately analyzed for the following parameters: iron profiles, high-sensitivity C-reactive protein (hsCRP), and creatinine. For the measurement of LCN2, sTfR, and EPO, samples were stored at −80°C until analysis. Plasma LCN2 levels were measured by a fluorescence immunoassay using the Triage assay kit (Alere, Inc., San Diego, CA, USA). An LCN2 cutoff level was set at 150 ng/mL.17 Serum sTfR concentrations were measured by a particle enhanced immunoturbidimetric assay using the Tina‐quant sTfR assay kit (Roche Diagnostics, Mannheim, Germany). EPO was analyzed using an enzyme-linked immunosorbent assay with a Quantikine EPO ELISA kit (R&D Systems, Minneapolis, MN, USA). Reticulocytes and their subpopulations were estimated using a hematologic analyzer (Sysmex XE-2100, TOA Medical Electronics, Kobe, Japan). The RMI was calculated from the proportion of reticulocyte subpopulations using the following equation: RMI (%) = [(MFR + HFR)/LFR] × 100.18 Serum hsCRP levels were measured with an immunonephelometry assay (Dade Behring, Inc., Deerfield, IL, USA). Erythrocyte sedimentation rate (ESR) was tested with the Westergren sedimentation technique using StaRRsed Auto-Compact (Mechatronics Manufacturing BV, Zwaag, Netherlands). The corrected ESR (cESR) was calculated using patient’s hematocrit.19 An elevated level of hsCRP and cESR was defined as >0.3 mg/dL and >15 mm/h, respectively,19 which was considered laboratory evidence of inflammation. Iron profiles and serum Cr levels were measured using a chemical analyzer (Cobas 8000 C702; Roche Diagnostics, Mannheim, Germany). Anemia was defined as hemoglobin <13.0 g/dL for males and as hemoglobin <12.0 g/dL for females.20
The CrCl was estimated using the Cockcroft-Gault equation.21
The albumin-to-Cr ratio (ACR) was calculated as follows: ACR (μg/mg Cr) = [urine albumin level (μg/mL)/urine Cr level (mg/dL)] × 100.22 Microalbuminuria was defined as an ACR of 30–300 μg/mg Cr.23
Calculation of Corrected LCN2 Values
To minimize the effect of inflammation on LCN2, plasma LCN2 levels were corrected using the inflammation index. Corrected LCN2 (cLCN2) values were calculated using the following equation: cLCN2 = plasma LCN2 level/inflammation index. The inflammation index was obtained from the sum of the scores, which were given to patients based on hsCRP and cESR levels.24 The percent difference between corrected and uncorrected LCN2 levels was computed using the following formula: percent difference = [(uncorrected LCN2 levels – corrected LCN2 levels)/uncorrected LCN2 levels] × 100.25
Statistical Analysis
Data were presented as mean ± standard deviation (SD) or as median (interquartile range: IQR). To analyze the data between the two groups, a Student’s t-test and a Mann–Whitney U-test were used. Categorical variables were expressed as frequencies and percentages. To identify the normality of the data, the Shapiro–Wilk test was used. The χ2 test was used to analyze categorical variables. A multivariate linear regression analysis was performed to evaluate the relationship between LCN2, sTfR, reticulocyte-related parameters, and iron profiles. The association between an elevated LCN2 level and the presence of anemia was assessed by a multivariate logistic regression analysis with adjustment for potential confounders, such as age, sex, body mass index (BMI), systolic blood pressure (SBP), current smoking, and hsCRP. Statistical analyses were performed using the SPSS software package (version 26; IBM SPSS Statistics, Armonk, NY, USA) and MedCalc statistical software (version 20; MedCalc Software Ltd., Ostend, Belgium). A value of p < 0.05 was considered statistically significant.
Results
Clinical and Laboratory Characteristics of Participants
Of the 235 participants, 137 (58.3%) had elevated LCN2 levels, 51 (21.7%) had anemia, and 82 (34.9%) had elevated hsCRP levels. LCN2 and cLCN2 levels of persons with MRD were significantly higher than those of healthy individuals (p < 0.001). The percent difference between LCN2 and cLCN2 was 12.5%, which was significantly higher than that of healthy subjects (p < 0.001) (Table 1).
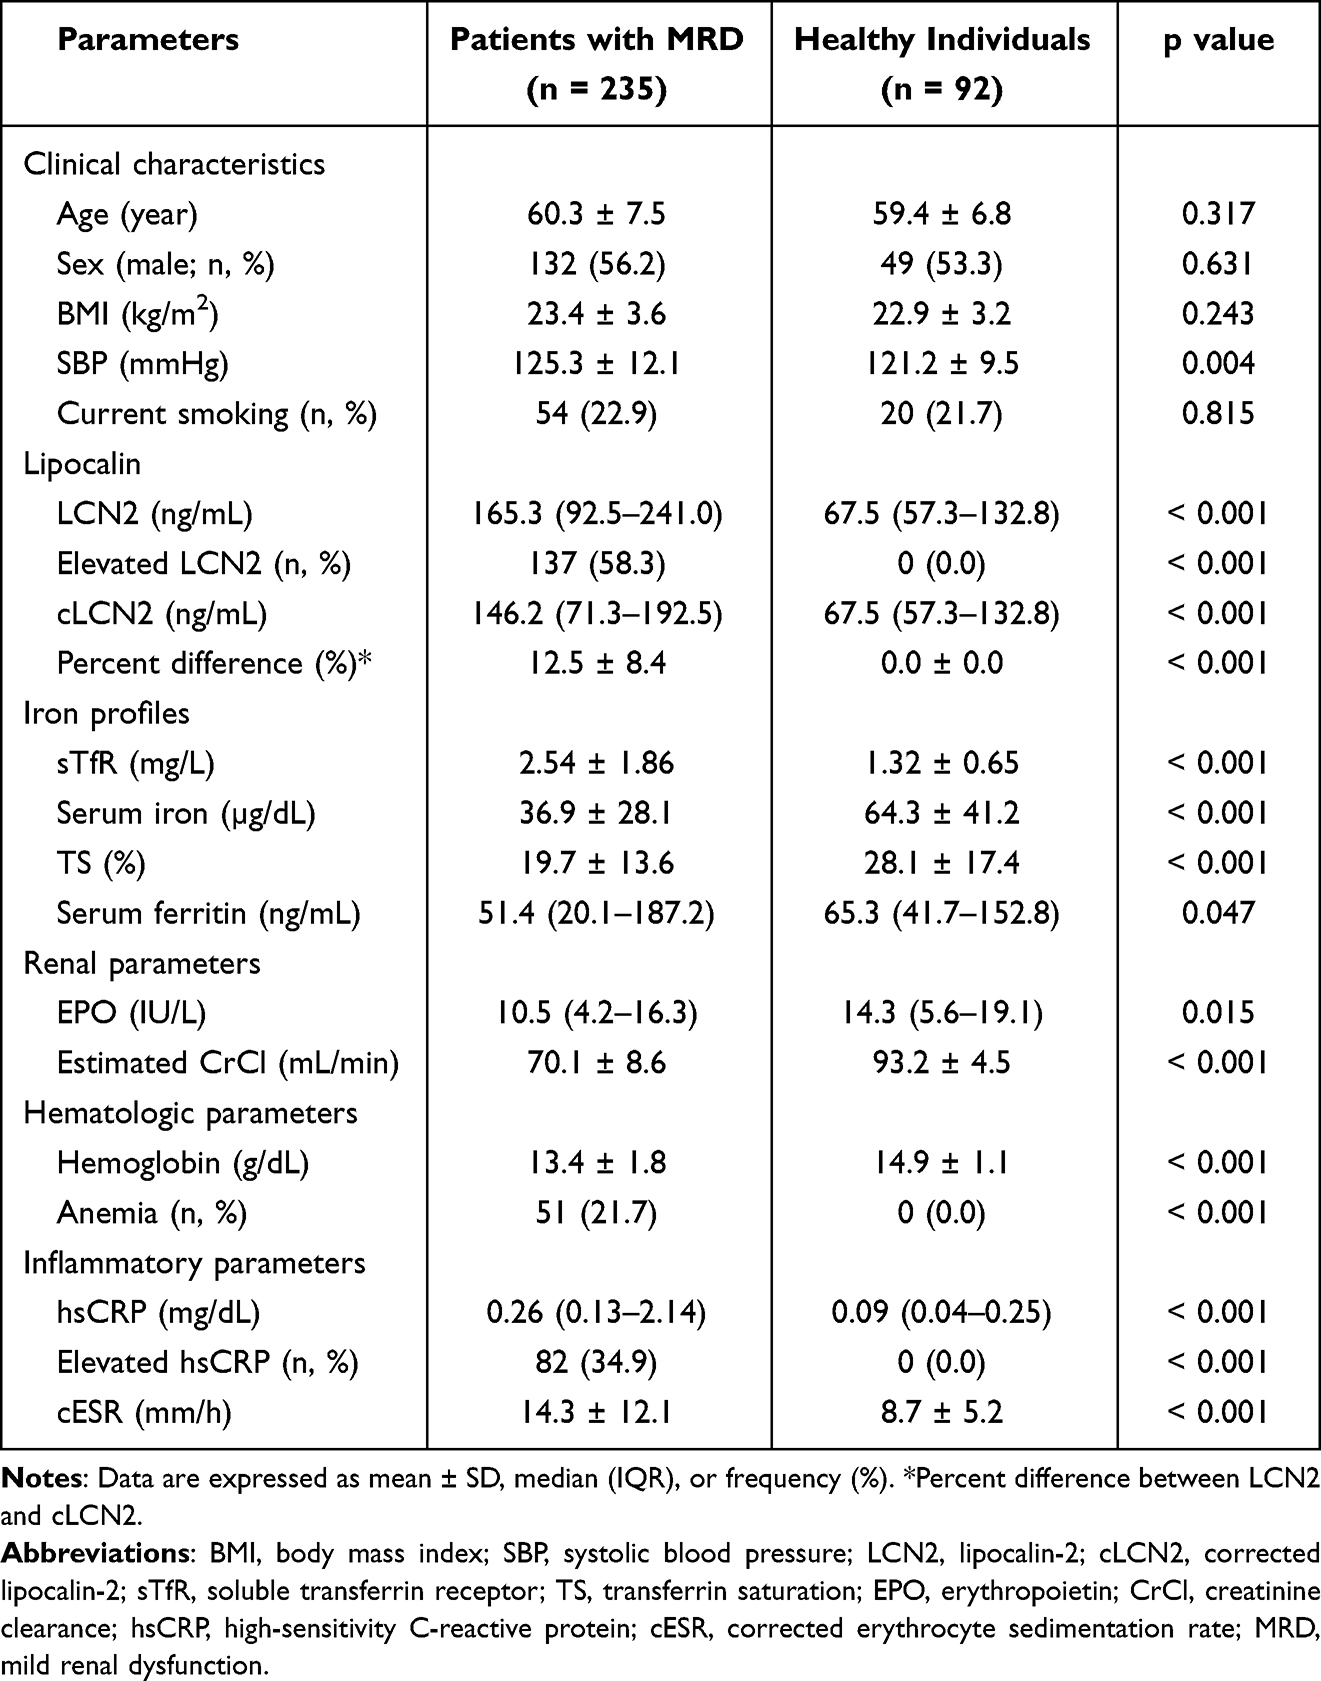 |
Table 1 Clinical and Laboratory Characteristics of Subjects |
RMI, sTfR, Serum Iron, and Hemoglobin Levels According to LCN2 Levels
The mean hemoglobin levels were significantly lower in persons with LCN2 elevation than in those without LCN2 elevation (12.9 ± 1.6 g/dL vs 14.0 ± 1.7 g/dL, p < 0.001) (Figure 1). Anemia was 2.1-fold more prevalent in subjects with LCN2 elevation than those without LCN2 elevation (27.7% vs 13.3%, p = 0.008). Compared to individuals without elevated LCN2 levels, those with elevated LCN2 levels had significantly higher sTfR and a significantly lower RMI (3.04 mg/L and 1.02% vs 2.01 mg/L and 1.28%, respectively, p < 0.001). However, there was no significant difference in anthropometric parameters and current smoking between the two groups (Table 2).
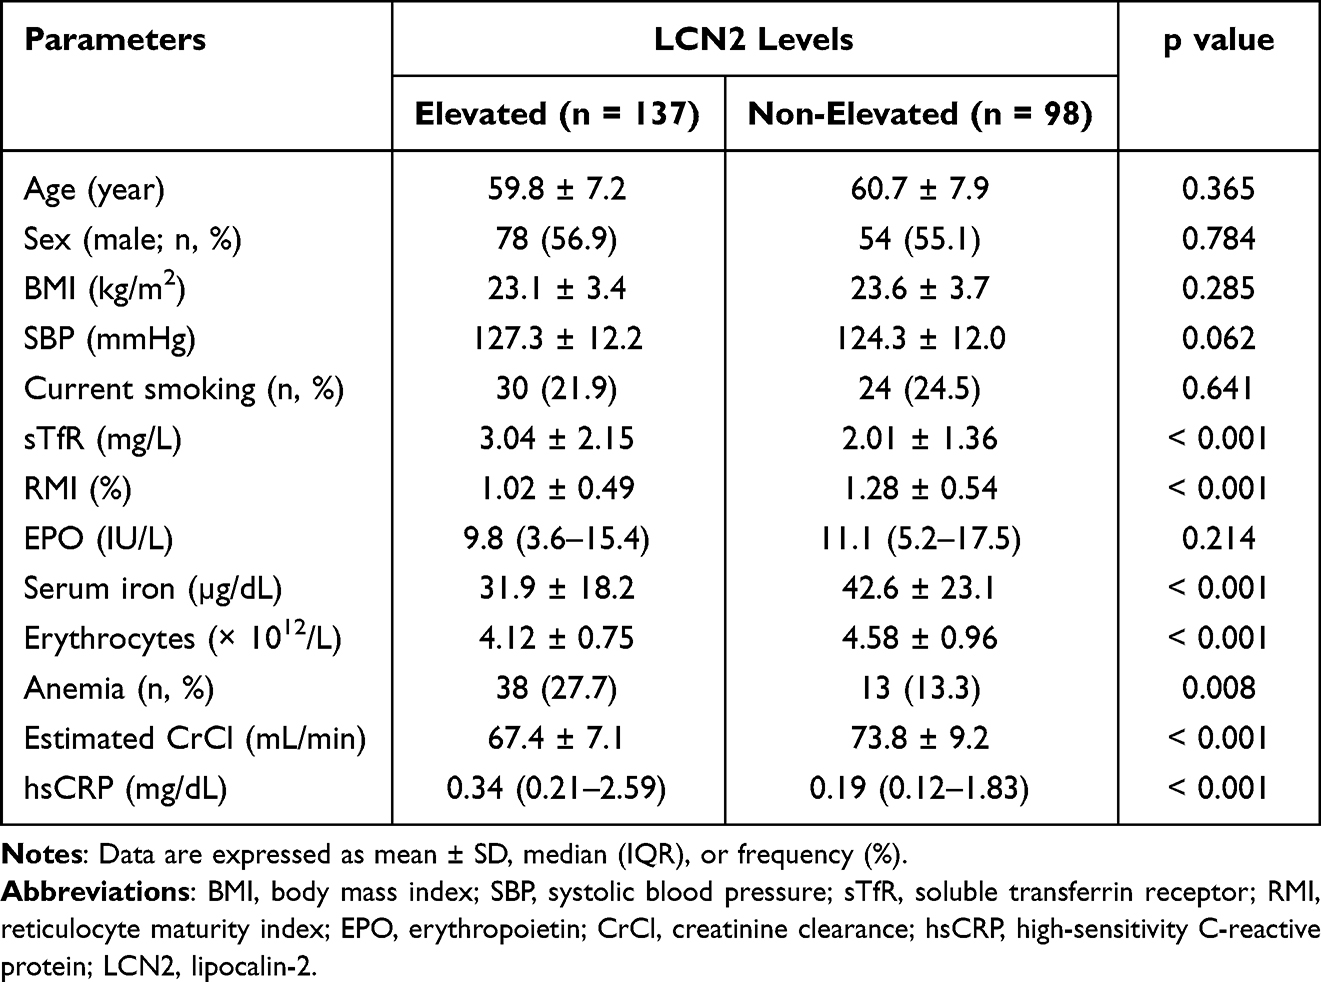 |
Table 2 RMI, sTfR, and Serum Iron Levels and the Prevalence of Anemia According to LCN2 Levels |
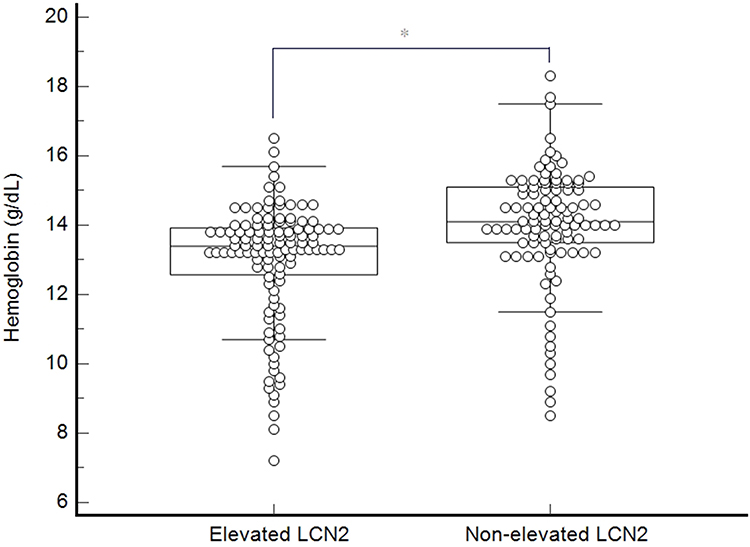 |
Figure 1 Hemoglobin levels according to LCN2 levels in patients with mild renal dysfunction. Hemoglobin levels are significantly lower in patients with elevated LCN2 levels than in those without elevated LCN2 levels (12.9 ± 1.6 g/dL vs 14.0 ± 1.7 g/dL). *p < 0.001. |
LCN2, sTfR, and EPO Levels in Patients with and without Anemia
Patients with anemia had significantly higher LCN2 and cLCN2 levels than those without anemia (195.8 ng/mL and 176.3 ng/mL vs 142.0 ng/mL and 123.2 ng/mL, respectively, p < 0.001). Compared with non-anemic subjects, anemic patients had significantly higher sTfR levels and significantly lower serum iron levels. However, no significant difference was noted in hsCRP and EPO levels between the groups (Table 3).
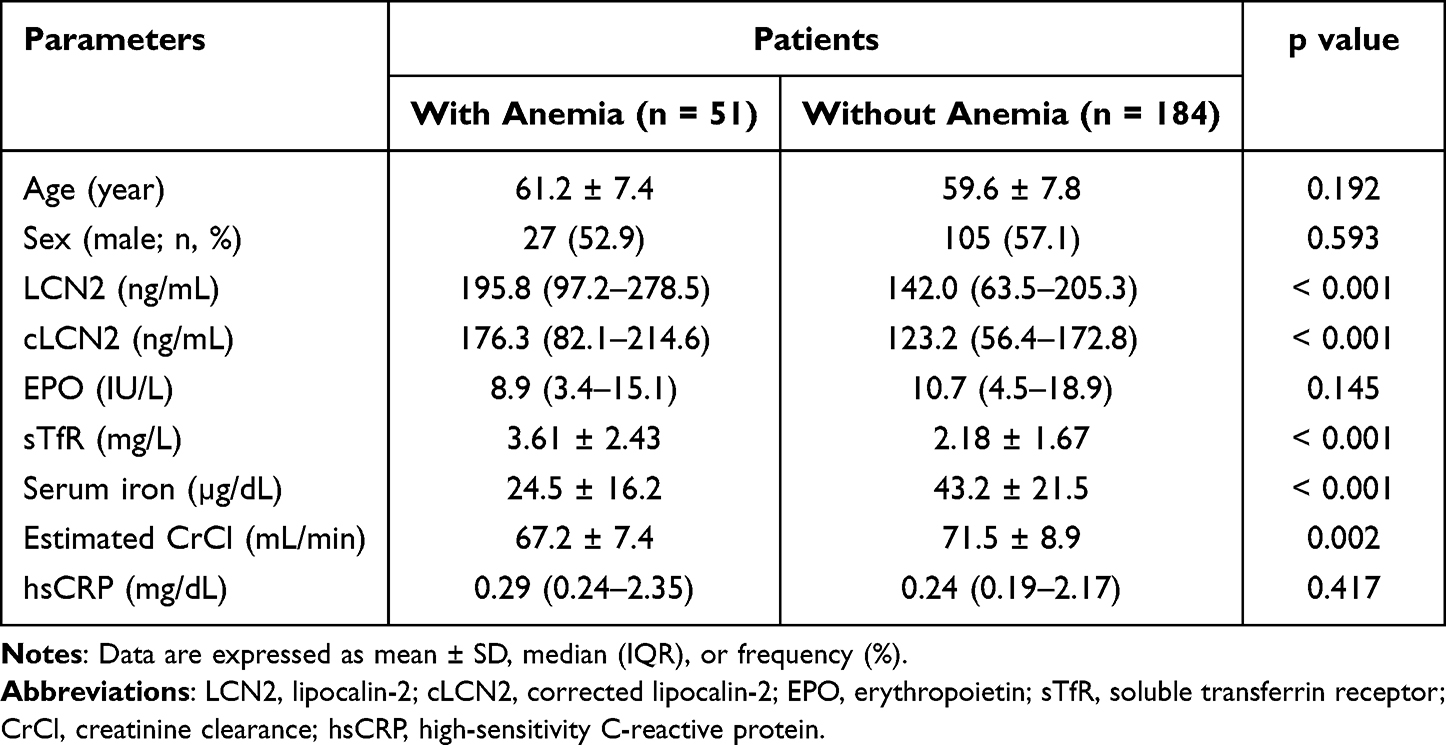 |
Table 3 LCN2, sTfR, and EPO Levels in Patients with and without Anemia |
Relationship Between LCN2, sTfR, RMI, and EPO Levels
After adjusting for potential confounders, LCN2 was positively correlated with sTfR (r = 0.232) and negatively correlated with the RMI (r = −0.229), serum iron (r = −0.201), and hemoglobin (r = −0.245). However, no significant association was noted between LCN2 and EPO (Table 4). A scatter plot of the relationship between LCN2 and hemoglobin levels is shown in Figure 2.
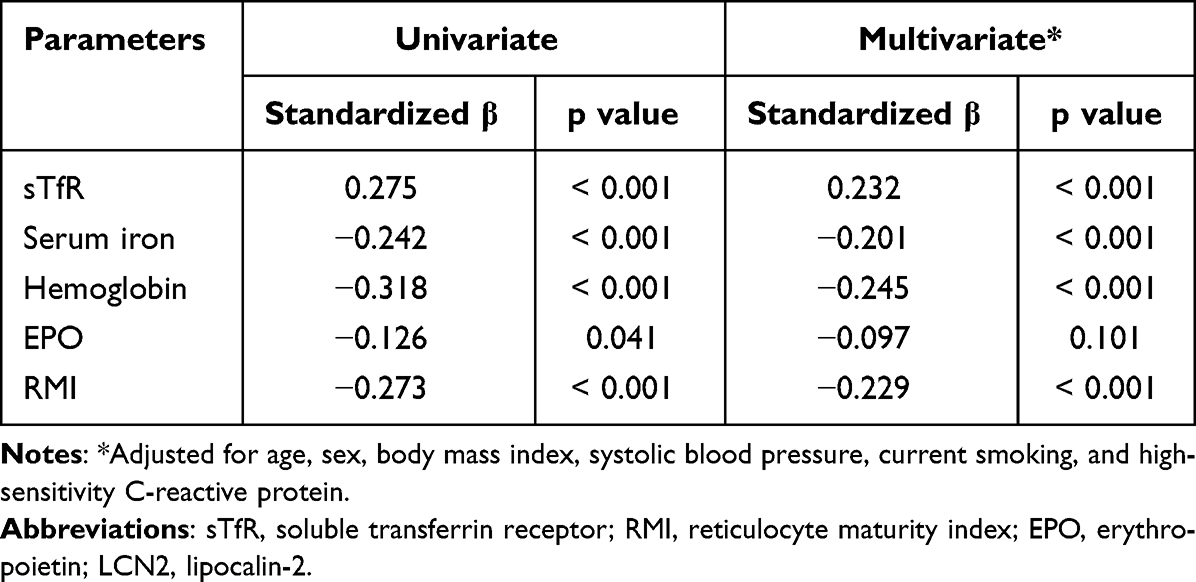 |
Table 4 Relationship Between LCN2 and sTfR, RMI, EPO, Serum Iron, and Hemoglobin Levels |
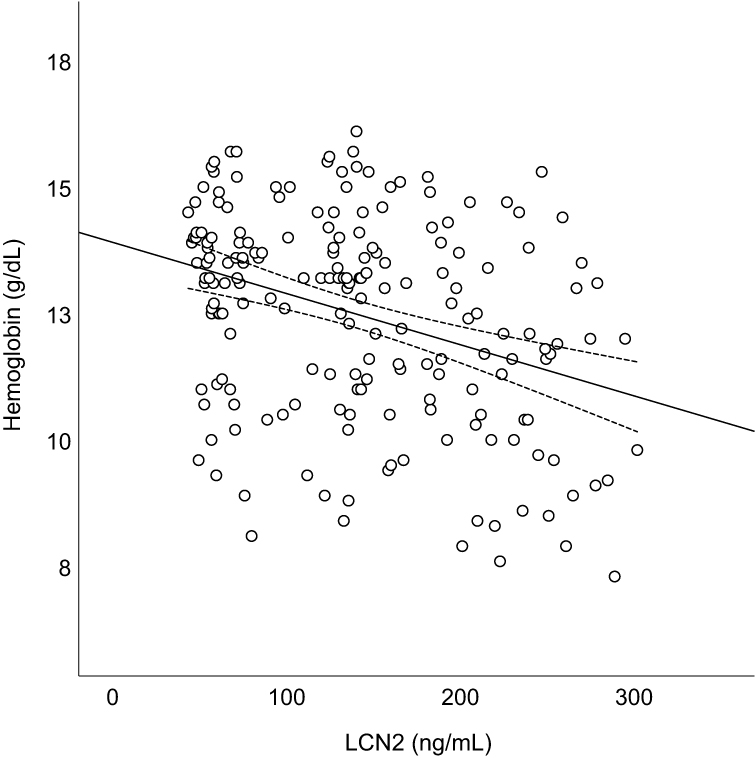 |
Figure 2 Scatter plots of the relationship between LCN2 and hemoglobin levels in patients with mild renal dysfunction. The LCN2 levels are negatively correlated with hemoglobin levels (y = −0.011x + 13.907; r2 = 0.101; p < 0.001). |
Association Between LCN2 Elevation and the Presence of Anemia
The association between LCN2 elevation and the presence of anemia was evaluated using a multivariate logistic regression analysis. An elevated LCN2 level (>150 ng/mL) resulted in a 1.3-fold increase in the prevalence of anemia in patients with MRD (odds ratio: 1.302, 95% CI: 1.012–2.527; p < 0.001) (Table 5).
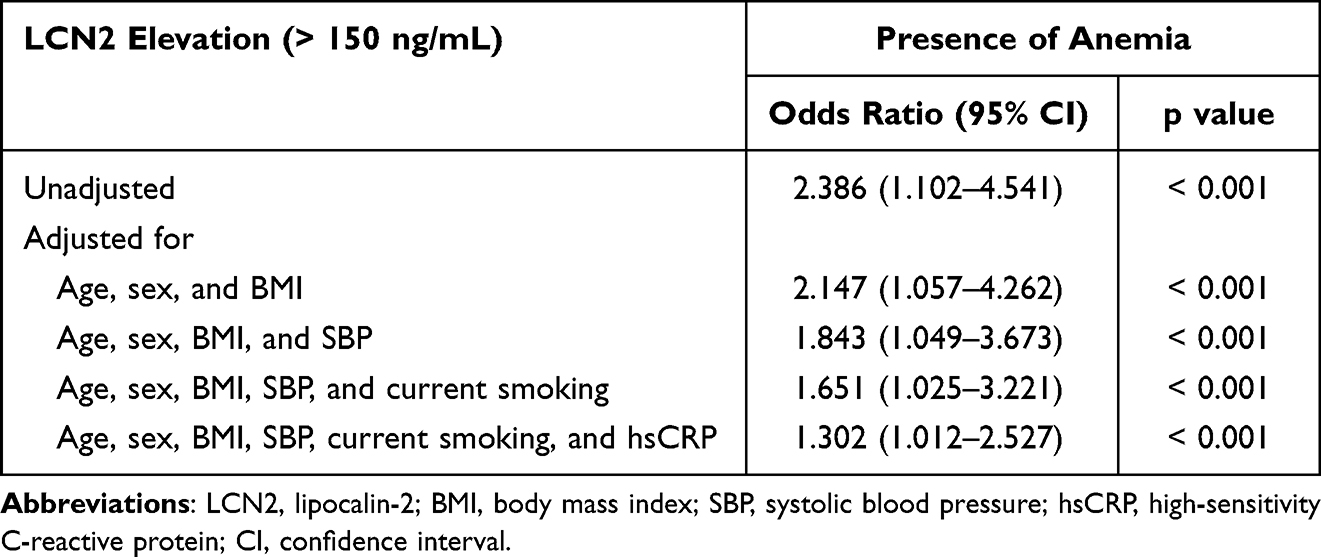 |
Table 5 Association Between LCN2 Elevation and the Presence of Anemia in Subjects with MRD |
Discussion
In the present study, the relationship between LCN2, erythropoiesis, and iron status was examined by measuring sTfR, RMI, and EPO levels in MRD patients. Our results demonstrated that augmented LCN2 levels were closely linked to the prevalence of anemia in patients with MRD. However, there have been conflicting results on the relationship between LCN2 and anemia. For instance, in several studies, plasma LCN2 levels were significantly higher in subjects with anemia than in those without anemia and negatively correlated with hemoglobin levels.26,27 In contrast, in another study, there was no significant difference in LCN2 levels between anemic and non-anemic subjects, and there was no significant association between LCN2 and hemoglobin levels.28 In our study, hemoglobin levels were significantly lower in patients with elevated LCN2 levels than in those without elevated LCN2 levels. Moreover, compared with non-anemic individuals, patients with anemia had significantly higher LCN2 levels. In particular, after correcting with the inflammatory index, cLCN2 values were still higher in anemic patients than in non-anemic subjects. These results suggest that LCN2 elevation may be related to decreased hemoglobin levels in MRD, independent of inflammation. These findings are in accordance with a previous study, which demonstrated that LCN2 levels were negatively correlated with hemoglobin levels in a rat renal anemia model.29 However, our results differ from a study showing no significant association between LCN2 and hemoglobin levels in patients on hemodialysis.30 These inconsistencies may be due to the differences in subject populations, disease severity, and ongoing treatment. In particular, the presence and magnitude of systemic inflammation may induce these discordant results between studies.
LCN2 has been known as a useful biomarker for renal dysfunction; however, it is affected by various inflammatory conditions.31 In fact, LCN2 is intimately engaged in the inflammatory process, acting as an acute phase protein, and its blood levels are elevated in many inflammatory diseases.32 In our study, approximately one-third of the patients with renal dysfunction had elevated hsCRP levels. In such a condition, it is hard to accurately examine the role of LCN2 in kidney function because LCN2 levels may be elevated by underlying inflammation. Therefore, in the present study, to reduce the effect of inflammation on LCN2 levels, cLCN2 values were calculated, and the new parameter was used for assessing subjects. In this study, the percent difference between LCN2 and cLCN2 levels was 12.5%, suggesting that inflammation may be responsible for approximately 12% of LCN2 elevation in our patients.
The RMI is a useful laboratory parameter of erythropoietic activity in anemia, which corresponds to the fraction of young reticulocytes released prematurely.33 A previous study demonstrated that the RMI was the earliest indicator of engraftment following bone marrow transplantation.34 LCN2 plays a role in mediating erythroid lineage cell suppression in bone marrow.35 In the present study, the RMI was measured for assessing erythropoietic activity. The RMI was significantly lower in patients with elevated LCN2 levels than in those without elevated LCN2 levels. After adjusting for confounders, LCN2 was inversely correlated with the RMI. Furthermore, compared to subjects without LCN2 elevation, those with LCN2 elevation displayed more prevalent anemia. These results imply that LCN2 elevation may contribute to the development of anemia by diminishing reticulocyte production. This assumption is supported by the results of a previous study showing that elevated LCN2 levels induced erythropoiesis inhibition and arrested the differentiation of erythroid precursors through an autocrine regulatory pathway.36
EPO is a glycoprotein hormone produced in the kidneys and stimulates the production of erythrocytes. Therefore, it has been used to treat anemic patients with renal diseases.37 However, there have been many different results regarding the association between EPO and kidney function. One study showed no significant difference in EPO and hemoglobin levels between patients with MRD and those with normal kidney function.38 In contrast, Korte et al39 reported that MRD was sufficient to induce inadequate EPO production; thus, EPO should be measured in patients with MRD and unexplained anemia. In our study, EPO levels in patients with MRD were examined according to the presence of anemia. There was no significant difference in EPO levels between patients with and without anemia. However, a multivariate logistic regression analysis revealed that LCN2 elevation led to a 1.3-fold increase in the prevalence of anemia. These findings suggest that LCN2 may play a more crucial role in erythropoiesis than EPO, at least in patients with MRD. These findings are consistent with the results of one study demonstrating that anemia did not occur from reduced EPO in patients with mild to moderate renal insufficiency.40 Additionally, another study showed that LCN2 expression was not induced by EPO but by anemia.41
There have been various results showing the relationship between LCN2 and iron profiles. Yazdani et al42 reported that LCN2 was negatively correlated with iron parameters, such as serum iron, serum ferritin, and transferrin saturation. However, Bolignano et al43 demonstrated that LCN2 was positively correlated with transferrin saturation in hemodialysis patients. Interestingly, in another study, LCN2 levels were not associated with iron metabolism in patients with cardiorenal failure.44 In our study, LCN2 was positively correlated with sTfR and negatively correlated with serum iron levels. Additionally, in the present study, patients with LCN2 elevation had significantly higher sTfR levels than those without LCN2 elevation. Considering that sTfR is a reliable indicator for functional iron deficiency,45 these results indicate that LCN2 may contribute to the development of anemia through iron regulation in patients with MRD.
This study has several limitations. For instance, a bone marrow examination was not performed to assess erythropoiesis. Blood oxygen levels in relation to EPO could also not be measured. As this study was designed through a cross-sectional approach, the evidence for a cause-and-effect relationship between LCN2 and anemia was limited. In this study, we could not use a structured questionnaire to collect data from participants. Despite these limitations, to the best of our knowledge, this is the first study to report a potential role of LCN2 in the presence of anemia in MRD, especially in connection with sTfR and the RMI. Further studies are needed to verify the findings of our study in larger randomized prospective trials.
Conclusions
In conclusion, this study demonstrated that LCN2 levels were significantly elevated in anemic patients, positively correlated with sTfR, and negatively correlated with RMI, serum iron, and hemoglobin levels. These results suggest that LCN2 elevation may play a crucial role in the development of anemia in subjects with mildly decreased kidney function, possibly by restricting iron availability and suppressing reticulocyte production.
Abbreviations
LCN2, lipocalin-2; cLCN2, corrected lipocalin-2; sTfR, soluble transferrin receptor; RMI, reticulocyte maturity index; EPO, erythropoietin; CrCl, creatinine clearance; MRD, mild renal dysfunction.
Data Sharing Statement
All data relevant to the study are included in the article. The data used to support the findings of this study are available from the corresponding author on reasonable request.
Ethics Approval and Consent to Participate
This study protocol was approved by the institutional review board of Inha University Hospital (approval number: 2023-03-006), and written informed consent was obtained from the participants. This study was performed in accordance with the guidelines of the Declaration of Helsinki.
Author Contributions
All authors contributed to the work reported, whether that is in the conception, study design, execution, acquisition of data, analysis and interpretation, or in all these areas. They took part in drafting, revising or critically reviewing the manuscript, and gave final approval of the version to be submitted. Authors agree to take responsibility and be accountable for the contents of the article.
Funding
This study was supported by a research grant from Inha University.
Disclosure
The authors declare that they have no conflicts of interest for this work.
References
1. Leoncini G, Viazzi F, Parodi D, et al. Mild renal dysfunction and subclinical cardiovascular damage in primary hypertension. Hypertension. 2003;42(1):14–18. doi:10.1161/01.HYP.0000075789.58883.73
2. Culleton BF, Larson MG, Wilson PW, Evans JC, Parfrey PS, Levy D. Cardiovascular disease and mortality in a community-based cohort with mild renal insufficiency. Kidney Int. 1999;56(6):2214–2219.
3. Cases A, Coll E. Dyslipidemia and the progression of renal disease in chronic renal failure patients. Kidney Int. 2005;68(Suppl 99):S87–S93.
4. Andrade-Oliveira V, Foresto-Neto O, Watanabe IKM, Zatz R, Câmara NOS. Inflammation in renal diseases: new and old players. Front Pharmacol. 2019;10:1192.
5. Astor BC, Muntner P, Levin A, Eustace JA, Coresh J. Association of kidney function with anemia: the Third National Health and Nutrition Examination Survey (1988-1994). Arch Intern Med. 2002;162(12):1401–1408.
6. Herzog CA, Muster HA, Li S, Collins AJ. Impact of congestive heart failure, chronic kidney disease, and anemia on survival in the Medicare population. J Card Fail. 2004;10(6):467–472.
7. Zhang Y, Wang L, Dey S, et al. Erythropoietin action in stress response, tissue maintenance and metabolism. Int J Mol Sci. 2014;15(6):10296–10333.
8. Chang CC, Kass L. Clinical significance of immature reticulocyte fraction determined by automated reticulocyte counting. Am J Clin Pathol. 1997;108(1):69–73.
9. Jaberi SA, Cohen A, D’Souza C, et al. Lipocalin-2: structure, function, distribution and role in metabolic disorders. Biomed Pharmacother. 2021;142:112002.
10. Devarajan P. Neutrophil gelatinase-associated lipocalin: a promising biomarker for human acute kidney injury. Biomark Med. 2010;4(2):265–280. doi:10.2217/bmm.10.12
11. Lim D, Jeong J-H, Song J, Devarajan P. Lipocalin 2 regulates iron homeostasis, neuroinflammation, and insulin resistance in the brains of patients with dementia: evidence from the current literature. CNS Neurosci Ther. 2021;27(8):883–894. doi:10.1111/cns.13653
12. Miharada K, Hiroyama T, Sudo K, Danjo I, Nagasawa T, Nakamura Y. Lipocalin 2-mediated growth suppression is evident in human erythroid and monocyte/macrophage lineage cells. J Cell Physiol. 2008;215(2):526–537.
13. Gupta S, Uppal B, Pawar B. Is soluble transferrin receptor a good marker of iron deficiency anemia in chronic kidney disease patients? Indian J Nephrol. 2009;19(3):96–100.
14. Chua E, Clague JE, Sharma AK, Horan MA, Lombard M. Serum transferrin receptor assay in iron deficiency anaemia and anaemia of chronic disease in the elderly. QJM. 1999;92(10):587–594.
15. Oustamanolakis P, Koutroubakis IE, Messaritakis I, Niniraki M, Kouroumalis EA. Soluble transferrin receptor-ferritin index in the evaluation of anemia in inflammatory bowel disease: a case-control study. Ann Gastroenterol. 2011;24(2):108–114.
16. Derchi LE, Leoncini G, Parodi D, et al. Mild renal dysfunction and renal vascular resistance in primary hypertension. Am J Hypertens. 2005;18(7):966–971.
17. Choi JW, Lee MH, Fujii T. Relationship between neutrophil gelatinase-associated lipocalin, eosinophil cationic protein, cytokines, and atopic sensitization in patients with allergic diseases. Biomed Res Int. 2022;2022:6564706.
18. Choi JW, Pai SH. Reticulocyte subpopulations and reticulocyte maturity index (RMI) rise as body iron status falls. Am J Hematol. 2001;67(2):130–135.
19. Choi JW, Fujii T. The prevalence of low plasma neutrophil gelatinase-associated lipocalin level in systemic inflammation and its relationship with proinflammatory cytokines, procalcitonin, nutritional status, and leukocyte profiles. Clin Lab. 2019;65(6):1063–1074.
20. Craig KJ, Williams JD, Riley SG, et al. Anemia and diabetes in the absence of nephropathy. Diabetes Care. 2005;28(5):1118–1123.
21. Michels WM, Grootendorst DC, Verduijn M, Elliott EG, Dekker FW, Krediet RT. Performance of the Cockcroft-Gault, MDRD, and new CKD-EPI formulas in relation to GFR, age, and body size. Clin J Am Soc Nephrol. 2010;5(6):1003–1009.
22. Erman A, Rahamimov R, Mashraki T, et al. The urine albumin-to-creatinine ratio: assessment of its performance in the renal transplant recipient population. Clin J Am Soc Nephrol. 2011;6(4):892–897.
23. Kim SS, Song SH, Kim IJ, et al. Clinical implication of urinary tubular markers in the early stage of nephropathy with type 2 diabetic patients. Diabetes Res Clin Pract. 2012;97(2):251–257.
24. Choi JW, Fujii T, Fujii N. Corrected neutrophil gelatinase-associated lipocalin (NGAL) level adjusted by the scoring system of an inflammation index for screening renal dysfunction in patients with systemic inflammation. Ann Clin Lab Sci. 2015;45(3):248–255.
25. Choi JW, Lee MH, Fujii T. Usefulness of the neutrophil gelatinase-associated lipocalin/inflammation index ratio for assessing diabetic nephropathy in patients with type 2 diabetes. Int J Clin Exp Med. 2021;14(9):2315–2324.
26. Lee JH, Yim HE, Yoo KH. Associations of plasma neutrophil gelatinase-associated lipocalin, anemia, and renal scarring in children with febrile urinary tract infections. J Korean Med Sci. 2020;35(10):e65.
27. Shrestha K, Borowski AG, Troughton RW, Klein AL, Tang WH. Association between systemic neutrophil gelatinase-associated lipocalin and anemia, relative hypochromia, and inflammation in chronic systolic heart failure. Congest Heart Fail. 2012;18(5):239–244.
28. Krzemien GJ, Pańczyk-Tomaszewska M, Turczyn A, Demkow U, Kotuła I, Szmigielska A. Serum neutrophil gelatinase-associated lipocalin for predicting anemia of inflammation in children with urinary tract infection. Cent Eur J Immunol. 2021;46(4):456–462.
29. Wu X, Mao Y, Zhang Y, Hong Z, Zhu M. Study the role of neutrophil gelatinase-associated lipocalin on rat renal anemia. Int J Clin Exp Med. 2020;13(3):1720–1727.
30. Patsaoura A, Tatsi E, Margeli A, et al. Plasma neutrophil gelatinase-associated lipocalin levels are markedly increased in patients with non-transfusion-dependent thalassemia: lack of association with markers of erythropoiesis, iron metabolism and renal function. Clin Biochem. 2014;47(12):1060–1064.
31. Lindberg S, Jensen JS, Mogelvang R, et al. Plasma neutrophil gelatinase-associated lipocalinin in the general population: association with inflammation and prognosis. Arterioscler Thromb Vasc Biol. 2014;34(9):2135–2142.
32. Otto GP, Hurtado-Oliveros J, Chung HY, et al. Plasma neutrophil gelatinase-associated lipocalin is primarily related to inflammation during sepsis: a translational approach. PLoS One. 2015;10(4):e0124429.
33. Davis BH, Ornvold K, Bigelow NC. Flow cytometric reticulocyte maturity index: a useful laboratory parameter of erythropoietic activity in anemia. Cytometry. 1995;22(1):35–39.
34. Davis BH, Bigelow N, Ball ED, Mills L, Cornwell GG. Utility of flow cytometric reticulocyte quantification as a predictor of engraftment in autologous bone marrow transplantation. Am J Hematol. 1989;32(2):81–87.
35. Bolignano D, Coppolino G, Donato V, Lacquaniti A, Bono C, Buemi M. Neutrophil gelatinase-associated lipocalin (NGAL): a new piece of the anemia puzzle? Med Sci Monit. 2010;16(6):RA131–RA135.
36. Miharada K, Hiroyama T, Sudo K, Nagasawa T, Nakamura Y. Lipocalin 2 functions as a negative regulator of red blood cell production in an autocrine fashion. FASEB J. 2005;19(13):1881–1883.
37. Elliott S, Pham E, Macdougall IC. Erythropoietin: a common mechanism of action. Exp Hematol. 2008;36(12):1573–1584.
38. Fehr T, Ammann P, Garzoni D, et al. Interpretation of erythropoietin levels in patients with various degrees of renal insufficiency and anemia. Kidney Int. 2004;66(3):1206–1211.
39. Korte W, Cogliatti SB, Jung K, Riesen W. Mild renal dysfunction is sufficient to induce erythropoietin deficiency in patients with unexplained anemia. Clin Chim Acta. 2000;292(1–2):149–154.
40. Ble A, Fink JC, Woodman RC, et al. Renal function, erythropoietin, and anemia of older persons: the InCHIANTI study. Arch Intern Med. 2005;165(19):2222–2227.
41. Jiang W, Constante M, Santos MM. Anemia upregulates lipocalin 2 in the liver and serum. Blood Cells Mol Dis. 2008;41(2):169–174.
42. Yazdani M, Merrikhi A, Beni ZN, Baradaran A, Soleimani N, Musazade H. Association between neutrophil gelatinase-associated lipocalin and iron deficiency anemia in children on chronic dialysis. J Res Med Sci. 2014;19(7):624–628.
43. Bolignano D, Coppolino G, Romeo A, et al. Neutrophil gelatinase-associated lipocalin (NGAL) reflects iron status in hemodialysis patients. Nephrol Dial Transplant. 2009;24(11):3398–3403.
44. Emans ME, Braam B, Diepenbroek A, et al. Neutrophil gelatinase-associated lipocalin (NGAL) in chronic cardiorenal failure is correlated with endogenous erythropoietin levels and decreases in response to low-dose erythropoietin treatment. Kidney Blood Press Res. 2012;36(1):344–354.
45. Braga F, Infusino I, Dolci A, Panteghini M. Soluble transferrin receptor in complicated anemia. Clin Chim Acta. 2014;431:143–147.
 © 2023 The Author(s). This work is published and licensed by Dove Medical Press Limited. The full terms of this license are available at https://www.dovepress.com/terms.php and incorporate the Creative Commons Attribution - Non Commercial (unported, v3.0) License.
By accessing the work you hereby accept the Terms. Non-commercial uses of the work are permitted without any further permission from Dove Medical Press Limited, provided the work is properly attributed. For permission for commercial use of this work, please see paragraphs 4.2 and 5 of our Terms.
© 2023 The Author(s). This work is published and licensed by Dove Medical Press Limited. The full terms of this license are available at https://www.dovepress.com/terms.php and incorporate the Creative Commons Attribution - Non Commercial (unported, v3.0) License.
By accessing the work you hereby accept the Terms. Non-commercial uses of the work are permitted without any further permission from Dove Medical Press Limited, provided the work is properly attributed. For permission for commercial use of this work, please see paragraphs 4.2 and 5 of our Terms.