Back to Journals » Journal of Inflammation Research » Volume 15
Lipidomics Changes in a Murine Model of Neuropsychiatric Lupus
Authors Wang Y ![]() , Ren Y
, Ren Y ![]() , Hong T
, Hong T ![]() , Lu D
, Lu D ![]() , Zhang F
, Zhang F ![]() , Cao Y, Wang X
, Cao Y, Wang X ![]()
Received 4 October 2022
Accepted for publication 18 November 2022
Published 5 December 2022 Volume 2022:15 Pages 6569—6580
DOI https://doi.org/10.2147/JIR.S391595
Checked for plagiarism Yes
Review by Single anonymous peer review
Peer reviewer comments 2
Editor who approved publication: Professor Ning Quan
Yihan Wang,1,* Yating Ren,1,* Tao Hong,1 Dingqi Lu,2 Fan Zhang,2 Yi Cao,3 Xinchang Wang4
1Second Clinical Medical College, Zhejiang Chinese Medical University, Hangzhou, People’s Republic of China; 2First Clinical Medical College, Zhejiang Chinese Medical University, Hangzhou, People’s Republic of China; 3Department of Dermatology, The First Affiliated Hospital of Zhejiang Chinese Medical University, Hangzhou, People’s Republic of China; 4Department of Rheumatology, The Second Affiliated Hospital, Zhejiang Chinese Medical University, Hangzhou, People’s Republic of China
*These authors contributed equally to this work
Correspondence: Xinchang Wang, Department of Rheumatology, The Second Affiliated Hospital, Zhejiang Chinese Medical University, Hangzhou, Zhejiang Province, People’s Republic of China, Tel +86 0571-85288249, Email [email protected]
Purpose: Neuropsychiatric lupus (NPSLE) is one of the important manifestations of systemic lupus erythematosus. Previous studies mainly focused on the disruption of the blood-brain barrier and the production of brain-reactive autoantibodies, However, there is no comprehensive lipidomic analysis in NPSLE. Therefore, this research evaluated the lipidomic analysis in the hippocampus and liver of NPSLE mice with mood disorders, to explore the influence of the liver-brain axis on this disease.
Methods: MRL/lpr mice and MRL/mpj mice were respectively used as NPSLE and control groups. Behavioral tests and systemic disease characteristics of mice were assessed at the age of 18 weeks. Ultra-Performance Liquid Chromatography-Tandem Mass Spectrometry (UPLC-MS/MS) was used for lipid metabolite determination. Multivariate statistical analysis was used to identify lipid metabolites that were differentially expressed in two groups.
Results: Our results showed that 355 and 405 lipid metabolites were differentially expressed between the NPSLE and control groups in the hippocampus and liver. According to the pathway enrichment analysis, several pathways were affected, and the glycerophospholipid metabolism pathway was most relevant to the mouse’s depressive behavior.
Conclusion: Based on UPLC-MS/MS, the results provide evidence for how the liver-brain axis affects NPSLE and improve the understanding of NPSLE pathogenesis.
Keywords: neuropsychiatric systemic lupus erythematosus, liver-brain axis, hippocampus, depressive behavior
Introduction
Neurologic and psychiatric (NP) symptoms are important manifestations of systemic lupus erythematosus (SLE), called neuropsychiatric lupus (NPSLE), occurring in up to 37–95% of patients.1 Mood disorders, one of the most important NPSLE symptoms, have an incidence of about 68% and significantly affect the patient’s quality of life.2,3 But the attribution of neuropsychiatric abnormalities to a pathological mechanism associated with SLE is hampered by the confounding influences of many factors.4 It is crucial to find the specific mechanism of the mood disorder caused by NPSLE.
In SLE, there are Several metabolomics studies shedding light on the visible alterations in the lipid profile of the circulation and diseased organs, and investigating the metabolites in SLE samples and healthy human samples.5–7 As the main involved organ, lipid metabolism of the brain in NPSLE has not been studied. The brain is the second most lipid-rich organ, and lipids provide important structural and material support for normal physiological functions of the brain as well as for signaling.8 Numerous studies on lipidomics and neurological disorders have confirmed that lipid metabolism played an important role in brain lesions and mood disorders.9,10 And peripheral metabolism changes can significantly affect the function of the brain.9 Because of the important role of lipid metabolism in SLE and mood disorders, we considered the study of lipid metabolism in NPSLE mice.
Liver is the main organ of lipid metabolism. Any alteration in lipid metabolism of the liver will affect systemic lipid metabolism and even brain lipid metabolism. This process affects the physiological function of the brain and the progression of neurological disorders, and is one of the material bases of the concept of “liver-brain axis”. Closely related to emotion and cognition, lipid metabolism is related to mood disorders more evidently in the hippocampus than in other brain structures.11 In NPSLE, the hippocampus shows altered glucose metabolic activity,4 but alterations in lipid metabolism have not been studied. Because human brain tissue is difficult to obtain, we chose the mouse model for our study. MRL/lpr mice are a classical mouse strain used for NPSLE studies and can spontaneously show standard diagnostic signs of lupus as well as classical NP manifestations such as depression-like behavior.12,13 Therefore, we considered lipidomic studies of hippocampal and liver tissues of MRL/lpr mice by Ultra Performance Liquid Chromatography-Tandem Mass Spectrometry (UPLC-MS/MS) and assessed the onset of NPSLE by splenomegaly, serological indices, the open field test (OFT), and the forced swimming experiments to investigate the possible mechanisms by which lipid metabolism affects the onset of NPSLE mood disorders through the liver-brain axis.
Methods
Animals
MRL/lpr females of the same age were used as the SLE mouse model (n=6), and MRL/mpj females were used as the control group (n=6). Mice were purchased and housed at the Animal Experiment Center of Zhejiang University of Traditional Chinese Medicine (Hangzhou, China) and housed at a temperature of 21–23°C for 12:12 hours in a circadian cycle. Animal ethics were approved by the Animal Experimentation Center of Zhejiang University of Traditional Chinese Medicine (ethical number: IACUC-20211108-12). All our animal experiments were carried out in accordance with the relevant ethical guidelines (Guidelines for Ethical Review of laboratory Animal Welfare No. GB/T 35892-2018).
Behavioral Experiments
Forced swimming and open field experiments were performed on mice at the age of 18 weeks.14 All experiments were performed between 9:00 and 17:00 in a soundproof and airy laboratory with adequate lighting. Each behavioral experiment was performed at least 24 h apart. Mice were tested in random order.
To perform the forced swimming experiment, mice were placed in a clear glass cylinder (40 cm diameter) containing 30 cm deep water(24±1°C). After 2 min of acclimatization, the duration of immobility in the 4 min test was recorded by an automated motor activity recording tracker (SMART 3.0, Panlab, Barcelona, Spain). The time spent floating in the water was defined as immobility time.
The OFT apparatus (50×50cm2 and 40cm in height) was evenly divided into 16 squares.15 Mice were placed in the experimental field half an hour in advance to adapt to the environment, and a 1 min adaptation period was set at the beginning of the test. The total distance and the central exploration time of the mice within 5 min were recorded using SMART 3.0 and the percentage of central time was calculated. Before and after each test, the OFT equipment was cleaned with 75% ethanol.
Sample Preparation
Blood samples were obtained after enucleating the eyeball: the mouse was fixed with one eyeball protruding, the eyeball was pinched out with forceps, and the blood was dripped into the centrifuge tube. And then the mice were put to death, and the hippocampus and liver were removed and frozen in liquid nitrogen. After leaving at room temperature for 2 hours, the mouse blood was centrifuged at 3000 rpm for 10 min to extract the serum. Then the spleens of mice were removed and weighed. The spleen index was used to assess the degree of splenomegaly. (Spleen index = spleen weight (mg)/body weight (g) ×10), All samples were stored at −80°C.
Quantification of Serum dsDNA
The serum was diluted at 1:20 and added dropwise to a 96-well coated plate, and anti-dsDNA levels were measured using an anti-dsDNA ELISA kit (Cusabio, Wu Han, China).
Hippocampal and Liver Tissue Pretreatment
After grinding 20 mg of sample steel beads, the sample was centrifuged to the bottom of the tube. 1 mL of a mixture of methyl tert-butyl ether and methanol (V/V = 3:1) was added to the tube for liquid phase extraction together with the internal standard mixture, after which they were vortexed, centrifuged, and dried. 200 μL of mobile phase (acetonitrile: isopropanol = 10/90, V/V) was added into the tube, vortexed, and centrifuged. And then the supernatant was analyzed by LC/MS.
Data Collection and Quantification of Lipidomics
UPLC-MS/MS was performed using a C30 column (Thermo Accucore, USA) and an ExionLC AD UPLC-QTRAP mass spectrometer (SCIEX, USA). Mobile phase A was a mixture of acetonitrile and water containing 0.1% formic acid and 10 mmol/L ammonium formate. The mobile phase B was a mixture of acetonitrile and isopropanol containing equal concentrations of formic acid and ammonium formate. Eluentgradient: 0 min (80:20, V/V), 2 min (70:30, V/V), 4 min(40:60, V/V),9 min (15:85, V/V), 14 min (10:90, V/V), 15.5 min (5:95, V/V), 17.3 min (5:95, V/V), 17.5 min (80:20, V/V), 20 min (80:20, V/V). The flow rate is 0.35 mL/min. The column temperature is 45°C. The injection volume is 2μL. The lipid quantification was performed using multiple reaction monitoring (MRM) mode. In MRM mode, the precursor ions of the target substance are firstly screened, and then filtered to select the desired characteristic fragment ions, and the peak area of the collected mass spectrometry peaks is integrated and corrected for the mass spectrometry peaks of the same lipid in different samples.16
Statistical Analysis
PCA analysis and PLS-DA analysis for relative quantification of lipids were performed using SIMCA software to determine the lipid profile of each group. Pearson and Spearman correlation analysis was performed to detect the correlation between behavioral variables and differentially expressed lipids in mice between the two groups. Differences in variables between the two groups were evaluated using the Student’s t-test or Mann–Whitney U-test. The SPSS 26.0 and GraphPad prism8 software were used for statistical analysis, and data were visualized using an online tool (https://cloud.metware.cn/), and data were displayed as Mean±SD to show bar values, n=6 for each group. p< 0.05 was considered to be statistically different.
Results
MRL/lpr Mice Showed a Distinct Lupus Phenotype and Depression-Like Phenotype
We assessed the extent of systemic disease in mice with lupus by the spleen index and serum anti-dsDNA. At the age of 18 weeks, the spleen index was significantly higher in NPSLE mice (97.77±10.35) than in MRL/mpj mice (40.05±5.27) (p<0.001) (Figure 1A). Serum anti-dsDNA levels were also significantly higher in MRL/lpr mice (96.36±30.60 mg/mL) than in MRL/mpj mice (3.22± 0.26 mg/mL) (p<0.001) (Figure 1B). When performing behavioral tests, we found that the percentage of immobility time was longer in MRL/lpr mice (54.26±17.86%) than in MRL/mpj mice (33.94±11.72%) in the forced swimming experiment (p=0.042) (Figure 1C). The total active length in OFT was significantly lower in MRL/lpr mice (1552.85±657.70 cm) compared with MRL/mpj mice (2620.68±876.62 cm) (p=0.041) (Figure 1D). In OFT, the proportion of the time spent in the center of the square did not differ between MRL/lpr mice (29.85±40.16%) and MRL/mpj mice (1.08±1.90%) (p=0.132) (Figure 1E). Similarly, the percentage of the distance in the center did not differ between MRL/lpr mice (7.89±17.07%) and MRL/mpj (0.08±0.08%) mice (p=0.132) (Figure 1F). The percentage of immobility time and the total active length can evaluate the depression-like behavior of mice, while the percentage of the distance and time in the center can reflect the anxiety-like behavior. These results suggest that at the age of 18 weeks, MRL/lpr mice showed significant depression-like behaviors without anxiety-like behaviors.
 |
Figure 1 Systemic and behavioral assessment of mice. Spleen weight index (A), Serum anti-dsDNA antibody level (B), The percentage of immobility duration in forced swimming experiment (C), Total distance of mice in the OFT (D), The percentage of mice spend in the central region (E), The percentage of the length of movement of mice in the central region (F). Notes: Data are expressed as mean ± SEM (n=6). *p<0.05, ***p<0.001 vs control group. |
Analysis of Hippocampal Lipidomic Results
1836 lipid components were detected in the hippocampal tissues (Supplementary Table 1), and Principal Component Analysis (PCA) scatter plot indicated a notable difference in hippocampal tissues between MRL/lpr and MRL/mpj groups (R2X=0.478, Q2=0.183) (Figure 2A). The two groups showed an obvious separation on the X-axis in the Partial Least Squares Discrimination Analysis (PLS-DA) model (R2X=0.544, R2Y=1, Q2=0.183) (Figure 2B). The permutation test results (Figure 2C) showed the accuracy of the PLS-DA model (R2=0.996, Q2=0.713). 355 differentially expressed lipids were screened according to the conditions P<0.05 and VIP>1 (Supplementary Table 2). The pie chart (Figure 2D) shows the approximate proportion of differential lipids in different categories in mice, and the heat map (Figure 2E) shows the clustering of different categories of lipids in two groups.
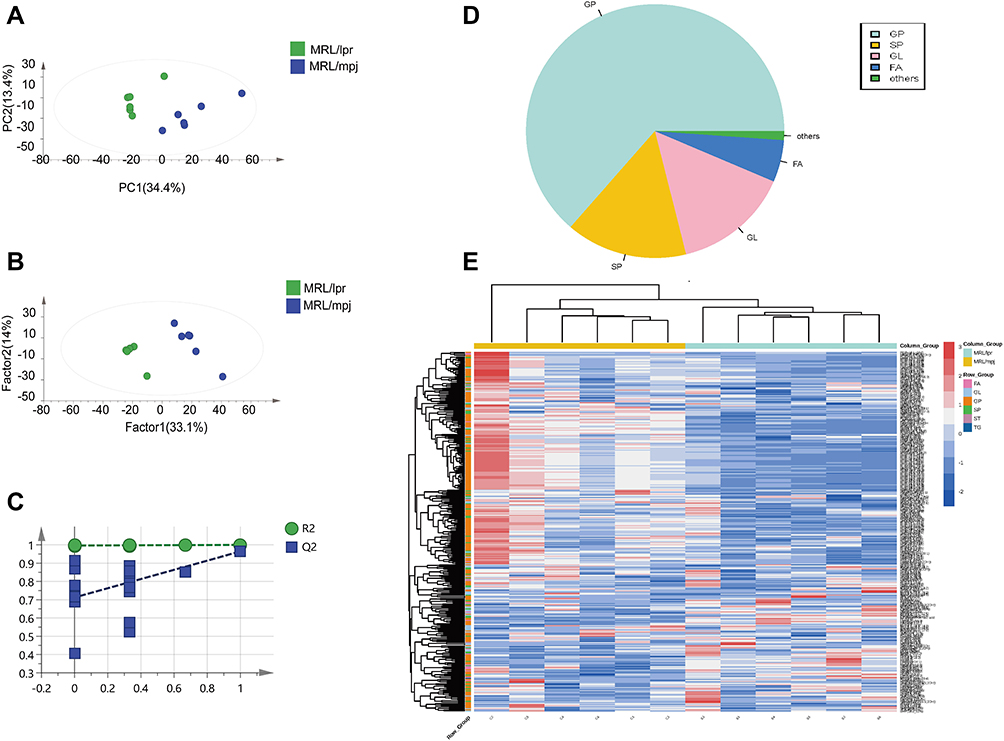 |
Figure 2 Analysis of hippocampal tissue lipidomic results. PCA analysis (A), PLS-DA analysis (B), permutation test plot (C), Pie chart of differential lipids (D), Clustering heat map analysis of differential lipids (E). |
Analysis of Lipidomic Results of Liver
1836 lipid components were detected in liver tissues (Supplementary Table 1), and PCA (R2X=0.619, Q2=0.164) scatter plot indicated a notable difference in hippocampal tissues between MRL/lpr and MRL/mpj groups (Figure 3A). The two groups showed obvious separation on the X-axis in the PLS-DA model (R2X=0.682, R2Y=0.997, Q2=0.967) (Figure 3B). The permutation test (Figure 3C) showed the accuracy of the PLS-DA model (R2=0.946, Q2=0.504). 405 differentially expressed lipids were screened according to the conditions P<0.05 and VIP>1(Supplementary Table 3). and the pie chart (Figure 3D) demonstrates the approximate proportion of differential lipids in different categories. The heat map (Figure 3E) shows the clustering of different lipids categories in two groups.
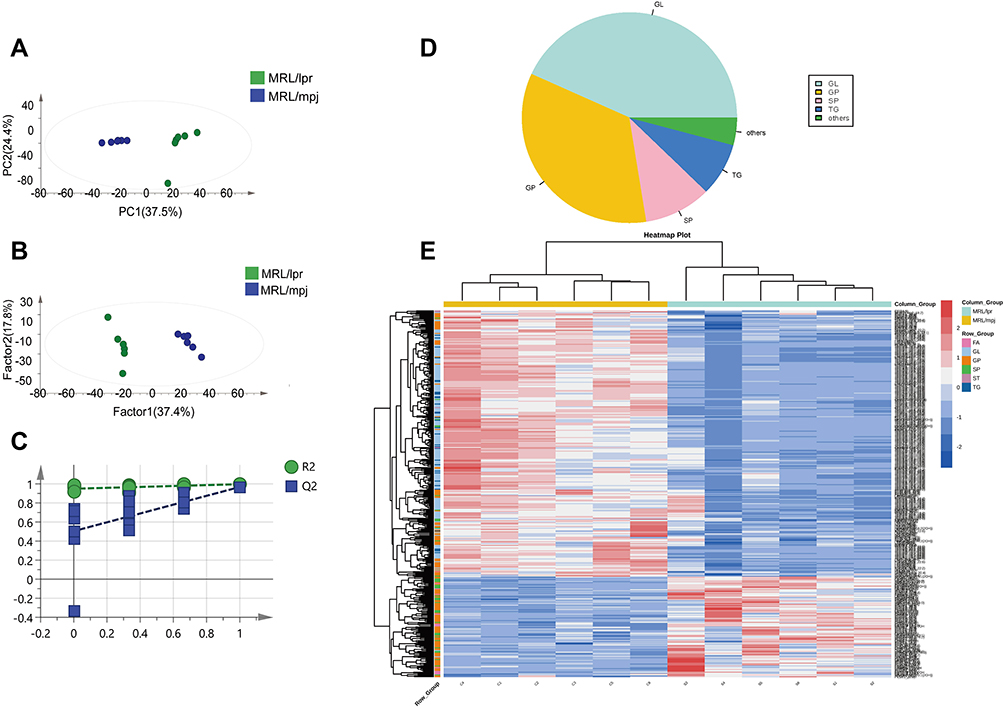 |
Figure 3 Analysis of liver tissue lipidomic results. PCA analysis (A), PLS-DA analysis (B), permutation test plot (C), Pie chart of differential lipids (D), clustering heat map analysis of differential lipids (E). |
Enrichment of Pathways in Two Tissues of Mice
To explore the altered lipid metabolic pathways in the hippocampus and liver of NPSLE mice, data were imported into MetaboAnalyst (http://www.metaboanalyst.ca) for metabolic pathway enrichment analysis and mapped to pathways in the Kyoto Encyclopedia of Genes and Genomes (KEGG) database (http://www.kegg.jp). Metabolic pathways are considered significantly different if and only if Pathway Impact>0.1 and p< 0.05. Under this definition, in hippocampal tissue (Figure 4A), Glycerophospholipid metabolism (p=3.69E-06, Impact=0.34614), Sphingolipid metabolism (p=0.00011741, Impact=0.21875), and Glycerolipid metabolism (p=0.001006, Impact=0.31818) pathways were significantly different between the two groups. In liver tissue (Figure 4B), Linoleic acid metabolism (p=5.03E-05, Impact=0.25), Arachidonic acid metabolism (p=2.50E-05, Impact=0.41667), and Glycerophospholipid metabolism (p=2.50E-05, Impact=0.34614), Glycerolipid metabolism (p=0.002466, Impact=0.31818), Sphingolipid metabolism (p=0.005515, Impact=0.125) pathways were significantly different between the two groups. We found that compared with MRL/mpj group, MRL/lpr group showed enrichment in Glycerophospholipid metabolism, Sphingolipid metabolism, and Glycerolipid metabolism pathway, in both liver and hippocampal tissues, where Glycerophospholipid metabolism pathway had a high pathway impact value in both tissues. We further analyzed the intersection of differentially lipid metabolites, and the Venn diagram (Figure 4C) showed that 56 lipids were differentially expressed in the two tissues together. We further categorized the metabolites in the common pathway of differential lipid enrichment in the two tissues (Figure 5) and found that these lipids highly overlapped with each other, and that might be the material basis of liver metabolism affecting hippocampal function.
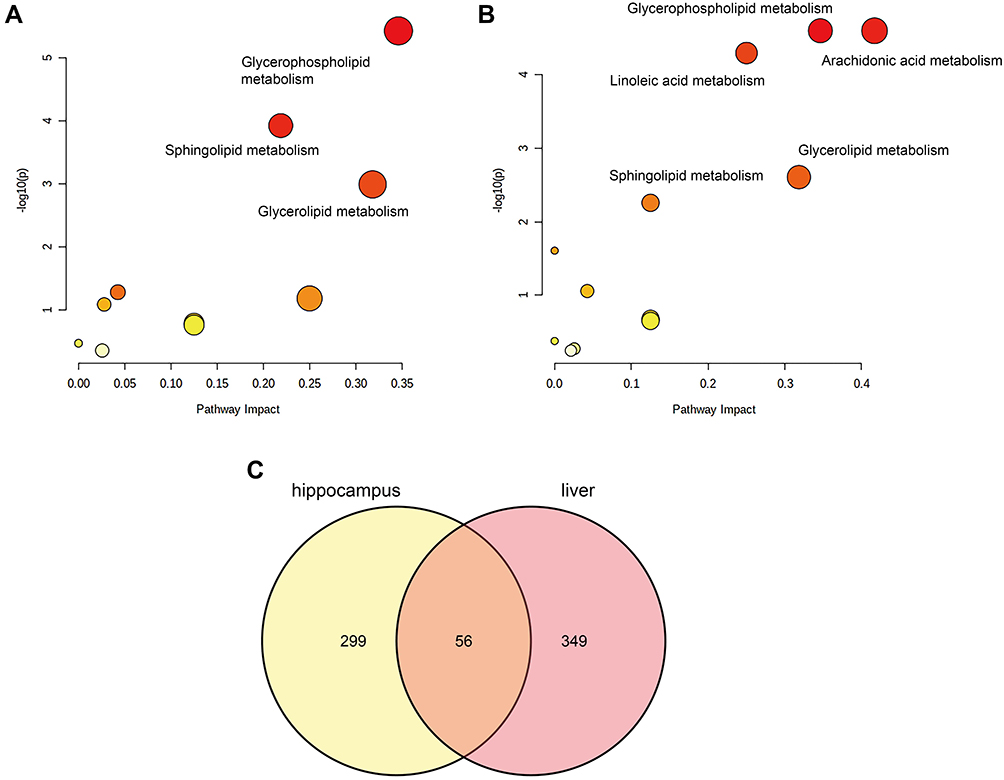 |
Figure 4 Pathway enrichment results. Hippocampal significantly enriched pathways (A), Liver significantly enriched pathways (B), Venn diagram of differential lipids in two tissues (C). |
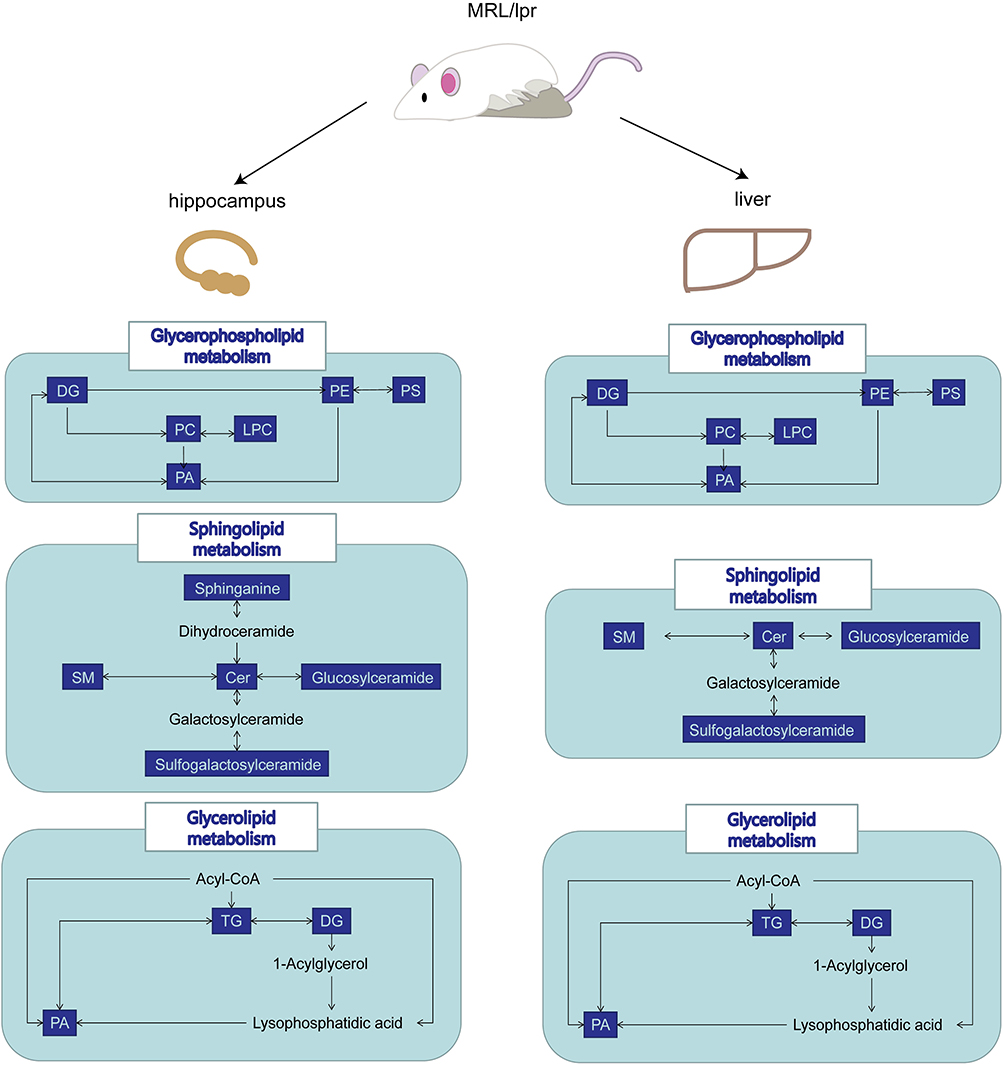 |
Figure 5 The map of Pathways significantly enriched in both tissues. Metabolites altered in the pathway are in blue. |
Correlation Between Common Differential Lipids and Behavioral Outcomes in Mice
Screening 56 filtered lipid metabolites from the two tissues (both up-regulated or both down-regulated in the MRL/lpr group), we selected 25 differential metabolites (Table 1) and found that most of these lipids were in the glycerophospholipid pathway and all showed a decrease (FC<1). To further assess the role of these lipid metabolites in NPSLE, we performed a correlation analysis of these 25 lipids with behavioral phenotypic indices in mice (Supplemental Table 4) and visualized them with heatmaps (Figure 6). The results clearly showed that two LPCs (LPC(0:0/18:1), LPC(20:1/0:0)), three PEs (PE (P-20:1_22:6), PE (O-20:2_22:6), PE (O-20:0_18:1)), two DGs (DG(16:0_20:1), DG(18:0_20:4)) and one TG (TG(16:0_14:1_18:2)) had a significantly negative correlation with total distance in the hippocampus. One TG (TG(16:1_18:2_18:3)) had a significantly negative correlation with immobility time. Most of these metabolism products belonged to the glycerophospholipid pathway. In the liver, two PEs (PE (P-20:1_22:6), PE (O-20:2_22:6)), one PS (PS(18:0_20:0)), one LPC (LPC(20:0/0:0)), one DG (DG(18:0_20:3)), and eight TGs (TG(16:0_16:1_22:6), TG(16:0_18:2_18:3), TG(16:1_18:2_18:3), TG(16:0_18:2_20:5), TG(17:0_18:1_18:1), TG(16:0_14:1_18:2), TG(16:0_18:0_20:1), TG(16:1_16:1_18:1)) had a significantly positive correlation with immobility time in mice, and one PE (PE (O-20:0_22:4)) had a significantly negative correlation with total distance, with six lipids belonging to the glycerophospholipid pathway. These results suggest that the depression-like manifestations of NPSLE may be related to altered glycerophospholipid metabolism in the liver-brain axis.
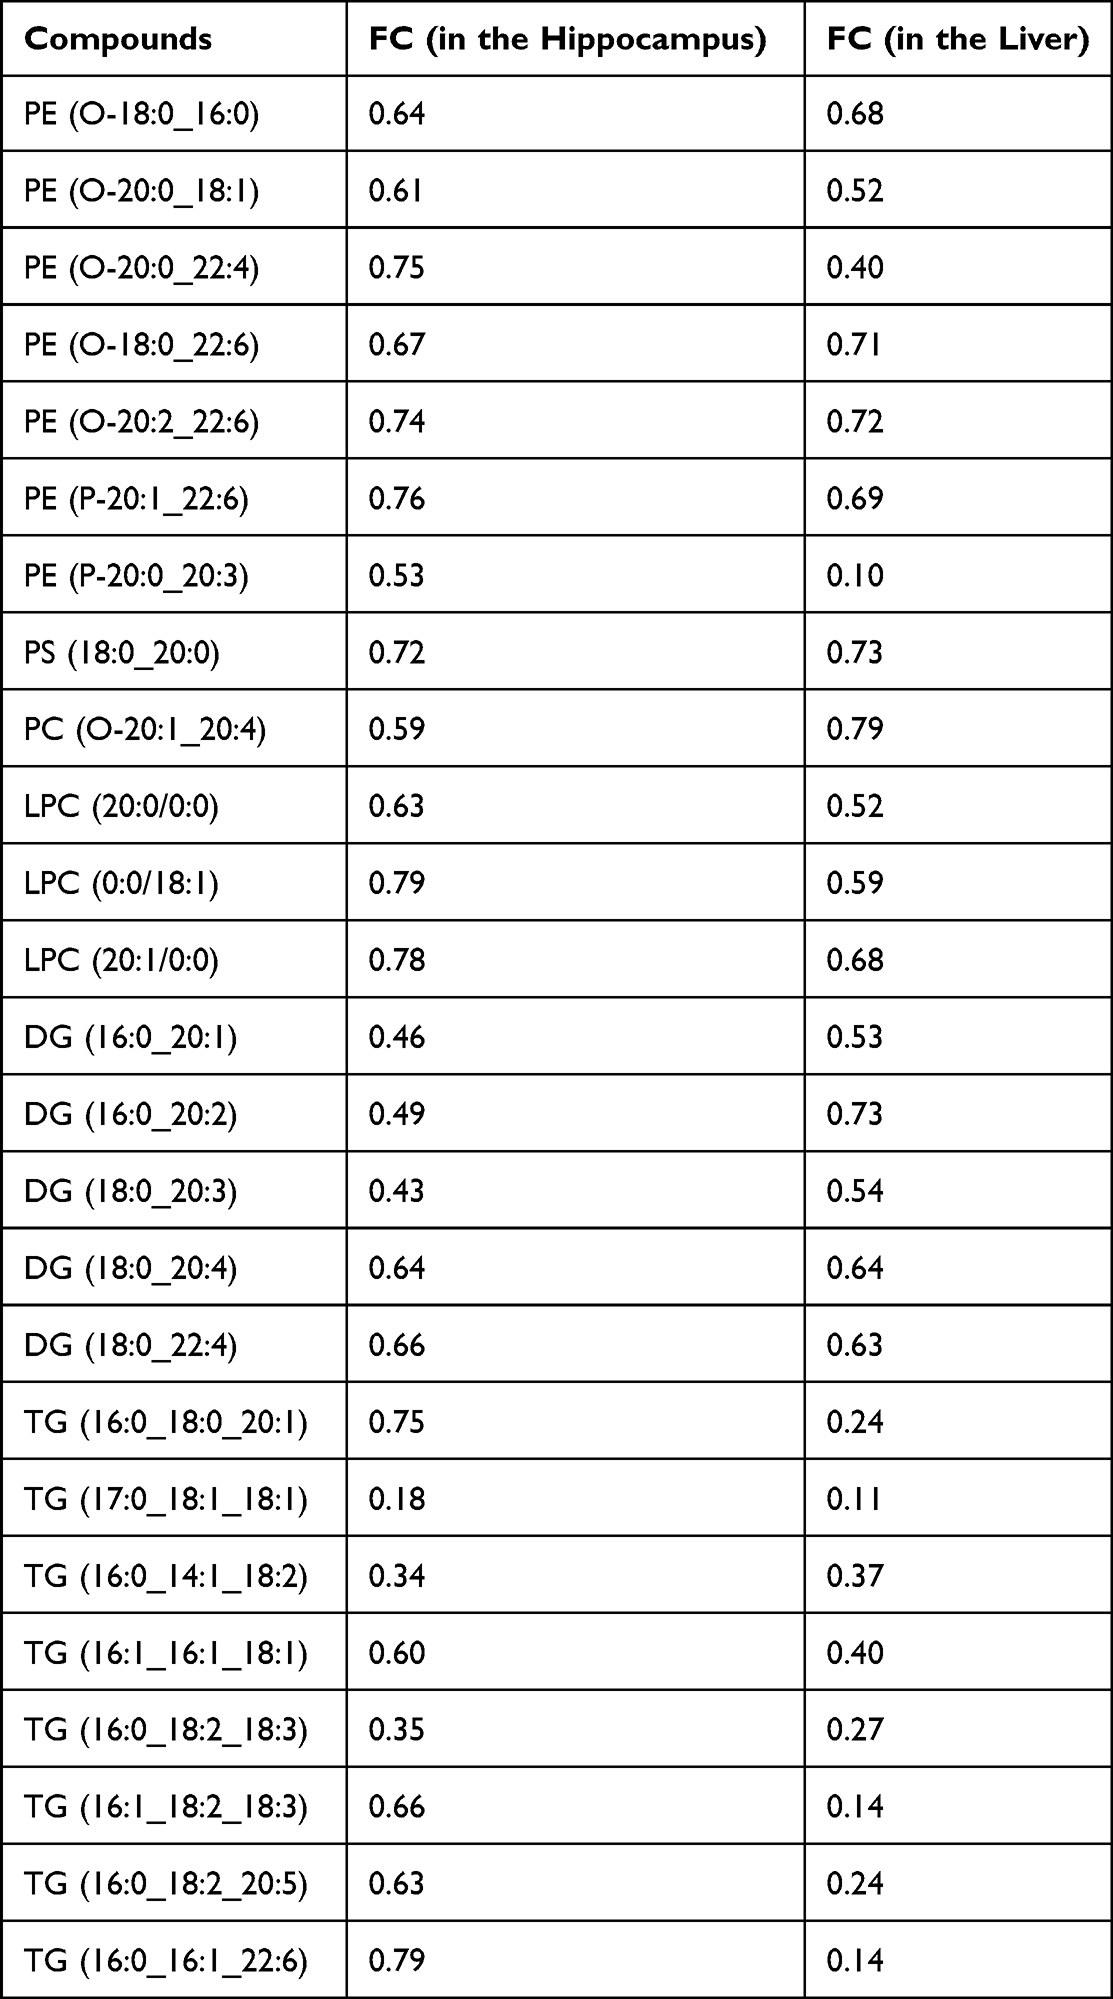 |
Table 1 Common Differential Lipid Metabolites with the Same Tendency in the Two Tissues |
 |
Figure 6 Correlation analysis of these 25 lipids with behavioral phenotypic indices in mice. Correlation analysis of metabolites in the hippocampus (A), Correlation analysis of metabolites in the liver (B). Immobility time and the total distance are indicators of depression-like behavior in mice, and the numbers are correlation coefficients and the p values are shown with * and **. Notes: *p<0.05, **p<0.01. |
Discussion
Neuropsychiatric symptoms of SLE are the most complex and severe manifestations of the disease,17 with major depression being one of the most common manifestations and positively correlated with the disease activity index.14,18 A growing number of studies are finding changes in lipid metabolism in SLE.19–22 However, unlike other affected organs, the main understanding of the mechanisms of NPSLE development is currently focused on the disruption of the blood-brain barrier and the production of brain-reactive autoantibodies.13,23,24 Alterations in metabolism and NPSLE manifestations are currently less studied but are known to be significantly correlated.4 Depression-like manifestations are one of the most common NPSLE symptoms, and some studies have found significant changes in liver and hippocampal lipid metabolism in depressed animals,11,25 while intake of certain lipids improves depressive symptoms via hippocampal neurogenesis,26 which may be a potential mechanism for the role of the liver-brain axis in NP symptoms. Hepatic lipid metabolism changes affect brain lipid metabolism and induce neuroinflammation or neurodegeneration, which is one of the liver-brain axis modes of action.27 Therefore, our study is the first to characterize the metabolic profile of the liver-hippocampus in MRL/lpr mice with depression-like behavior to clarify the influence of the liver-brain axis in NPSLE. We first identified 18-week-old MRL/lpr mice with depression-like behavior and assessed the systemic effects of the mice by splenomegaly and serum anti-dsDNA. Then, we performed UPLC-MS/MS on hippocampal and liver tissues and screened 355 differential expressed lipids in the hippocampus and 405 in the liver. To clarify the potential mechanism of the liver-brain axis affecting NPSLE through lipid metabolism, we performed an intersection analysis of the differential metabolites in both tissues by Venn diagram and identified a total of 56 common differential lipids, among which 25 differential lipids showed the same trend in the two tissues. After the KEGG pathway enrichment analysis of the differential lipids in both tissues, we found that the differential lipids in both tissues were involved in three metabolic pathway processes, namely Glycerophospholipid metabolism, Sphingolipid metabolism, and Glycerolipid metabolism pathway. After correlating the above 25 differential lipids with behavioral indices in mice, we found that the differential lipids in the glycerolipid metabolism pathway in both tissues were significantly correlated with behavioral outcomes. This suggests that the glycerophospholipid metabolism pathway is a possible mechanism of the “liver-brain axis” affecting the depression-like performance of NPSLE.
The brain is one of the most lipid-rich tissues.28 Lipids have an important role in the function of neurons and altered lipids in the brain may affect mood and behavior, leading to depression-like manifestations,29 and some studies have found that depressive manifestations present with disturbances in the metabolism of peripheral and brain lipids.30,31 Glycerophospholipids, one of the most abundant species of phospholipids, are key components of neuronal membranes, myelin, mediator precursors, and important regulators of signaling.11,29,32 In our study, alterations in the glycerophospholipid pathway were found to be the most prominent and consistent feature in the liver and hippocampus. We found that several differential lipids, DG, PE, PA, PE, PS, and LPC, were enriched in the glycerophospholipid pathway in both liver and hippocampus, and seven PEs, three LPCs, one PC, one PS, and five DGs showed the same decreasing trend in expression in both tissues. Peripheral LPE 18:0, LPC 20:0, and LPC 18:0 were found to appear significantly lower in SLE patients in previous studies,33 which is also consistent with our findings in the liver.
Furthermore, it was argued in previous studies that it was contradictory whether the MRL/lpr mice had anxiety-like performance in addition to exhibiting depression-like behaviors that coincided with significant depressive symptoms in NPSLE patients.12,34,35 In contrast, we found a high degree of activity in the central zone in MRL/lpr mice in OFT, although there was no significant difference between the two groups in terms of central activity time and distance of activity. This may be because we placed the mice in the central region in our experiment and the activity of the MRL/lpr mice was significantly reduced. This also supported the possibility that in our study, the main mood disorder in the MRL/lpr mice was depression-like manifestations without accompanying anxiety.
At the same time, our study has some limitations: 1) our study focused only on the role of metabolic changes in the liver-brain axis, but did not explore other studies such as immune factors; 2) we described the disruption of glycerophospholipid metabolism in the liver-brain axis associated with NPSLE. Future studies dedicated to these pathways are needed to further elucidate their functions and identify new therapeutic targets. More in-depth research, such as transcriptomics and proteomics, will be carried out to show how NPSLE lipidomics regulates and affects disease; 3) Because of the offset caused by the small sample size in this research, we will further increase the sample size in future experiments to prove our point.
Conclusion
In summary, our work showed the depressive behavior of MRL/lpr mice. We found that MRL/lpr mice are characterized by altered glycerophospholipid metabolism in the liver-brain axis. This may help us to understand the possible role of lipid metabolism in the onset of mood disorders in SLE.
Abbreviations
DG, glycerol diesters; PC, phosphatidylcholine; LPC, lysophosphatidylcholine; PE, phosphatidylethanolamine; PS, phosphatidylserine; LPS, lysophosphatidylserine; PA, phosphatidic acid; SM, sphingomyelin; Cer, ceramide; TG, triglycerides.
Acknowledgments
This work was supported by Zhejiang Provincial Special Project for Modernization of Chinese Medicine (Grant numbers: 2020ZX008).
Author Contributions
All authors made a significant contribution to the work reported, whether that is in the conception, study design, execution, acquisition of data, analysis and interpretation, or in all these areas; took part in drafting, revising or critically reviewing the article; gave final approval of the version to be published; have agreed on the journal to which the article has been submitted; and agree to be accountable for all aspects of the work.
Disclosure
The authors report no conflicts of interest in this work.
References
1. Carrión-Barberà I, Salman-Monte TC, Vílchez-Oya F, Monfort J. Neuropsychiatric involvement in systemic lupus erythematosus: a review. Autoimmun Rev. 2021;20(4):102780. doi:10.1016/j.autrev.2021.102780
2. Zhang L, Fu T, Yin R, Zhang Q, Shen B. Prevalence of depression and anxiety in systemic lupus erythematosus: a systematic review and meta-analysis. BMC Psychiatry. 2017;17(1):70. doi:10.1186/s12888-017-1234-1
3. Bai R, Liu S, Zhao Y, et al. Depressive and anxiety disorders in systemic lupus erythematosus patients without major neuropsychiatric manifestations. J Immunol Res. 2016;2016:2829018. doi:10.1155/2016/2829018
4. Mackay M, Tang CC, Volpe BT, et al. Brain metabolism and autoantibody titres predict functional impairment in systemic lupus erythematosus. Lupus Sci Med. 2015;2(1):e000074. doi:10.1136/lupus-2014-000074
5. Wang Y, Guo F, Guo Y, et al. Untargeted lipidomics reveals specific lipid abnormalities in systemic lupus erythematosus. Clin Exp Rheumatol. 2022;40(5):1011–1018. doi:10.55563/clinexprheumatol/ye2ua5
6. Zhang T, Mohan C. Caution in studying and interpreting the lupus metabolome. Arthritis Res Ther. 2020;22(1):172. doi:10.1186/s13075-020-02264-2
7. Hu C, Du Y, Xu X, et al. Lipidomics revealed aberrant metabolism of lipids including FAHFAs in renal tissue in the progression of lupus nephritis in a murine model. Metabolites. 2021;11(3):142. doi:10.3390/metabo11030142
8. van Kruining D, Luo Q, van Echten-Deckert G, et al. Sphingolipids as prognostic biomarkers of neurodegeneration, neuroinflammation, and psychiatric diseases and their emerging role in lipidomic investigation methods. Adv Drug Deliv Rev. 2020;159:232–244. doi:10.1016/j.addr.2020.04.009
9. Zhang G, Meng Q, Blencowe M, Agrawal R, Gomez-Pinilla F, Yang X. Multi-tissue multi-omics nutrigenomics indicates context-specific effects of docosahexaenoic acid on rat brain. Mol Nutr Food Res. 2020;64(23):e2000788. doi:10.1002/mnfr.202000788
10. Ying Z, Byun HR, Meng Q, et al. Biglycan gene connects metabolic dysfunction with brain disorder. Biochim Biophys Acta Mol Basis Dis. 2018;1864(12):3679–3687.
11. Geng C, Qiao Y, Guo Y, et al. Integrated metabolomics and lipidomics profiling of hippocampus reveal metabolite biomarkers in a rat model of chronic unpredictable mild stress-induced depression. Ann Transl Med. 2019;7(23):781. doi:10.21037/atm.2019.11.21
12. Gulinello M, Putterman C. The MRL/lpr mouse strain as a model for neuropsychiatric systemic lupus erythematosus. J Biomed Biotechnol. 2011;2011:207504. doi:10.1155/2011/207504
13. Ballok DA. Neuroimmunopathology in a murine model of neuropsychiatric lupus. Brain Res Rev. 2007;54(1):67–79. doi:10.1016/j.brainresrev.2006.12.003
14. Gao HX, Campbell SR, Cui MH, et al. Depression is an early disease manifestation in lupus-prone MRL/lpr mice. J Neuroimmunol. 2009;207(1–2):45–56. doi:10.1016/j.jneuroim.2008.11.009
15. Zhang F, Zhou Y, Chen H, et al. Curcumin alleviates DSS-induced anxiety-like behaviors via the microbial-brain-gut axis. Oxid Med Cell Longev. 2022;2022:6244757. doi:10.1155/2022/6244757
16. Fraga CG, Clowers BH, Moore RJ, Zink EM. Signature-discovery approach for sample matching of a nerve-agent precursor using liquid chromatography-mass spectrometry, XCMS, and chemometrics. Anal Chem. 2010;82(10):4165–4173. doi:10.1021/ac1003568
17. Govoni M, Bortoluzzi A, Padovan M, et al. The diagnosis and clinical management of the neuropsychiatric manifestations of lupus. J Autoimmun. 2016;74:41–72. doi:10.1016/j.jaut.2016.06.013
18. Liao J, Kang J, Li F, et al. A cross-sectional study on the association of anxiety and depression with the disease activity of systemic lupus erythematosus. BMC Psychiatry. 2022;22(1):591. doi:10.1186/s12888-022-04236-z
19. Hu C, Zhang J, Hong S, et al. Oxidative stress-induced aberrant lipid metabolism is an important causal factor for dysfunction of immunocytes from patients with systemic lupus erythematosus. Free Radic Biol Med. 2021;163:210–219. doi:10.1016/j.freeradbiomed.2020.12.006
20. Sun W, Li P, Cai J, et al. Lipid metabolism: immune regulation and therapeutic prospectives in systemic lupus erythematosus. Front Immunol. 2022;13:860586. doi:10.3389/fimmu.2022.860586
21. Tian J, Huang T, Chang S, et al. Role of sphingosine-1-phosphate mediated signalling in systemic lupus erythematosus. Prostaglandins Other Lipid Mediat. 2021;156:106584. doi:10.1016/j.prostaglandins.2021.106584
22. Teng X, Brown J, Choi SC, Li W, Morel L. Metabolic determinants of lupus pathogenesis. Immunol Rev. 2020;295(1):167–186. doi:10.1111/imr.12847
23. Chi JM, Mackay M, Hoang A, et al. Alterations in blood-brain barrier permeability in patients with systemic lupus erythematosus. AJNR Am J Neuroradiol. 2019;40(3):470–477. doi:10.3174/ajnr.A5990
24. Hanly JG, Kozora E, Beyea SD, Birnbaum J. Review: nervous system disease in systemic lupus erythematosus: current status and future directions. Arthritis Rheumatol. 2019;71(1):33–42. doi:10.1002/art.40591
25. Jung J, Lee SM, Lee MJ, et al. Lipidomics reveals that acupuncture modulates the lipid metabolism and inflammatory interaction in a mouse model of depression. Brain Behav Immun. 2021;94:424–436. doi:10.1016/j.bbi.2021.02.003
26. Borsini A, Nicolaou A, Camacho-Muñoz D, et al. Omega-3 polyunsaturated fatty acids protect against inflammation through production of LOX and CYP450 lipid mediators: relevance for major depression and for human hippocampal neurogenesis. Mol Psychiatry. 2021;26(11):6773–6788. doi:10.1038/s41380-021-01160-8
27. Mondal A, Bose D, Saha P, et al. Lipocalin 2 induces neuroinflammation and blood-brain barrier dysfunction through liver-brain axis in murine model of nonalcoholic steatohepatitis. J Neuroinflammation. 2020;17(1):201. doi:10.1186/s12974-020-01876-4
28. Bozek K, Wei Y, Yan Z, et al. Organization and evolution of brain lipidome revealed by large-scale analysis of human, chimpanzee, macaque, and mouse tissues. Neuron. 2015;85(4):695–702. doi:10.1016/j.neuron.2015.01.003
29. Zheng P, Wu J, Zhang H, et al. The gut microbiome modulates gut-brain axis glycerophospholipid metabolism in a region-specific manner in a nonhuman primate model of depression. Mol Psychiatry. 2021;26(6):2380–2392. doi:10.1038/s41380-020-0744-2
30. Jia HM, Li Q, Zhou C, et al. Chronic unpredictive mild stress leads to altered hepatic metabolic profile and gene expression. Sci Rep. 2016;6:23441. doi:10.1038/srep23441
31. Zhang Y, Yuan S, Pu J, et al. Integrated metabolomics and proteomics analysis of hippocampus in a rat model of depression. Neuroscience. 2018;371:207–220. doi:10.1016/j.neuroscience.2017.12.001
32. Farooqui AA, Horrocks LA, Farooqui T. Interactions between neural membrane glycerophospholipid and sphingolipid mediators: a recipe for neural cell survival or suicide. J Neurosci Res. 2007;85(9):1834–1850. doi:10.1002/jnr.21268
33. Zhang Q, Li X, Yin X, et al. Metabolomic profiling reveals serum L-pyroglutamic acid as a potential diagnostic biomarker for systemic lupus erythematosus. Rheumatology. 2021;60(2):598–606. doi:10.1093/rheumatology/keaa126
34. Gulinello M, Wen J, Putterman C. Neuropsychiatric symptoms in lupus. Psychiatr Ann. 2012;42(9):322–328. doi:10.3928/00485713-20120906-05
35. Jeltsch-David H, Muller S. Neuropsychiatric systemic lupus erythematosus and cognitive dysfunction: the MRL-lpr mouse strain as a model. Autoimmun Rev. 2014;13(9):963–973. doi:10.1016/j.autrev.2014.08.015
 © 2022 The Author(s). This work is published and licensed by Dove Medical Press Limited. The
full terms of this license are available at https://www.dovepress.com/terms
and incorporate the Creative Commons Attribution
- Non Commercial (unported, 3.0) License.
By accessing the work you hereby accept the Terms. Non-commercial uses of the work are permitted
without any further permission from Dove Medical Press Limited, provided the work is properly
attributed. For permission for commercial use of this work, please see paragraphs 4.2 and 5 of our Terms.
© 2022 The Author(s). This work is published and licensed by Dove Medical Press Limited. The
full terms of this license are available at https://www.dovepress.com/terms
and incorporate the Creative Commons Attribution
- Non Commercial (unported, 3.0) License.
By accessing the work you hereby accept the Terms. Non-commercial uses of the work are permitted
without any further permission from Dove Medical Press Limited, provided the work is properly
attributed. For permission for commercial use of this work, please see paragraphs 4.2 and 5 of our Terms.