Back to Journals » Journal of Hepatocellular Carcinoma » Volume 9
Lipid-Based Factors: A Promising New Biomarker for Predicting Prognosis and Conditional Survival Probability in Hepatocellular Carcinoma
Received 18 March 2022
Accepted for publication 9 August 2022
Published 26 August 2022 Volume 2022:9 Pages 869—883
DOI https://doi.org/10.2147/JHC.S360871
Checked for plagiarism Yes
Review by Single anonymous peer review
Peer reviewer comments 4
Editor who approved publication: Professor Manal Hassan
Ziwei Guo,1,2 Jun Liang1,2
1Peking University Cancer Hospital and Institute, Medical Oncology, Beijing, People’s Republic of China; 2Peking University International Hospital, Medical Oncology, Beijing, People’s Republic of China
Correspondence: Jun Liang, Peking University Cancer Hospital and Institute, 52 Fu cheng, Hai Dian District, Beijing, 100142, People’s Republic of China, Tel +8615801353728, Fax +86 01069006789, Email [email protected]
Purpose: Abnormalities in lipid metabolism play a vital role in the development of cancer. This retrospective study aimed to evaluate the survival prognosis of patients with hepatocellular carcinoma (HCC) in terms of (free fatty acid: high-density lipoproteins) ratio (FF-HL) and to compare it with conditional probability and annual death hazard.
Patients and Methods: Patients (n=300) were enrolled. Time-dependent receiver operating characteristic (ROC) analysis was used to determine the predictive ability of survival. Survival probabilities were estimated using the Kaplan–Meier method and Log rank tests were performed for statistical significance.
Results: The area under the ROC curve for FF-HL, which predicts overall survival (OS), was superior to other markers. Patients in the high FF-HL (> 840.3) showed poorer OS and progress-free survival (PFS). In multivariable analysis, FF-HL was an independent marker in predicting OS. Younger people and those with intrahepatic metastasis in higher FF-HL groups, as well as older men without vascular invasion in higher AHLR groups showed shorter OS and PFS. 3-year conditional disease-free survival (CDFS3) was slightly higher than those with actuarial survival. The death risk for 3-year conditional OS (COS3) was stable in the group with low FF-HL and (albumin: high-density lipoproteins) ratio (AHLR) and more pronounced in high subgroups. However, risk stratification using the Barcelona Clinic Liver Cancer approach and Child-Pugh score might not accurately predict COS3.
Conclusion: FF-HL and AHLR are not only promising biomarkers in terms of predictive ability of OS and PFS but also provide time-dependent prognostic information for HCC patients.
Keywords: hepatocellular carcinoma, survival, biomarkers, conditional survival probability
Introduction
Despite the decrease in chronic viral infections, there has been an unexpected change in the increase in the incidence of HCC statistically.1 The explanation for this negative correlation could be due to some major changes in the epidemiological cascades. In fact, an increasing number of HCCs depend on abnormal lipid metabolism, which can be involved in microbiota, insulin resistance, inflammation and important cellular processes, including cell growth, proliferation, differentiation, and movement, and has emerged as a new etiology and causality.1,2
Indeed, the division, expansion, differentiation and movement of cancer cells are driven by metabolism, where abnormal lipid metabolism is a sufficient condition for signaling, membrane and energy sources.3 Various abnormal metabolic pathways4 meet the energy needs of fatty acid and cholesterol metabolism in cancer patients.5 More specifically, the high cholesterol demand is essential for tumor proliferation and OS in endocrine cancers, including HCC.6 Therefore, lipid-associated components are becoming an emerging risk factor for the development and progress of HCC.
Among circulating lipids, high-density lipoprotein cholesterol (HDL-C), low-density lipoprotein cholesterol (LDL-C), apolipoprotein A-I and apolipoprotein B are recognized participants in metabolic diseases. Growing evidence for an inverse correlation of HDL-C in promoting tumor progression implied that HDL-C was used as a survival predictive parameter for some specific types of cancer, including breast cancer, HCC, colorectal cancer.7–10 An epidemiological study showed that free fatty acids (FFA) levels can complement the predictive ability of CEA and CA19-9 and differentiate them from TNM staging.11 These are associated with cancer by numerous metabolic pathways4 and often by the growth and proliferation of FFA and HDL-C that meet energy requirements.5 More particularly, high cholesterol demand is essential for tumor proliferation and OS in different types of endocrine cancers, including HCC.6 Furthermore, previous study demonstrated a positive correlation between apolipoproteins B and overall cancer incidence in common cancers, such as breast cancer, lung cancer, colorectal cancer and prostate cancer.12 In addition, albumin is a critical acute-phase protein in systemic inflammation response and represents a potential indicator of liver function.13 These individual lipid-related factors are known as independent markers of cancer prognosis. However, it is unknown whether the combination of these factors could be a more significant marker of HCC survival or bring a new predictive ability.
To our knowledge, risk-stratified factors are typically grouped by clinicopathological predictors, including the Barcelona Clinic Liver Cancer (BCLC) approach,14 vascular invasion,15 cirrhosis16 and alpha fetoprotein (AFP) levels.17 Generally, accurate survival analyses based on different characteristics of oncologic prognosis are important to establish effective follow-up monitoring and to develop individual treatment. However, there is little evidence that they are valuable for the probability of DFS or OS in patients who have survived for some time after diagnosis. Therefore, conditional OS (COS) and conditional DFS (CDFS) have been proposed as more accurate information on survival outcome, and applied to HCC and intrahepatic cholangiocarcinoma18,19 after resection20,21 or transplantation,22 without stratification factors.
This retrospective study aimed to explain the prognostic significance of albumin– high-density lipoproteins ratio (AHLR) index and FF-HL index and to estimate the COS, CDFS, and annual hazards of death in patients.
Materials and Methods
Ethical approval was provided by the Peking University International Hospital and informed consent was obtained from all patients. This study was conducted in accordance with the Declaration of Helsinki.
Patient Selection and Data Collection
A total of 300 patients with newly diagnosed or follow-up surveillance HCCs who met the eligibility criteria were recruited at Peking University International Hospital from Dec.5 2015 to Nov.31 2021 in the retrospective study. Inclusion criteria: 1. Pathologically definite diagnosis of HCC; 2. Blood routine, biochemistry, coagulation, hepatitis B Virus (HBV)-DNA, and AFP tests before diagnosis or 1–2 weeks before initial treatment. Exclusion criteria: 1 Unclear pathological diagnosis; 2. Patients on antiviral therapy; 3. Patients with previous liver transplantation, type 2 diabetes, hypertension, hyperlipidemia, family history of obesity, fatty liver or atherosclerosis, BMI>27 or other malignancies; 4. Lack of one or more of blood hematological tests. The detailed selection steps were shown in Figure S1. Risk stratification factors included the BCLC approach, Child-Pugh (CP) score23 and the use of a threshold of 800 ng/mL to define high and low AFP.24 Tumor assessment examinations included visceral computed tomography (CT) or liver magnetic resonance imaging (MRI). DFS was presented as the time from random a diagnosed until the first recurrence or death. OS was calculated from the date of diagnosis to the date of death from any cause. PFS was defined as the time interval between the date of diagnosis and the date of last follow-up or new metastasis, whichever came first.
Lipid-Associated Markers
All serum results on lipid-associated factors, including albumin levels, HDL-C, FFA, and apolipoprotein B, were obtained within 1 weeks before diagnosis. These parameters were administered and recorded. We calculated some factors using the following formula.
AABR = (albumin: apolipoprotein B) ratio; AHLR = (albumin: high-density lipoproteins concentrations) ratio; FF-HL = (free fatty acid: high-density lipoproteins concentrations); AB-HL = (apolipoprotein B: high-density lipoproteins concentrations); FF-AB = (free fatty acid: apolipoprotein B); FFAR = (free fatty acid: albumin) ratio.
Statistical Analysis
X-tile25 analysis was conducted to identify the 20-year OS as the optimal cutoff for lipid-associated factors, including AABR, AHLR, FF-HL, AB-HL, FF-AB, and FFAR. Continuous variables were presented by the median (interquartile range [IQR]) two-sided Mann–Whitney U-test, and categorical variables were expressed by the two-sided chi-square test or Fisher’s exact test. OS and DFS were calculated using the Kaplan–Meier approach and Log rank test between different groups were performed using IBM SPSS (version 21.0; SPSS Inc, Chicago, IL, USA). Univariable and multivariable Cox regression analyses were conducted to determine independent predictors of OS or PFS. Time-dependent ROC curve analyses were performed using the “timeROC” package (http://www.r-project.org/), version R 3.6.1, to evaluate the ability of different lipid-associated factors to predict OS, PFS, and DFS. COS3 and CDFS3 estimates were calculated as the probability that patients who had already survived for Y-year would survive for another 3-year (surviving to the accurate 3+Y years since diagnosis). For example, the 3-year COS3 probability was calculated as:26
3-year COS3= Probability (accurate 6-year)/Probability (already survived 3-year). Conditional survival was computed based on actuarial life table survival data. Changes in COS3 or CDFS3 over time were estimated using linear regression, and standardized differences were used to assess the differences between subgroups.21 Annual hazard of death used smoothed hazard estimates based on the Kernel-Epanechnikov smoothing procedure.27 Such flexible and parsimonious piecewise exponential model provides a descriptive tool for understanding patient survival for arbitrary survival data based on an exact likelihood ratio test, a backward elimination procedure, and an optional presumed order restriction on the hazard rate.27
Results
Baseline Characteristics
Among the 300 patients enrolled, the median age was 60 years (IQR: 53–66 years) and the male-to-female ratio was 4.3:1. The median levels of AABR, AHLR, FF-HL, AB-HL, FF-AB and FFAR were 0.42 (IQR 0.34–0.55), 42.35 (IQR 34.79–53.16), 429.63 (IQR 267.91.7–706.62), 100.00 (75.00–135.80), 4.34 (2.51–6.98), and 9.58 (6.45–15.38), respectively. Other characteristics of the patients are summarized in Table 1.
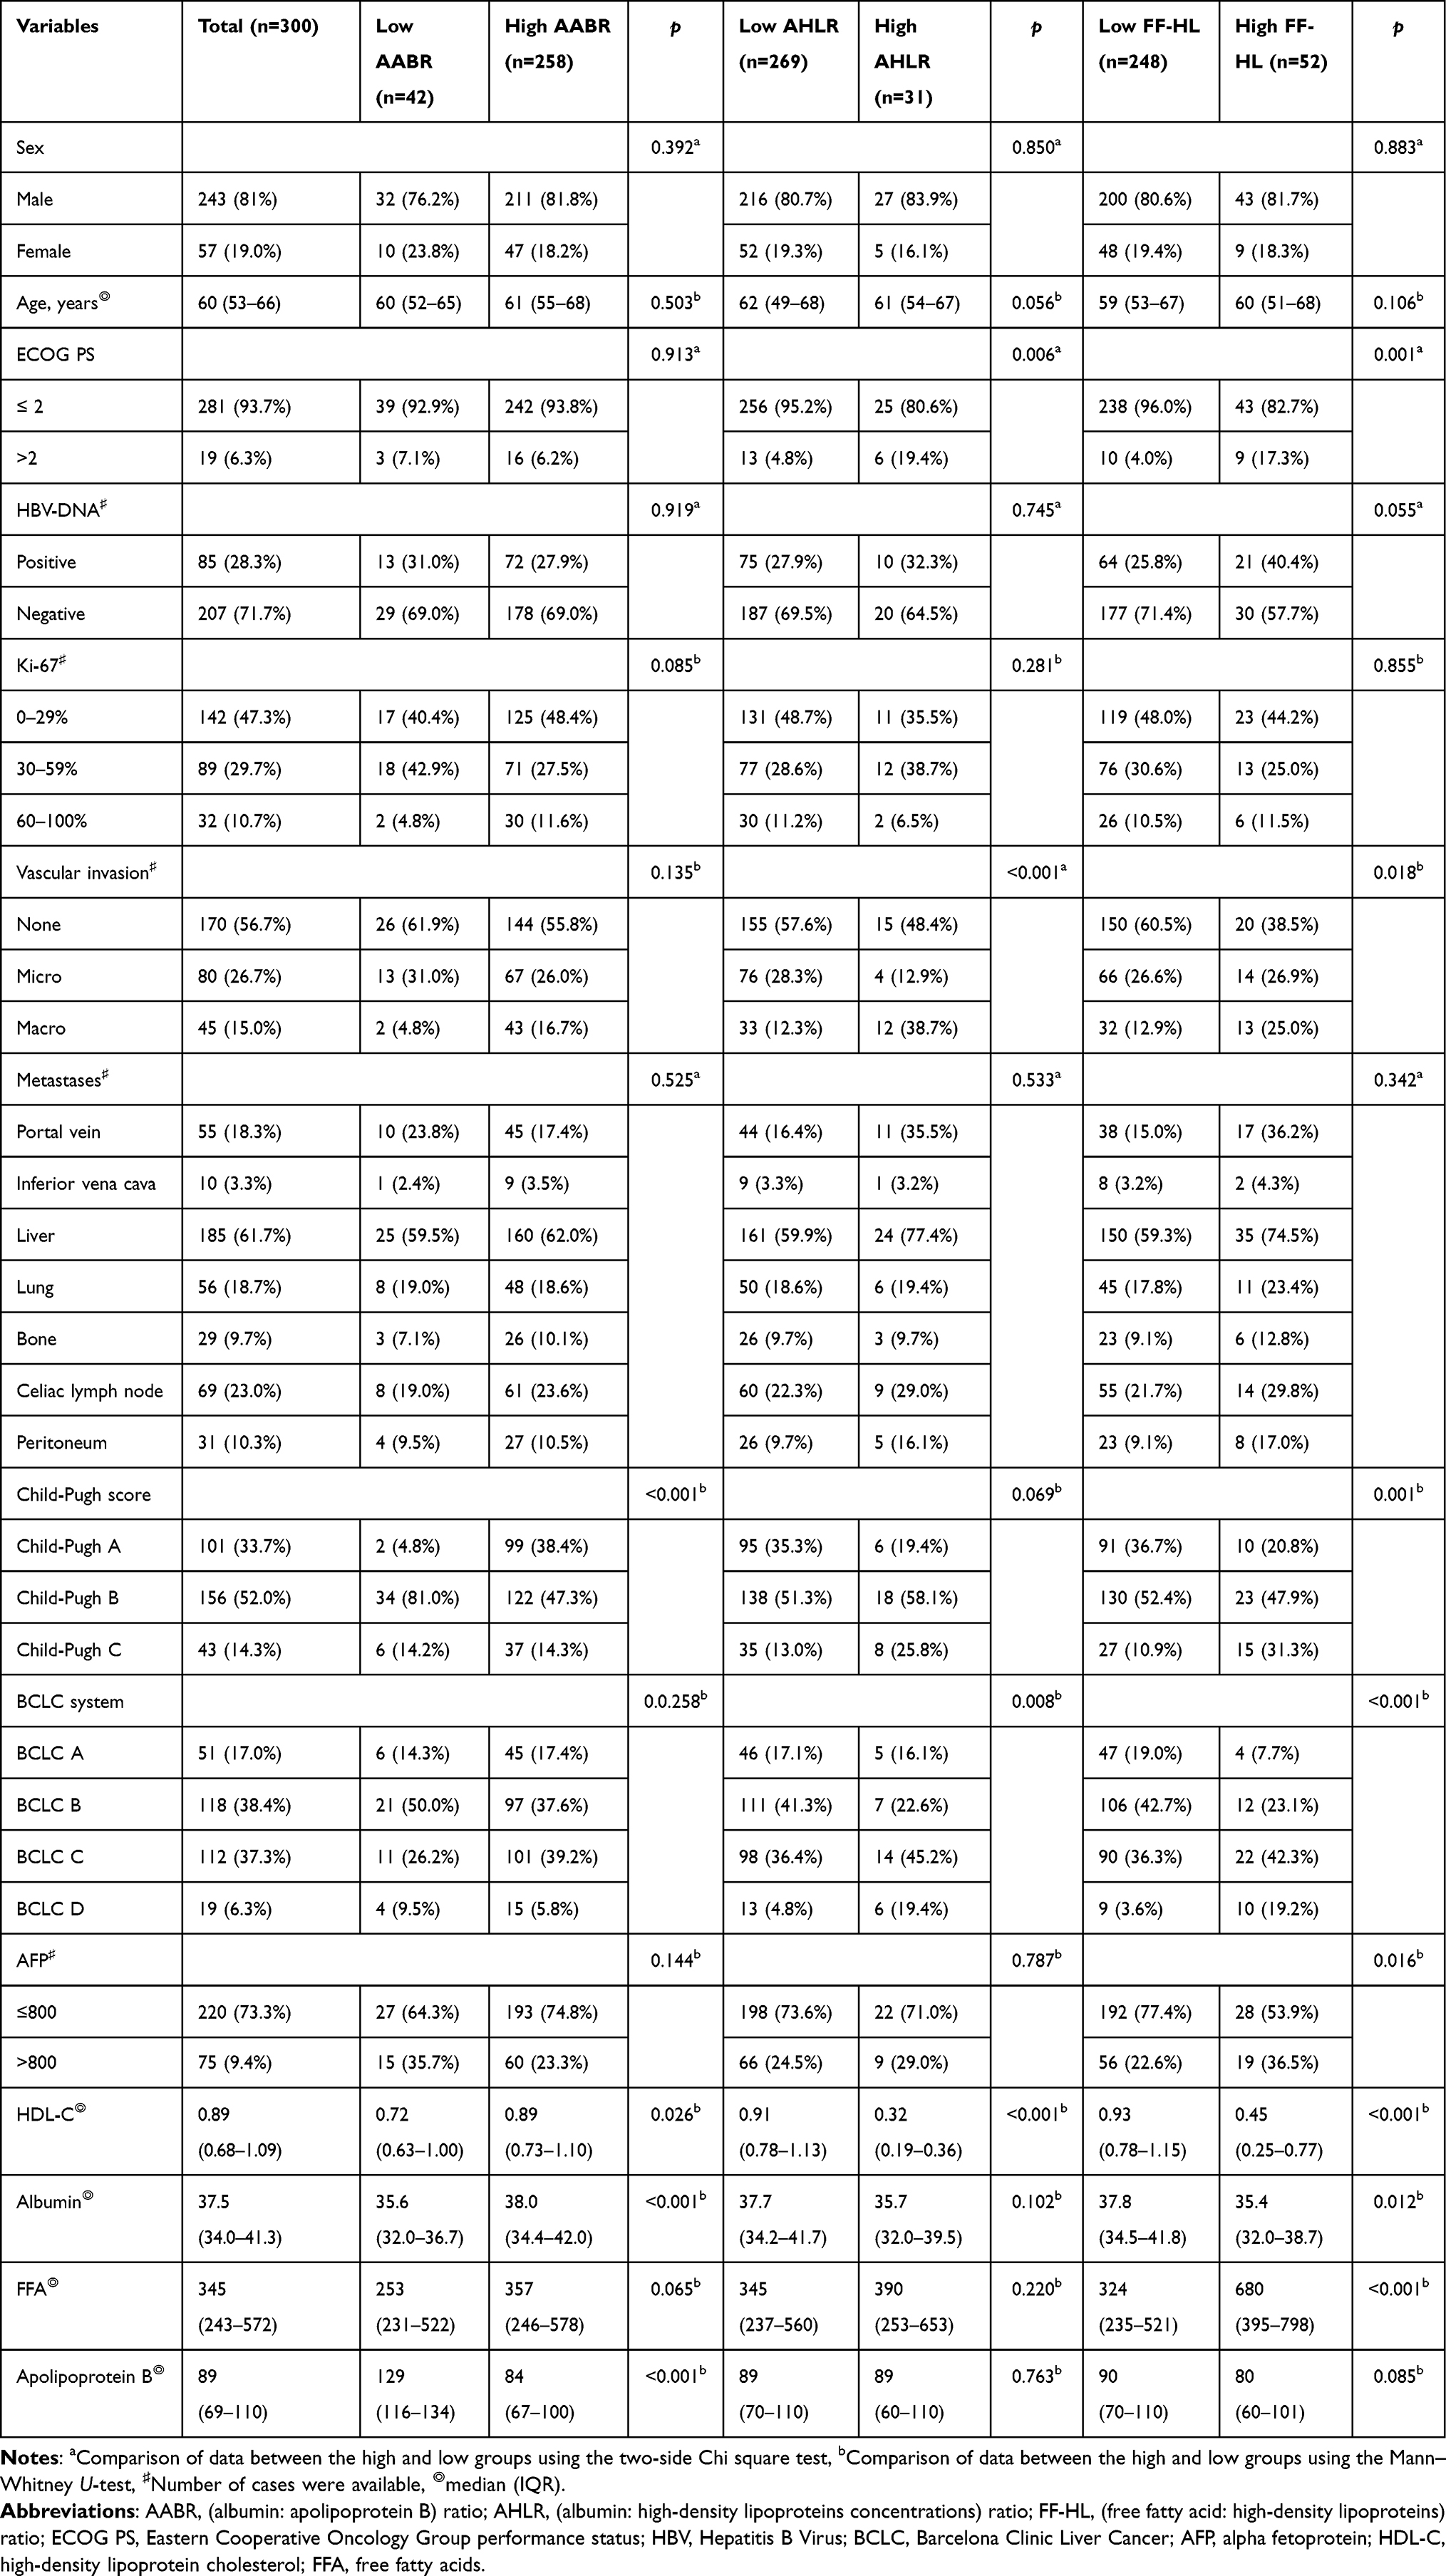 |
Table 1 Baseline Patient Characteristics |
X-Tile Analysis to Identify the Optimal Cut-off Values
X-tile analysis explained the optimal cutoff values of 0.3, 77.0 and 840.3 for AABR, AHLR, and FF-HL (Figure S2A–C) at 20 years OS to differentiate between high and low groups, respectively (Figure S2A–C). Figure S3 showed the optimal cutoff values of 194.0, 10.1, 19.1 and 1.2 for AB-HL, FF-AB, FFAR, and HDL-C, respectively (Figure S3A–D), but there was no statistical difference.
The Ability of Lipid-Associated Factors in Predicting OS, PFS and DFS
The area under the curve (AUC) of FF-HL predicted OS was optimal compared to the other factors because the AUC of FF-HL predicted OS was superior to the other factors at any time point (Figure 1A). The AUCs of FF-HL, FF-AR and FF-AB were close to 0.5 between 1 and 2 years of DFS, but the AUCs of them increased subsequently (Figure 1B). Additionally, the AUCs of the FF-HL and FF-AB predicting PFS were greater than the others at 3, 4, and 5 years, respectively (Figure 1C). The AUCs of FF-HL predicting 5-year OS, DFS and PFS were 0.671, 0.616 and 0.652, respectively.
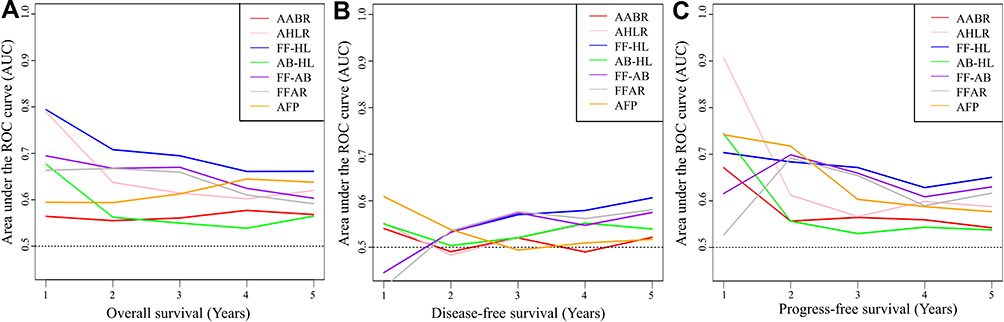 |
Figure 1 Time-dependent ROC curve analysis comparing the ability of AABR, AHLR, FF-HL, AB-HL, FF-AB, FFAR and AFP in predicting (A) overall survival, (B) disease-free survival and (C) progress-free survival. The horizontal axis represents time and the vertical axis represents the area under the corresponding ROC curves for survival at different time points. Abbreviations: ROC, receiver operating characteristic; AABR, (albumin: apolipoprotein B) ratio; AHLR, (albumin: high-density lipoproteins) ratio; FF-HL, (free fatty acid: high-density lipoproteins) ratio; AB-HL, (apolipoprotein B) high-density lipoproteins concentrations) ratio; FFAB, (free fatty acid: apolipoprotein B) ratio; FFAR, (free fatty acid: albumin) ratio; AFP, alpha fetoprotein. |
OS, PFS and DFS in the High and Low Groups
After a median follow-up of 34.8 months (IQR 13.3–51.6), there were 63 deaths. The 1-, 5-, and 10-year OS were similar in the high and low AABR groups (87.4%, 67.0%, and 45.5%; 81.9%, 68.0%, and 32.6%) (Figure 2A). However, high levels of AHLR and FF-HL (AHLR: 72.4%, 43.7%, and 0, p < 0.001; FF-HL: 67.8%, 48.9%, and 0, p < 0.001) compared with low levels of AHLR and FFHL (AHLR: 89.3%, 74.9%, and 51.7%; FF-HL: 91.2%, 75.0%, and 62.2%) with lower 1-year, 5-year, and 10-year OS (Figure 2B and C). HDL-C, a significant participant in AHLR and FF-HL, did not differ significantly in 1-, 5-, and 10-year OS (78.4%, 17.3%, and 5.1%; 73.3%, 22.2%, and 4.4%, p=0.059) (Figure 2D).
 |
Figure 2 Differences in overall survival (OS) (A–D; blue color: the low groups, green color: the high groups) and progression-free survival (PFS) (E–H; purple color: the low groups, Orange color: the high groups) between these eight subgroups were assessed in patients in the high and low level AABR, AHLR, FF-HL and HDL-C groups. The median OS was 10.1 vs 8.4 years in low and high AABR group (A), 15.0 vs 5.1 years in low HDL-C (D). The median PFS was 5.3 vs 6.5 months in low and high AABR group (E), 7.3 vs 3.2 months in low and high AHLR group (F), 7.6 vs 3.5 months low and high FF-HL group (G), and 5.9 vs 7.8 months in low and high HDL-C groups (H). P < 0.001 in red was statistically significant. Abbreviations: AABR, (albumin: apolipoprotein B) ratio; AHLR, (albumin: high-density lipoproteins concentrations) ratio; FF-HL, (free fatty acid: high-density lipoproteins) ratio; HDL-C, high density lipoprotein cholesterol, no. at risk number at risk. |
Two hundred and seven patients (69.0%) underwent tumor recurrence or metastasis. The 6-, 12-, and 18-month PFS were higher for low-level AHLR (55.0%, 22.8%, and 12.2%) than for high-level AHLR (Figure 2F). 6-, 12-, and 18-month PFS were also higher for low-level FF-HL (56.8%, 23.5%, and 12.3%) (Figure 2G). 6-, 12-, and 18-month PFS were not statistically different in the AABR and HDL-C cohorts (40.0% vs 51.1%, 28.0% vs 20.3%, 12.0% vs 11.0%. p=0.977; 48.9% vs 57.1%, 19.4% vs 33.3%, and 9.7% vs 19.0%, p=0.600) (Figure 2E and H). Unfortunately, DFS rates did not obtain statistical significance in all three subgroups (Figure 3A, E and I).
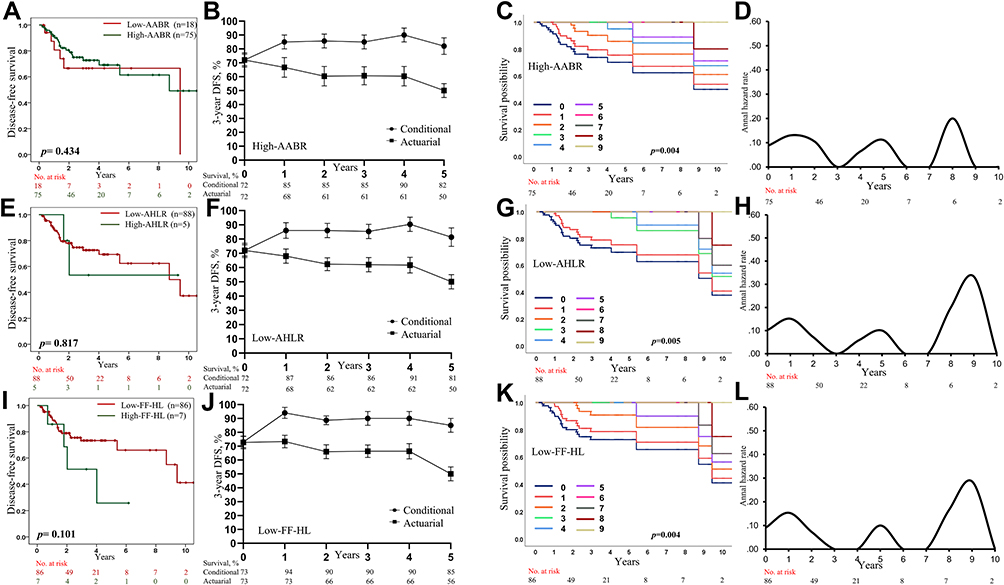 |
Figure 3 Comparison of DFS, CDFS, actuarial DFS, and annual rate of death in the high-level AABR, low-level AHLR, and low-level FF-HL groups. (A, E and I) represent the DFS of AABR, AHLR, and FF-HL groups in the total population, respectively; (B, F and J) represent the 3-year conditional survival rate and the 3-year actuarial DFS rate, respectively; (C, G and K) represent the conditional survival curves of patients who have survived 1–9 years of survival, respectively; (D, H and L) represent smoothed hazard plots of annual rate of death for each group, respectively. Abbreviations: AABR, (albumin: apolipoprotein B) ratio; FF-HL, (free fatty acid: high-density lipoproteins) ratio; AHLR, (albumin: high-density lipoproteins concentrations) ratio; DFS, disease-free survival; CDFS, conditional disease-free survival. |
Subgroup Analyses of OS and PFS Based on Risk Stratifications
We assessed OS and PFS according to risk stratification of patients by AFP levels (Figure S4), CP scores (Figure S5) and BCLC systems (Figure S6) at high and low levels of AHLR and FF-HL. At low levels of AHLR, OS was significant for all three risk factors (AFP: p=0.01; CP score: p<0.001; BCLC: p<0.001) (Figures S4A, S5A and S6A). However, PFS was not uniform for the three risk factors (AFP-low level AHLR: p=0.035; CP score-high level FF-HL: p=0.009) (Figures S4B and S5H), where the BCLC approach assessed PFS differently except for low level AHLR (Figure S6B) (Figure S6C–H). Risk stratification did not differ in other subgroups (Figures S4C–H and 5B–D, F, G).
Univariable and Multivariable Analyses for OS and PFS
In univariable analyses, factors significantly associated with OS and PFS included AFP levels, ECOG score, metastatic sites, vascular invasion (micro vs macro), treatment modality (medication vs medication+ local surgery), cirrhosis (Child-Pugh A vs.C), AHLR, and FF-HL (Table 2). In multivariable analysis, FF-HL (≤ 840.3 vs >840.3: HR 0.285, 95% CI 0.172–0.474; p<0.001), metastatic site, ECOG score, and cirrhosis (Child-Pugh A vs.C) were identified as independent predictors of OS; AHCR (≤ 77.0 vs: HR 0.595, 95% CI 0.357–0.990; p = 0.045) and ECOG score were independent predictors of PFS (Table 2).
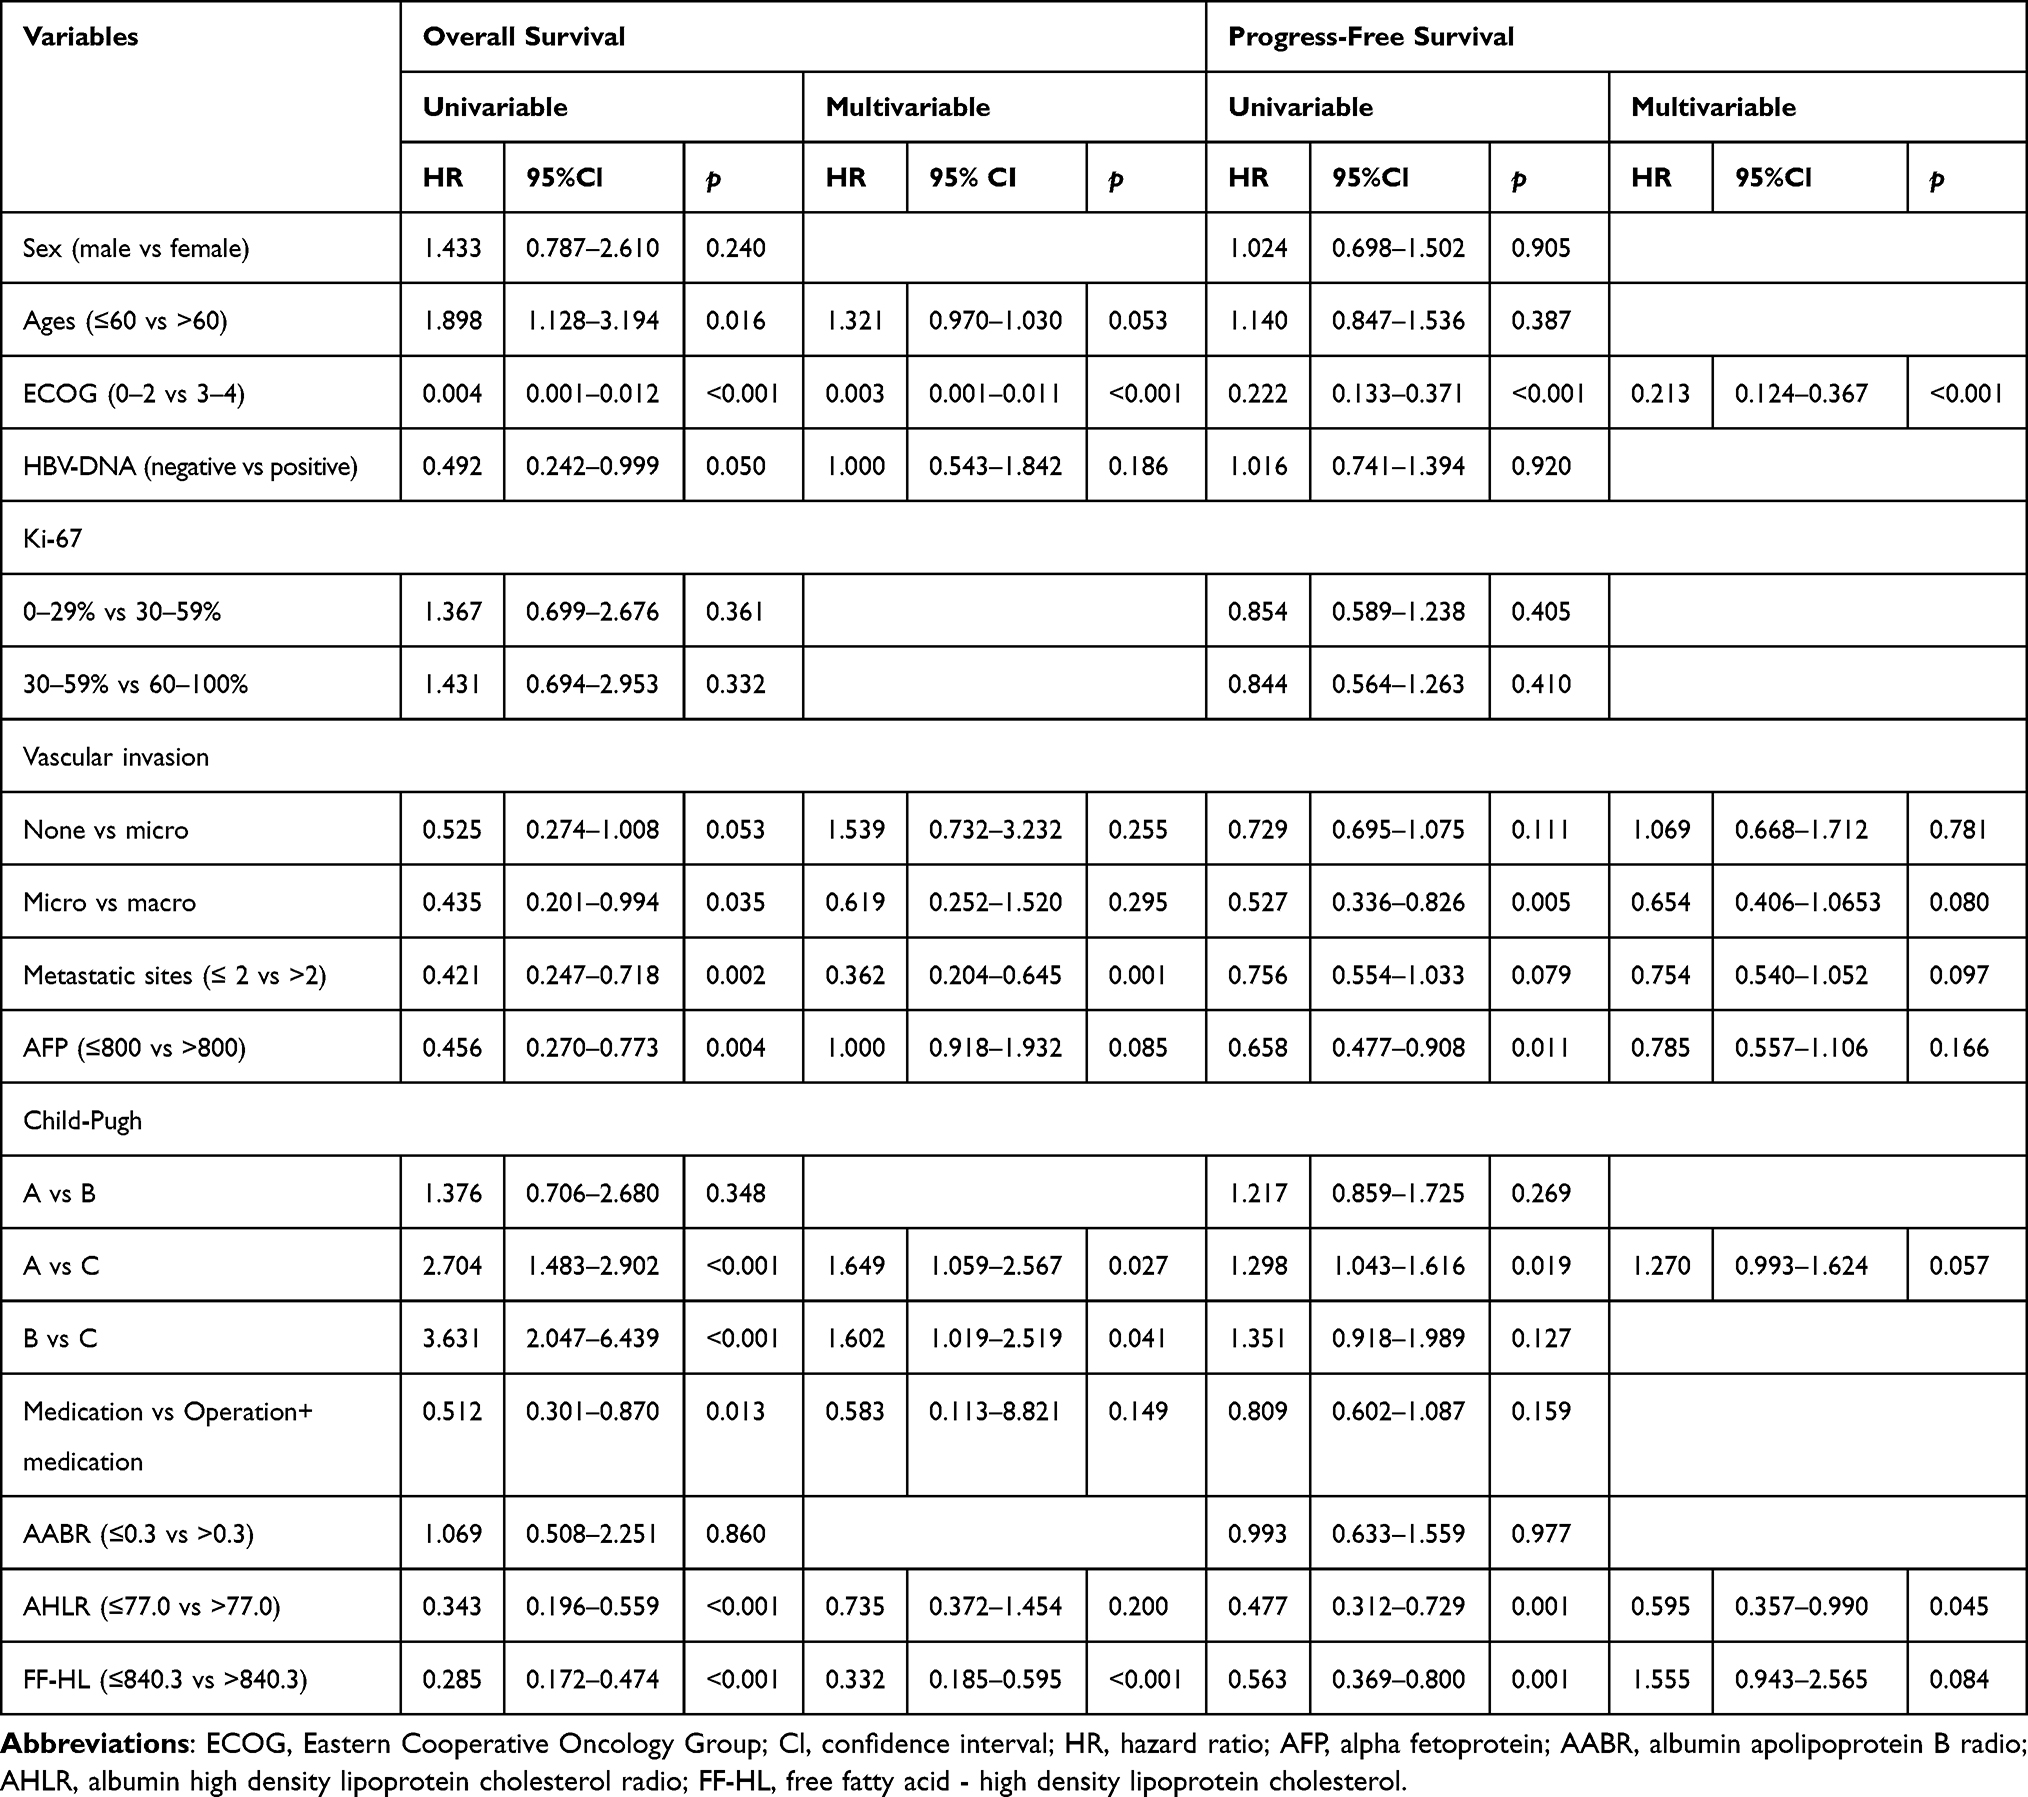 |
Table 2 Univariable and Multivariable Analyses to Determine Independent Predictors of Overall Survival and Progress-Free Survival |
Subgroup Analyses to Assess the Clinical Utility and to Predict OS and PFS
Subgroup analyses were conducted on the basis of chronic viral infection (yes or no), sex (male or female), age (≤ 60 or>60 years), low (0-) or high (3-) PS, vascular invasion, Ki-67, metastatic sites, and therapeutic regimen. High FF-HL or high AHLR was associated with poor OS and PFS, except for celiac lymph nodes (Figures 4 and S8), bone and lung (Figure S7), and portal vein metastasis (Figure S9). Although it failed to obtain statistical significance in all subgroup analyses of OS and PFS, the trends of poor prognosis in patients with high FF-HL and high AHLR were consistent (Figures 4, S7–S9).
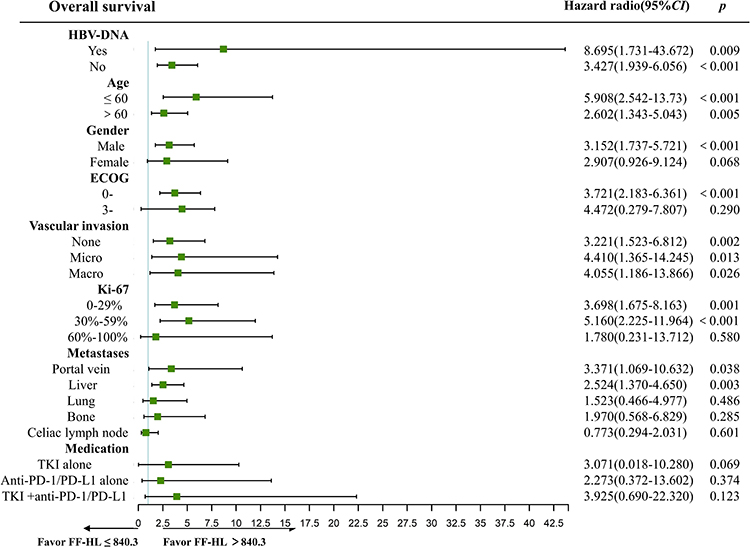 |
Figure 4 Subgroup analysis using univariate Cox regression was performed to assess the ability of FF- HL to discriminate OS in patients with different clinical characteristics. Abbreviations: FF-HL, (free fatty acid: high-density lipoproteins) ratio; OS, overall survival; CI, confidence intervals; ECOG, Eastern Oncology Collaborative Group; TKI, tyrosine kinase inhibitors; PD-1/PD-L1, programmed cell death protein 1 and its ligand PD-L1. |
COS, CDFS, and Annual Hazard by Subtypes and Risk-Stratifications
The 5-year DFS and OS rates were 59.5% and 68.9% for the total cohort, respectively (Figures 5A and 6A). The CDFS3 rates increased slightly in the following years, while the actuarial DFS decreased over time (Figure 5B); the COS3 rates showed a slight downward trend compared to the actuarial OS (Figure 6B). The CDFS probabilities increased obviously in the first two years (Figure 5C) but were not presented in the COS probabilities (Figure 6C). The 2-year CDFS3 increased to 86% (Δ 27% compared to the 5-year DFS); the 2-year COS3 was 83% (Δ 14% compared to the 5-year OS). In addition, the annual death hazard was the highest for DFS in the ninth year (30%), decreasing to about 10% in year 5 (Figure 5D). Moreover, the annual hazard of OS showed a stable trend with an annual death hazard of approximately 10%, increasing to 20% in year 8 (Figure 6D).
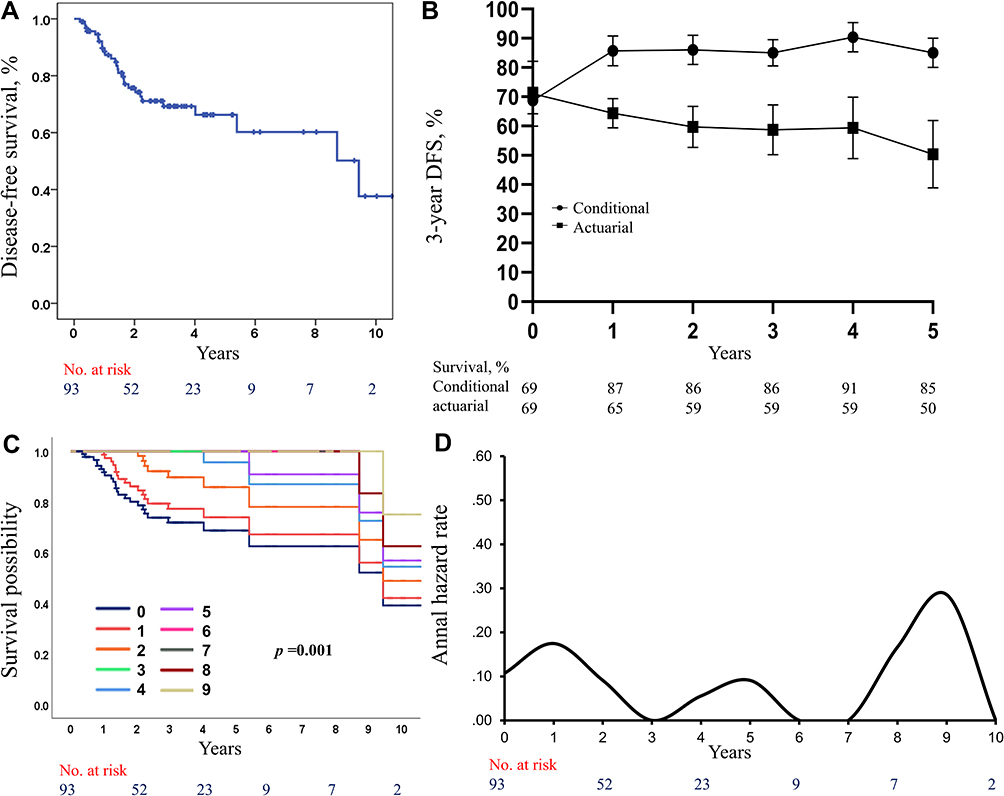 |
Figure 5 DFS and CDFS curves for the whole cohort. (A) DFS curves; (B) 3-year CDFS and 3-year actuarial DFS; (C) CDFS curves for 1–9 years of survival, respectively. (D) Smoothed hazard plot for annual rate of death. Abbreviations: DFS, disease-free survival; CDFS, conditional disease-free survival. |
 |
Figure 6 OS and COS curves for the whole cohort. (A) OS curves; (B) 3-year COS and 3-year actuarial OS; (C) COS curves for 1–9 years of survival, respectively. (D) Smoothed hazard plot for annual rate of death. Abbreviations: OS, overall survival; COS, conditional overall survival. |
Although there were no statistical differences in the actuarial DFS in each subgroup (Figure 3A, E, I), similar changes in CDFS3 and the annual hazard of death were presented at high levels of AABR low levels of AHLR and FF-HL (Figure 3B–D, F–H, J–L). Unlike CDFS3 in the subgroups, COS3, actuarial OS and COS probabilities illustrated similar decreasing trends in both AHLR and FF-HL groups (Figures S10A, B, D, E and S11A, B, D, E). The hazard of death in the low AHLR and FF-HL groups followed the same stable trend as the whole COS3 (Figures S10C and 11C), whereas the trend in the high AHLR and FF-HL groups was unstable (Figures S10F and 11F).
The probabilities of survival were irregular based on the BCLC system and CP scores, even though OS was significant in these risk-stratifications (Figure 7A, B, D, E). The curves of the annual hazard of death differed from the regularity of the full patient population (Figure 7C and F).
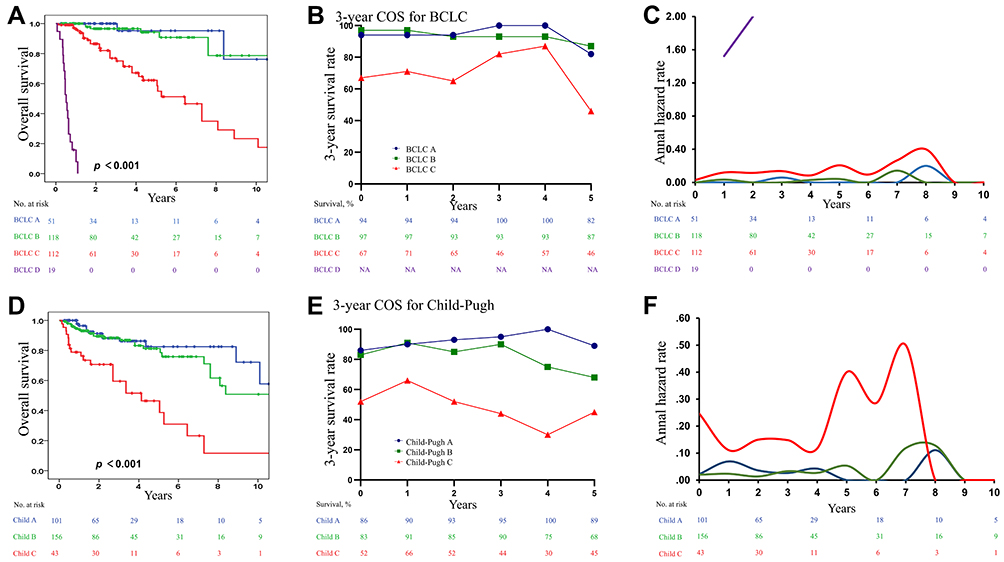 |
Figure 7 Analysis of OS and COS based on BCLC method (A–C) and risk stratification of Child-Pugh score (D–F). OS curves (A), 3-year COS for re-survival 1–5 years (B), and smoothed hazard plots for annual rate of death (C) based on BCLC system; (D) OS curves (D), 3-year conditional COS for re-survival 1–5 years (E), smoothed hazard plots for annual rate of death (F) based on Child-Pugh score. Abbreviations: OS, overall survival; BCLC, Barcelona Clinic Liver Cancer. |
Discussion
This study evaluated the prognostic significance of FF-HL and AHLR in patients with confirmed HCC with and the altered CDFS possibility increasing dynamically. Further analysis showed that FF-HL and AHLR had greater predictive abilities and were independent predictors of OS and PFS, respectively. Furthermore, CDFS3 compared to accurate 3-year DFS increased slightly at low levels of AHLR and FF-HL. The annual hazard of death showed a stable trend in the total population. These findings represented promising lipid-associated prognostic marker for HCC and provided some time-based survival information.
Study28 has pointed out that LDL-C level higher than 117mg/dL was found to be related to tumor stage, poorer prognosis, high proliferation rates, and clinical advancement. LDL-C level above 144 mg/dL was also more likely to develop lymph node metastasis28 and were associated with a higher risk of recurrence.29 However, other meta-analyses and prospective studies have found no association between LDL-C and cancer risk,12,30–32 and some even found it to be negatively associated with tumor risk.33 This suggests that the predictive value of LDL-C in different cancers is inconsistent. Apolipoproteins are key to the formation of HDL-C and LDL-C. A meta-analysis involving 8099 subjects in 13 studies found34 that apolipoprotein A-I is a major component of HDL and is involved in the prognosis of several cancers. Low levels of apolipoprotein A-I produced shorter OS in HCC (HR=0.46, 95% CI: 0.27–0.65, p <0.001), suggesting that low levels of apolipoprotein A-I are an important poor prognostic risk factor for OS. A previous study1 found that apolipoprotein B was positively associated with overall cancer incidence in common cancers such as breast, lung, colorectal and prostate cancers. In addition, albumin is one of factors in the liver functional scores, and determines some clinical decisions and affects the prognosis of patients. These parameters can predict survival to some extent, but AABR, AHLR or FF-HL have rarely been reported in cancer. It is unclear whether AABR, AHLR or FF-HL can predict the prognosis of HCC patients.
In this study, time-dependent ROC analysis revealed that FF-HL was a more powerful indicator of OS than other factors including AABR, AHLR, AB-HL, FF-AB, and FFAR. High levels of FF-HL (>840.3) were more likely to cause poor survival in patients with chronic viral infection, age <60 years, male, vascular invasion or liver metastases, and portal vein tumor thrombosis, suggesting that FF-HL could reflect tumor progression. Survival analyses suggested that both high levels of FF-HL and AHLR had significantly lower OS and PFS than the low-level groups. Multivariable analyses also identified FF-HL to be an independent predictor of OS and AABR to be an independent predictor of PFS.
In this study, although we excluded those patients with type 2 diabetes, atherosclerosis, hyperlipidemia, fatty liver and metabolic syndrome, these did not indicate that the enrolled patients had no fatty liver or non-alcoholic fatty liver disease (NAFLD) in the past. NAFLD is characterized by the excessive accumulation of lipids in the liver due to increased levels of FFA and has been fully recognized in glucose abnormalities and fatty acid metabolism.35 Although hepatic lipid overload is closely related to the development of HCC and has been proved to be an independent risk factor for HCC, the contribution of fatty acid metabolism is not very clear.36 The process from hepatic lipid accumulation to NAFLD with tissue necrosis and inflammation, and from NAFLD to HCC is complex. The current studies cannot fully reveal the complete mechanism of lipids in tumorigenesis and progression. Nor can our study fully explain the specificity in patients with NAFLD-related HCC. AFP37 is the most widely used marker to predict the progression and prognosis in HCC patients, as well as the practical applications of the CP score and BCLC system.38 In this study, AFP was identified as a predictor of OS but not as an independent biomarker. Additionally, ROC analysis also showed that FF-HL had more potential than AFP to predict OS, DFS and PFS after two years. However, these failed to analyze the prognostic significance of OS and PFS for both groups of FF-HL or AHLR for risk stratification including the AFP levels, CP score, and BCLC system, which may affect their survival. These indicate that FF-HL may be a superior marker, compared with AFP, for predicting the prognosis of HCC patients compared to AFP, in addition to distinguishing the survival significance of risk stratifications.
Interestingly, our results further suggest that the survival possibility slightly increased dynamically with elapsed time for patients with HCCs. CDFS3 increased in the total cohorts although DFS were not significant in these groups. Further analysis showed a factor-dependent pattern: the low levels of AHLR and FF-HL and the high AABR groups had an initially higher hazard of death at year 1, 5, and 9, which the ninth year had a maximum increase, whereas other groups were not analyzed due to the small samples. These findings represented a marked consistency of prognosis in the different groups of lipid-associated factors over time even the actuarial DFS was not significant, providing time-dependent survival information, similar as the observations in the previous research.19–22,24 Furthermore, our results of a stable annual hazard of death before year 7 or 8 and COS3 about 75–85% for patients who still survived at 3 years when diagnosed, and more strikingly in the higher risk groups, demonstrated a good long-term outcome, which was similar to this increasing evidence.19–22,24
In our studies, we did not observe consistency in COS3 and the annual hazard of death in each risk category. The prior report39 found different risk stratification might have heterogeneous prognosis for specific sub-population of certain types of cancers. Thus, the results for COS3 based on the CP score and the BCLC system might not be suitable to predict conditional survival or the annual hazard of death. One possible explanation might be that the several prognostic factors of the CP score or BCLC system together interfere with their predictive value despite these factors are known to predict shorter OS.40 Many patients had shorter survival, especially those with many poor prognostic factors. Those predictors that initially have different predictive abilities were most likely to achieve a poor prognosis in the following years, but there was no regularity. Therefore, these emphasized the value of improving existing prognostic factors. Furthermore, CDFS3 and COS3 could be used as indicators for clinical applications to validate the accuracy of novel biomarkers.
On the other hand, the clinical implication of these indicators is better than a single lipid-associated parameter for predicting OS and PFS and can be used as non-tumor biomarkers to complement tumor-related parameters, including ECOG score, AFP levels, and risk stratification, etc. On the other hand, these are helpful in predicting OS and DFS in patients who survive for a certain period of time, and facilitate follow-up and monitoring of patients’ survival.
The study was limited by its retrospective design, potential recall bias, and the inability to examine the predictive ability of the potential impacts of heterogeneity of treatment patterns over a long time span based on a single-center experience. Additionally, because patients with high- AHLR and high-FF-HL had severe disease and shorter survival times, the samples with high-AHLR and FF-HL were significantly smaller than the lower groups, which might have an impact on the results. Finally, the optimal cut-off value may be identified by a different study population. In summary, further prospective studies are desired.
Conclusion
FF-HL is an independent predictor of OS and outperforms other lipid-associated indexes and AFP in patients with HCC. Accordingly, FF-HL has survival significance and complements the predictive ability of OS in younger patients. In addition, while the traditional DFS method did not yield statistical significance, CDFS, COS, and annual hazard analyses might be more accurate for patients who have survived several years. Generally, the results suggest that FF-HL might be a potential biomarker for predicting actuarial and conditional survival in clinical decision-making.
Abbreviations
FF-HL, (free fatty acid: high-density lipoproteins) ratio; HCC, hepatocellular carcinoma; ROC, receiver operating characteristic; OS, overall survival; PFS, progress-free survival; DFS, disease-free survival; CDFS3, 3-year conditional DFS; AHLR, (albumin: high-density lipoproteins) ratio; COS3, 3-year conditional OS; HDL-C, high-density lipoprotein cholesterol; LDL-C, low-density lipoprotein cholesterol; FFA, free fatty acids; BCLC, Barcelona Clinic Liver Cancer; AFP, alpha fetoprotein; COS, conditional OS; CDFS, conditional DFS; HBV, Hepatitis B Virus; CP, Child-Pugh; CT, computed tomography; MRI, magnetic resonance imaging; AABR, (albumin: apolipoprotein B) ratio; AHLR, (albumin: high-density lipoproteins concentrations) ratio; FF-HL, (free fatty acid: high-density lipoproteins concentrations); AB-HL, (apolipoprotein B: high-density lipoproteins concentrations); FF-AB, (free fatty acid: apolipoprotein B); FFAR, (free fatty acid: albumin) ratio; IQR, interquartile range; AUC, area under the curve; PS, performance status; NAFLD, non-alcoholic fatty liver disease.
Data Sharing Statement
The datasets generated during the current study are not publicly available due the failed consent to publish about the patients’ information but are available from the corresponding author on reasonable request.
Ethics Approval and Consent to Participate
This study was performed in line with the principles of the Declaration of Helsinki. Approval was granted by the Ethics Committee of Peking University International Hospital.
Consent to Publish
Not available. No individual person’s data in any form included any individual details, images or videos.
Acknowledgments
The authors wish to thank all participating patients, oncologists, pathologists and statisticians.
Author Contributions
All authors have made contributions in the conception, study design, execution, acquisition of data, analysis and interpretation.
All authors have drafted, revised and reviewed the article.
All authors have agreed on the journal to which the article will be submitted.
All authors reviewed and agreed on all versions of the article before submission, during revision, the final version accepted for publication, and any significant changes introduced at the proofing stage.
All authors agree to take responsibility and be accountable for the contents of the article.
Funding
The Beijing Xisike Clinical Oncology Research Foundation (grant no. Y-BMS2019-015); Peking University International Hospital Research Funds (No. YN2018QN09).
Disclosure
The authors report no conflicts of interest in this work.
References
1. Agosti P, Sabbà C, Mazzocca A. Emerging metabolic risk factors in hepatocellular carcinoma and their influence on the liver microenvironment. Biochim Biophys Acta Mol Basis Dis. 2018;1864(2):607–617. doi:10.1016/j.bbadis.2017.11.026
2. Santos CR, Schulze A. Lipid metabolism in cancer. FEBS J. 2012;279(15):2610–2623. doi:10.1111/j.1742-4658.2012.08644.x
3. Zhang F, Du GW. Dysregulated lipid metabolism in cancer. World J Biol Chem. 2012;3(8):167–174. doi:10.4331/wjbc.v3.i8.167
4. Anderson NM, Mucka P, Kern JG, et al. The emerging role and targetability of the TCA cycle in cancer metabolism. Protein Cell. 2018;9(2):216–237. doi:10.1007/s13238-017-0451-1
5. Li JJ, Condello S, Thomes-Pepin J, et al. Lipid desaturation is a metabolic marker and therapeutic target of ovarian cancer stem cells. Cell Stem Cell. 2017;20(3):303–314. doi:10.1016/j.stem.2016.11.004
6. Beloribi-Djefaflia S, Vasseur S, Guillaumond F. Lipid metabolic reprogramming in cancer cells. Oncogenesis. 2016;5(1):e189. doi:10.1038/oncsis.2015.49
7. Li X, Tang H, Wang J, et al. The effect of preoperative serum triglycerides and high-density lipoprotein-cholesterol levels on the prognosis of breast cancer. Breast. 2017;32:1–6. doi:10.1016/j.breast.2016.11.024
8. Wang Y, Wang ZQ, Wang FH, et al. Predictive value of chemotherapy-related high-density lipoprotein cholesterol (HDL) elevation in patients with colorectal cancer receiving adjuvant chemotherapy: an exploratory analysis of 851 cases. Oncotarget. 2016;7(35):57290–57300. doi:10.18632/oncotarget.10145
9. Jiang SS, Weng DS, Jiang L, et al. The clinical significance of preoperative serum cholesterol and high-density lipoprotein-cholesterol levels in hepatocellular carcinoma. J Cancer. 2016;7(6):626–632. doi:10.7150/jca.13837
10. Wang Q, Lau WY, Zhang B, et al. Preoperative total cholesterol predicts postoperative outcomes after partial hepatectomy in patients with chronic hepatitis B- or C-related hepatocellular carcinoma. Surgery. 2014;155(2):263–270. doi:10.1016/j.surg.2013.08.017
11. Zhu B, Zhang J, Zheng Q, et al. Free fatty acid is a promising biomarker in triage screening for patients with colorectal cancer: a case-control study. Cancer Manag Res. 2021;13:3749–3759. doi:10.2147/CMAR.S307753
12. Borgquist S, Butt T, Almgren P, et al. Apolipoproteins, lipids and risk of cancer. Int J Cancer. 2016;138(11):2648–2656. doi:10.1002/ijc.30013
13. Diakos CI, Charles KA, McMillan DC, et al. Cancer-related inflammation and treatment effectiveness. Lancet Oncol. 2014;15(11):e493–503. doi:10.1016/S1470-2045(14)70263-3
14. Liu C, Duan LG, Lu WS, et al. Prognosis evaluation in patients with hepatocellular carcinoma after hepatectomy: comparison of BCLC, TNM and Hangzhou criteria staging systems. PLoS One. 2014;9(8):103228. doi:10.1371/journal.pone.0103228
15. Lim KC, Chow PK, Allen JC, et al. Microvascular invasion is a better predictor of tumor recurrence and overall survival following surgical resection for hepatocellular carcinoma 19 compared to the Milan criteria. Ann Surg. 2011;254(1):108–113. doi:10.1097/SLA.0b013e31821ad884
16. Sasaki K, Shindoh J, Margonis GA, et al. Effect of background liver cirrhosis on outcomes of hepatectomy for hepatocellular carcinoma. JAMA Surg. 2017;152(3):e165059. doi:10.1001/jamasurg.2016.5059
17. Li W, Liu K, Chen Y, et al. Role of alpha-fetoprotein in hepatocellular carcinoma drug resistance. Curr Med Chem. 2021;28(6):1126–1142. doi:10.2174/0929867327999200729151247
18. Spolverato G, Kim Y, Ejaz A, et al. Conditional probability of long-term survival after liver resection for intrahepatic cholangiocarcinoma: a multi-institutional analysis of 535 patients. JAMA Surg. 2015;150(6):538–545. doi:10.1001/jamasurg.2015.0219
19. Hu LS, Zhang XF, Weiss M, et al. Redefining conditional overall and disease-free survival after curative resection for intrahepatic cholangiocarcinoma: a multi-institutional, international study of 1221 patients. J Gastrointest Surg. 2020;24(12):2756–2765. doi:10.1007/s11605-019-04472-x
20. Park YK, Song SK, Kim BW, et al. Conditional survival analysis demonstrates that recurrence risk of surgically treated hepatocellular carcinoma evolves with time. J Gastrointest Surg. 2017;21(8):1237–1244. doi:10.1007/s11605-017-3437-7
21. Shah MM, Meyer BI, Rhee K, et al. Conditional survival analysis of hepatocellular carcinoma. J Surg Oncol. 2020;122(4):684–690. doi:10.1002/jso.26049
22. Dong J, Zhu Y, Ma F, et al. Conditional disease-free survival after liver transplantation for hepatocellular carcinoma: a two-center experience. Medicine. 2016;95(31):e4383. doi:10.1097/MD.0000000000004383
23. Zhao S, Wang M, Yang Z, et al. Comparison between Child-Pugh score and Albumin-Bilirubin grade in the prognosis of patients with HCC after liver resection using time-dependent ROC. Ann Transl Med. 2020;8(8):539. doi:10.21037/atm.2020.02.85
24. Liu C, Xiao GQ, Yan LN, et al. Value of α-fetoprotein in association with clinicopathological features of hepatocellular carcinoma. World J Gastroenterol. 2013;19(11):1811–1819. doi:10.3748/wjg.v19.i11.1811
25. Camp RL, Dolled-Filhart M, Rimm DL. X-tile: a new bio-informatics tool for biomarker assessment and outcome-based cut-point optimization. Clin Cancer Res. 2004;10(21):3749–3759. doi:10.1158/1078-0432.CCR-04-0713
26. Cucchetti A, Piscaglia F, Cescon M, et al. Conditional survival after hepatic resection for hepatocellular carcinoma in cirrhotic patients. Clin Cancer Res. 2012;18(16):4397–4405. doi:10.1158/1078-0432.CCR-11-2663
27. Han G, Schell MJ, Kim J. Improved survival modeling in cancer research using a reduced piecewise exponential approach. Stat Med. 2014;33(1):59–73. doi:10.1002/sim.5915
28. Rodrigues DSC, Fonseca I, Dias S, et al. Plasma level of LDL-cholesterol at diagnosis is a predictor factor of breast tumor progression. BMC Cancer. 2014;14:132. doi:10.1186/1471-2407-14-132
29. Nowak C, Ärnlöv J. A Mendelian randomization study of the effects of blood lipids on breast cancer risk. Nat Commun. 2018;9(1):3957. doi:10.1038/s41467-018-06467-9
30. Touvier M, Fassier P, His M, et al. Cholesterol and breast cancer risk: a systematic review and meta-analysis of prospective studies. Br J Nutr. 2015;114(3):3457–3473. doi:10.1017/S000711451500183X
31. Chandler PD, Song YQ, Lin J, et al. Lipid biomarkers and long-term risk of cancer in the Women’s Health Study. Am J Clin Nutr. 2016;103(6):1397–1407. doi:10.3945/ajcn.115.124321
32. Ni HB, Liu HX, Gao R. Serum lipids and breast cancer risk: a meta-analysis of prospective cohort studies. PLoS One. 2015;10(11):0142669. doi:10.1371/journal.pone.0142669
33. Martin LJ, Melnichouk O, Huszti E, et al. Serum lipids, lipoproteins, and risk of breast cancer: a nested case-control study using multiple time points. J Natl Cancer Inst. 2015;107(5):032. doi:10.1093/jnci/djv032
34. Zhang Y, Yang XJ. Prognostic significance of pretreatment Apolipoprotein A-I as a noninvasive biomarker in cancer survivors: a meta-analysis. Dis Markers. 2018;2018:1034037. doi:10.1155/2018/1034037
35. Lonardo A, Ballestri S, Marchesini G, et al. Nonalcoholic fatty liver disease: a precursor of the metabolic syndrome. Dig Liver Dis. 2015;47(3):181–190. doi:10.1016/j.dld.2014.09.020
36. Guri Y, Colombi M, Dazert E, et al. mTORC2 promotes tumorigenesis via lipid synthesis. Cancer Cell. 2017;32(6):807–823. doi:10.1016/j.ccell.2017.11.011
37. Zheng Y, Zhu M, Li M. Effects of alpha-fetoprotein on the occurrence and progression of hepatocellular carcinoma. J Cancer Res Clin Oncol. 2020;146(10):2439–2446. doi:10.1007/s00432-020-03331-6
38. Reig M, Forner A, Rimola J, et al. BCLC strategy for prognosis prediction and treatment recommendation Barcelona Clinic Liver Cancer (BCLC) staging system. The 2022 update. J Hepatol. 2021;4:45.
39. Gao H, Ji X, Liu X, et al. Conditional survival and hazards of death for peripheral T-cell lymphomas. Aging. 2021;13(7):10225–10239. doi:10.18632/aging.202782
40. Huang F, Gao J. Modified Child-Pugh grade vs albumin-bilirubin grade for predicting prognosis of hepatocellular carcinoma patients after hepatectomy. World J Gastroenterol. 2020;26(7):749–758. doi:10.3748/wjg.v26.i7.749
 © 2022 The Author(s). This work is published and licensed by Dove Medical Press Limited. The
full terms of this license are available at https://www.dovepress.com/terms
and incorporate the Creative Commons Attribution
- Non Commercial (unported, 3.0) License.
By accessing the work you hereby accept the Terms. Non-commercial uses of the work are permitted
without any further permission from Dove Medical Press Limited, provided the work is properly
attributed. For permission for commercial use of this work, please see paragraphs 4.2 and 5 of our Terms.
© 2022 The Author(s). This work is published and licensed by Dove Medical Press Limited. The
full terms of this license are available at https://www.dovepress.com/terms
and incorporate the Creative Commons Attribution
- Non Commercial (unported, 3.0) License.
By accessing the work you hereby accept the Terms. Non-commercial uses of the work are permitted
without any further permission from Dove Medical Press Limited, provided the work is properly
attributed. For permission for commercial use of this work, please see paragraphs 4.2 and 5 of our Terms.