Back to Journals » Diabetes, Metabolic Syndrome and Obesity » Volume 14
Lipid Accumulation Product is Associated with Urinary Albumin-creatinine Ratio in Chinese Prediabitic Population: A Report from the REACTION Study
Authors Liu Y, Wang Y, Wang J ![]() , Chen K, Jin L, Wang W, Gao Z, Tang X, Yan L, Wan Q, Luo Z, Qin G
, Chen K, Jin L, Wang W, Gao Z, Tang X, Yan L, Wan Q, Luo Z, Qin G ![]() , Chen L, Mu Y
, Chen L, Mu Y ![]()
Received 15 March 2021
Accepted for publication 30 April 2021
Published 28 May 2021 Volume 2021:14 Pages 2415—2425
DOI https://doi.org/10.2147/DMSO.S310751
Checked for plagiarism Yes
Review by Single anonymous peer review
Peer reviewer comments 3
Editor who approved publication: Professor Ming-Hui Zou
Yang Liu,1,2,* Yun Wang,1,2,* Jie Wang,2 Kang Chen,2 Lingzi Jin,3 Weiqing Wang,4 Zhengnan Gao,5 Xulei Tang,6 Li Yan,7 Qin Wan,8 Zuojie Luo,9 Guijun Qin,10 Lulu Chen,11 Yiming Mu2
1Graduate School, Chinese PLA General Hospital, Beijing, People’s Republic of China; 2Department of Endocrinology, The First Medical Center of Chinese PLA General Hospital, Beijing, People’s Republic of China; 3Department of International Medical Services, Peking Union Medical College Hospital (Xidan Campus), Beijing, People’s Republic of China; 4Shanghai National Research Centre for Endocrine and Metabolic Diseases, State Key Laboratory of Medical Genomics, Shanghai Institute for Endocrine and Metabolic Diseases, Ruijin Hospital, Shanghai Jiaotong University School of Medicine, Shanghai, People’s Republic of China; 5Department of Endocrinology, Dalian Central Hospital, Dalian, Liaoning, People’s Republic of China; 6Department of Endocrinology, First Hospital of Lanzhou University, Lanzhou, Gansu, People’s Republic of China; 7Department of Endocrinology, Zhongshan University Sun Yat-Sen Memorial Hospital, Guangzhou, Guangdong, People’s Republic of China; 8Department of Endocrinology, Southwest Medical University Affiliated Hospital, Luzhou, Sichuan, People’s Republic of China; 9Department of Endocrinology, First Affiliated Hospital of Guangxi Medical University, Nanning, Guangxi, People’s Republic of China; 10Department of Endocrinology, First Affiliated Hospital of Zhengzhou University, Zhenzhou, Henan, People’s Republic of China; 11Department of Endocrinology, Wuhan Union Hospital, Huazhong University of Science and Technology, Wuhan, Hubei, People’s Republic of China
*These authors contributed equally to this work
Correspondence: Yiming Mu
Department of Endocrinology, The First Medical Center of Chinese PLA General Hospital, No. 28 Fuxing Road, Beijing, 100853, People’s Republic of China
Tel +86-10-5549 9001
Email [email protected]
Background: Lipid accumulation product (LAP) as a powerful marker of visceral obesity is an independent risk factor of chronic kidney disease. The present study attempted to explore the association between LAP and albuminuria in prediabetic individuals.
Methods: We conducted a cross-sectional study and enrolled 26,529 participants with prediabetes over 40 years old with prediabetes from seven provinces in China. LAP was calculated from waist circumference and fasting triglycerides. Elevated albuminuria was defined by urinary albumin-creatinine ratio (uACR) ≥ 30 mg/g. Propensity score matching was applied to reduce bias, comparison between LAP and other traditional visceral obesity indices was performed and multiple logistic regression models were conducted to assess the association between LAP and albuminuria in the prediabetic population.
Results: Individuals with uACR ≥ 30 mg/g were older and had higher BP, BMI, WC, TG, fasting insulin, glycohemoglobin and LAP, as well as lower eGFR and HDL level. Multiple logistic regression analysis showed elevated LAP was associated with increased odds of albuminuria (OR [95%CI]Q2 vs Q1 1.09 [0.94, 1.27], OR [95%CI]Q3 vs Q1 1.13 [0.97, 1.31], OR [95%CI]Q4 vs Q1 1.42 [1.21, 1.67], P for trend=0.018), and superior over waist-to-hip ratio or waist-to-height ratio. Stratification indicated that the prediabetic population with higher LAP level and characterized by female gender, middle age, being overweight, and rise in blood pressure were more likely to have increased uACR.
Conclusion: Elevated level of LAP was associated with increased albuminuria in the prediabetic population in China.
Keywords: albuminuria, lipid accumulation product, prediabetes, visceral obesity
Plain Language Summary
1. This is the first multicenter, large-sampled cross-sectional study of association between Lipid accumulation product (LAP) and urinary albumin to creatinine ratio (uACR) in the Chinese prediabetic population.
2. LAP is positively correlated with increased uACR. Prediabetic individuals with higher LAP level and characterized by female gender, middle age, being overweight and rise in blood pressure were more likely to have increased uACR.
Introduction
Data from the International Diabetes Federal Diabetes Atlas 2019 indicated that prediabetes is an increasingly common global condition as 1 in 13 adults have impaired glucose tolerance.1 The estimated standardized prevalence of prediabetes among the Chinese adult population was 35.7%.2 Compared with nondiabetic population, individuals with prediabetes had a 15% higher risk of prevalent chronic kidney disease (CKD) (OR: 1.15, 95%CI: 1.02–1.32) according to the REACTION study.3 Besides, dramatically increased prevalence of obesity also substantially affected the patterns of CKD. Adjusted hazard ratios for declined estimated glomerular filtration rate (eGFR) were 2.02 (95%CI: 1.80–2.27) with body mass indices (BMI) 40 kg/m2 comparing to BMI of 25 kg/m2,4 A recent UK Biobank study that enrolled 0.4 million people proved that each 5 kg/m2 ascending in BMI was associated with a 47% (46–49%) increase in the odds of higher urinary albumin-to-creatinine ratio (uACR) category.5
To further evaluate obesity-associated risks, an alternative continuous index of lipid over accumulation, the lipid accumulation product (LAP), was calculated from waist circumference (WC, cm) and fasting triglycerides (TGs) (mmol/L): (WC: 65)⨰TG (men) and (WC: 58)⨰TG (women), initially for better identifying visceral obesity and insulin resistance, elevated glucose, and diabetes than BMI did.6 Recent studies found that LAP also acquitted itself well in predicting cardiovascular risks7,8 and identifying CKD9,10 in the healthy population. However, evidence in association between LAP and renal dysfunction in the prediabetic population is lacking, thus the aim of our study was to explore the association between LAP and albuminuria in the prediabetic population.
Methods
Participants and Study Design
Cross-sectional data from seven provinces across China was collected in this study, as a part of the ongoing risk evaluation of cancers in Chinese diabetic individuals a longitudinal (REACTION) study. Baseline assessments included a standardized questionnaire supplemented by interviews, standardized physical and functional measurements and the collection of biological samples. A total of 47,807 participants over 40 years old were recruited from May to December 2011. The protocol was approved by the Clinical Research Ethics Review Board of Rui-Jin Hospital (No. 2014–25), which was consistent with the Declaration of Helsinki. All participants gave written informed consent.
Participants with self-reported diabetes, kidney diseases, or undergoing lipid-lowering, antihypertensive (including angiotensin converting enzyme inhibitors or angiotensin receptor blocker) or hypoglycemic treatment, and those without data on adiposity measures, blood pressure, glycosylated hemoglobin (HbA1c), fasting blood glucose (FBG), 2 h postload blood glucose (PBG), urinary albumin or urinary creatinine were excluded. In total 26,529 participants with prediabetes were enrolled. Further propensity matching was used to reduce potential bias. Eventually, 16,631 eligible participants were ultimately included in the final analysis (Figure 1).
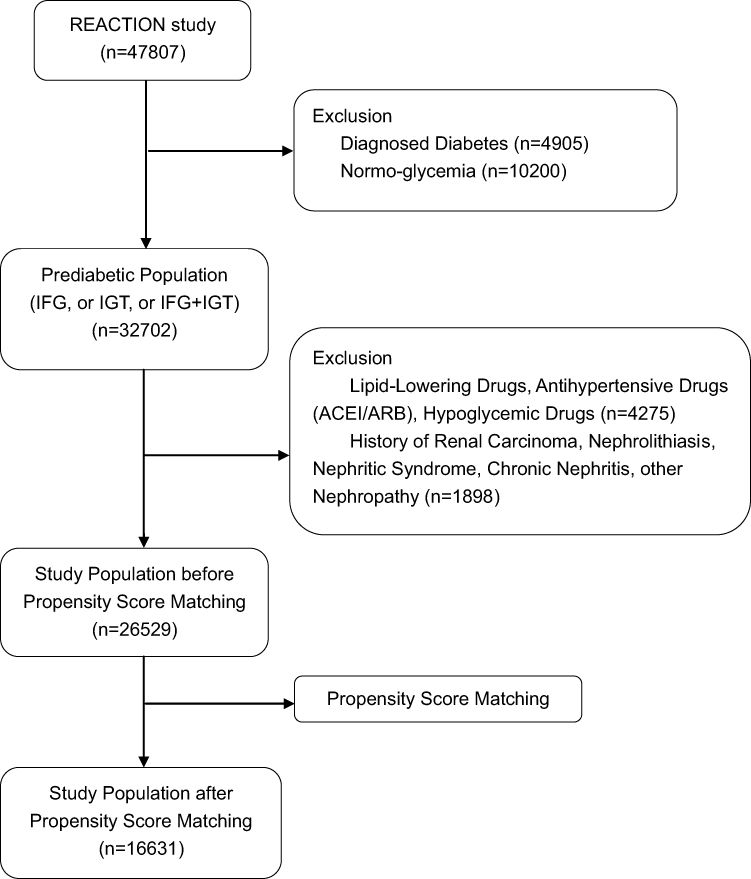 |
Figure 1 Flow chart of study population. |
Data Collection and Measurements
The REACTION study consists of a standardized interview, followed by a physical examination and blood and urine collection at authorized examination centers. Self-reported information on demographics (age, gender), health conditions (diagnosed hypertension, cardiovascular diseases, and family history of diabetes), smoking and drinking habits were obtained during the interview. The prescription medication information was recorded by the interviewer of the medication names from the package provided by the participant. Height and weight were measured during the examination. BMI was computed by dividing weight in kilograms by height in meters squared (kg/m2). Waist circumference (WC) and hip circumference (HC) were measured in centimeters. LAP, waist-to-hip ratio (WHR) and waist-to-height (WHtR) Ratio were computed. Blood pressure (BP) was measured three times with intervals of one minute in a seated position after a resting period of five minutes.
After 8–12 h overnight fasting, venous blood samples were collected followed by second venipuncture sampling in 2 h after oral glucose tolerance test (OGTT): consumption of a 300 mL glucose solution containing 75 g glucose within 5 min. Fasting insulin was tested via photochemiluminescence; FBG, PBG, HbA1c, high-density lipoprotein cholesterol (HDL), low-density lipoprotein cholesterol (LDL), total cholesterol (TC), TG, alanine transferase (ALT), aspartate transferase (AST) and serum creatinine were measured via enzymatic methods.
Participants answering “no” to self-report diagnosed diabetes underwent OGTT. Prediabetes is defined as having either impaired glucose tolerance (IGT) with 2-h postload plasma glucose (PPG) ≥7.8 mmol/L but <11.1 mmol/L and/or impaired fasting glucose (IFG) with fasting plasma glucose (FPG) ≥6.0 mmol/L but <7.0 mmol/L.11 Prediabetes was defined as IFG in absence of IGT or a combination of both.12
The Chronic Kidney Disease Epidemiology Collaboration formula fitting Asian females was applied to calculate eGFR (mL/min/1.73 m2).13 Random spot urine samples were obtained, and urine albumin and creatinine were measured using frozen specimens. Urine albumin was measured using solid-phase fluorescence immunoassay; urine creatinine was measured using the modified Jaffe kinetic method in the same laboratory. The uACRs were calculated using formula as: urinary albumin (mg)/urinary creatinine (g). Each authorized examination center used the same range and units of measurement. The uACR was divided into two groups: normo-albuminuria: uACR <30 mg/g and increased albuminuria: uACR ≥30 mg/g, indicating kidney damage according to KDIGO-CKD guidelines.14 LAP was divided into quartiles for the analysis.
Based on daily cigarette consumption, smokers were classified into regular smokers (at least one cigarette per day) and occasional smokers (less than one cigarette per day or seven cigarettes per week). Based on drinking frequency, regular drinkers were defined as drinking at least once a week for over six months and occasional drinkers drank no more than once a week.
Statistical Analysis
Statistical analysis was performed via Empower (R) version 2.2 (www.Empowerstats.com, X&Y Solutions Inc., Boston, MA, USA), R (http://www.Rproject.org) and SPSS version 26.0 (IBM Corp., Armonk, NY, USA). Propensity score matching was applied to control the bias of baseline characteristics between the two groups of uACRs. Matching was performed using a 1:4 ratio protocol to match all covariates, with a calliper width equal to 0.05 of the standard deviation of the logit of the propensity score. Continuous variables were presented as mean ±SD or median (IQR) for skewed variables. Categorical variables are presented as percentages (%). The Kruskal–Wallis test was applied for comparison of continuous variables between the uACR groups; chi-squared test was used to analyze categorical variable. Logistic regression analysis with unadjusted and multivariate-adjusted models was conducted to determine the association between LAP quartiles and the risk of increased albuminuria. Conventional risk factors were adjusted. Confounding factors that changed the matched ORs by at least 10% were also selected for adjustment. Model 1 was unadjusted. Model 2 was adjusted for age, sex and BMI. Model 3 was additionally adjusted for smoking, drinking, family history of diabetes, and CVD history, based on Model 2. Model 4 was further adjusted for SBP, DBP, HDL, FBG, PBG, and HbA1c based on Model 3. In all models, OR (95%CI) were calculated. To further examine the association between LAP quartiles and the risk of increased albuminuria, stratified analyses were performed with gender, age, BP (normal: systolic blood pressure (SBP) <120 and diastolic blood pressure (DBP) <80 mmHg, borderline BP: SBP: 120–139 and/or DBP 80–89 mmHg, hypertension: SBP ≥140 or DBP ≥90 mmHg); BMI: underweight (<18.5 kg/m2), normal weight (18.5–23.9 kg/m2), overweight (24–27.9 kg/m2), and obesity (≥28.0 kg/m2).15 Potential interactions between LAP quartiles and strata variables were assessed in the logistic regression analysis after fully adjustment. P-values <0.05 (two-sided) were considered statistically significant.
Results
Selected Characteristics by uACR Category
After propensity score matching, individuals with uACR ≥30 mg/g were older and had higher BP, BMI, WC, TG, fasting insulin, glycohemoglobin and LAP, as well as lower eGFR and HDL level than those with normo-albuminuria (P≤0.001) (Table 1). The percentage of participants with extreme obesity (defined as BMI ≥30 kg/m2) in uACR <30 mg/g group was 2.01% (n=281), and 5.64% (n=149) in uACR ≥30 mg/g group (Table S1). A slight but significant difference of both WHR (P=0.040) and WHtR (P=0.035) between uACRs groups was observed. In pairwise comparisons, those with increased albuminuria were more likely to be female (P≤0.001). Participants with increased albuminuria were more likely to be smokers or drinkers. The prevalence of CVD events was greater in individuals with increased uACR (2.73% vs 1.39%, P≤0.001). However, neither TC nor LDL presented significant difference among groups. Equilibrium was also seen in the prevalence of stroke (0.45% vs 0.64%, P=0.253) and myocardial infarction (0.15% vs 0.15%, P=0.988) in pairwise comparisons.
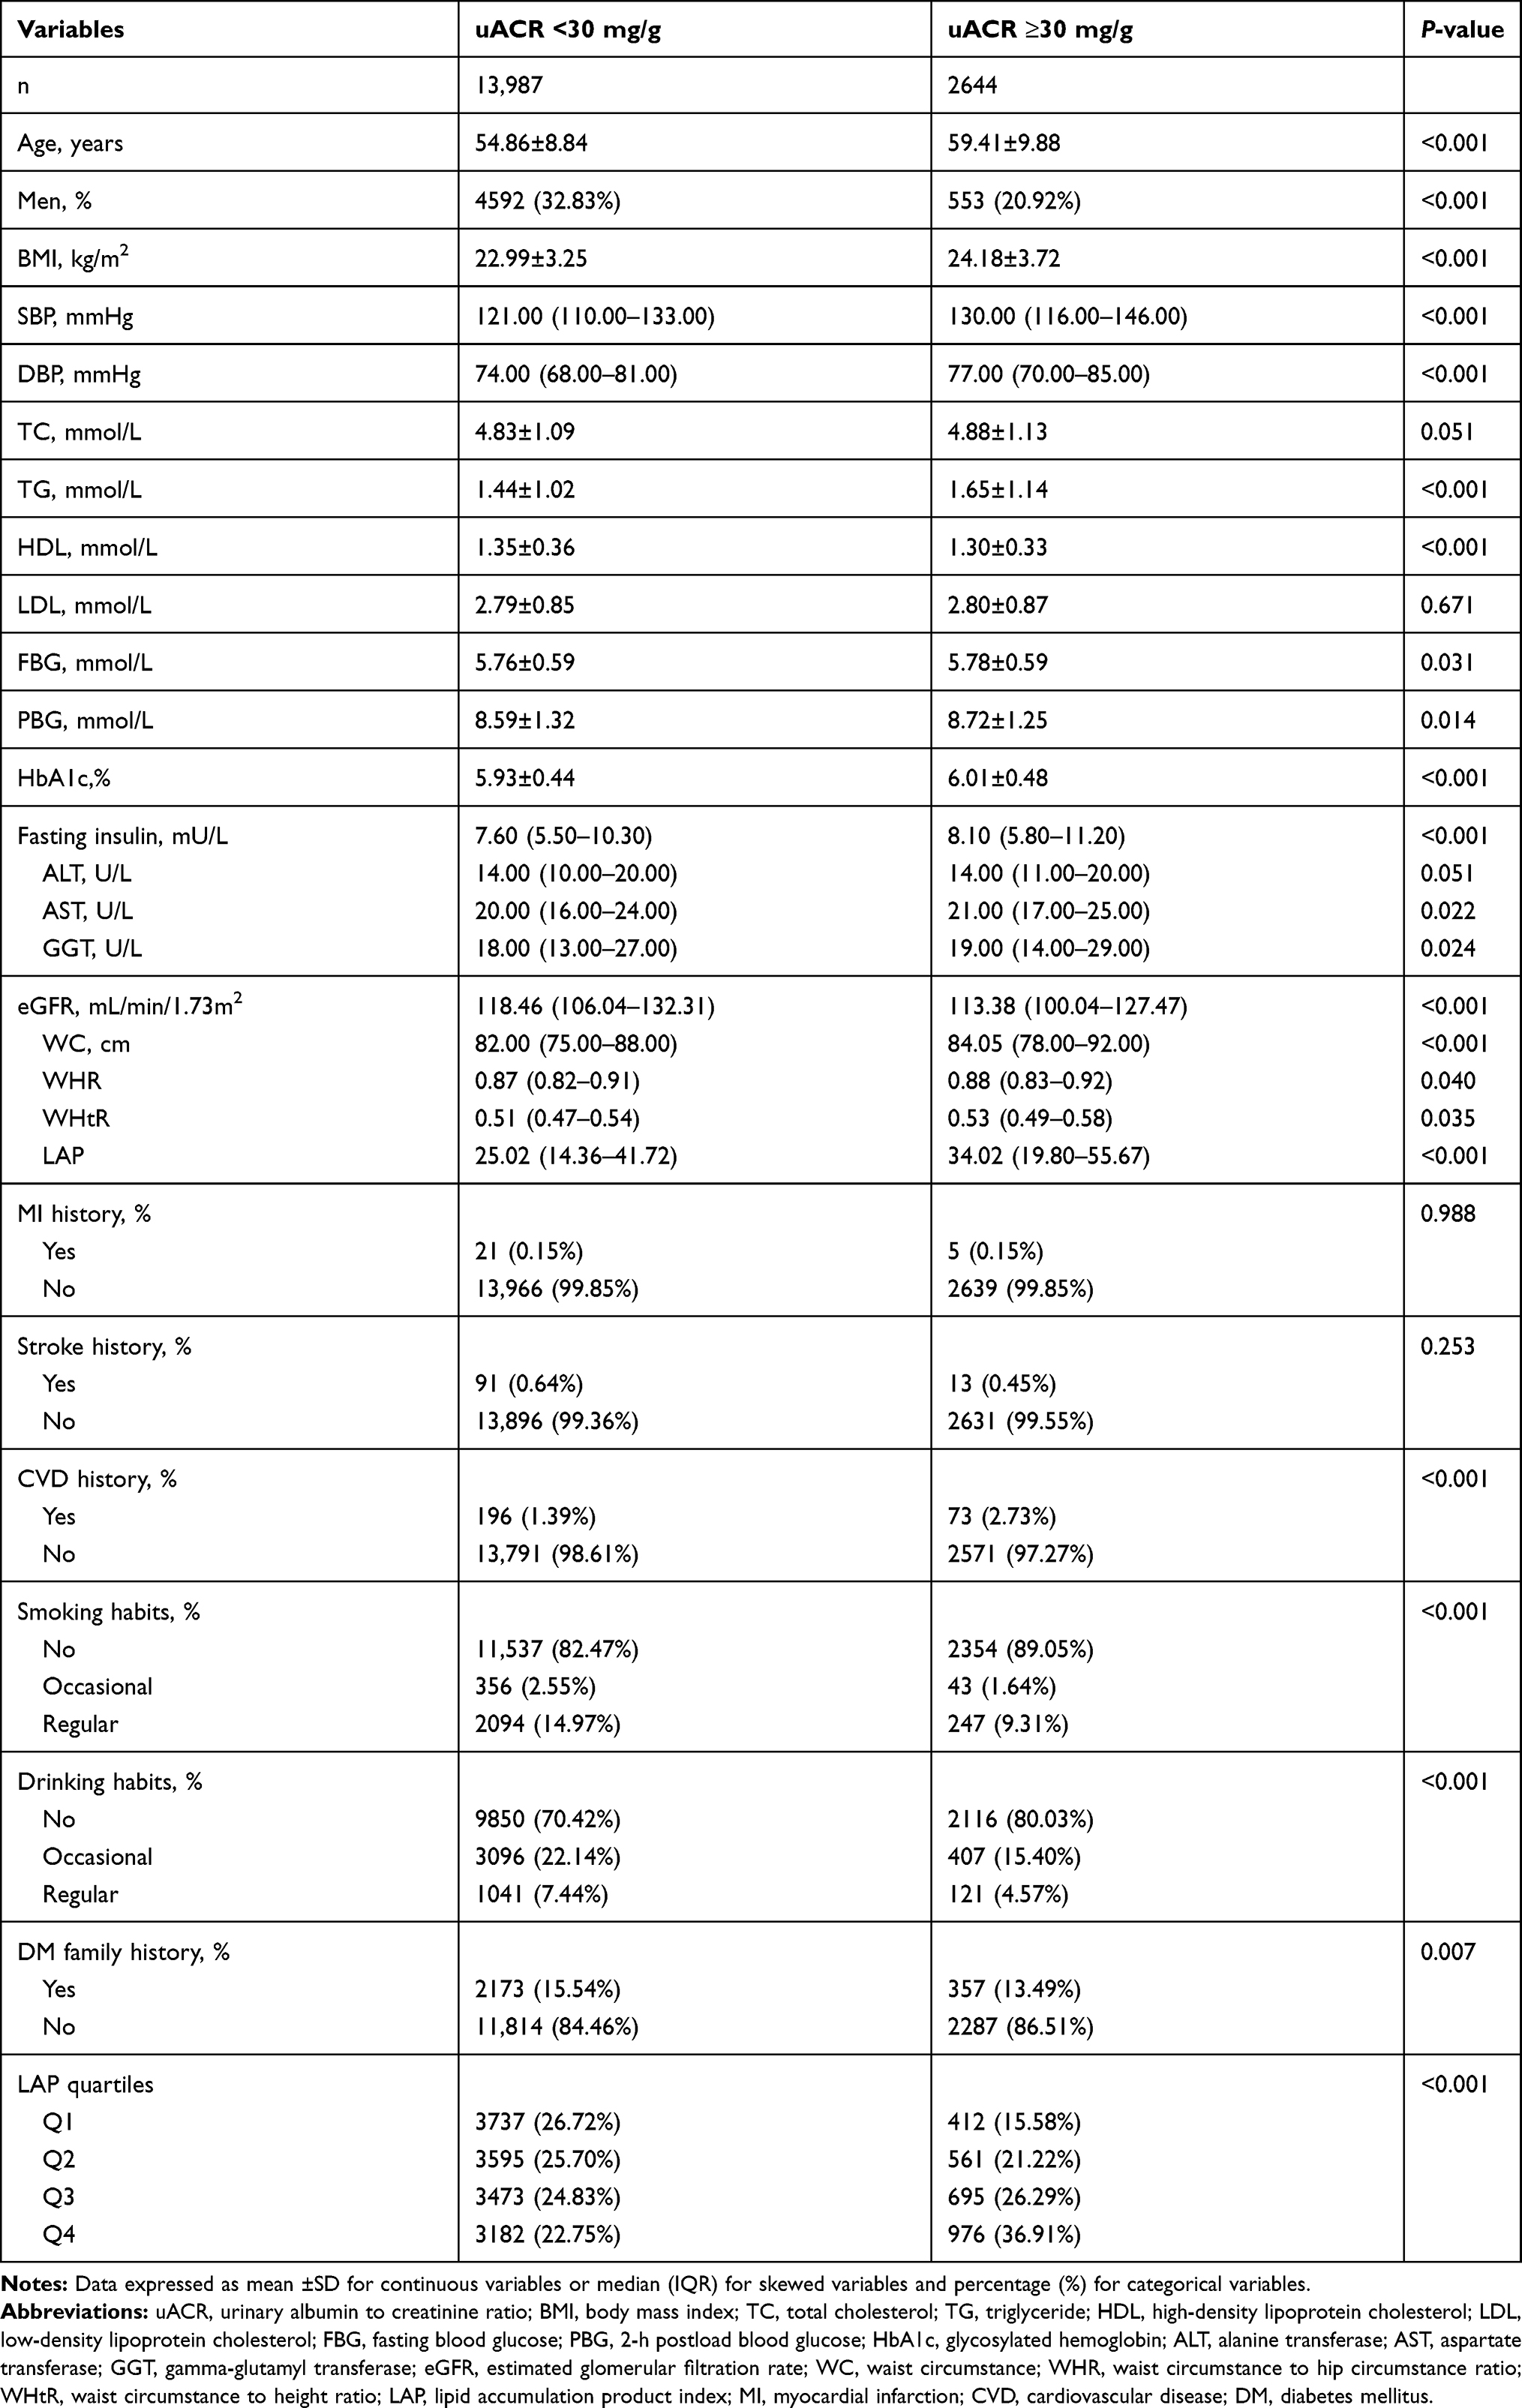 |
Table 1 Characteristics of Study Population by uACR Category After Propensity Score Matching |
Comparison of Central Adiposity Associated with Increased uACR
Multiple logistic regression models for odds of increased uACR with central adiposity indices including WHR, WHtR and LAP (Table S2) were constructed in the total population in unadjusted and fully adjusted models. Each index, both in its quartile and continuous form was significantly associated with increased uACR in the nonadjusted model. However, after further adjustments, only the fourth quartiles of LAP (OR: 1.42, 95%CI: 1.21–1.67, P<0.001) and the fourth quartile of WHtR (OR: 1.36, 95%CI: 1.18–1.57, P<0.001) remained significantly associated with increased uACR, whereas WHR was not. The association between uACR ≥30 mg/g and continuous values of the WHR, WHtR, and LAP was consistent with the finding delivered by categorical values: each unit elevation of LAP was associated with 34% higher odds of increased uACR (OR: 1.34: 95%CI: 1.00–1.68, P<0.001). No effect of interaction in WHR or WHtR with uACR was observed after adjustment (also Table S2). Compared to those classic adiposity indices, LAP was more likely to be closely associated with higher odds of increased uACR.
Associations Between Lipid Parameters and uACR
As a component of LAP, TG and other lipid parameters (TC, HDL-C and LDL-C) were further analyzed for their association with increased uACR after adjusting for multiple confounders in order to learn which lipid parameter was more closely related to increased albuminuria. Compared with TC, HDL-C, and LDL-C, although attenuated after full adjustment in Model 4, only the TG ≥2.3 mmol/L category was significantly associated with higher odds of increased uACR for both genders in all models (OR: 1.12, 95%CI: 1.03–1.51, P=0.042 in men; OR: 1.18, 95%CI: 1.00–1.35, P=0.026 in women; OR: 1.15, 95%CI: 1.01–1.31, P=0.040 in total population)(Table S3). HDL-C <1.0 mmol/L was significantly associated with increased uACR only in women in the fully adjusted model (OR: 1.14, 95%CI: 1.06–1.45, P=0.026) (also Table S3). There was no significant and independent association between TC or LDL-C and increased uACR.
Association of LAP Quartiles with Increased uACR
To investigate the stability of the association between LAP quartiles and increased uACR, multiple logistic regression analysis for the association between LAP quartiles and increased uACR in the prediabetic population were carried out (Table 2). Compared to participants with the first quartile of LAP, those with a higher level of LAP had higher odds for increased uACR among Models 1–3 (P for trend <0.001). After further adjustment for SBP, DBP, HDL, FBG, PBG, HbA1c, AST and GGT, the association was still significant in Model 4 (OR [95%CI]Q2 vs Q1 1.09 [0.94, 1.27], OR [95%CI]Q3 vs Q1 1.13 [0.97, 1.31], OR [95%CI]Q4 vs Q1 1.42 [1.21, 1.67], P for trend=0.018).
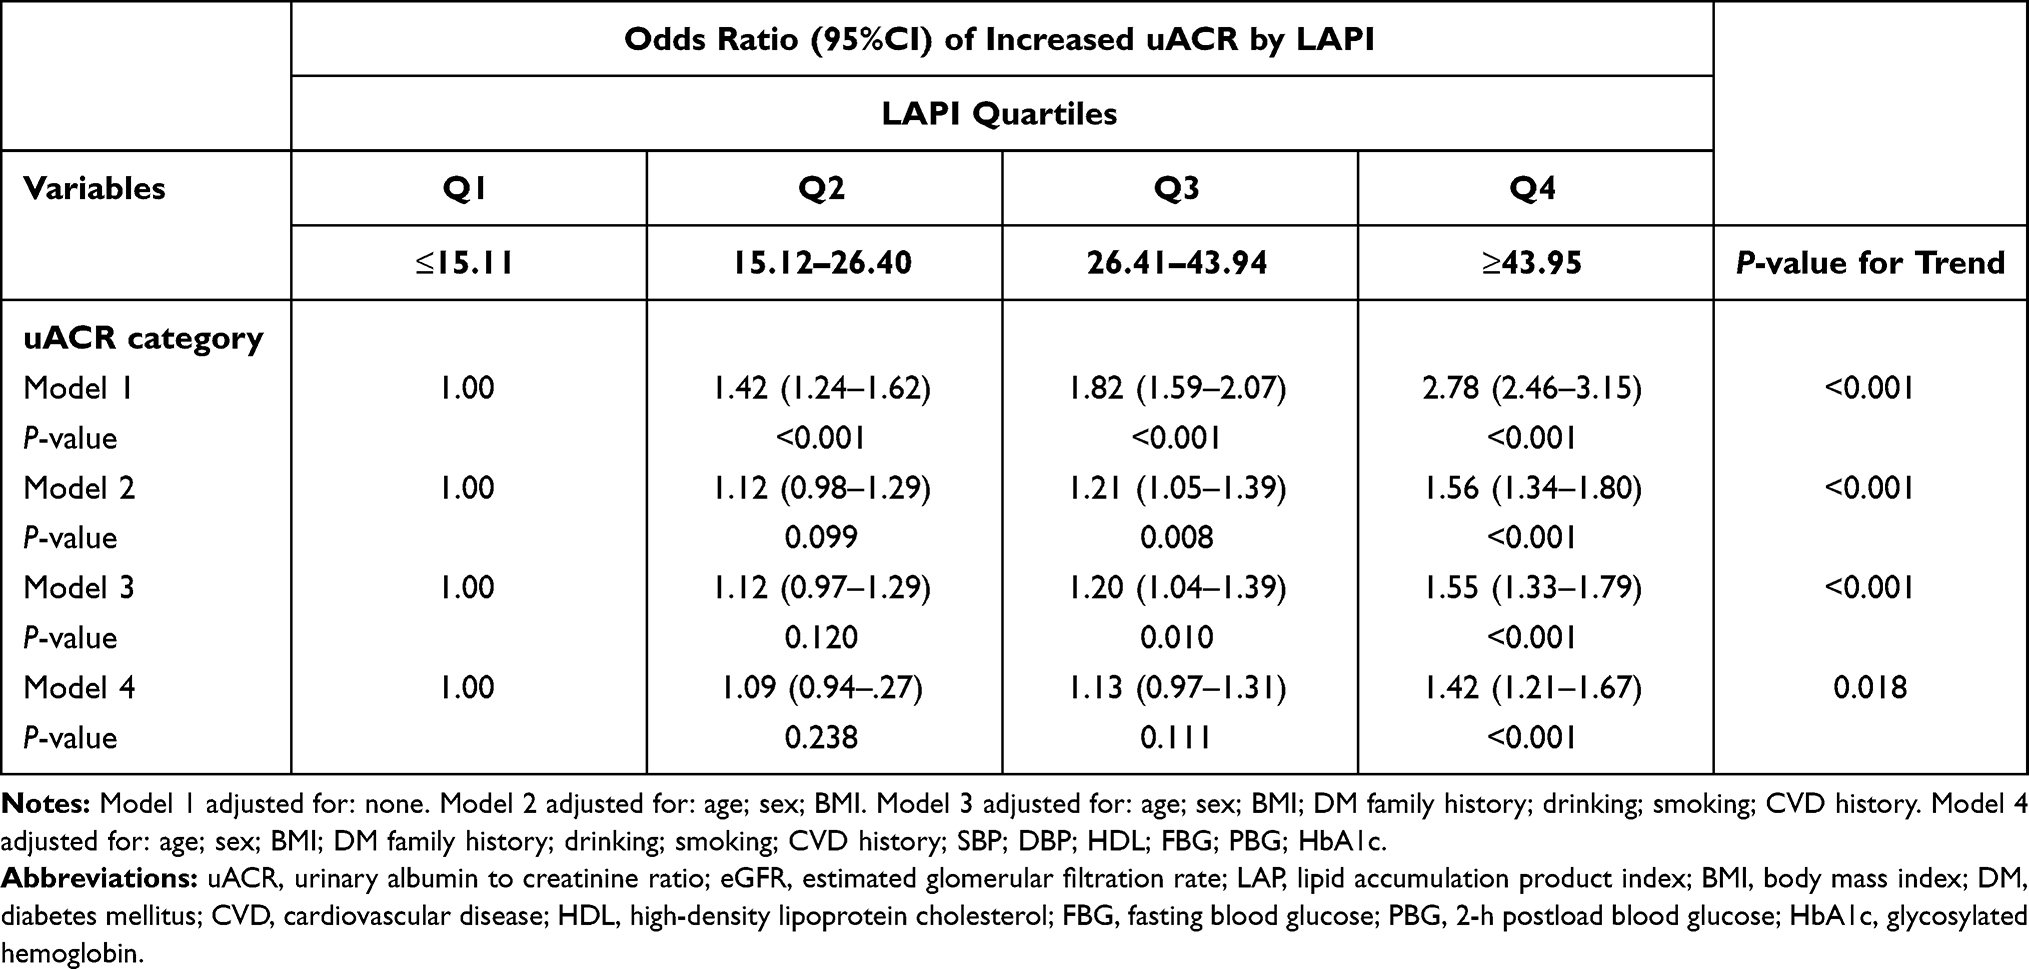 |
Table 2 Odds Ratio of uACR ≥30 mg/g by LAP Quartiles in Prediabetic Population |
Associations Between the LAP Index and uACR for Stratified Groups of Gender, Age, and BMI
Stratified analysis was performed to verify the stability of the relationship between LAP and uACR. In gender stratification (Table 3) (P for interaction=0.511), after full adjustment for BMI, family history of DM, drinking and smoking habit, SBP, DBP, HDL, FBG, PBG, and HbA1c, prediabetic women with elevated LAP was associated with increased odds of uACR ≥30 mg/g (OR [95%CI]Q2 vs Q1 1.12 [0.94, 1.33], OR [95%CI]Q3 vs Q1 1.29 [1.08, 1.53], OR [95%CI]Q4 vs Q1 1.48 [1.23, 1.79], P for trend <0.001); however, no significant association between LAP and uACR was observed in men (P for trend=0.052).
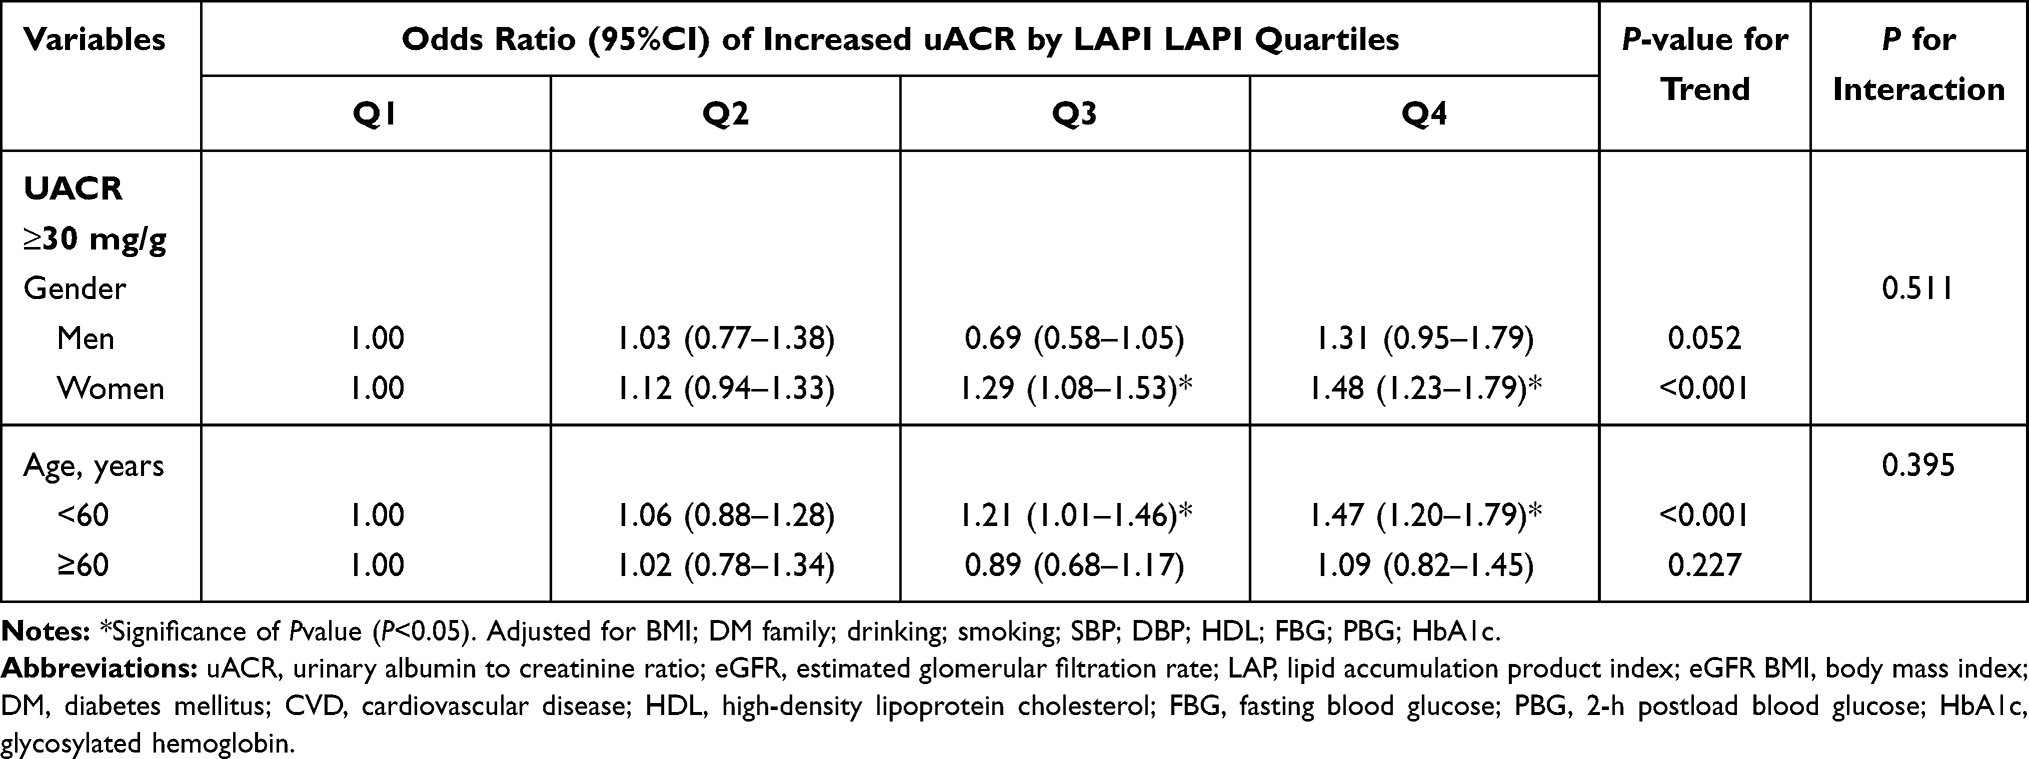 |
Table 3 Odds Ratio of uACR ≥30 mg/g by LAP Quartiles in Gender and Age Stratified Groups with Prediabetes |
In age stratification (also Table 3) (P for interaction=0.395), middle aged (40–59 years old) participants with higher LAP, were more likely to have increased uACR compared to their lower counterpart (OR [95%CI]Q2 vs Q1 1.06 [0.88, 1.28], OR [95%CI]Q3 vs Q1 1.21 [1.01, 1.46], OR [95%CI]Q4 vs Q1 1.47 [1.20, 1.79], P for trend <0.001); while in the older group (age ≥60 years old), the trend vanished.
Although significant associations of elevated LAP with increased uACR were observed in participants with all range of BP, a rise in BP indicating increased odds of increased uACR (Table 4). In participants with normal BP (SBP <120 and DBP <80 mmHg), elevated LAP was associated with increased uACR (OR [95%CI]Q2 vs Q1 1.15 [0.94, 1.41], OR [95%CI]Q3 vs Q1 1.27 [1.02, 1.57], OR [95% CI]Q4 vs Q1 1.36 [1.06, 1.74], P for trend=0.010); furthermore, those high LAP level (Q4 quartile) participants with borderline BP (≤120 SBP <140 and/or ≤80 DBP <90 mmHg) or hypertension (SBP ≥140 or DBP ≥90 mmHg) were 1.45 (95%CI: 1.09–1.94, P for trend=0.048) or 2.08 (95%CI: 1.40–3.09, P for trend=0.001) times to have increased uACR compared to its lowest counterpart, indicating that ascending BP was related to increased albuminuria (P for interaction=0.012).
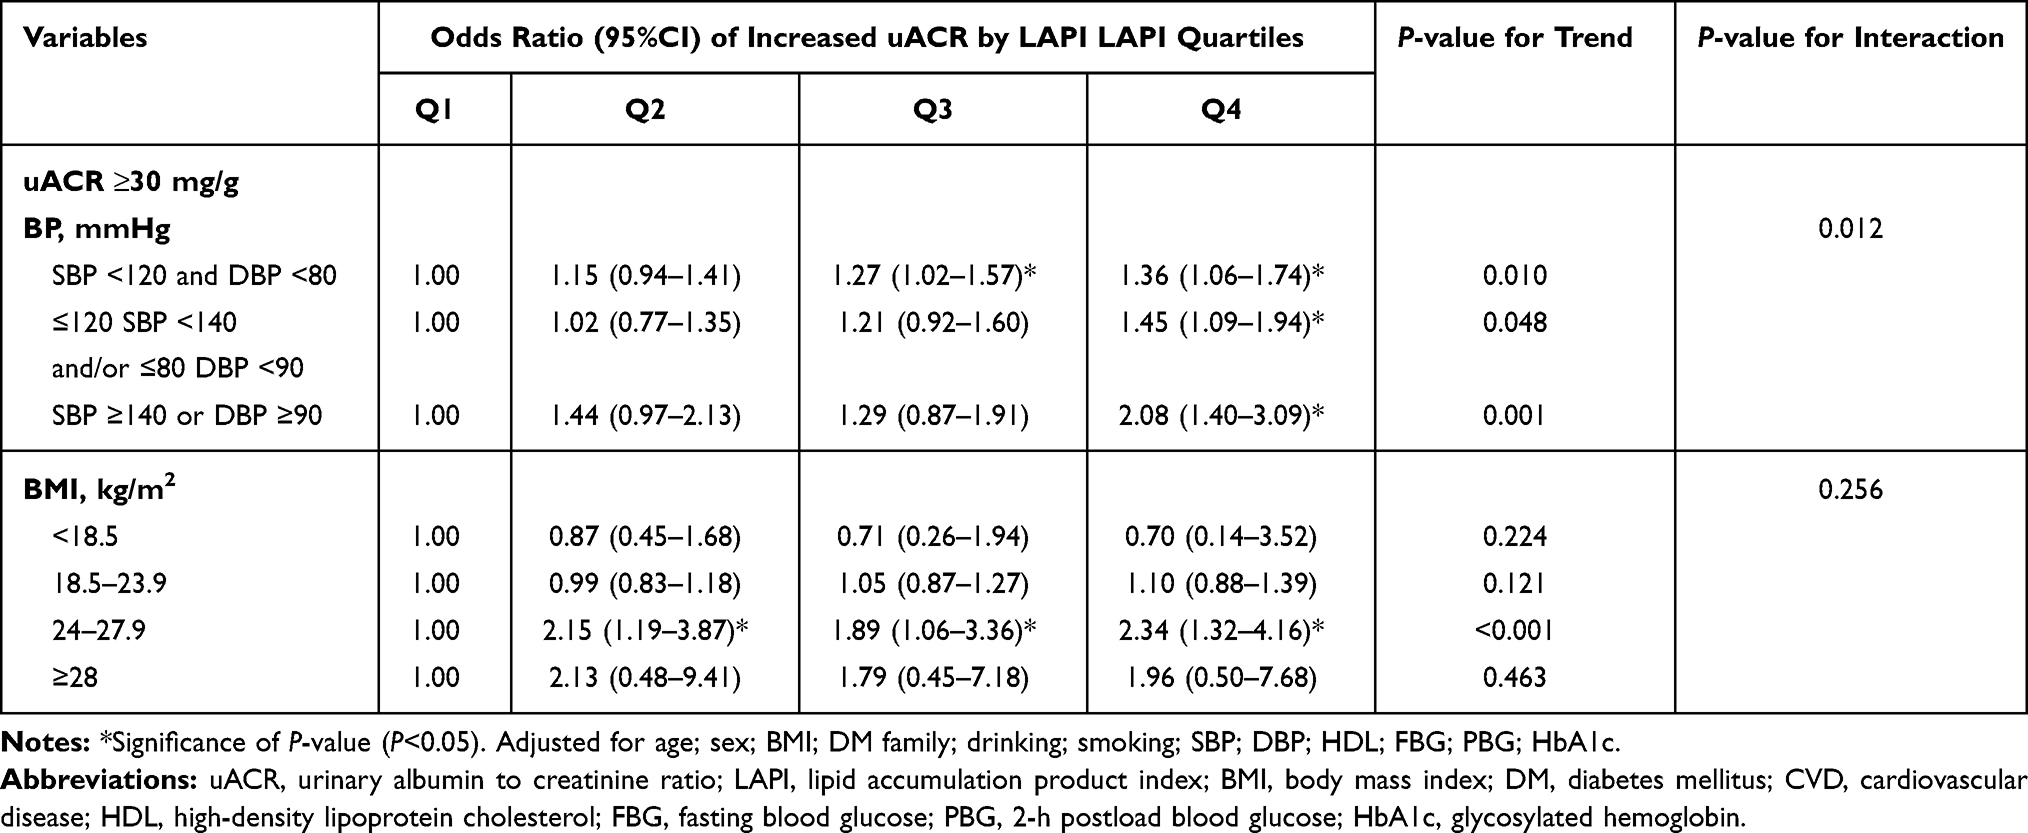 |
Table 4 Odds Ratio of uACR ≥ 30 mg/g by LAP Quartiles in Metabolic Stratified Groups with Prediabetes |
In accordance with BMI (P for interaction=0.256), participants who were overweight (24 ≤BMI <28 kg/m2) were more likely to have increased uACR (OR [95%CI]Q2 vs Q1 2.15 [1.19, 3.87], OR [95%CI]Q3 vs Q1 1.89 [1.06, 3.36], OR [95%CI]Q4 vs Q1 2.34 [1.32, 4.16], P for trend <0.001). However, there was no significant relationship between LAP quartiles and uACR among participants with obesity, normal weight or underweight (also Table 4).
Discussion
Main Findings
In the present study, we found that an ascending level of LAP was significantly associated with increased uACR in prediabetic women rather than men after adjustment for a wide spectrum of biochemical and lifestyle confounders. The multiple regression models adjustment for age, sex, BMI, DM family history, drinking and smoking habit, CVD history, BP, HDL, glucose, and HbA1c, witnessed an attenuated trend. Further stratification revealed that the prediabetic population with higher LAP level and characterized by middle age (40–59 years old) and overweight (BMI 24–27.9 kg/m2) were more likely to have increased uACR. Besides, the incidence of albuminuria was positively correlated with elevated BP in the higher LAP group. To the best of our knowledge, the present study is the first multicenter, large sample clinical survey on the relationship between LAP and uACR in a middle-aged Chinese prediabetic population. Therefore, such people should be vigilant about the detection, avoidance, and intervention of risk factors to prevent the proteinuria development.
LAP presented as a surrogate marker of visceral adiposity, was reportedly a powerful predictor of prediabetes and CKD, respectively.9,16,17 A prospective study in Europe enrolled 148 women with polycystic ovary syndrome proved that elevated LAP was associated with prediabetes.18 Another community-based cross-sectional survey involving 1777 Chinese participants indicated that LAP showed a better performance in discriminating IFG risk than BMI.17 Meanwhile, a cross-sectional study of 4658 diabetic participants conducted in China confirmed that in women, increased LAP level was significantly associated with a greater prevalence of DKD; furthermore, elevated LAP was significantly associated with higher uACR in both genders.19 In the current study, LAP was proven to be more closely associated with uACR in prediabetes, than WHR and WHtR, and independent of measurement of general adiposity is consistent with previous data.5
Prediabetes was described as a precursor of chronic kidney disease, and vice versa, microvascular dysfunction preceded and contributed to hyperglycemia through impairment of insulin-mediated glucose disposal and insulin secretion.20–22 Meanwhile, visceral obesity was also associated with microvascular abnormality, including insulin-induced microvascular dilation and recruitment, impairments in functional capillary density, and endothelium-dependent vasodilation in the absence of general obesity,23–25 supporting the notion that visceral adiposity was an important driver of DKD.20 In-depth research found lipid metabolism dysregulation occurring systemically and specifically in the kidneys in diabetic individuals.26–28 High fructose feeding rats resulted in alterations in lipid metabolism, significantly elevated plasma and tissue lipid peroxides.29 Other in vivo studies have also described lipid accumulation in the kidney cortex in DKD mouse models, demonstrating renal lipids accumulation and lipids peroxide are correlating with the development of glomerulosclerosis in diabetic setting.26,27,30
More previous data have reported lipids crucial roles in the development of CKD.31 A study involving 15,362 diabetic patients in Italy found low HDL-C and high TG levels were independent risk factors for the development of DKD over four years.32 Data from the UKPDS study with a median 15 years of follow-up also showed independent risk factors for albuminuria including increased waist circumference, TG, DLD-C in diabetic population.33 Our study has also described lipids parameter associations with albuminuria in Chinese prediabetic population to show that: after full adjustment of confounding factors (1) elevated TG was significantly associated with increased uACR in both genders, (2) descending HDL-C was associated with uACR in women alone, which was consistent with previous evidence and might explain LAP, as an inexpensive tool to monitor total lipid accumulation was superior over other anthropometrical indices by combining two efficient and independent risk factors in identifying DKD.
In the current study, the association between elevated LAP level and increased albuminuria was attenuated after further adjustment for BP, HDL-C, FBG, and PBG in Model 4 compared with Models 1 to 3, suggesting that metabolic abnormalities added to the risk of albuminuria. Evidence showed modifiable factors including poor glycemic control, hypertension,34 dyslipidemia,35,36 and obesity37–39 contribute to the development of CKD in patients with diabetes. Besides, further stratification analysis demonstrated that female gender, middle age (40–59 years old) rather than the older group (≥60 years old), rise in blood pressure and weight increase the odds of proteinuria. (1) Sex hormones influenced body fat distribution and CKD progression, which subsequently affect the association of visceral adiposity with CKD in different genders. In premenopausal women, subcutaneous adipose tissue fat accumulated, whereas in postmenopausal women and men, due to the rapid decline in estrogens, more abdominal visceral adipose tissue fat accumulated.40 Thus we speculated that the gender-specific discrepancy in the relationship between LAP and uACR is due to sexual hormone-induced fat distribution. (2) Advanced age was believed to be a nonmodifiable risk factor of CKD,41 we speculated that the senior residents take a more healthy diet and lifestyle into consideration to prevent the development of microvascular complications as reported before.42 Thus, in the older group we could not observe the significant relationship on LAP and uACR. (3) Much evidence proved that better blood pressure41,43,44 and weight control delay the development of diabetic renal dysfunction.45 Thus the early detection and intervention on those modifiable and metabolic risk factors can reduce the additive risk of albuminuria in the prediabetic population.
In place of sophisticated imaging methods for estimating the lipid burden in an isolated tissue, LAP as an inexpensive tool to monitor total lipid accumulation and a surrogate marker of visceral adiposity was reportedly a better predictor of diabetes, a risk factor of CKD and all-cause mortality, compared with central adiposity such as BMI. To date, despite the extensive research on LAP as visceral obesity and CKD, previous studies have failed to investigate the visceral obesity and uACR in the prediabetic population at high-risk of developing diabetes. Thus the current study provides evidence on elevated level of LAP can be applied as an effective indicator of diabetic nephropathy. We believe in taking LAP into consideration as part of the management strategy to reduce risk of diabetic nephropathy in further clinical practice.
Limitation
There are several limitations to this study. First, this is a retrospective single-center cross-sectional study; the analysis of the causative effect of LAP on DKD is limited. The causal relationship between LAP and uACR requires further prospective investigation. Second, other than bringing the existing adjustment variables into analysis, the absence of other confounders may interact with dependent and independent variables. Third, as the participants enrolled in the REACTION study were aged ≥40 years old, a considerable number of middle-aged men were occupied with full-time jobs, while more women were available for the informed consent process and the following recruitment, which might also partly cause the insignificancy in relationship of LAP and uACR in men.
Conclusion
In this study, we observed that the elevated level of LAP was associated with increased albuminuria in the prediabetic population in China. Individuals with higher LAP who are female, middle-aged (40–59 years old), hypertensive and overweight have increased odds of proteinuria. Thus, the marker of visceral adiposity, LAP might be a useful clinical indicator of diabetic nephropathy in the prediabetic Chinese population. Our study sheds light onto the perspective for LAP as a reliable and convenient tool identifying diabetic microvascular disease and a therapeutic marker to refine the distribution and deposition of visceral fat and lipid accumulation other than just weight loss.
Abbreviations
ALT, alanine transferase; AST, aspartate transferase; BMI, body mass index; BP, blood pressure; CKD, chronic kidney disease; CVD, cardiovascular disease; DKD, diabetic kidney disease; DM, diabetes mellitus; eGFR, estimated glomerular filtration rate; FBG, fasting blood glucose; GGT, gamma-glutamyl transferase; HbA1c, glycosylated hemoglobin; HC, hip circumference; HDL, high-density lipoprotein cholesterol; IFG, impaired fasting glucose; IGT, impaired glucose tolerance; LDL, low-density lipoprotein cholesterol; MI, myocardial infarction; OGTT, oral glucose tolerance test; PBG, 2-h postload blood glucose; TC, total cholesterol; TG, triglyceride; uACR, urinary albumin to creatinine ratio; WC, waist circumstance; WHR, waist circumstance to hip circumstance ratio; WHtR, waist circumstance to height ratio; LAP, lipid accumulation product index.
Data Sharing Statement
All data used to support the findings of this study are available from the corresponding author upon request.
Acknowledgments
The authors would like to thank the participants in this study.
Funding
The study is supported by the Chinese Society of Endocrinology, the Key Laboratory for Endocrine and Metabolic Diseases of Ministry of Health (1994DP131044), the National Key New Drug Creation and Manufacturing Program of Ministry of Science and Technology (2012ZX09303006-001), the National High Technology Research and Development Program of China (863 Program, 2011AA020107), the National Natural Science Foundation of China (81300717), Beijing Municipal Science & Technology Commission (Project No. D141107005314004), and the National Science and Technology Major Project 288 (2011ZX09307-001-8).
Disclosure
The authors report no conflicts of interest in this work.
References
1. Saeedi P, Petersohn I, Salpea P, et al. Global and regional diabetes prevalence estimates for 2019 and projections for 2030 and 2045: results from the International Diabetes Federation Diabetes Atlas, 9(th) edition. Diabetes Res Clin Pract. 2019;157:107843. doi:10.1016/j.diabres.2019.107843
2. Wang L, Gao P, Zhang M, et al. Prevalence and ethnic pattern of diabetes and prediabetes in China in 2013. JAMA. 2017;24:2515–2523. doi:10.1001/jama.2017.7596
3. Lin L, Lu J, Chen L, et al. Glycemic status and chronic kidney disease in Chinese adults: findings from the REACTION study. J Diabetes. 2017;9:837–845. doi:10.1111/1753-0407.12490
4. Chang AR, Grams ME, Ballew SH, et al. Adiposity and risk of decline in glomerular filtration rate: meta-analysis of individual participant data in a global consortium. BMJ;2019. k5301. doi:10.1136/bmj.k5301
5. Zhu P, Lewington S, Haynes R, et al. Cross-sectional associations between central and general adiposity with albuminuria: observations from 400,000 people in UK Biobank. Int J Obes (Lond). 2020;11:2256–2266. doi:10.1038/s41366-020-0642-3
6. Kahn HS. The lipid accumulation product is better than BMI for identifying diabetes: a population-based comparison. Diabetes Care. 2006;1:151–153. doi:10.2337/diacare.29.01.06.dc05-1805
7. Hosseinpanah F, Barzin M, Mirbolouk M, et al. Lipid accumulation product and incident cardiovascular events in a normal weight population: Tehran Lipid and Glucose Study. Eur J Prev Cardiol. 2016;2:187–193.
8. Kyrou I, Panagiotakos DB, Kouli GM, et al. Lipid accumulation product in relation to 10-year cardiovascular disease incidence in Caucasian adults: the ATTICA study. Atherosclerosis;2018. 10–16. doi:10.1016/j.atherosclerosis.2018.10.015
9. Dai D, Chang Y, Chen Y, et al. Visceral adiposity index and lipid accumulation product index: two alternate body indices to identify chronic kidney disease among the rural population in Northeast China. Int J Environ Res Public Health. 2016;12.
10. Zhang K, Li Q, Chen Y, et al. Visceral adiposity and renal function: an observational study from SPECT-China. Lipids Health Dis. 2017;1:205. doi:10.1186/s12944-017-0597-0
11. American Diabetes Association. Diagnosis and classification of diabetes mellitus. Diabetes Care. 2013(Suppl 1):S67–74. doi:10.2337/dc13-S067
12. Tabak AG, Herder C, Rathmann W, et al. Prediabetes: a high-risk state for diabetes development. Lancet. 2012;9833:2279–2290. doi:10.1016/S0140-6736(12)60283-9
13. Levey AS, Stevens LA, Schmid CH, et al. A new equation to estimate glomerular filtration rate. Ann Intern Med. 2009;9:604–612. doi:10.7326/0003-4819-150-9-200905050-00006
14. Stevens PE, Levin A. Evaluation and management of chronic kidney disease: synopsis of the kidney disease: improving global outcomes 2012 clinical practice guideline. Ann Intern Med. 2013;11:825–830. doi:10.7326/0003-4819-158-11-201306040-00007
15. WHO Expert Consultation. Appropriate body-mass index for Asian populations and its implications for policy and intervention strategies. Lancet. 2004;9403:157–163.
16. Chen T, Wang X, Wang X, et al. Comparison of novel metabolic indices in estimation of chronic kidney diseases in a southern Chinese population. Diabetes Metab Syndr Obes;2020. 4919–4927. doi:10.2147/DMSO.S286565
17. Song J, Chen X, Jiang Y, et al. Association and interaction analysis of lipid accumulation product with impaired fasting glucose risk: a cross-sectional survey. J Diabetes Res. 2019;9014698.
18. Velija-Asimi Z, Burekovic A, Dujic T, et al. Incidence of prediabetes and risk of developing cardiovascular disease in women with polycystic ovary syndrome. Bosn J Basic Med Sci. 2016;4:298–306.
19. Wan H, Wang Y, Xiang Q, et al. Associations between abdominal obesity indices and diabetic complications: chinese visceral adiposity index and neck circumference. Cardiovasc Diabetol. 2020;1:118. doi:10.1186/s12933-020-01095-4
20. Stehouwer. CDA. Microvascular dysfunction and hyperglycemia: a vicious cycle with widespread consequences. Diabetes. 2018;9:1729–1741. doi:10.2337/dbi17-0044
21. Melsom T, Schei J, Stefansson VT, et al. Prediabetes and risk of glomerular hyperfiltration and albuminuria in the general nondiabetic population: a Prospective Cohort Study. Am J Kidney Dis. 2016;6:841–850. doi:10.1053/j.ajkd.2015.10.025
22. Melsom T, Mathisen UD, Ingebretsen OC, et al. Impaired fasting glucose is associated with renal hyperfiltration in the general population. Diabetes Care. 2011;7:1546–1551. doi:10.2337/dc11-0235
23. de Jongh RT, Serné EH, Rg IJ, et al. Impaired microvascular function in obesity: implications for obesity-associated microangiopathy, hypertension, and insulin resistance. Circulation. 2004;21:2529–2535. doi:10.1161/01.CIR.0000129772.26647.6F
24. de Jongh RT, Ijzerman RG, Serné EH, et al. Visceral and truncal subcutaneous adipose tissue are associated with impaired capillary recruitment in healthy individuals. J Clin Endocrinol Metab. 2006;12:5100–5106. doi:10.1210/jc.2006-1103
25. Muris DM, Houben AJ, Kroon AA, et al. Age, waist circumference, and blood pressure are associated with skin microvascular flow motion: the Maastricht Study. J Hypertens. 2014;12:
26. Merscher-Gomez S, Guzman J, Pedigo CE, et al. Cyclodextrin protects podocytes in diabetic kidney disease. Diabetes. 2013;11:3817–3827. doi:10.2337/db13-0399
27. Herman-Edelstein M, Scherzer P, Tobar A, et al. Altered renal lipid metabolism and renal lipid accumulation in human diabetic nephropathy. J Lipid Res. 2014;3:561–572. doi:10.1194/jlr.P040501
28. Schofield JD, Liu Y, Rao-Balakrishna P, et al. Diabetes Dyslipidemia. Diabetes Ther. 2016;2:203–219. doi:10.1007/s13300-016-0167-x
29. Anurag P, Anuradha CV. Metformin improves lipid metabolism and attenuates lipid peroxidation in high fructose-fed rats. Diabetes Obes Metab. 2002;1:36–42. doi:10.1046/j.1463-1326.2002.00178.x
30. Proctor G, Jiang T, Iwahashi M, et al. Regulation of renal fatty acid and cholesterol metabolism, inflammation, and fibrosis in Akita and OVE26 mice with type 1 diabetes. Diabetes. 2006;9:2502–2509. doi:10.2337/db05-0603
31. Monteillet L, Gjorgjieva M, Silva M, et al. Intracellular lipids are an independent cause of liver injury and chronic kidney disease in non alcoholic fatty liver disease-like context. Mol Metab;2018. 100–115. doi:10.1016/j.molmet.2018.07.006
32. Russo GT, De Cosmo S, Viazzi F, et al. Plasma Triglycerides and HDL-C Levels predict the development of diabetic kidney disease in subjects with Type 2 Diabetes: the AMD Annals Initiative. Diabetes Care. 2016;12:2278–2287. doi:10.2337/dc16-1246
33. Retnakaran R, Cull CA, Thorne KI, et al. Risk factors for renal dysfunction in type 2 diabetes: u.K. Prospective Diabetes Study 74. Diabetes. 2006;6:1832–1839. doi:10.2337/db05-1620
34. Tanaka Y, Atsumi Y, Matsuoka K, et al. Role of glycemic control and blood pressure in the development and progression of nephropathy in elderly Japanese NIDDM patients. Diabetes Care. 1998;1:116–120. doi:10.2337/diacare.21.1.116
35. Meikle PJ, Wong G, Barlow CK, et al. Lipidomics: potential role in risk prediction and therapeutic monitoring for diabetes and cardiovascular disease. Pharmacol Ther. 2014;1:12–23. doi:10.1016/j.pharmthera.2014.02.001
36. Reis A, Rudnitskaya A, Chariyavilaskul P, et al. Top-down lipidomics of low density lipoprotein reveal altered lipid profiles in advanced chronic kidney disease. J Lipid Res. 2015;2:413–422. doi:10.1194/jlr.M055624
37. Zeitler P, Hirst K, Pyle L, et al. A clinical trial to maintain glycemic control in youth with type 2 diabetes. N Engl J Med. 2012;24:2247–2256.
38. Look AHEAD Research Group. Effect of a long-term behavioural weight loss intervention on nephropathy in overweight or obese adults with type 2 diabetes: a secondary analysis of the Look AHEAD randomised clinical trial. Lancet Diabetes Endocrinol. 2014;10:801–809.
39. Carlsson LM, Romeo S, Jacobson P, et al. The incidence of albuminuria after bariatric surgery and usual care in Swedish Obese Subjects (SOS): a prospective controlled intervention trial. Int J Obes (Lond). 2015;1:169–175. doi:10.1038/ijo.2014.72
40. Karastergiou K, Smith SR, Greenberg AS, et al. Sex differences in human adipose tissues - the biology of pear shape. Biol Sex Differ. 2012;1:13. doi:10.1186/2042-6410-3-13
41. Thomas MC, Brownlee M, Susztak K, et al. Diabetic kidney disease. Nat Rev Dis Primers. 2015;15018.
42. Wang J, Jin X, Chen K, et al. Visceral adiposity index is closely associated with urinary albumin-creatinine ratio in the Chinese population with prediabetes. Diabetes Metab Res Rev. 2020;e3424.
43. Patel DM, Bose M, Cooper ME. Glucose and blood pressure-dependent pathways-the progression of diabetic kidney disease. Int J Mol Sci. 2020;6:2218. doi:10.3390/ijms21062218
44. Doshi SM, Friedman AN. Diagnosis and management of type 2 diabetic kidney disease. Clin J Am Soc Nephrol. 2017;8:1366–1373. doi:10.2215/CJN.11111016
45. Maric-Bilkan C. Obesity and diabetic kidney disease. Med Clin North Am. 2013;1:59–74. doi:10.1016/j.mcna.2012.10.010
 © 2021 The Author(s). This work is published and licensed by Dove Medical Press Limited. The
full terms of this license are available at https://www.dovepress.com/terms
and incorporate the Creative Commons Attribution
- Non Commercial (unported, 3.0) License.
By accessing the work you hereby accept the Terms. Non-commercial uses of the work are permitted
without any further permission from Dove Medical Press Limited, provided the work is properly
attributed. For permission for commercial use of this work, please see paragraphs 4.2 and 5 of our Terms.
© 2021 The Author(s). This work is published and licensed by Dove Medical Press Limited. The
full terms of this license are available at https://www.dovepress.com/terms
and incorporate the Creative Commons Attribution
- Non Commercial (unported, 3.0) License.
By accessing the work you hereby accept the Terms. Non-commercial uses of the work are permitted
without any further permission from Dove Medical Press Limited, provided the work is properly
attributed. For permission for commercial use of this work, please see paragraphs 4.2 and 5 of our Terms.