Back to Journals » Vascular Health and Risk Management » Volume 21
Linking Cellular Senescence to Vascular Pathology: The Diagnostic Potential of Superoxide Dismutase 2 in Aortic Dissection
Authors Wu X, Qin J, Tang D, Wang X, Wang R, Li W, Zhang J, Lu X ![]()
Received 14 July 2025
Accepted for publication 14 October 2025
Published 26 November 2025 Volume 2025:21 Pages 983—1005
DOI https://doi.org/10.2147/VHRM.S553609
Checked for plagiarism Yes
Review by Single anonymous peer review
Peer reviewer comments 3
Editor who approved publication: Dr Daniel Duprez
Xiaoyu Wu,1,* Jinbao Qin,1,* Dianjun Tang,2 Xin Wang,1 Ruihua Wang,1 Weimin Li,1 Jian Zhang,3 Xinwu Lu1
1Department of Vascular Surgery, Shanghai Ninth People’s Hospital, Shanghai Jiao Tong University School of Medicine, Shanghai, 200011, People’s Republic of China; 2Department of Vascular Surgery, The Second Hospital, Cheeloo College of Medicine, Shandong University, Jinan, 250030 People’s Republic of China; 3Department of Vascular Surgery, The First Hospital of China Medical University, Shenyang, Liaoning, 110001, People’s Republic of China
*These authors contributed equally to this work
Correspondence: Xinwu Lu, Department of Vascular Surgery, Shanghai Ninth People’s Hospital, Shanghai Jiao Tong University School of Medicine, Shanghai, 200011, People’s Republic of China, Email [email protected] Jian Zhang, Department of Vascular Surgery, The First Hospital of China Medical University, Shenyang, Liaoning, 110001, People’s Republic of China, Email [email protected]
Introduction: This study investigates the molecular and cellular mechanisms of vascular aging and its critical role in the pathogenesis of aortic dissection (AD), employing an integrative approach that includes bioinformatics and single-cell transcriptomic analyses.
Methods: Differentially expressed genes (DEGs) were identified from publicly available datasets (GSE52093, GSE153434), with 194 upregulated and 518 downregulated genes, 16 of which were associated with vascular aging. Superoxide dismutase 2 (SOD2) was identified as a critical gene, demonstrating significant diagnostic accuracy for AD through ROC analysis. Single-cell RNA sequencing of AD tissues revealed cellular heterogeneity, with a predominant macrophage infiltration and altered proportions of endothelial and smooth muscle cells.
Results: SOD2 was notably expressed in macrophages and dendritic cells, particularly in AD tissues, suggesting its involvement in immune modulation. Validation of SOD2 at both mRNA and protein levels showed elevated expression in AD tissues and serum, correlating with increased oxidative stress and immune cell infiltration. Elevated serum SOD2 levels were linked to poor clinical outcomes, particularly higher in-hospital mortality. Immune profiling further identified significant associations between SOD2 and macrophage activity.
Conclusion: These findings suggest SOD2 as a potential diagnostic biomarker and therapeutic target for AD. A gene-drug interaction network proposed pharmacological candidates for SOD2 modulation, paving the way for targeted therapies. This study advances the understanding of AD pathogenesis, emphasizing the interplay between oxidative stress, immune response, and vascular aging at both molecular and cellular levels.
Keywords: aortic dissection, SOD2, superoxide dismutase 2, single-cell RNA sequencing, bioinformatics analysis, gene-drug interaction network
Introduction
With the continuous development of geriatric medicine, people’s understanding of the concept “man ages as his blood vessels do” deepens. Vascular aging is one of the common causes of chronic diseases in the elderly, greatly influencing the occurrence of cardiovascular and cerebrovascular diseases and peripheral vascular diseases. The incidence rate of cardiovascular diseases gradually increases with age, reaching 1.3% for those aged 55 to 64 and 8.4% for those 75 and older.1 With the spread and deepening of global aging, vascular aging-related diseases are highly prevalent in the elderly population. Aortic dissection is the most common aortic cardiovascular emergency in the West, with 3 to 5 cases per 100,000 people per year, and it increases among those aged 65 and over.2 A study by the International Registry of Acute Aortic Dissection (IRAD) showed that two-thirds of patients with aortic dissection are male, with an average age of 63, and the average age for females is 67yrs.3 Acute Type B aortic dissection is more common among Africans living in Europe or the United States than among whites.4
A dynamic balance exists between cellular aging, apoptosis, and the growth of nascent cells. Cellular aging refers to the cyclical halt in the cell cycle. Even though its metabolism continues, it is generally caused by various internal and external factors driving to aging.5,6 In 1961, Hayflick and Moorhead reported that in-vitro cultured human diploid cells undergo a distinct process of aging, decline, and death and found that human diploid fibroblast cells demonstrate limited cell division ability (replicative senescence), due to telomere shortening (replicative aging).7 However, aging unrelated to telomere length changes was later observed in many aged or damaged tissues. This Stress-induced premature senescence (SIPS) can be activated by unique stress stimuli, including persistent DNA damage, activation of oncogenes, oxidative stress, and mitochondrial dysfunction in the cardiovascular system.8,9
Cellular senescence and aortic dissection are topics of concern. Aortic dissection arises from a tear in one layer of the aortic wall, which allows blood to leak from the middle layer outwards, affecting blood flow. Cellular senescence has been proven to be a factor in causing aortic dissection. Excessive loss of smooth muscle cells, degradation of the extracellular matrix, and inflammatory reactions are all manifestations of cellular aging. Increasing evidence suggests that smooth muscle cell contractile dysfunction contributes to the development of inherited and sporadic acute aortuc dissection (AAD), with a defect in the gene encoding the contractile-elastic fiber unit leading to thoracic aortic aneurysms and dissections (TAAD).10 Aortic smooth muscle cells maintain or increase aortic strength by generating arterial tension through contraction and instigating aortic wall remodeling by producing ECM proteins, in response to increased hemodynamic stress.11 Endothelial cells and endothelial-derived factors play an important role in regulating smooth muscle cell function, providing barrier function, and preventing inflammation and thrombosis. A study showed that TAAD patients have fibroblast dysfunction in the outer membrane, ECM production decreased, and smooth muscle cell transformation is impaired.12 Compared to asymptomatic and clinically stable patients, those with severe clinical symptoms display higher inflammatory cell activity in the aortic wall.13
Over the past decades, cellular aging has been recognized to play a critical role in the occurrence and development of various diseases. As human bodies age, cells gradually lose their function and eventually die, promoting aging and disease occurrence in humans. In the vascular system, aortic dissection is a common and dangerous ailment, primarily occurring due to excessive loss of aortic media smooth muscle cells (SMC), leading to the degradation of the extracellular matrix (ECM) and the occurrence of inflammatory responses. These are important hallmarks of cellular aging. Endothelial cells and endothelial-derived factors play pivotal roles in maintaining vascular smooth muscle cell function, providing vascular endothelial barrier function, and preventing inflammation and thrombosis. Increasing evidence shows the essential role of endothelial cells and their derived factors in regulating the health and function of the vascular wall, highlighting the crucial importance of preventing cellular aging and related diseases.14 Thus, studying the roles of endothelial cells and smooth muscle cells in the occurrence of aortic dissection may provide new targets for developing relative therapies and improving the quality of life and health of people.
SOD is a metalloenzyme, and hence requires a metal cofactor for its activity. In humans, there are three forms of SOD: superoxide dismutase 1 (SOD1, Cu/Zn-SOD), present in the cytoplasm; superoxide dismutase 2 (SOD2, Mn-SOD), located in the mitochondria, and extracellular superoxide dismutase 3 (SOD3, Cu/Zn-SOD). Despite the significant role of SOD2 in cellular aging and disease, the decline in its activity is a well-known fact. Therefore, we need further research on how to enhance the activity of SOD2, with the hope of playing a more significant role in the prevention and treatment of cellular aging and diseases.
The aims of this prospective cohort study were as follows: (1) to screen senescence related genes (SRGs) that play a role in vascular aging according to public databases by bioinformatics means, (2) to evaluate the changes in serum SOD2 concentrations in AAD; (3) to assess the implications of these alterations with regard to biochemical variables and clinical data, and (4) to investigate the association between serum SOD2 concentrations, and in-hospital mortality in patients with AAD.
Materials and Methods
Data Source
Analysis was conducted by downloading gene expression datasets from the GEO database of the National Center for Biotechnology Information (NCBI) (https://www.ncbi.nlm.nih.gov/geo/). A series of studies on human AAD were searched in the database. Two gene expression datasets (GSE52093, GSE153434) were then filtered out. GSE52093 includes gene expression data from AAD patients (n=7) and healthy controls (n=5). After preprocessing, two unqualified AD sample data (GSM1259277 and GSM1259278) were excluded. GSE153434 includes gene expression data from the aortas of AAD patients (n=10) and normal controls (n=10). Genes related to vascular aging were sourced from the GenAge database (https://genomics.senescence.info/genes/index.html).15 All data are freely available, and this study does not include any experiments on humans or animals.
The data were normalized using the R packages “stringr”, “reshape2”, and “limma”. Differential expression analysis of genes in different modules between the AAD group and the healthy control group was performed using the R packages “imute” and “limma”. Genes with P < 0.05 and |logFC|≥ 0.7 were selected as differentially expressed genes (DEGs) for subsequent analysis. Volcano plots and heatmaps were constructed. Genes related to vascular aging were downloaded from the GenAge database. The DEGs and vascular aging-related genes (VARGs) were intersected to obtain differentially expressed DeVARGs. The ENCORI database is a comprehensive database for RNA interactions, used for studying interactions between miRNA-ncRNA, miRNA-mRNA, ncRNA-RNA, RNA-RNA, RBP-ncRNA, and RBP-mRNA from CLIP-seq, degradome-seq, and RNA-RNA interaction group data. Based on Zhang et al’s study on differentially expressed miRNA (DemiRNA) in AD tissue and normal control tissue,14 we further analyzed DeVARGs and differentially expressed miRNA related to aortic dissection, and constructed a DemiRs-DeVARGs interaction network.
GO and KEGG Pathway Analysis
The Database for Annotation, Visualization and Integrated Discovery tool (https://david.ncifcrf.gov/) was used to perform GO and KEGG pathway enrichment analysis on differentially expressed vascular aging-related genes. GO functional annotation divides gene functions into biological processes (BP), cellular components (CC), and molecular functions (MF). Genes with a count > 5 were considered statistically significant. The results were visualized using the color bar chart module of the Hiplot website (https://hiplot.com.cn/basic/barplot-color-group).
PPI Network Construction and Hub Gene Identification
The Search Tool for the Retrieval of Interacting Genes (STRING) database search tool (https://www.string-db.org) was used to construct a PPI network of differentially expressed vascular aging-related genes. PPI pairs were then extracted using a combination score greater than 0.15. The PPI network was then visualized using Cytoscape software. The degree of each protein node was calculated using CytoHubba based on the node’s degree of connectivity in the entire network. MCODE is a plugin in Cytoscape for analyzing subnetworks (highly interconnected regions) in the PPI network. Finally, genes in the top 10 subnetworks with connectivity in the entire PPI network were considered key genes.
Lasso Regression and ROC Curve
The R package “glmnet” was used to build a lasso regression model for the key genes screened from the PPI network, further compressing the number of key genes obtained from the PPI network and screening for hub genes. The ROC curve module of the Hiplot website (https://hiplot.com.cn/basic/roc) was used to construct visualized ROC curves for the hub genes.
Nomogram and Decision Curve
A nomogram is a two-dimensional image used for inaccurate computations. Similar to a mathematical ruler, it is a method used for calculations, and its accuracy depends on the precision of the data points during chart queries, as well as its straightness. Majority of the nomogram works under inaccurate conditions, where the precision meeting the requirements of the practical application is satisfied. Additionally, nomographs can be used to verify precise calculation results. Decision curve analysis (DCA) is a convenient method to evaluate clinical prediction models, diagnostic tests, and molecular markers. Traditional diagnostic test methods, such as sensitivity, specificity, and the area under the ROC curve, measure only the diagnostic accuracy of the prediction model without considering the actual application of specific models. The advantage of DCA is incorporating patient and decision-maker preferences into the analysis. Its development conforms to the practical requirements of clinical decisions and is being increasingly used in clinical analysis. The nomogram module of the Hiplot website (https://hiplot.com.cn/basic/nomogram) was used to build a Nomogram model based on Hub genes. “Points” represent the scores of the corresponding factors below, “Total Points” represent the sum of the scores of all factors above. The calibration curve module of the Hiplot website (https://hiplot.com.cn/basic/calibration-curve) was used to build a visualized calibration curve of the results for assessing the predictive ability of the nomogram. Finally, the “rmda” package in R was used to construct a decision curve analysis and clinical impact curve with the model’s clinical value being evaluated.
Immune Cell Infiltration Analysis
CIBERSORTx can extract molecular features of different cell types from the signature gene files and extract the transcriptome of individual cell types from massive data without the need for single-cell separation. The gene expression matrix of GSE153434 was uploaded to CIBERSORTx (https://cibersortx.stanford.edu). At the same time, a leukocyte feature matrix (LM22) capable of distinguishing 22 human hematopoietic cell phenotypes was chosen as the signature gene file. CIBERSORTx was used to process the data, outputting the immune cell infiltration results. Then, based on the results, the content of different immune cell types in each sample was visualized.
Hub Gene and Immune Cell Correlation Analysis
To further analyze the role mechanism of vascular aging-related genes and immune cells in AAD pathogenesis, we used the relative proportions of immune cells to explore the correlation between immune cells.16 Using the R package “psych”, we obtained the absolute ratio data of immune cells, and visualized the results through the heatmap module of the Hiplot website (https://hiplot.com.cn/basic/heatmap), analyzing the relationship between hub genes and immune cells. Pearson’s correlation coefficient was used to determine the interaction relationship.
Single-Cell Transcriptomics: Sample Preparation and Analysis
Tissue samples were collected from the dissection site of aortic dissections (n=2) and normal aortic tissue (n=1) (Table S1). Ethical approval for the study was obtained from the Ethics Committee of the Second Hospital of Shandong University (ethical approval number: [2021]134). Written informed consent was obtained from all participants prior to their inclusion in the study. Samples were preserved using the GEXSCOPE system (Singleron, China) and processed through washing, digestion, filtration, centrifugation, and resuspension. Red blood cells were removed with lysis solution, and the resulting cell suspension was adjusted to 1×10⁵ cells/mL. Cell viability, confirmed to exceed 80% via Trypan Blue staining (Bio-Rad, USA), was assessed microscopically. Single-cell RNA sequencing libraries were prepared using the GEXSCOPE Single-Cell Transcriptome Library Preparation Kit (Singleron, China). The workflow included cell lysis in droplets, mRNA capture, barcoding with Unique Molecular Identifiers (UMIs), reverse transcription, cDNA amplification, and fragmentation. Sequencing libraries were diluted to 4 nM and sequenced on the Illumina HiSeq X platform to generate 2×150 bp paired-end reads. Raw scRNA-seq data was processed to produce gene expression matrices. Quality control, including filtering low-quality reads, trimming unwanted sequences, and removing cells with UMI counts <30,000, gene counts <200 or >5000, or mitochondrial gene expression >50%, was conducted using FastQC, fastp, and Cutadapt. STAR v2.5.3a mapped reads to the GRCh38 human reference genome, and featureCounts v1.6.2 quantified UMI and gene counts. Normalization and scaling were performed using Seurat v2.3. Principal component analysis was conducted using the top 2000 most variable genes, and clustering was performed with FindClusters. Batch effects were corrected using Harmony, and UMAP was applied for two-dimensional visualization. Cell types were annotated based on gene markers and literature references. Differentially expressed genes (DEGs) were identified using Seurat’s FindMarkers with the Wilcox likelihood-ratio test, considering genes expressed in >10% of cells within clusters and an average logFoldChange (logFC) >0.25. Seurat’s DoHeatmap and DotPlot visualized cell type-specific markers.
Construction of Hub Gene-Drug Interaction Network
DGIdb is an open-source project. The site has two main functions, 1) find drugs that interact with the input gene; 2) find genes that interact with the input drug. Using the DGIdb database (Drug–Gene Interaction Database https://dgidb.genome.wustl.edu/), drugs that interact with the Hub and interaction scores were obtained. The gene-drug interaction information was imported into Cytoscape software to construct a visualized Hub gene-drug interaction network.
Blood Samples from Human Aortas and Control
In our research, we selected suitable candidates identified as aortic dissection patients from the Department of Vascular Surgery at Shanghai Ninth People’s Hospital, with ethical approval number: SH9H-2018-T71-2. AD diagnosis was made following the review of imaging results (including echocardiography, MRI, and CT scans) and was categorized according to the Stanford classification method.17 Various patient historical data and relevant clinical information were documented, such as a history of coronary and peripheral artery diseases, medication regimen, and potential risk factors like smoking, high blood pressure, diabetes mellitus (DM), or hyperlipidemia. The exclusion criteria for the AD group dismissed subjects with Ehlers-Danlos syndrome, Marfan syndrome, and other identifiable vascular or connective tissue disorders. AD patients suffering from the following conditions were also excluded: aortic aneurysm, cancer, autoimmune diseases, severe artery narrowing, blood disorders, infectious diseases, coronary heart problems, extreme organ failure, congenital heart conditions, previous aortic surgery, Marfan syndrome, Ehlers-Danlos syndrome, or other types of combined connective tissue or vascular disorders, as well as those undergoing treatment with non-steroidal anti-inflammatory drugs or steroids. In summary, we collated 97 AAD patients with corresponding peripheral blood samples and clinical data from the Department of Vascular Surgery at Shanghai Ninth People’s Hospital (Shanghai, China), following the immediate post admission stage, between January 2023 and October 2024. For comparison, we also gathered blood samples from a control group made up of 97 individuals fitting certain criteria. These samples were sourced from the medical records database of at Shanghai Ninth People’s Hospital. We also selected these controls from the list of patients who were admitted to the emergency department due to trauma or motor vehicle accidents between January 2023 and October 2024, with all of them having undergone imaging examinations such as CT or MRI upon admission. Potential control group candidates were those exhibiting non-typical symptoms and demonstrating stable hemodynamic conditions. The aim of choosing this specific control group was to prevent any inherent bias that might favor AAD from influencing our study. And all 97 AAD patients and 97 subjects as control also signed written informed consent and conducted in line with the Guidelines of the World Medical Association Declaration of Helsinki.
Serum SOD2 Concentrations
ELISA Kit for Superoxide Dismutase 2, Mitochondrial (SOD2, SEB083Hu, Cloud-Clone Corp., Houston, TX, USA) for SOD2 level determination following the manufacturer’s instructions. Detection Range: 0.78–50ng/mL; The minimum detectable dose is less than or equal to 0.37ng/mL. Specificity: No cross-reactivity with other cytokines or systems. The enzymatic reaction was halted by adding the stop solution. Finally, the absorbance was measured at 450 nm using a Bio Rad model 680 microplate reader (Bio Rad Laboratories, Inc., Hercules, CA, USA).
Tissue Samples from Human Aortas
All procedures involving human tissue samples received ethical approval. This study was conducted in accordance with the Declaration of Helsinki. The study was approved by the Ethics Committee of the Second Hospital of Shandong University (ethical approval number: [2021]134. Written informed consent was obtained from all participants prior to their inclusion in the study. We obtained 9 aortic tissues from AAD patients and 8 heart transplant recipients (serving as controls), with informed consent secured from the patients or their next of kin. All collected samples were promptly preserved in liquid nitrogen or paraformaldehyde following surgical removal to prevent any compromise to the sample quality.
Evaluating mRNA Expression Levels of DeVARGs in AD Samples
Quantitative reverse transcription PCR (qRT-PCR) was employed to verify a subset of DeVARGs in our tissue samples. We pulverized human AD tissue and normal aortic tissue in liquid nitrogen for total RNA extraction. The extracted total RNA was then reverse transcribed into cDNA using the PrimeScript™ RT Master Mix (RR036A, TaKaRa Bio, Japan). The qRT-PCR was performed using the TB Green® Premix Ex Taq™ II (RR820A, TaKaRa Bio, Japan). GAPDH served as the reference gene, and the relative expression levels of mRNAs in tissues were determined using the 2−ΔΔCT method, with the corresponding primer sequences detailed in Table S2.
Assessing Protein Expression Levels of SOD2 in AAD Tissues
Protein samples from AD and normal tissues were subjected to sodium dodecyl sulfate-polyacrylamide gel (with 15μg sample per gel lane) for separation. The protein bands were then transferred onto polyvinylidene fluoride membranes. The membranes were blocked and subsequently incubated with rabbit anti-SOD2 (Rabbit SOD2 Polyclonal antibody, WB: 1:2000, Cat No. 24127-1-AP, Proteintech Group, Inc, Rosemont, IL, USA) and rabbit anti-Beta Actin Polyclonal antibody (Cat No. 20536-1-AP, Proteintech Group, Inc, Rosemont, IL, USA). The blots were then treated with goat anti-rabbit IgG labeled with horseradish peroxidase. Ultimately, the density of immunoreactive bands normalized to the signal intensity of Beta Actin was evaluated using the Electro Chemical Luminescence Kit and ImageJ software 1.53.
IHC Colocalization of SOD2 Expression in Human AD Tissues
Histological and immunohistochemical analyses were performed on representative sections of aortic tissue samples (2–3 μm). Paraffin sections were routinely stained with hematoxylin-eosin (HE) to assess tissue morphology, cellular composition, degree of infiltration with inflammatory cells in all AAD samples. For immunohistochemistry, dewaxed and hydrated tissue sections were boiled to retrieve antigen epitopes, washed and treated with appropriate antibodies (Abs) accordingly. For detection of SOD2, the following Abs were applied: SOD2 (Rabbit SOD2 Polyclonal antibody, IHC: 1:1000, Cat No. 24127-1-AP, Proteintech Group, Inc, Rosemont, IL, USA). The prepared sections were then ready to be examined under a fluorescence microscope. All primary Abs were detected and visualized by Anti-Rabbit HRP-DAB Cell & Tissue Staining Kit (CTS005, Univ-bio, Inc, Shanghai, China) according to the manufacturer’s instructions.
Immunofluorescence Staining for SOD2 Localization in Macrophages
Tissue Section Preparation: Tissues from the dissection sites and normal aortic tissues were fixed in 4% paraformaldehyde universal tissue fixative (BL539A, Biosharp, China), washed under running water, dehydrated in a graded alcohol series, cleared in xylene, and embedded in paraffin. Sections were cut on a paraffin microtome (RM2235, Leica, Germany) at a thickness of 4 μm, mounted on slides, and stored for subsequent staining. Paraffin-embedded aortic dissection tissue sections were deparaffinized using xylene and rehydrated through a graded ethanol series. Antigen retrieval was performed by incubating the sections in 10 mM sodium citrate buffer (pH 6.0) at 95°C for 20 minutes, followed by cooling to room temperature. After washing with phosphate-buffered saline (PBS), tissue sections were blocked with 5% bovine serum albumin (BSA) in PBS for 1 hour at room temperature to reduce nonspecific binding. Primary antibodies were applied overnight at 4°C, including a mouse anti-CD68 antibody (Alexa Fluor® 488 Anti-CD68 antibody, Cat no: ab222914, Abcam, Shanghai, China) to label macrophages and a rabbit anti-SOD2 antibody (Anti-Superoxide Dismutase (MnSOD) DD-17−Cy3 antibody produced in rabbit, Cat no: S1450, Merck Ltd, Beijing, China) to detect SOD2 expression. After washing in PBS, secondary antibodies conjugated with Alexa Fluor 488 (goat anti-mouse IgG, to label macrophages) and CY3 (Goat Anti-Rabbit IgG H&L Cy3 ® to label SOD2) were incubated for 1 hour at room temperature in the dark. Nuclei were counterstained with DAPI for 5 minutes at room temperature. Sections were mounted with antifade mounting medium and imaged using a fluorescence microscope. Merged images of DAPI (nuclei), Alexa Fluor 488 (Macrophages), and CY3 (SOD2) channels were analyzed to assess the colocalization of SOD2 with macrophages.
Statistical Analysis
Statistical analysis was performed using SPSS 25.0 (SPSS Inc., Chicago, IL, USA). Patient characteristics were presented as frequencies and percentages for categorical variables and compared using the Chi-square test or Fisher exact test. Normally distributed continuous variables were presented as mean and standard deviation and compared using Student t test. The Kruskal–Wallis one-way analysis of variance (ANOVA) by rank test was used to compare differences between two groups, while differences among more than two groups were assessed using the non-parametric Mann–Whitney test. Categorical variables were presented as numbers with percentages, and the Chi-square test was employed to evaluate differences between two groups for both biochemical and clinical parameters. Partial correlation analysis, adjusting for age, gender, and smoking, was conducted to examine correlations between continuous variables. Kaplan-Meier curves were constructed and stratified according to different SOD2 levels. Receiver operating characteristic (ROC) curves, along with area under the curve, were utilized in logistic models to determine optimal cut-off points and evaluate the diagnostic performance of serum SOD2 for AAD detection (GraphPad Prism version 9.0). Subgroup analyses were performed with the use of Kaplan-Meier curves and Log rank tests. Statistical significance was considered at p-values <0.05.
Results
Identification and Functional Analysis of Differentially Expressed Genes Associated with Vascular Aging
To investigate differentially expressed genes (DEGs) associated with vascular aging, datasets GSE52093 and GSE153434 were analyzed. Heatmaps were constructed for 25 randomly selected genes from each dataset (Figure 1A and C), and volcano plots visualized the overall expression changes (Figure 1B and D). Differential expression analysis was conducted separately for the AAD and control groups in both datasets. Combining the DEGs from the GSE52093 and GSE153434 datasets, the intersection of upregulated and downregulated genes identified 194 upregulated and 518 downregulated DEGs (Figure 1E and F). Additionally, 307 vascular aging-related genes were retrieved from the GenAge database. The overlap of these genes with the 712 DEGs identified 11 upregulated and 5 downregulated genes associated with vascular aging (Table S3), named DEGs and vascular aging-related genes (DeVARGs). Then, we selected the DeVARGs target miRNA predicted by starBase database and miRDB database jointly. The miRNA-mRNA network was constructed with 10 for DeVARGs and 4 miRNAs (has-miR-107, has-miR-7-5p, has-miR-16-5p, and has-miR-31-5p, Figure 1G). To explore the biological relevance of these DEGs, functional enrichment analysis was performed using Gene Ontology (GO) and Kyoto Encyclopedia of Genes and Genomes (KEGG) pathways. GO analysis revealed enrichment in cellular components such as the nucleus, nucleoplasm, and cytoplasm, with molecular functions primarily related to protein and metal ion binding. Biological processes included transcriptional regulation and transcription from RNA polymerase II promoters. KEGG pathway enrichment showed significant associations with cancer pathways and cellular senescence (Figure 1H and I). A protein-protein interaction (PPI) network of these DEGs was constructed using the STRING database and Cytoscape software (Figure 1J). Highly interconnected hub genes were identified using CytoHubba, with the top ten genes ranked by degree of connectivity: Myelocytomatosis Oncogene (MYC), Interleukin-6 (IL6), Insulin-like Growth Factor Binding Protein 3 (IGFBP3), Hypoxia Inducible Factor 1, Alpha Subunit (HIF1A), Estrogen Receptor alpha (ESR1), Androgen Receptor (AR), Serine Peptidase Inhibitor, Clade E, Member 1 (SERPINE1), Superoxide Dismutase 2 (SOD2), Checkpoint Kinase 2 (CHEK2), and Cyclin-Dependent Kinase Inhibitor 1A (CDKN1A) (Figure 1K). Notably, AR and ESR1 were upregulated in aortic dissection, while the remaining hub genes were downregulated. This integrated analysis highlights critical genes and pathways involved in vascular aging, providing insights into their regulatory roles and potential links to aortic dissection and cellular senescence.
 |
Figure 1 GSE52093 dataset to construct a heatmap (A); The volcano plot depicted the status of differentially expressed genes associated with vascular aging in the GSE52093 dataset (B); GSE153434 dataset to construct a heatmap (C); The differentially expressed genes associated with vascular aging in the GSE153434 dataset volcano plot (D); The upregulated differentially expressed genes (E); and downregulated differentially expressed genes were identified (F); Regulatory Network Diagram of AD-related DemiR and DeVARGs (G); GO (H) and KEGG pathway (I) enrichment analysis; PPI network was constructed using Cytoscape software (J) and hub genes associated with vascular aging (K). |
LASSO Regression Model and Nomogram Analysis for Identifying Hub Genes in Aortic Dissection
To refine the hub genes identified, the GSE153434 dataset, with its larger sample size, was selected for further analysis. After normalizing the expression levels of the ten hub genes, a LASSO regression model was constructed using the “glmnet” package in R (Figure 2A and B). This process reduced the number of hub genes to seven: Androgen Receptor (AR), Cyclin-Dependent Kinase Inhibitor 1A (CDKN1A), Estrogen Receptor 1 (ESR1), Hypoxia-Inducible Factor-1α (HIF1A), Insulin-like Growth Factor Binding Protein 3 (IGFBP3), MYC, and Superoxide Dismutase 2 (SOD2). These genes were evaluated for their diagnostic potential in aortic dissection (AD) using ROC analysis, which revealed high diagnostic accuracy for each gene in the GSE153434 dataset: AR (86%), CDKN1A (86%), ESR1 (100%), HIF1A (97%), IGFBP3 (100%), MYC (93.5%), and SOD2 (89%). A subsequent box plot analysis confirmed the significant role of these seven genes in the GSE153434 dataset (Figure 2C–P). AR and ESR1 were found to be differentially downregulated in AD, while the remaining five genes (IGFBP3, CDKN1A, MYC, HIF1A, and SOD2) were differentially upregulated. To further explore the clinical utility of these genes, a nomogram model was constructed for AD diagnosis using the Hiplot platform (Figure 2Q). Calibration curves demonstrated minimal error between predicted and actual AD risk, confirming the model’s high predictive accuracy (Figure 2R). Decision curve analysis (DCA) indicated that the nomogram provided a superior clinical net benefit compared to individual genes (Figure 2S). Additionally, the clinical impact curve showed strong overlap between the “Number high risk” and “Number high risk with event” curves, further validating the nomogram’s predictive power (Figure 2T). Overall, the integration of the LASSO regression model and nomogram analysis highlights the critical roles of these seven genes in AD, suggesting their potential as biomarkers and their relevance in the pathological processes of vascular aging.
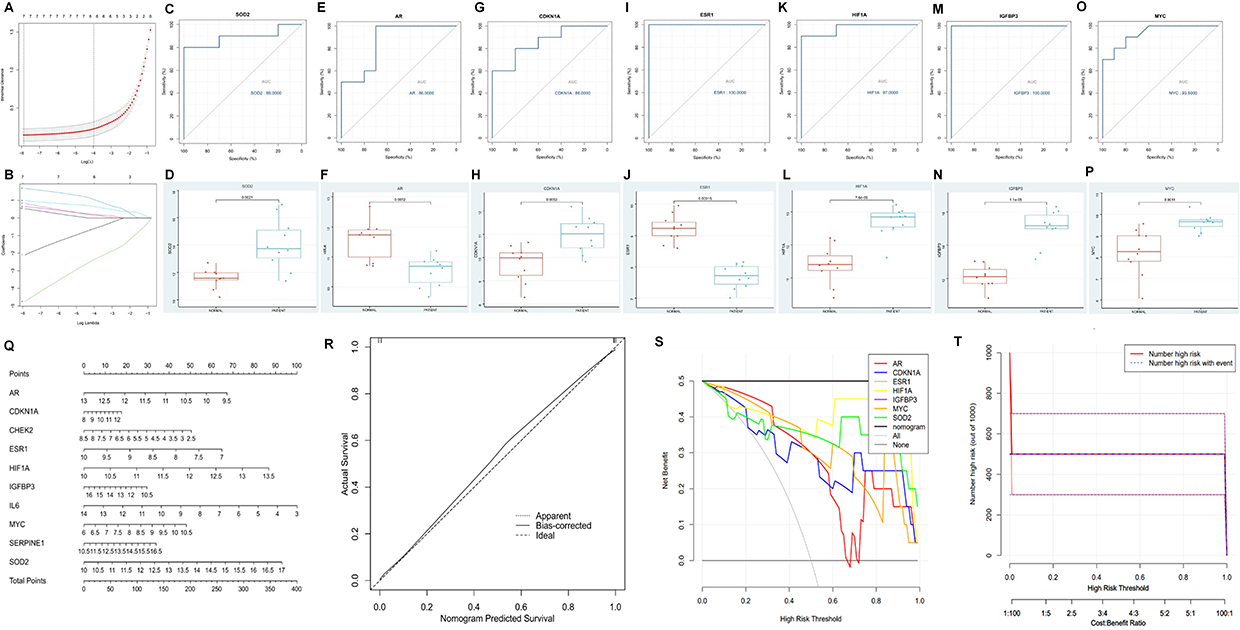 |
Figure 2 Identification of DeVARGs. Cross verification curve of LASSO regression (A); Coefficient plot of LASSO regression (B). ROC curve analysis and expression boxplot of DeVARGs: SOD2 (C and D), AR (E and F), CDKN1A (G and H), ESR1 (I and J), HIF1A (K and L), IGFBP3 (M and N), and MYC (O and P), respectively; Construction and validation of a diagnostic nomogram for vascular aging-related genes based on the GSE153434 dataset. Nomogram predicting the occurrence of vascular aging (Q); Calibration curves assessing the predictive ability of the nomogram model (R); Decision curves evaluating the clinical value of the nomogram (S); Clinical impact assessment of the nomogram model based on the decision curve (T). |
Results of Immune Cell Infiltration
After data standardization, the GSE153434 dataset was uploaded to the CIBERSORTx online database to analyze immune cell infiltration. The percentages of immune cell types were calculated using CIBERSORTx for 10 AAD samples and 10 normal aortic samples (Figure 3A). Significant differences in the relative abundance of B cells naive, NK cells activated, Monocytes, and Macrophages M0 were observed between normal aortic samples and AAD samples. After filtering out immune cell types that were non-existent (zero values in more than 75% of the samples), Pearson correlation analysis was performed on the remaining 14 types of immune cells, including immune cells across all samples (Figure 3B). For example, in all samples, NK.cells.activated showed a significant positive correlation with Macrophages M0 (r=0.63), while Macrophages M0 showed a significant negative correlation with Macrophages M2 (r=−0.71). Furthermore, Pearson correlation analysis was conducted between hub genes and immune cells (Figure 3C). As shown in the Figure 3D–O, ESR1 was significantly associated with Macrophages M2, T cells CD4 memory activated, and Macrophages M0. HIF1A was significantly correlated with B cells naïve, Macrophages M0, and Neutrophils. IGFBP3 was significantly associated with B cells naïve and Macrophages M0. MYC was significantly correlated with Macrophages M0. SOD2 was significantly associated with Macrophages M0, B cells naïve, and Neutrophils.
 |
Figure 3 The percentages of immune cell types were calculated using CIBERSORTx (A); Pearson correlation analysis including immune cells across all samples (B); Pearson correlation analysis between hub genes and immune cells ((C) *P < 0.05); Correlations between continuous variables were analyzed, ESR1 associated with Macrophages M2 (D); HIF1A associated with Neutrophils (E); IGFBP3 associated with Macrophages M0 (F) and B cells naïve (H); SOD2 associated with Neutrophils (I) and B cells naïve (J); HIF1A correlated with B cells naïve (K); MYC correlated with Macrophages M0 (L); HIF1A associated with Macrophages M0 (M); ESR1 correlated with T cells CD4 memory activated (N); SOD2 associated with Macrophages M0 (O). |
Validation of Hub Gene Expression Patterns in scRNA-Seq Data
Our single-cell transcriptome analysis provides a comprehensive overview of the cellular heterogeneity present in aortic dissection (AD) tissues compared to normal aortic tissue (Table S1). By analyzing samples from AD patients and a control group, we identified distinct cellular compositions that underline the complexity of cellular interactions in AD pathology (Figure 4A). We utilized 25,628 cells for analysis, deriving 70.3% from AD tissues and 29.7% from normal tissues (Figure S1A). A prominent feature of AD tissues was the overwhelming predominance of immune cells, accounting for 78.9% of the profiled cells, with a drastic reduction in the presence of other cell types such as endothelial cells and SMCs compared to controls (Figure S1B). We also successfully clustered these cells into seven primary cell types: macrophages, endothelial cells, fibroblasts, T cells, dendritic cells, mast cells and smooth muscle cells (Figure 4B). Then we analyzed the single-cell location of seven hub genes in AD group and control group (Figure S1C–I). Our analysis reveals the significant changes in macrophage proportions, we focus on macrophage subclusters to explore the characteristics of aortic dissection (Figure S1J and K). In this study, a total of 18,041 macrophages were detected, and differences in cluster distribution between the AD and control groups were observed (Figure 4C). We identified ten distinct macrophage subclusters within AD tissues, which exhibit varying expression patterns and functionalities (Figure 4D). Then we analyzed the single-cell location of seven hub genes in AD group (Figure 4E) and control group (Figure 4F). Next, we examined the expression of seven hub genes across these cell types. AR and ESR1 exhibited low expression across all cell types. CDKN1A and MYC was found to be expressed in nearly all cell types, however they were expressed down-regulated in AD tissue nearly all cell types. IGFBP3 exhibited moderate expression in SMCs and fibroblasts, especially up-regulated in AD tissue, but was low in other cell types (Figure 4G–N). SOD2 and HIF1A was found to be expressed in nearly all cell types, with the highest levels observed in macrophages and dendritic cell, which was up-regulated in AD tissue (Figures 4O–R and S1L–R).
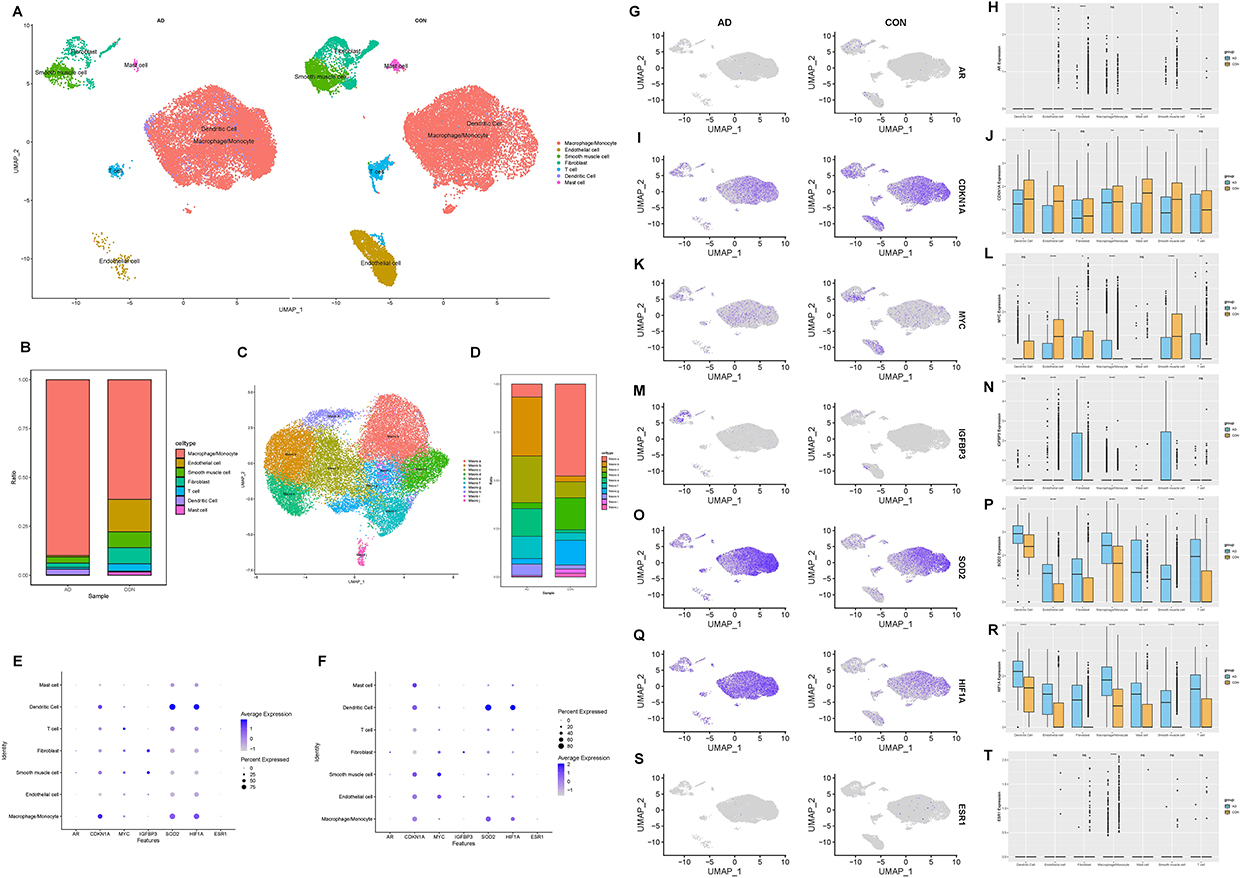 |
Figure 4 The UMAP plot showing that 25,628 cells from three samples are grouped by patients and the normal controls (A); The bar plot depicts the proportions of the seven major cell types in the AD and control aorta tissues (B); The source of macrophage samples (C); Bar plots display the proportions of macrophage subclusters in the control and AD groups (D); Bubble diagram of seven hub genes in AD group (E) and control group (F); Expression distribution of selected hub genes mapped on the UMAP plot and boxplot: AR (G and H), CDKN1A (I and L), MYC (K and L), IGFBP3 (M and N), SOD2 (O and P), HIF1A (Q and R), and ESR1 (S and T). |
Gene-Drug Interaction Network of Hub Genes
We also explored drugs that could potentially target these 7 hub genes by obtaining gene-drug interaction information from the DGldb database and importing it into Cytoscape software to construct a visual gene-drug interaction network of the hub genes (Figure 5). The results showed that the drug ESTORNE may target both the hub genes MYC and ESR1, the drug PACLITAXEL may target both the hub genes CDKN1A and SOD2, and the drugs FLUOROURACIL and CELECOXIB may simultaneously target CDKN1A and IGFBP3. For the hub gene CDKN1A, the drug with the highest matching coefficient is DIAZIQUONE, for the hub gene SOD2, the drug with the highest matching coefficient is DIACETYLMORPHINE, for the hub gene AR, the drug with the highest matching coefficient is NANDROLONE PHENPROPIONATE, for the hub gene ESR1, the drug with the highest matching coefficient is ESTRIOL, for the hub gene MYC, the drug with the highest matching coefficient is BIZELESIN, and for the hub gene HIF1A, the drug with the highest matching coefficient is MANASSANTIN B. These drugs may play a significant role in the treatment of aortic dissection.
 |
Figure 5 The Role Relationship Diagram of Hub Genes and Potential Drug Predictions. |
Potential Function of SOD2 in AD Pathogenesis
Quantitative reverse transcription PCR (qRT-PCR) was utilized to examine the mRNA expression of AR, MYC, CDKN1A, ESR1, HIF1A, IGFBP3, and SOD2 in human aorta samples. It was found that the mRNA expression of AR was notably diminished in AD samples when contrasted with control aortas. The resulting P values from the Mann–Whitney test, as depicted in Figure 6A, were 0.0023 for AR. Furthermore, the mRNA levels of other hub genes, such as ESR1, IGFBP3, SOD2, MYC, CDKN1A, and HIF1A (Figure 6B–G) were also evaluated in aortic tissue using qRT-PCR, respectively. In consideration of the notably elevated mRNA expression level of SOD2 in AD, and its relatively low expression in normal aortic tissues, compounded by the high node value of SOD2 in the PPI network, we have decided to select SOD2 for further verification at the protein level. In order to assess the expression of SOD2 in aortic sections, immunohistochemical staining and Western blot analysis were conducted. In order to determine the SOD2, protein expression of SOD2 was determined in AAD tissue samples compared with healthy aortic tissue specimens by Western blot (Figure 6H). The protein expression of SOD2 was 2.8-fold higher in AAD than healthy aortic tissue (P=0.004, Figure 6I). Immunohistochemical staining of SOD2 were performed in the aortic sections from the 9 AAD patients that had previously undergone the aortic dissection repair procedure and from 8 heart transplant donors. The immunohistochemical staining were performed to detect the expression of SOD2 in the AAD patients (Figure 6J–O). The expression of SOD2 (brown) in the aortic medial layer of (Figure 6J and K) the AAD patient by immunohistochemical staining. Meanwhile, the expression of SOD2 (brown) in the neovascularization of (Figure 6L–O) the AAD patient by immunohistochemical staining. Immunofluorescence staining revealed the expression and localization of SOD2 in aortic dissection tissue. Macrophages, identified by CD68 staining with Alexa Fluor 488, exhibited a distinct green fluorescence, confirming their presence within the aortic wall. SOD2 expression, visualized with CY3-conjugated secondary antibodies, was observed as red fluorescence, predominantly localized in the same regions as CD68-positive macrophages. Nuclei were counterstained with DAPI, emitting blue fluorescence, to delineate cellular structures and ensure proper tissue orientation. Merged images demonstrated significant colocalization of SOD2 (red) with CD68 (green) in smooth muscle cells, indicating that SOD2 is highly expressed in the macrophages of the aortic wall. Negative controls, performed by omitting primary antibodies, showed no detectable fluorescence, confirming the specificity of the staining. These results provide clear evidence of SOD2 expression in macrophages within aortic dissection tissue (Figure 6P–W).
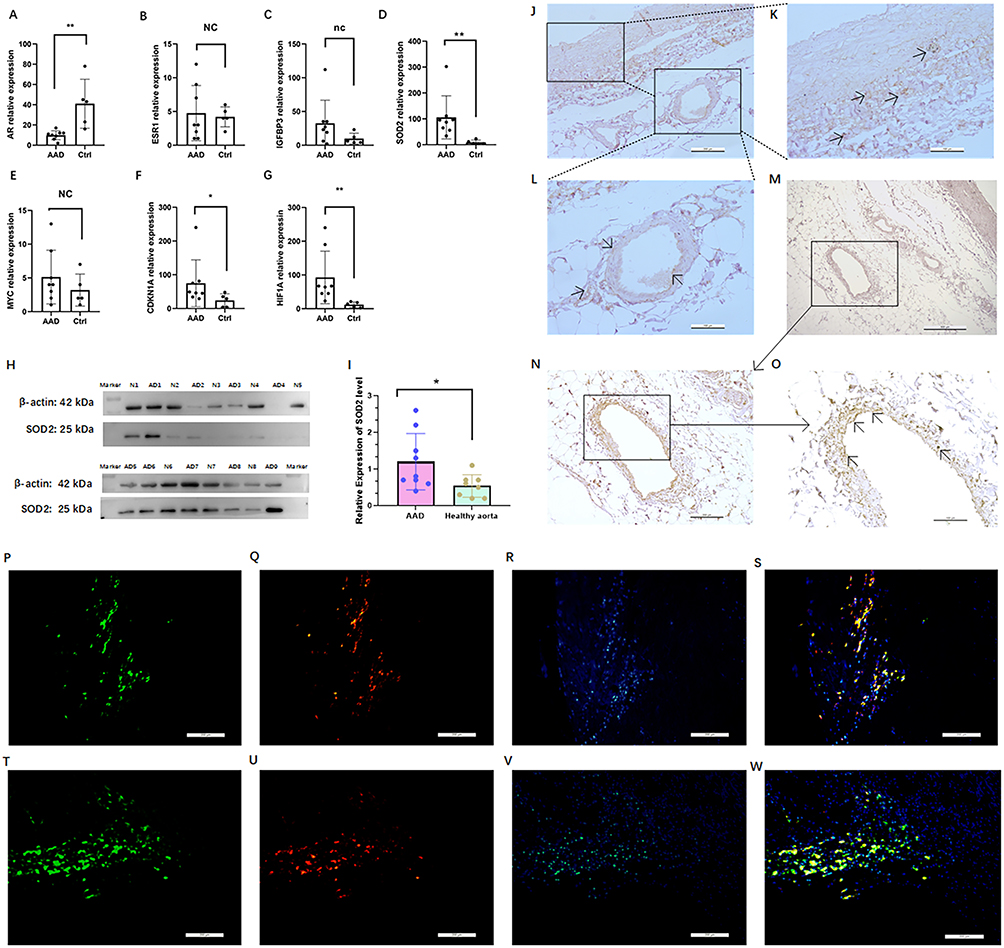 |
Figure 6 Expression analysis of hub genes in AAD and healthy aorta at mRNA level and protein level. Relative expression indicates expression of individual hub genes: AR (A); ESR (B); IGFBP3 (C); SOD2 (D); MYC (E); CDKN1A (F); and HIF1A (G) related to the expression of GAPDH, AAD specimens of acute aortic dissection (n=8), ctrl control healthy aorta (n=5); Analysis of SOD2 expression in AAD and healthy aorta at protein level and expression analysis by Western blot analysis (H) and quantification of the band intensities relative to the expression of β-actin (I); Immunohistochemical staining of SOD2 in the aortic dissection (AD3, Scale bar, overview image 200 μm) (J); The magnified images depict staining as revealed by staining for SOD2 within the AD3 wall (Scale bar, overview image 100 μm) (K and L). Immunohistochemical staining of SOD2 in the aortic dissection (AD5, Scale bar, 500 μm (M)); The magnified images depict staining as revealed by staining for SOD2 within the AD5 wall (overview image 200 μm (N)); The magnified images depict staining as revealed by staining for SOD2 within the AD5 wall (Scale bar, overview image 100 μm (O)). Immunofluorescence staining of macrophages (P), SOD2 (Q), nuclei were counterstained with DAPI (R) and merge (S) in the aortic dissection (AD3, Scale bar, overview image 200 μm); Immunofluorescence staining of macrophages (T), SOD2 (U), nuclei were counterstained with DAPI (V) and merge (W) in the aortic dissection (AD5, Scale bar, overview image 200 μm). *P < 0.05, ** P < 0.005, nc: no change/not significant; Arrows indicating positive SOD2 immunohistochemical staining. |
The Diagnostic Prowess of Serum SOD2 Utility in AAD by ROC Analysis
The baseline characteristics of the study cohort are shown in Table 1. It was observed that the patients exhibited a more substantial heart rate, and a greater proportion of hypertension, along with increased (P < 0.0011 and <0.0001, correspondingly). For other clinical metrics such as age, gender, body mass index (BMI), and the prevalence of diabetes, no significant differences were found between the healthy controls and the AAD groups. Similarly, these metrics also did not differ noticeably between the Stanford A AAD and healthy aorta control subsets. However, serum SOD2 protein levels were elevated in the Stanford B AAD group significantly increasing when compared to the healthy control group (P=0.0003 for Stanford B AAD vs Control).
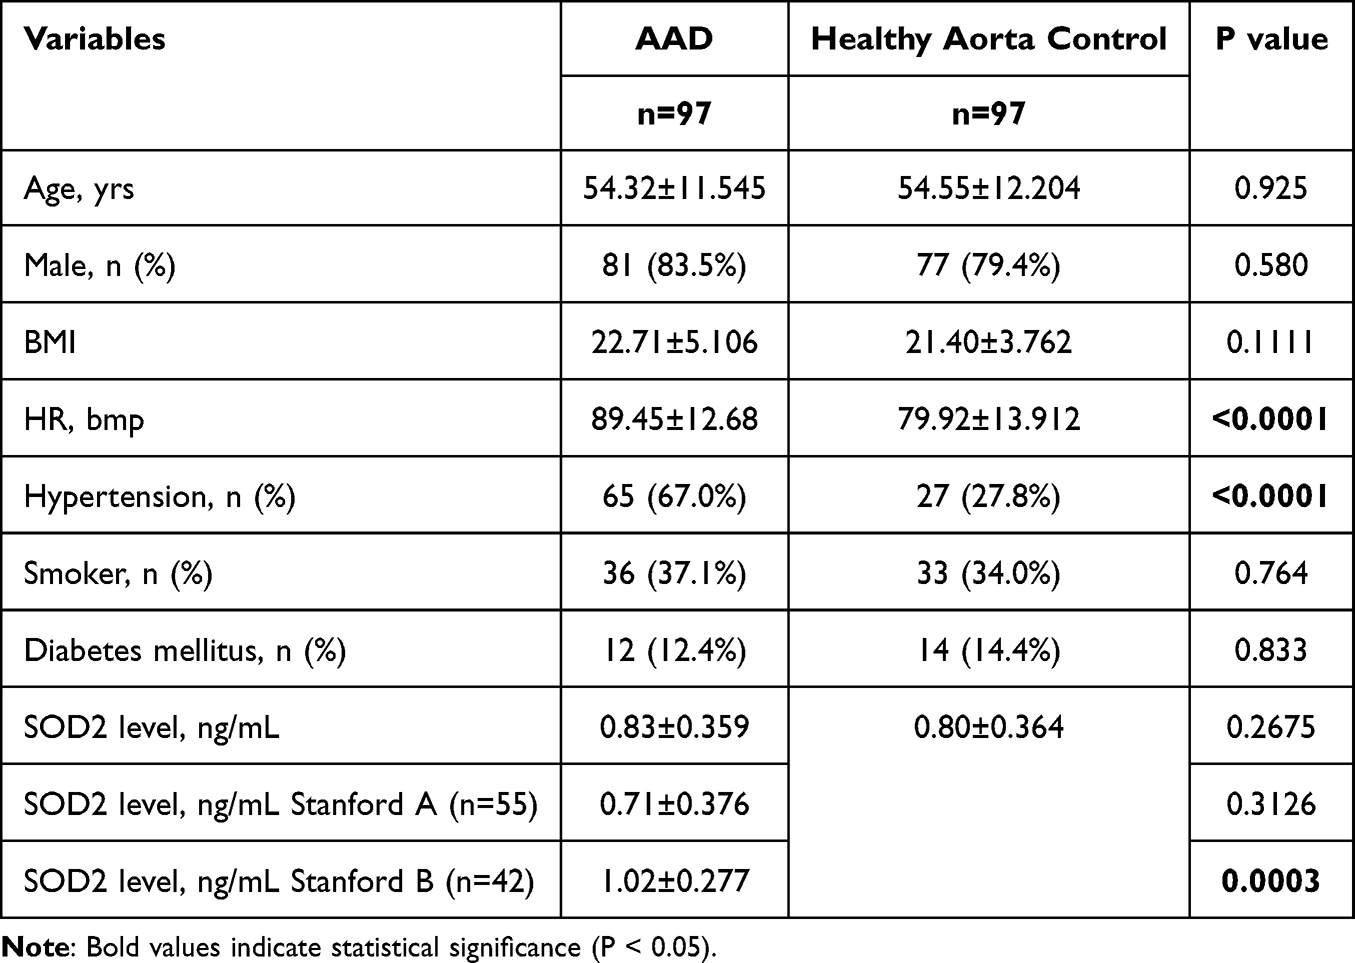 |
Table 1 Demographic and SOD2 Level of Participants Included in This Study |
Serum SOD2 protein levels were elevated in the healthy aorta control group but not significantly increasing when compared to the AAD group (Figure 7A). Sub-group analysis of AAD patient group, serum SOD2 concentrations (0.71±0.376 vs 1.02±0.277 ng/mL, P<0.0001) was significantly increased in Stanford A AAD patients compared to those in Stanford B AAD (Figure 7B). And without any significant differences between male and female AAD patients (Figure 7C), Additionally, there was no significant differences between normal AAD and hypertension AAD patients (Figure 7D), and no-smoker AAD and smoker AAD cases (Figure 7E). Thus, both survival and in-hospital death AAD cases were enrolled in the study subjects. As a result, there is a significantly higher SOD2 level in death cases compared to those in survival cases (P<0.001, Figure 7F). The correlation of SOD2 levels with clinical features was assessed in AAD subjects (Figure 7G). As a result, SOD2 levels were negatively correlated with HCT and PDW (R=−0.71, and R=−0.41, Figure 7H), BilD and BilT level (R=−0.42, and R=−0.23, Figure 7I). Meanwhile, SOD2 levels were positively correlated with PCT, RBC, and HGB (R=0.24, R=0.34, and P=0.27, Figure 7J), The ROC analysis determined the optimum threshold levels for SOD2 in AAD, which were 0.77 mg/L. Correspondingly, the Area Under the Curve values for AAD were 0.544, providing a sensitivity of 0.624%, and a specificity of 0.592% for all considered groups (refer to Table 2 and Figure 7K). For AAD patients, area under the curve values for Stanford A AAD was 0.270, AUC value for Stanford B AAD was 0.730, providing a sensitivity of 0.833%, and a specificity of 0.551% (Figure 7L). More importantly, cut-off value for SOD2 was 0.75ng/mL in relation to in-hospital mortality were further established by ROC analysis (See Table 2 and Figure 7M for details) for AAD groups, providing a sensitivity of 0.824%, and a specificity of 0.467%. Cut-off values were set at 0.75ng/mL for SOD2 in relation to in-hospital mortality, area under the curve values was 0.701 between death AAD patients and healthy aorta control (Figure 7N).
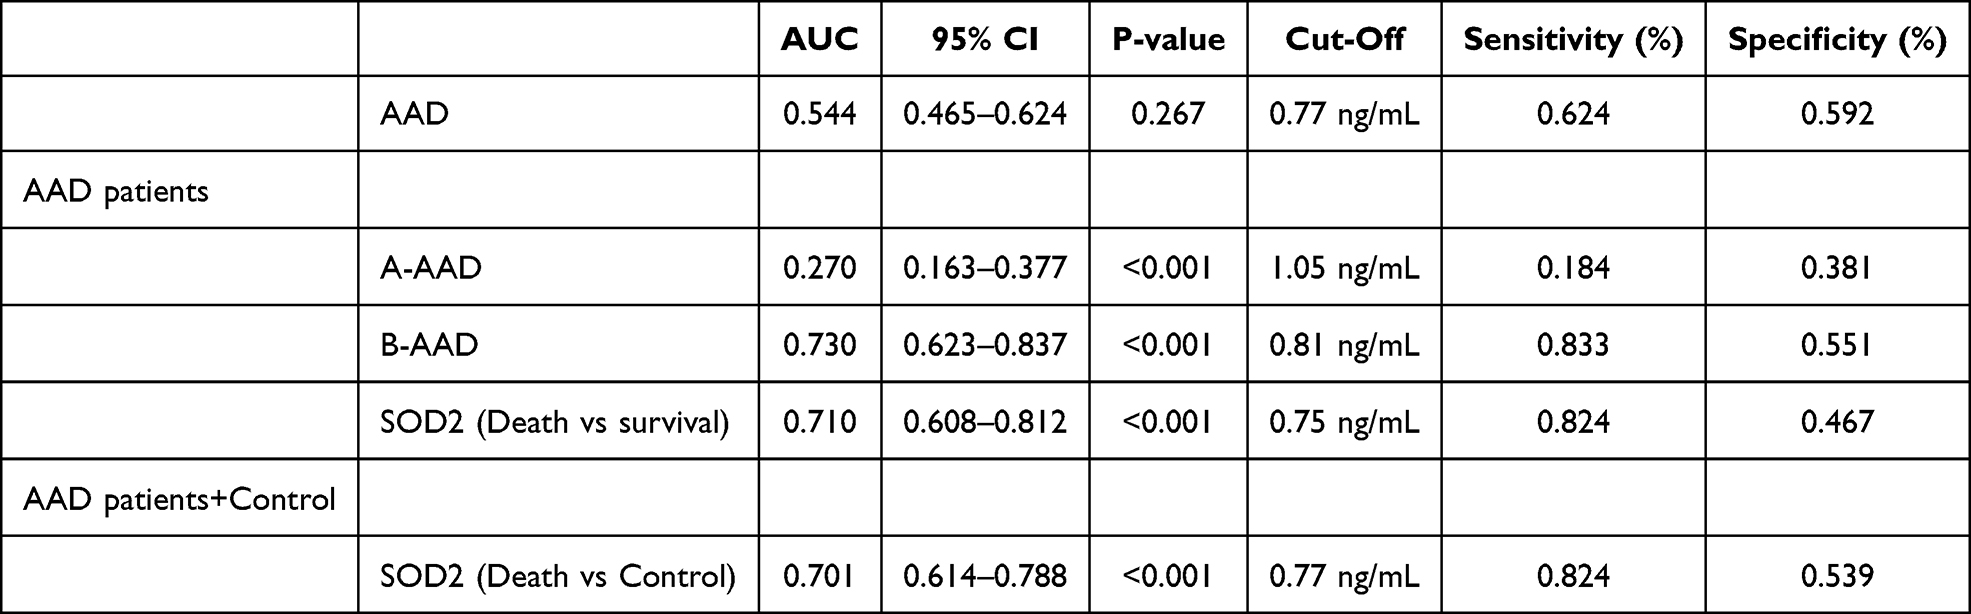 |
Table 2 Diagnostic Value of SOD2 for AAD Patients |
 |
Figure 7 Analysis of SOD2 levels in different groups. Comparison of SOD levels between AAD and controls (A); Stanford A AAD and Stanford B AAD (B); and sub-group analysis of SOD levels in AAD patients: b comparison of SOD2 levels between male and female patients (C); AAD with hypertension (D); AAD with smoker (E); and comparison of SOD2 levels between survival AAD patients and in-hospital mortality AAD patients (F); Between SOD2 and lipid series, BMI, GLU, D-Dimer and CRP (G); Between SOD2 and blood routine examination (H); Between SOD2 and liver function tests index (I); Between SOD2 and renal function series, coagulation function (J); ROC analysis of SOD2 levels for the evaluation of AAD (K); ROC analysis of SOD2 levels for the evaluation of Stanford B AAD (L); ROC analysis of SOD2 levels for the evaluation of in-hospital mortality within AAD (M); ROC analysis of SOD2 levels for the evaluation of in-hospital mortality between death AAD patients and healthy aorta control (N). The vertical axis represents the sensitivity and the horizontal axis represents the 1-specificity. The in-hospital mortality in different levels of serum SOD2 level for acute aortic dissection (O); Kaplan-Meier analysis survival curve according to different levels of SOD2 in all patients with acute aortic dissection (P); Kaplan–Meier analysis survival curve according to levels of SOD2 inpatients with Stanford A acute aortic dissection only (Q); Kaplan-Meier analysis survival curve according to levels of SOD2 in patients with Stanford B acute aortic dissection only (R). **P<0.005, ****P<0.0001, nc: no change/not significant. |
Among the type A patients with AAD, 26 (47.27%) were high level SOD2, defined as SOD2≥0.77ng/mL. Patients with Type A AAD and high level SOD2 had higher hemoglobin (HBG) compared with those with SOD2<0.77ng/mL. No differences were found in the other parameters between patients with and without high level SOD2 (Table 3). For patients with type B AAD, those with SOD2≥0.77ng/mL were comprised of had higher platelets (PLT), red cell distribution width (RDW) and cystatin (CYSC) compared to those with low level SOD2 (Table 3). The patients who low level SOD2 had higher red blood cell (RBC), hemoglobin (HGB), total cholesterol (TC), and hematocrit (HCT). There were no differences in the other parameters between patients with and without hypo-SOD2 (Table 3). In type, Stanford A AAD, the in-hospital mortality was higher in patients with higher SOD2 level compared to those without (77.1% vs 229%, P<0.001; Figure 7O). Kaplan-Meier survival analysis showed that survival was significantly lower in AAD patients with higher SOD2 level compared to those without (P=0.0081, Figure 7P), and also Stanford B AAD patients (P=0.0094, Figure 7Q). However, Kaplan-Meier survival analysis showed that survival was no significantly lower in Stanford A AAD patients with higher SOD2 level compared to those without (P=0.0738, Figure 7R).
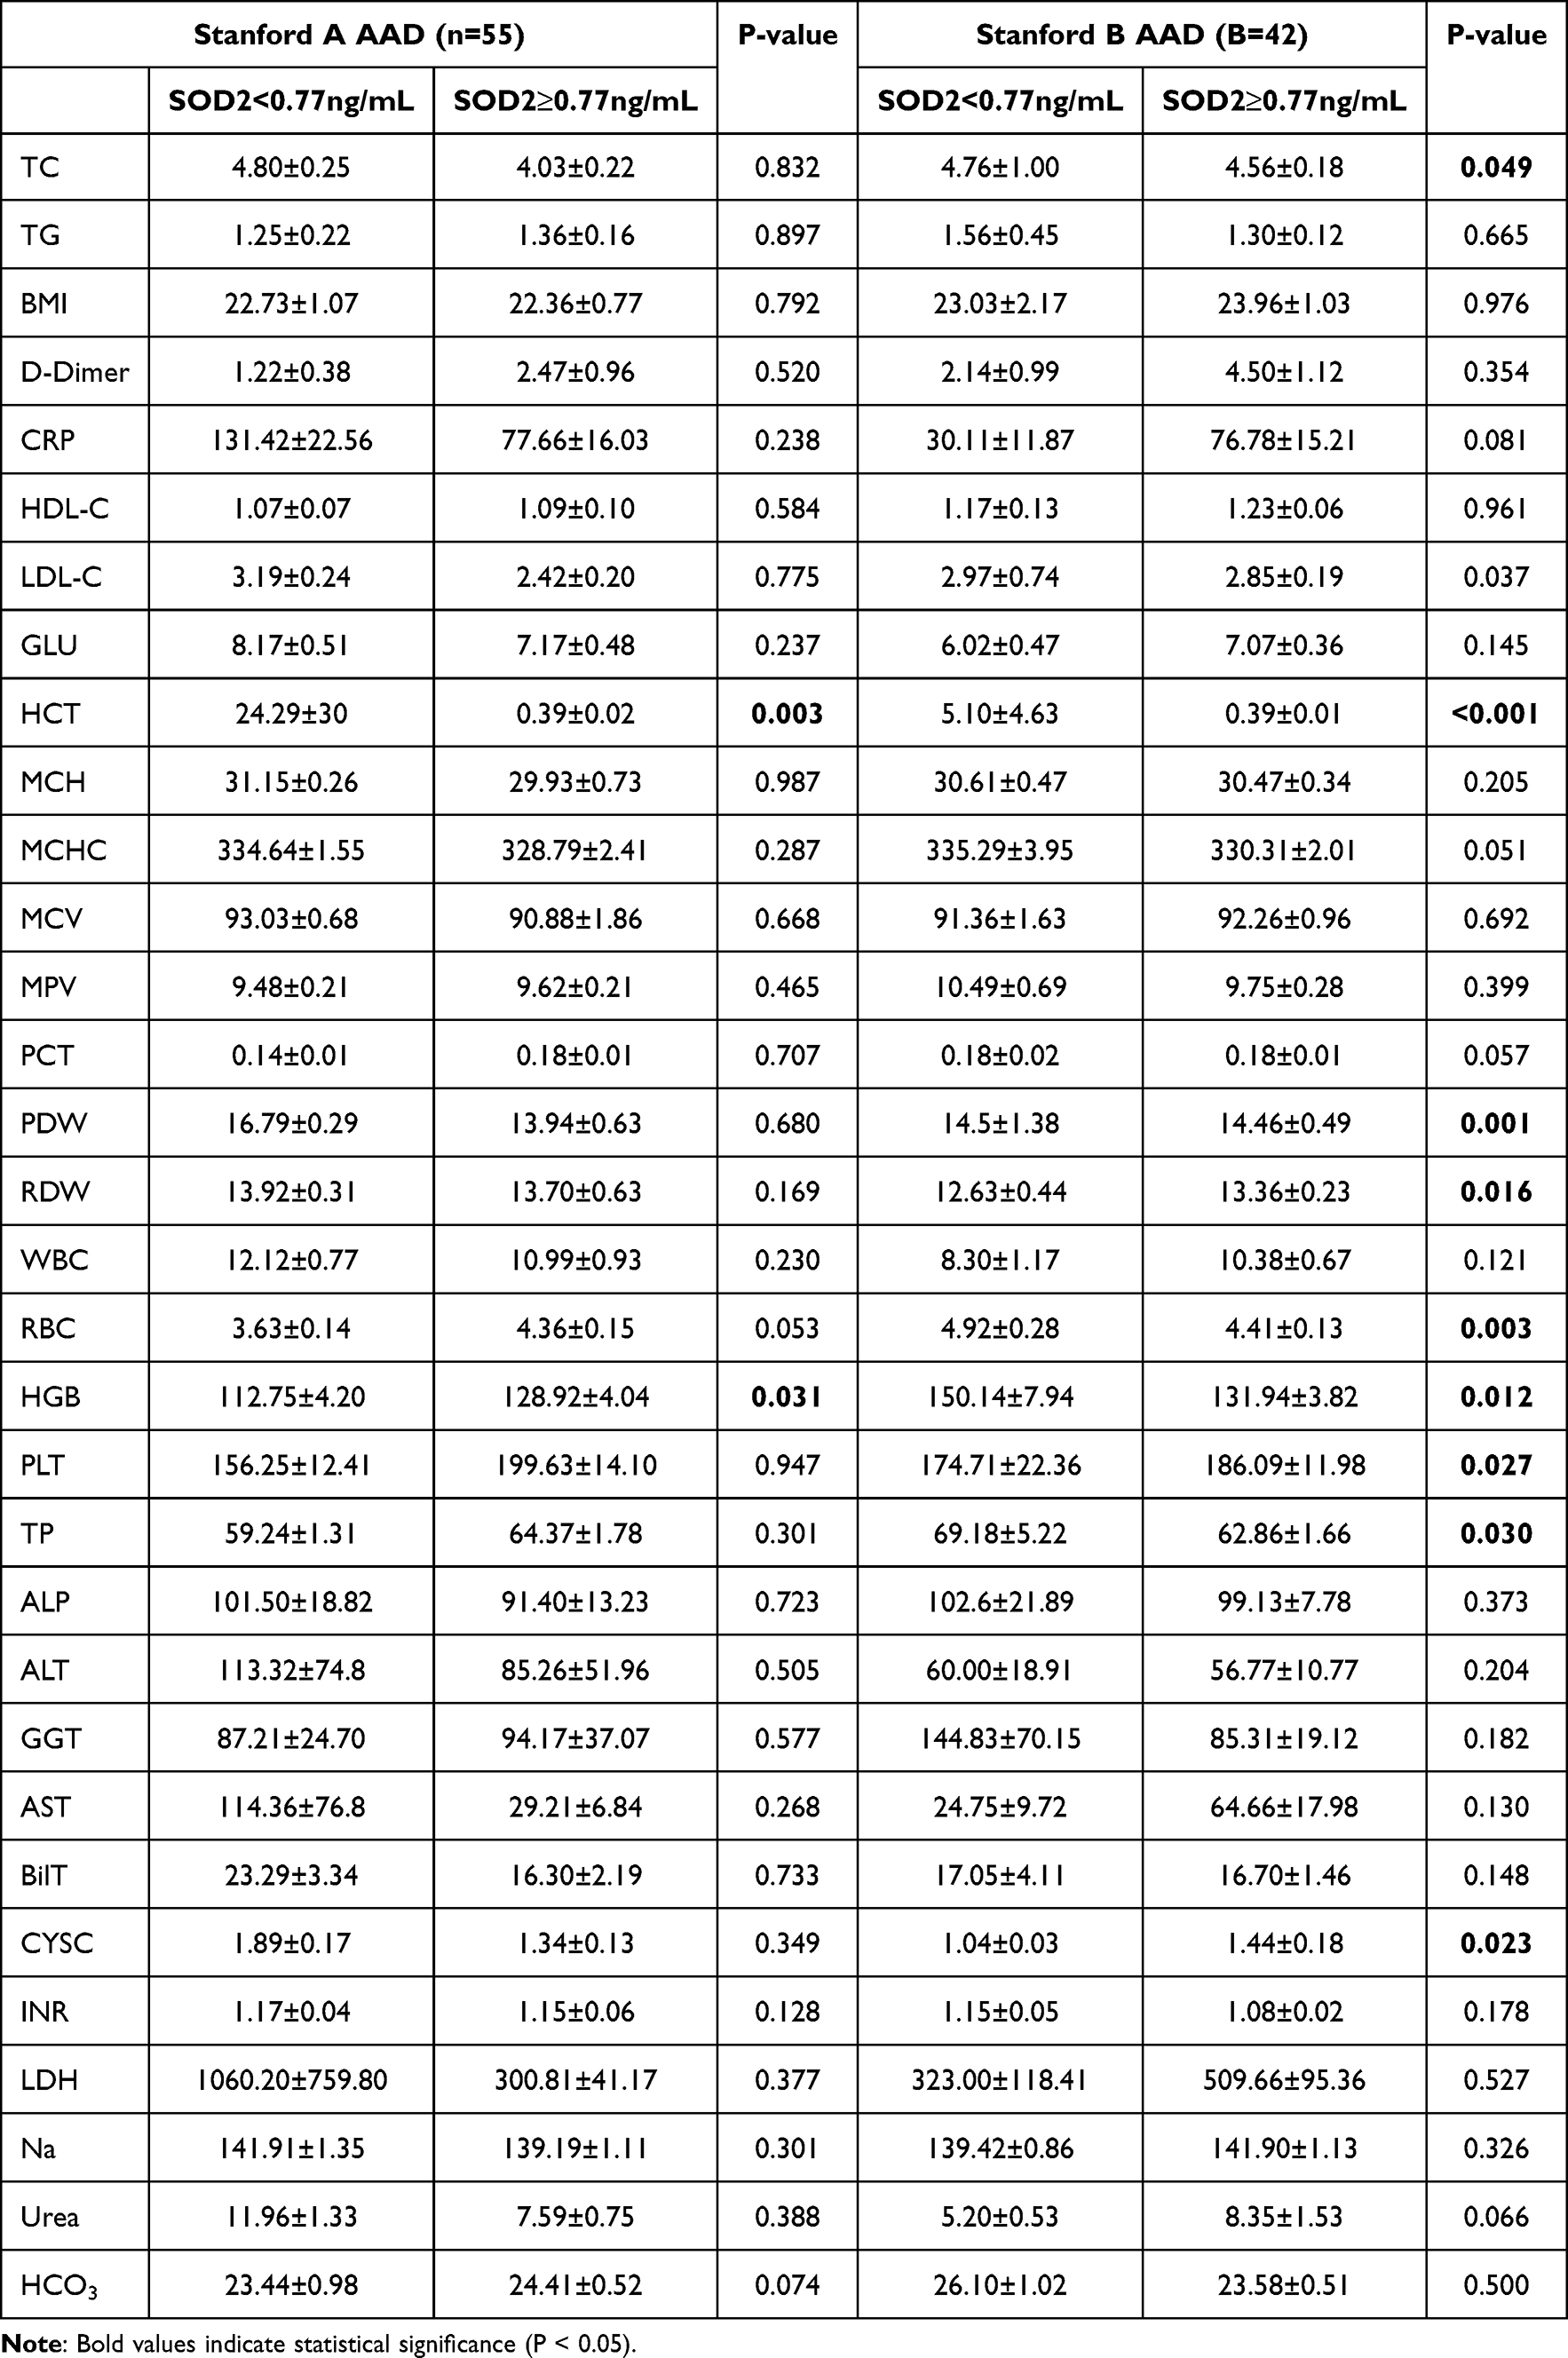 |
Table 3 Baseline Characteristics of Patients with Acute Aortic Dissection |
Discussion
This study made significant strides in understanding the genetic underpinnings of aortic dissection (AD), an often-lethal vascular disease associated with aging. Predominantly, we identified differentially expressed genes (DEGs) through the interrogation of two Gene Expression Omnibus (GEO) datasets (GSE52093 and GSE153434). In total, we found 194 upregulated and 518 downregulated DEGs, some of which were associated with vascular aging. By comparing these DEGs with vascular aging-related genes (DeVARGs) from the GenAge database, we narrowed down to a subset of 11 upregulated and 5 downregulated DEGs that have potential relevance in vascular aging. Particularly, the gene SOD2 was spotlighted for its significantly increased expression in AD relative to control samples. In terms of functional implications, GO and KEGG pathway analyses suggested roles of these DEGs in various cellular components, molecular functions, and biological processes including transcriptional regulation, transcription from RNA polymerase II promoters, as well as significant enrichment in cancer and cellular senescence pathways. The functional enrichment analysis facilitated our understanding of the possible biological context in which these DEGs operate. Subsequently, we built a protein-protein interaction (PPI) network to demonstrate the possible interactions among these DeVARGs. The CytoHubba plugin helped identify ten critical hub genes with high connectivity degrees, of which, seven were further validated using LASSO regression. These findings were not only instrumental in understanding the possible genetic factors contributing to the development and progression of AD but also opened an avenue for potential therapeutic targets. The identified DEGs, particularly SOD2, may also serve as promising biomarkers for AD detection, thus fueling further research in this direction. Finally, by constructing a gene-drug interaction network, possible therapeutic strategies were proposed for these hub genes, providing valuable insights for further pharmaceutical research.
Senescent cells exhibit proliferative stagnation as a significant trait, unlike other non-dividing cells, and have specific morphological and functional features. Increasing evidence suggests that aging cardiovascular cells, including endothelial cells, vascular smooth muscle cells, fibroblasts, cardiomyocytes, T cells, etc., accumulate as culprits in cardiovascular disease pathological states, aiding the amelioration or exacerbation of cardiovascular disease onset and outcomes.14,18 Evidence suggests that cellular senescence also participates in the process of heart regeneration, heart remodeling, atherosclerosis, and heart failure.19,20 Cellular aging is the fundamental cause of many diseases, with Superoxide Dismutase 2 (SOD2) playing a significant role in this process. SOD2 is an essential antioxidant enzyme that protects cells from oxidative stress damage by eliminating excessive superoxide anions.21 However, with the increase in age and the influence of other pathological factors, the activity of SOD2 can be inhibited, leading to the accumulation of free radicals and cell damage, ultimately causing cellular aging and disease onset.22,23 Therefore, studying the role of SOD2 in cellular aging and disease prevention and treatment is of great significance.24 Increasing research suggests that SOD2 plays a broad role in the prevention and treatment of various diseases. For instance, in cardiovascular diseases, SOD2 can prevent vascular injury and atherosclerosis by eliminating free radicals and improving endothelial cell function.25,26 In neurodegenerative diseases, SOD2 can also reduce neuronal cell mortality and alleviate neuropathological changes.27 In addition, SOD2 is considered an important factor in cancer resistance because the enzyme can enhance cell tolerance, inhibiting the growth and spread of cancer cells.28
The core focus of this study was to identify key differentially expressed genes associated with vascular aging, particularly in the development and progression of aortic dissection (AD). Interestingly, superoxide dismutase 2 (SOD2) emerged as a significant upregulated gene in the expression analyses, and its role in AD was further emphasized as it demonstrated strong diagnostic accuracy in receiver operating characteristic (ROC) analysis. The biological role of SOD2 is noteworthy in the context of vascular aging and consequent pathologies like AD. SOD2, also known as manganese-dependent superoxide dismutase (MnSOD), is an enzyme located in the mitochondrial matrix. It plays a pivotal role in fighting against oxidative stress by catalyzing the dismutation of the superoxide radical (O2−) into oxygen (O2) and hydrogen peroxide (H2O2).21 Mitochondrial oxidative stress has been implicated in various pathophysiological conditions, including atherosclerosis and vascular aging.29
SOD2 Expression in AAD
Under pathological conditions like AD, where rapid remodeling and inflammation occur, the production of reactive oxygen species13 is typically increased. Overproduction of ROS, without an equivalent increase in the capacity of antioxidant enzymes like SOD2, can lead to oxidative stress, which in turn amplifies the inflammatory response and promotes pathological remodeling.30 An interesting aspect of this study was the increased SOD2 mRNA and protein levels in AD, suggesting it may possess a compensatory role in the face of increased ROS production. This is consistent with published reports stating that SOD2 plays a protective role against vascular diseases that associated with ROS-induced vascular injury.31 Moreover, to support the potential mechanism, our study discovered the correlation between immune cell infiltration and several hub genes including SOD2, indicating potential immune modulation under oxidative stress in AD.32
Serum as Biomarker in AAD
Furthermore, the impressive diagnostic accuracy of SOD2 as demonstrated by ROC univariate analysis hints at its potential role as a biomarker in AAD, especially Stanford B AAD. The fast-paced and unpredictable progression of AAD usually makes early diagnosis and intervention a clinical challenge. Thus, robust biomarkers are critically needed. Herein, SOD2, with acceptable sensitivity and specificity in Stanford B AAD patients suggest its potential role in diagnosing AAD. Our study observed different levels of SOD2 in Stanford A and B AD patients, with more pronounced elevation in Stanford B. The underlying reason for this differential expression is not completely understood, but several theories can be proposed: 1. Stanford B AD involves the descending aorta, while Stanford A entails both the ascending and descending aorta. Given the different localizations and given that the descending aorta is subject to different hemodynamic stresses than the ascending aorta,33 it is possible that Stanford B may encounter distinct types or levels of oxidative stress, leading to increased SOD2 expression as a compensatory reaction. 2. Several researches indicate that Stanford B dissections might be associated with different pathological aspects than Stanford A, including inflammatory process, endothelial dysfunction, and aortic wall integrity.34,35 SOD2, primarily located in the mitochondria, plays a pivotal role in combating oxidative stress. In the event of vascular injury, the increase in reactive oxygen species13 might thereby drive a compensatory up-regulation of SOD2 in Stanford B AD patients; however, this is hypothetical and definitive molecular evidence is needed.
Importantly, the elevated level of SOD2 was correlated with an increased in-hospital mortality rate, suggesting SOD2 level could serve as a critical prognostic indicator linked to worse outcomes in AAD. As for the correlation between SOD2 and in-hospital mortality in acute AD, SOD2 levels might reflect the severity of oxidative stress and inflammatory response in these patients. Excessive oxidative stress and continued inflammation can lead to further vascular damage, impairing the structural integrity of the aorta, which in turn can lead to catastrophic events like aortic rupture, resulting in high mortality.36 Therefore, elevated SOD2 level, indicative of heightened oxidative stress and inflammatory response, could be associated with increased in-hospital mortality rates in AAD patients. Therefore, monitoring the serum level of SOD2 in AAD patients may provide crucial guidance for clinical decisions and treatments.
Potential Drugs for Modulation SOD2
The current exploration also suggested potential drugs for modulation of hub genes including SOD2, hinting a direction for pharmacological stimulation or inhibition as part of a therapeutic approach. However, thorough investigations and controlled clinical trials are necessary for validation before any application in clinical practice.
Strengths and Limitation
First, this study utilized a well-rounded bioinformatics approach with both differential gene expression analysis and computational biology tools to determine interaction networks. This ensured a high level of data integrity and accurate identification of potential target genes. Secondly, this study’s identification of SOD2 as a differentially expressed gene in Stanford B AD provides a strong basis for future investigations into its potential as a novel biomarker. Moreover, the utilization of Gene Ontology (GO) and Kyoto Encyclopedia of Genes and Genomes (KEGG) pathway analysis provided a deeper understanding of the biological contexts of DEGs, paving the way for novel insights into pathophysiological mechanisms of AD. However, there were some imitations in this study: this study is correlation-based and does not speak to causation. It’s possible that the observed changes in gene expression patterns could be due to confounding factors not accounted for in the study, such as other concurrent diseases or medications taken by the patients; Given the complex and heterogeneous nature of AAD, it might be difficult to extrapolate these findings to all AAD patients. Therefore, further multi-center studies with larger cohort size and diversely characterized AD types are required to ensure the findings’ generalizability. Lastly, this study identifies the differential expression of SOD2, but it does not thoroughly explore the underlying mechanism accounted for such variance. In-depth mechanistic studies are now needed to provide a more comprehensive understanding of the relationship between SOD2 and AAD. In summary, our results shed light on the fundamental role of SOD2 in the pathogenesis and advancement of AAD. It is suggestive of a key modulator of oxidative stress, a potential diagnostic biomarker, and therapeutic target in AAD. Future investigations should aim to develop and verify therapeutic strategies targeting SOD2 to modulate oxidative stress, limit the progression of vascular aging, and curb the high mortality rate associated with AD.
Conclusions
Our study reported a comprehensive evaluation of immune cell infiltration patterns, gene expression associated with aging, and specifically, the role of superoxide dismutase 2 (SOD2) in the context of aortic dissection (AD). Dramatic differences were observed in the infiltration of certain immune cells between normal and AD-related samples. This underlines the consequential role of immune modulation in the development and progression of AD. Simultaneously, an upregulation of the SOD2 gene in the AD samples was identified. The SOD2 gene, broadly recognized for its role in oxidative stress and its involvement in aging and inflammation, holds potential in the ongoing discourse on vascular aging. Furthermore, significant correlations were drawn between SOD2 and multiple immune cell types, providing a link between the component of vascular aging (via SOD2) and immune processes. Considering the growing necessity to manage AD with a broader perspective, this integrated research linking immunity, vascular aging, and the potential role of SOD2 is of critical importance. Our study illuminates the need to adapt to a more comprehensive approach that brings together various aspects such as immune alterations, vascular aging, and targeted genetics to significantly step up AD prevention, diagnosis, and therapeutic strategies. Moving forward, we believe the utilization of SOD2 as a biomarker, along with further exploration of the ties between immunity and vascular aging, will provide new avenues for the detection, treatment, and understanding of AD and other similar vascular diseases.
Data Sharing Statement
The datasets generated and/or analyzed during the current study are available from the corresponding author, Dr. Xinwu Lu, upon reasonable request.
Ethics Approval
All procedures involving human tissue samples received ethical approval. This study was conducted in accordance with the Declaration of Helsinki. The study was approved by the Ethics Committee of the Second Hospital of Shandong University (ethical approval number: [2021]134 for aortic tissue research. In our blood research, we selected suitable candidates identified as aortic dissection patients from the Department of Vascular Surgery at Shanghai Ninth People’s Hospital, with ethical approval number: SH9H-2018-T71-2. Written informed consent was obtained from all participants prior to their inclusion in the study.
Author Contributions
All authors made a significant contribution to the work reported, whether that is in the conception, study design, execution, acquisition of data, analysis and interpretation, or in all these areas; took part in drafting, revising or critically reviewing the article; gave final approval of the version to be published; have agreed on the journal to which the article has been submitted; and agree to be accountable for all aspects of the work.
Funding
This study was supported by Fundamental research program funding of Ninth People’s Hospital affiliated to Shanghai Jiao Tong university School of Medicine (JYZZ234) and Clinical Research Program of Ninth People’s Hospital affiliated to Shanghai Jiao Tong University School of Medicine (JYLJ202204).
Disclosure
The authors have no conflicts of interest in this work.
References
1. Paneni F, Diaz Canestro C, Libby P, Luscher TF, Camici GG. The aging cardiovascular system: understanding it at the cellular and clinical levels. J Am Coll Cardiol. 2017;69:1952–1967. doi:10.1016/j.jacc.2017.01.064
2. Olsson C, Thelin S, Stahle E, Ekbom A, Granath F. Thoracic aortic aneurysm and dissection: increasing prevalence and improved outcomes reported in a nationwide population-based study of more than 14,000 cases from 1987 to 2002. Circulation. 2006;114:2611–2618. doi:10.1161/CIRCULATIONAHA.106.630400
3. Hagan PG, Nienaber CA, Isselbacher EM, et al. The International Registry of Acute Aortic Dissection (IRAD): new insights into an old disease. JAMA. 2000;283:897–903. doi:10.1001/jama.283.7.897
4. Bossone E, Pyeritz RE, O’Gara P, et al. Acute aortic dissection in blacks: insights from the International Registry of Acute Aortic Dissection. Am J Med. 2013;126:909–915. doi:10.1016/j.amjmed.2013.04.020
5. Gorgoulis V, Adams PD, Alimonti A, et al. Cellular senescence: defining a path forward. Cell. 2019;179:813–827. doi:10.1016/j.cell.2019.10.005
6. Di Micco R, Krizhanovsky V, Baker D, d’Adda Di Fagagna F. Cellular senescence in ageing: from mechanisms to therapeutic opportunities. Nat Rev Mol Cell Biol. 2021;22:75–95. doi:10.1038/s41580-020-00314-w
7. Hayflick L, Moorhead PS. The serial cultivation of human diploid cell strains. Exp Cell Res. 1961;25:585–621. doi:10.1016/0014-4827(61)90192-6
8. He S, Sharpless NE. Senescence in health and disease. Cell. 2017;169:1000–1011. doi:10.1016/j.cell.2017.05.015
9. Kuilman T, Michaloglou C, Mooi WJ, Peeper DS. The essence of senescence. Genes Dev. 2010;24:2463–2479. doi:10.1101/gad.1971610
10. Milewicz DM, Guo DC, Tran-Fadulu V, et al. Genetic basis of thoracic aortic aneurysms and dissections: focus on smooth muscle cell contractile dysfunction. Annu Rev Genomics Hum Genet. 2008;9:283–302. doi:10.1146/annurev.genom.8.080706.092303
11. Chakraborty R, Saddouk FZ, Carrao AC, Krause DS, Greif DM, Martin KA. Promoters to Study Vascular Smooth Muscle. Arterioscler Thromb Vasc Biol. 2019;39:603–612. doi:10.1161/ATVBAHA.119.312449
12. Suh JH, Yoon JS, Kim HW, Jo KH. Adventitial fibroblast abormality in thoracic aortic aneurysms and aortic dissections. Korean J Thorac Cardiovasc Surg. 2011;44:406–412. doi:10.5090/kjtcs.2011.44.6.406
13. Kuehl H, Eggebrecht H, Boes T, et al. Detection of inflammation in patients with acute aortic syndrome: comparison of FDG-PET/CT imaging and serological markers of inflammation. Heart. 2008;94:1472–1477. doi:10.1136/hrt.2007.127282
14. Erusalimsky JD, Kurz DJ. Cellular senescence in vivo: its relevance in ageing and cardiovascular disease. Exp Gerontol. 2005;40:634–642. doi:10.1016/j.exger.2005.04.010
15. Tacutu R, Thornton D, Johnson E, et al. Human ageing genomic resources: new and updated databases. Nucleic Acids Res. 2018;46:D1083–D1090. doi:10.1093/nar/gkx1042
16. Gao H, Sun X, Liu Y, et al. Analysis of hub genes and the mechanism of immune infiltration in stanford type a aortic dissection. Front Cardiovasc Med. 2021;8:680065. doi:10.3389/fcvm.2021.680065
17. Zhu Y, Lingala B, Baiocchi M, et al. Type A aortic dissection-experience over 5 decades: JACC historical breakthroughs in perspective. J Am Coll Cardiol. 2020;76:1703–1713. doi:10.1016/j.jacc.2020.07.061
18. Childs BG, Li H, van Deursen JM. Senescent cells: a therapeutic target for cardiovascular disease. J Clin Invest. 2018;128:1217–1228. doi:10.1172/JCI95146
19. Yan C, Xu Z, Huang W. Cellular senescence affects cardiac regeneration and repair in ischemic heart disease. Aging Dis. 2021;12:552–569. doi:10.14336/AD.2020.0811
20. Chen MS, Lee RT, Garbern JC. Senescence mechanisms and targets in the heart. Cardiovasc Res. 2022;118:1173–1187. doi:10.1093/cvr/cvab161
21. Zelko IN, Mariani TJ, Folz RJ. Superoxide dismutase multigene family: a comparison of the CuZn-SOD (SOD1), Mn-SOD (SOD2), and EC-SOD (SOD3) gene structures, evolution, and expression. Free Radic Biol Med. 2002;33:337–349. doi:10.1016/s0891-5849(02)00905-x
22. Tsai YT, Yeh HY, Chao CT, Chiang CK. Superoxide Dismutase 2 (SOD2) in vascular calcification: a focus on vascular smooth muscle cells, calcification pathogenesis, and therapeutic strategies. Oxid Med Cell Longev. 2021;2021:6675548. doi:10.1155/2021/6675548
23. El Assar M, Angulo J, Rodriguez-Manas L. Oxidative stress and vascular inflammation in aging. Free Radic Biol Med. 2013;65:380–401. doi:10.1016/j.freeradbiomed.2013.07.003
24. Zou X, Ratti BA, O’Brien JG, et al. Manganese superoxide dismutase (SOD2): is there a center in the universe of mitochondrial redox signaling? J Bioenerg Biomembr. 2017;49:325–333. doi:10.1007/s10863-017-9718-8
25. Jiang W, Geng H, Lv X, et al. Idebenone protects against atherosclerosis in apolipoprotein E-deficient mice via activation of the SIRT3-SOD2-mtROS pathway. Cardiovasc Drugs Ther. 2021;35:1129–1145. doi:10.1007/s10557-020-07018-5
26. Chen ML, Zhu XH, Ran L, Lang HD, Yi L, Mi MT. Trimethylamine-N-oxide induces vascular inflammation by activating the NLRP3 inflammasome through the SIRT3-SOD2-mtROS signaling pathway. J Am Heart Assoc. 2017;6:e006347. doi:10.1161/JAHA.117.006347
27. Gao JM, Zhang X, Shu GT, et al. Trilobatin rescues cognitive impairment of Alzheimer’s disease by targeting HMGB1 through mediating SIRT3/SOD2 signaling pathway. Acta Pharmacol Sin. 2022;43:2482–2494. doi:10.1038/s41401-022-00888-5
28. Cyr AR, Hitchler MJ, Domann FE. Regulation of SOD2 in cancer by histone modifications and CpG methylation: closing the loop between redox biology and epigenetics. Antioxid Redox Signal. 2013;18:1946–1955. doi:10.1089/ars.2012.4850
29. Ungvari Z, Bagi Z, Feher A, et al. Resveratrol confers endothelial protection via activation of the antioxidant transcription factor Nrf2. Am J Physiol Heart Circ Physiol. 2010;299:H18–24. doi:10.1152/ajpheart.00260.2010
30. Forstermann U, Munzel T. Endothelial nitric oxide synthase in vascular disease: from marvel to menace. Circulation. 2006;113:1708–1714. doi:10.1161/CIRCULATIONAHA.105.602532
31. Chen SJ, Yen CH, Huang YC, Lee BJ, Hsia S, Lin PT. Relationships between inflammation, adiponectin, and oxidative stress in metabolic syndrome. PLoS One. 2012;7:e45693. doi:10.1371/journal.pone.0045693
32. Mantovani A, Garlanda C, Locati M. Macrophage diversity and polarization in atherosclerosis: a question of balance. Arterioscler Thromb Vasc Biol. 2009;29:1419–1423. doi:10.1161/ATVBAHA.108.180497
33. Munshi B, Parker LP, Norman PE, Doyle BJ. The application of computational modeling for risk prediction in type B aortic dissection. J Vasc Surg. 2020;71:1789–1801e1783. doi:10.1016/j.jvs.2019.09.032
34. Cifani N, Proietta M, Tritapepe L, et al. Stanford-A acute aortic dissection, inflammation, and metalloproteinases: a review. Ann Med. 2015;47:441–446. doi:10.3109/07853890.2015.1073346
35. Erbel R, Aboyans V, Boileau C, et al. 2014 ESC Guidelines on the diagnosis and treatment of aortic diseases: document covering acute and chronic aortic diseases of the thoracic and abdominal aorta of the adult. The Task Force for the Diagnosis and Treatment of Aortic Diseases of the European Society of Cardiology (ESC). Eur Heart J. 2014;35:2873–2926. doi:10.1093/eurheartj/ehu281
36. Liu Z, Gou Y, Zhang H, et al. Estradiol improves cardiovascular function through up-regulation of SOD2 on vascular wall. Redox Biol. 2014;3:88–99. doi:10.1016/j.redox.2014.11.001
 © 2025 The Author(s). This work is published and licensed by Dove Medical Press Limited. The
full terms of this license are available at https://www.dovepress.com/terms
and incorporate the Creative Commons Attribution
- Non Commercial (unported, 4.0) License.
By accessing the work you hereby accept the Terms. Non-commercial uses of the work are permitted
without any further permission from Dove Medical Press Limited, provided the work is properly
attributed. For permission for commercial use of this work, please see paragraphs 4.2 and 5 of our Terms.
© 2025 The Author(s). This work is published and licensed by Dove Medical Press Limited. The
full terms of this license are available at https://www.dovepress.com/terms
and incorporate the Creative Commons Attribution
- Non Commercial (unported, 4.0) License.
By accessing the work you hereby accept the Terms. Non-commercial uses of the work are permitted
without any further permission from Dove Medical Press Limited, provided the work is properly
attributed. For permission for commercial use of this work, please see paragraphs 4.2 and 5 of our Terms.