Back to Journals » Journal of Hepatocellular Carcinoma » Volume 10
LINC00886 Facilitates Hepatocellular Carcinoma Tumorigenesis by Sequestering microRNA-409-3p and microRNA-214-5p
Authors Li L ![]() , Ai R
, Ai R ![]() , Yuan X, Dong S, Zhao D
, Yuan X, Dong S, Zhao D ![]() , Sun X, Miao T, Guan W
, Sun X, Miao T, Guan W ![]() , Guo P, Yu S, Nan Y
, Guo P, Yu S, Nan Y
Received 2 March 2023
Accepted for publication 1 June 2023
Published 8 June 2023 Volume 2023:10 Pages 863—881
DOI https://doi.org/10.2147/JHC.S410891
Checked for plagiarism Yes
Review by Single anonymous peer review
Peer reviewer comments 3
Editor who approved publication: Dr Ahmed Kaseb
Lu Li,1,* Rong Ai,1,* Xiwei Yuan,1 Shiming Dong,1 Dandan Zhao,1 Xiaoye Sun,2 Tongguo Miao,1 Weiwei Guan,1 Peilin Guo,1 Songhao Yu,1 Yuemin Nan1
1Department of Traditional and Western Medical Hepatology, Third Hospital of Hebei Medical University & Hebei Provincial Key Laboratory of Liver Fibrosis in Chronic Liver Diseases, Shijiazhuang, Hebei, 050051, People’s Republic of China; 2Department of Organ Transplant Center, Tianjin First Central Hospital, Tianjin, 300192, People’s Republic of China
*These authors contributed equally to this work
Correspondence: Yuemin Nan, Department of Traditional and Western Medical Hepatology, Third Hospital of Hebei Medical University, Shijiazhuang, Hebei, 050051, People’s Republic of China, Tel +86 311-66781227, Fax +86 311-87023626, Email [email protected]
Purpose: As the major subtype of liver cancer, hepatocellular carcinoma (HCC) suffers from high mortality and is prone to recurrence. Long non-coding RNAs (lncRNAs) are well characterized to be pivotal players contributing to HCC pathogenesis and progression. Therefore, this study intended to probe the biological functions of LINC00886 in hepatocarcinogenesis.
Patients and Methods: Quantitative real-time polymerase chain reaction (qRT-PCR) was applied to analysis of LINC00886, microRNA-409-3p (miR-409-3p), microRNA-214-5p (miR-214-5p), RAB10 and E2F2 expression. Subcellular localization of LINC00886 was identified through a fluorescent in situ hybridization (FISH) kit and a subcellular assay. Additionally, proliferated cells were determined with EdU as well as cell counting kit-8 (CCK-8) assays. Scratch and Transwell assays were applied to detect migratory and invasive cells. Apoptotic cells were measured via TUNEL staining assay. Furthermore, targeted binding between LINC00886 and miR-409-3p or miR-214-5p was validated utilizing dual-luciferase reporter assays. RAB10, E2F2 and NF-κB signaling-associated protein levels were evaluated utilizing Western blot.
Results: LINC00886, RAB10 and E2F2 levels were aberrantly increased, with the abnormal expressed decline of miR-409-3p and miR-214-5p, in HCC tissues, cells and peripheral blood mononuclear cells (PBMCs). Silencing LINC00886 attenuated the proliferative, migratory, invasive, and anti-apoptotic potential of HCC cells, while LINC00886 overexpression proceeded in the contrary direction. Mechanistically, miR-409-3p and miR-214-5p were validated as binding targets for LINC00886 and inverted the biological functions of LINC00886 during HCC progression. Furthermore, the LINC00886-miR-409-3p/miR-214-5p axis could regulate RAB10 and E2F2 expression via mediating NF-κB pathway activation in hepatocarcinogenesis.
Conclusion: Our findings indicated that LINC00886 facilitated HCC progression via absorbing miR-409-3p or miR-214-5p to upregulate RAB10 and E2F2 through activation of NF-κB pathway, offering a promising novel target for HCC therapy.
Keywords: LINC00886, miR-409-3p, miR-214-5p, hepatocellular carcinoma, NF-κB signaling
Graphical Abstract:

Introduction
Primary liver cancer represents the prevalent lethal solid tumor and ranks third major contributor to global deaths associated with malignancy, accounting for ~906,000 first-diagnosed cases and 830,000 fatalities in 2020.1 Additionally, hepatocellular carcinoma (HCC) constitutes roughly 90% of liver tumor cases with being its major histological subtype.2 Notably, hepatocellular carcinogenesis is a step-by-step process showing consecutive neoplastic transitions from chronic liver inflammation to liver fibrosis to subsequent cirrhosis and consequent pathological cancer.3,4 Furthermore, HCC is at high resistance to therapeutic interventions. Consequently, complete resection of HCC tumors does not protect the residual liver from subsequent recurrent de novo tumors (5-year recurrence rate up to 70% after surgical resection) with consistently dismal survival below 15% in 5 years.5,6 A comprehensive insight into the pathogenesis of HCC is therefore essential.
Long noncoding RNAs (lncRNAs) featured with their lack of protein-coding potential and a length of exceeding 200 nucleotides.7 It is now well recognized that lncRNAs are increasingly becoming essential regulators of gene expression networks in various biological processes,8 particularly in the occurrence and progression of cancer.9–13 Recently, various research has pointed out the engagement of lncRNAs in the formation and progression of HCC.14–16 HCC tissue samples and cell lines were highly expressed lncRNA-PDPK2P, and its high expression was notably related to poor prognosis.17 LncRNA NBR2 in HCC cell lines is instrumental in dampening cell proliferation via suppressing cytoprotective autophagy.18 During multistage of hepatocellular tumorigenesis, most studies have predominantly centered on identifying differentially expressed lncRNAs (DELs) between HCC and controls, while few investigators have focused on liver cirrhosis (LC). Thus, the role of DELs in hepatocarcinogenesis has yet to be comprehensively clarified.
Our previous work has identified new predictive biomarkers based on mRNAs expression analysis via transcriptome sequencing (RNA-Seq) of hepatic tissues from healthy volunteers, patients with chronic hepatitis B, patients with LC and HCC,19 leaving disease-associated lncRNAs to be further explored. Herein, a time-course analysis was conducted to characterize the predominant lncRNAs among the control, LC, and HCC groups. Therefore, this study offers a novel perspective on the underlying mechanisms of lncRNAs in hepatocarcinogenesis, which may help to identify novel biomarkers and establish efficient treatment alternatives for HCC patients.
Materials and Methods
Study Subjects and HCC Datasets
Fifteen human liver specimens in total, including 5 liver transplant donors (CON), 5 patients with LC and 5 patients with HCC, were acquired at the Third Hospital of Hebei Medical University from November 2019 to March 2022. In particular, healthy liver tissues were acquired from living liver donors with written informed consents who voluntarily provide their livers for transplantation to patients with end-stage liver disease or other liver-related conditions in accordance with the principles set forth in the Declaration of Istanbul. Simultaneously, blood samples from 20 healthy volunteers (CON), 20 patients with LC, and 20 patients with HCC were collected. Inclusion criteria were described below: (1) Adult subjects (≥18 years); (2) Written informed consent signed before enrolling in the group; (3) Diagnostic criteria aligned with broadly accepted clinical guidelines for LC20,21 and HCC.22 Exclusion criteria were as follows: (1) Any preoperative therapy was performed for HCC cases, such as chemotherapy and radiotherapy. (2) Pregnancy; (3) Combined with other malignant tumors; (4) Concomitant with severe cardiovascular, pulmonary, diabetes or renal diseases. Our study was authorized by the ethics committee of the Third Hospital of Hebei Medical University and carried out in accordance with the Declaration of Helsinki.
Removed liver specimens were instantly stored at −196°C liquid nitrogen for further use. Whole blood samples from control, LC and HCC patients were collected with the use of Ficoll medium (Solarbio Life Sciences, Beijing, China) to extract peripheral blood mononuclear cells (PBMCs) followed with immediate reservation at −80°C for the next step of PCR analysis. The lncRNAs expression profile matrix of HCC samples was retrieved from the TCGA-LIHC hg38 dataset downloaded from the National Cancer Institute Genomic Data Commons website (GDC, https://portal.gdc.cancer.gov/).23 Only patients diagnosed as per the International Classification of Disease for Oncology, 3rd Edition (ICDO3) histology code 8170 (TCGA-HCC) and containing paired paracancerous tissues were included in the study, resulting in 49 enrolled paired samples.
Cell Culture
LX2 (human normal hepatic stellate cell line) and HCC (Hep3B, Huh7) cell lines (Procell, Wuhan, China) were cultured at 37°C using Dulbecco’s Modified Eagle Medium (Gibco, USA) comprising 10% fetal bovine serum (Biological Industries, Israel) and 1% streptomycin/penicillin solution (Gibco, USA) within a humid incubator aired with 5% CO2.
Cell Transfection
The 6-well plates were applied to incubate 2.5 × 10⁵ Hep3B and Huh7 cells overnight which were transiently transfected utilizing LipofectamineTM 3000 (Invitrogen, Carlsbad, CA, USA). Three small interfering RNAs (siRNAs) designed against LINC00886 (Si-LINC00886), the siRNA control (Si-NC), LINC00886 overexpression vector (pcDNA3.1-LINC00886) and pcDNA3.1 plasmid (pcDNA3.1) were synthesized from GenePharma (Shanghai, China). In addition, miR-409-3p or miR-214-5p mimic and inhibitor, as well as the corresponding controls (miR-NC) were produced from Ribobio (Guangzhou, China). The siRNA sequences were demonstrated in Table S1.
Quantitative Real-Time Polymerase Chain Reaction (qRT-PCR)
TRIzol (Invitrogen) was utilized to separate total RNA from 3 groups of liver tissues and PBMCs, as well as HCC cells. The PrimeScript RT reagent kit with gDNA Eraser was utilized to perform cDNA synthesis, and qRT-PCR was performed using TB Green Premix Ex Taq II (TaKaRa, Dalian, China) following the manufacturer’s protocols. For miRNAs quantitation, miDETECT A Track miRNA qRT-PCR Starter Kit, miRNAs and U6 in our work were acquired from Ribobio on a 7500 RealTime PCR System (Applied Biosystems, USA). The primer sequences were shown in Table S1. RNA expression was evaluated using β-actin or U6 as an internal control and quantified according to the 2−ΔΔCt method.
EdU Cell Proliferation Assay
The kit of BeyoClick™ EdU (5-ethynyl-2’-deoxyuridine) assay with Alexa Fluor 488 (Beyotime, China) was performed to assess proliferated cells as per the manufacturer’s recommended procedure. HCC cells (5 × 10⁴/well) were cultured in 12-well plates overlaid with a sterile coverglass overnight at 37°C after transfection. Following 2 additional hours of incubation with 10 μM EdU working solution, 4% paraformaldehyde (PFA) was administrated for a 15-min cell fixation, enhanced immunostaining permeabilization solution for a 15-min cell penetration and click reaction solution and Hoechst 33342 (1:1000) for 30-min and 10-min cell stains, respectively. At least three random fields of cells were imaged utilizing a fluorescence microscope (IX53, Olympus, Japan) and Image J software was conducted for analysis.
Cell Counting Kit-8 (CCK-8) Assay
Ninety-six-well plates were utilized to inoculate transfected Hep3B and Huh7 cells (2 × 10³ cells per well). Following 0, 24, 48, 72 or 96 h of cell incubation, each well was loaded with 100 μL complete culture medium containing 10 μL CCK-8 solution (GLPBIO, USA). After 2 additional hours of incubation with the cells, each group’s absorbance was then determined at 450 nm and 630 nm utilizing a Microplate Reader (ELX800, BioTek, USA).
Scratch Assay
Transfected cells (3 × 10⁵/well) were incubated in 6-well plates with serum-free medium overnight at 37°C until they achieved >90% confluence. Sterilized pipette tips were then employed for scratches in monolayer cells after three gentle rinses with PBS. Following 48 h of cell incubation, the scratch process was photographed with an inverted microscope (Olympus, Japan). Furthermore, cell migratory capacity was evaluated via Image J software.
Transwell Assay
Transfected cells in each group were inoculated into serum-free medium at 2.5×10⁵/mL density. A 200 μL cell suspension was then seeded in the top Transwell chamber (Costar, Corning Incorporated, Corning, NY, USA) to evaluate cell migration, with 500 μL complete medium inserted in the bottom chamber. Following culture for 24 hours, cells traversing the membranes were dyed with 0.1% hematoxylin for 15 min and measured on a microscope. The steps of cell invasion assay were identical to those of the migration assay apart from a coat of BD Matrigel (San Jose, CA, USA) applied to the top compartment. Finally, cells selected from three random fields were pictured and calculated (200×).
TUNEL Staining Assay
The One Step TUNEL Apoptosis Assay Kit (Beyotime, China) was employed to analyze apoptotic cells as per the manufacturer’s instruction. In short, 12-well plates containing a sterile coverglass were applied to inoculate transfected cells overnight at 8 × 10⁴ cells per well. Afterwards, the adherent cells were immobilized utilizing 4% PFA for 30 min, incubated with the TUNEL solution for 1 hour, and finally dyed via DAPI for 10 min under light protection. Images of at least three randomly chosen regions were photographed utilizing the fluorescence microscope (Olympus, Japan) and computed via Image J software.
Nuclear-Cytoplasmic RNA Isolation Assay
The subcellular fractions of Hep3B and Huh7 cells were detected via the PARIS Kit (Invitrogen, USA) following a previously published protocol.24 The proportion of subcellular distributed LINC00886 in HCC cells was measured through qRT-PCR, utilizing β-actin to be the internal reference for cytoplasmic fraction and U6 for nuclear fraction.
RNA Fluorescence In Situ Hybridization
The subcellular location of LINC00886 in Hep3B and Huh7 cells was detected utilizing a fluorescent in situ hybridization (FISH) kit acquired from RiboBio as previously published.25 Cy3-labeled LINC00886 FISH probes were produced by RiboBio, with human U6 (LNC110101, RiboBio) and human 18S (LNC110102, RiboBio) as positive controls for nuclear and cytoplasmic RNA, respectively. Meanwhile, the cell nuclei were dyed with DAPI for visualization. Fluorescent images were pictured utilizing the FV3000 confocal microscope.
Dual‑luciferase Reporter Assay
The online starbase (http://starbase.sysu.edu.cn) was utilized to estimate targeted binding. The wild-type plasmid or mutated vectors of LINC00886, whose 3ʹ untranslated regions (3ʹUTR) sequences incorporated the binding regions of miR-214-5p or miR-409-3p, were constructed from RiboBio. Subsequently, co-transfection of the luciferase vectors and miR-409-3p mimic, miR-214-5p mimic, or miR-NCs was applied in 293T cells. Following 48 hours transfection, the Renilla luciferase activity was evaluated utilizing the Dual-luciferase Reporter Assay Kit (Promega) with the luciferase activity of Firefly as a normalized reference.
Western Blot Analysis
RIPA buffer (Solarbio, Beijing, China) was utilized to separate total proteins from cell lysates. After resolution using 8% sodium dodecyl sulfate–polyacrylamide gel electrophoresis, proteins were shifted onto 0.22 μm PVDF membranes (Millipore). Following 1 h of blocking in 1× TBST buffer containing 5% nonfat dry milk, an overnight incubation of the membranes was performed at 4°C using primary antibodies to NF-κB p65 (#8242, 1:1000, CST, USA), IκBα (#4814, 1:1000, CST, USA), p-IκBα (#2859 1:1000, CST, USA), IKKβ (#8943 1:1000, CST, USA), p-IKKα/β (#2697 1:1000, CST, USA), NF-κB p50 (CY5040, 1:2000, Abways, China), RAB10 (ab237703, 1:1000, Abcam, USA), E2F2 (ab138515, 1:1000, Abcam, USA), Lamin B1 (AB0054, 1:1000, Abways, China) and β-actin (AB0035, 1:1000, Abways, China). After a triple ten-minute rinse using 1× TBST buffer, the membranes were proceeded 1 hour incubation at 37°C protected from light utilizing the corresponding DyLight 800-labeled goat anti-mouse or anti-rabbit antibodies (1:7000, abbkine, China). Finally, the blot image was recorded with the Odyssey Infrared Laser Scanner (LICOR Biosciences). Three replicates were required for each experiment. β-Actin levels were employed to normalize protein levels of the whole cell lysis and Lamin B1 for nuclear extract.
Statistical Analysis
The statistics were analyzed utilizing GraphPad Prism v8.0 software (GraphPad, San Diego, CA, USA) and R Studio (version 3.3.4). Intergroup comparison was conducted using one-way analysis of variance (ANOVA) with Tukey’s test or Student’s t-test. Each experiment comprised three independent replicates with the results displayed as the mean ± standard deviation (SD). Statistical significance was indicated when a P-value of <0.05.
Results
Differentially Expressed lncRNAs in HCC
There were 1178 lncRNAs significantly differentially expressed among CON, LC and HCC tissues (p < 0.05). The candidate DELs were distributed on 46 human chromosomes, with chromosomes 1, 5 and 6 containing more lncRNAs than the others (Figure 1A). Temporal expression analysis of the candidate DELs was performed to investigate their dynamic expression patterns during hepatocellular tumorigenesis using the R package Mfuzz 2.42.026 (Figure 1B). Notably, cluster 4 showed a sequential upregulation pattern and was chosen for further analysis. The clustering heatmap of DELs showed a good distinction between CON, LC, and HCC samples (Figure 1C). Meanwhile, a total of 2018 DELs (409 down-regulated and 1609 up-regulated) were distinguished with an adjusted P value < 0.05 and |log fold change (FC)| > 1 as cutoff criteria from matched normal and adjacent liver cancer tissues of TCGA-HCC samples via the edgeR pipeline in the TCGAbiolinks package,27 as shown in Figure 1D. To boost the credibility of the up-regulated lncRNAs, the intersection of cluster 4 and the up-regulated DELs from TCGA-HCC was taken (Figure 1E). Finally, only three genes (LINC00886, LINC00896, LINC00535) were obtained.
 |
Figure 1 Differentially expressed lncRNAs in HCC. (A) Chromosomal distribution of the DELs among CON, LC and HCC tissues. (B) Mfuzz clustering of DELs demonstrated the dynamic changes in the expression patterns of DELs during hepatocellular carcinogenesis. (C) Clustering Heatmap of DELs among CON, LC and HCC tissues. The columns represented the clinical liver samples, and the rows indicated as DELs. The samples were correspondingly gathered into three clusters according to the three comparison groups. (D) Volcano plots for DELs between paired normal and HCC samples in TCGA-HCC. The red points indicated up-regulated lncRNAs, while the blue points represented down-regulated lncRNAs in tumor samples of TCGA-HCC. The grey points represented non-significant differently expressed lncRNAs. (E) Venn diagram of up-regulated DELs between cluster 4 and the TCGA-HCC dataset. Relative LINC00886 expression levels were detected utilizing qRT-PCR in hepatic tissues ((F), n=5 per group), HCC cells (G) and PBMC samples ((H), n=20 per group). ****P < 0.0001. Abbreviations: HCC, hepatocellular carcinoma; LC, liver cirrhosis; PBMC, peripheral blood mononuclear cells; DELs, differentially expressed lncRNAs; qRT-PCR, quantitative reverse-transcriptase polymerase chain reaction. |
LINC00886 was Overexpressed in HCC Tissues, Cells and PBMCs
Of the three selected lncRNAs, previous research has indicated that LINC00886 is involved in the pathogenesis of digestive system tumors.28 Nevertheless, the carcinogenic potential of LINC00886 in HCC is not yet clarified. To address this, the expression levels of LINC00886 were first evaluated by qRT-PCR in HCC tissues and cells. LINC00886 expression was statistically and gradually increased between the three groups (n=5 liver samples per group, P<0.0001) (Figure 1F). Also, LINC00886 expression in Hep3B and Huh7 cells was distinctly above that of normal hepatic stellate cell line LX2 (P<0.0001) (Figure 1G). Furthermore, the tendency of LINC00886 expression in PBMCs (n=20 per group) was similar to that observed in liver tissues (P<0.0001) (Figure 1H). Collectively, these results implied that LINC00886 expression was positively related to liver tumorigenesis.
Knockdown of LINC00886 Impeded HCC Development
To probe the biological role of LINC00886 during the progression of HCC, the cell models of LINC00886 overexpression were successfully constructed by transfecting Hep3B and Huh7 cells with pcDNA3.1-LINC00886 (Figure S1A). Meanwhile, three siRNAs were designed against LINC00886. We found that LINC00886 expression was remarkably reduced utilizing qRT-PCR in Hep3B and Huh7 cells transfected with Si-LINC00886 (Figure S1B), and Si-LINC00886-3 was targeted for subsequent experimental procedures on account of its superior interference efficacy. EdU and CCK8 assays (Figure 2A-D) indicated that the proliferation potential of Hep3B and Huh7 cells was suppressed dramatically following LINC00886 knockdown. In contrast, cells’ proliferation ability was dramatically enhanced after LINC00886 overexpression. Transwell (Figure 2E) and wound healing assays (Figure 2F) demonstrated that LINC00886 overexpression facilitated migratory and invasive activities of HCC cells, while LINC00886 silencing revealed the contrary effect. In addition, TUNEL staining (Figure 3A and B) indicated that transfection with Si-LINC00886 prominently elevated the apoptosis rate of HCC cells, whereas LINC00886 overexpression hindered cell apoptosis. As a well-known inflammation-induced tumor, a strong relation between HCC occurrence and NF-κB signaling activation has been reported.29 However, whether NF-κB signaling is related to the hepatocarcinogenesis of LINC00886 required further investigation. Hence, Western blotting was applied to evaluate the protein levels of NF-κB signaling. Our results unveiled that introduction with Si-LINC00886 was followed by a notable decrease in the ratio of p-IκBα/IκBα and p-IKKα/β/IKKβ, as well as an apparent decline in the nuclear and whole cell lysis of NF-κB p65 and p50 expression in HCC cells. In contrast, the opposite effect was obtained after transfection with pcDNA3.1-LINC00886 (Figure 3C and D). These data implied that depletion of LINC00886 hindered proliferative, migratory, invasive, and anti-apoptotic capacities of HCC cells through inactivating the NF-κB pathway.
 |
Figure 2 LINC00886 silencing impeded HCC progression. (A-D) Cell proliferation rate was measured via Edu assay (Scale bar, 100 µm) and CCK-8 assay after transfection of Si-NC, Si-LINC00886, pcDNA3.1 or pcDNA3.1-LINC00886 into Hep3B and Huh7 cells. (E) Evaluation of migrating and invading cells using Transwell assay (Scale bar, 50 µm). (F) Cell migration was estimated via Scratch assay at 0 h and 48 h after transfection (Scale bar, 200 µm). *P<0.05, **P<0.01, ***P<0.001, ****P<0.0001, respectively. ##P<0.01, ###P<0.001, ####P<0.0001, respectively. Abbreviations: HCC, hepatocellular carcinoma; CCK8, Cell Counting Kit-8. |
 |
Figure 3 LINC00886 upregulation hindered apoptosis through NF-κB pathway in HCC cells. TUNEL assay (A and B) was performed to assess apoptotic cells (Scale bar, 100 µm) after transfection of Si-NC, Si-LINC00886, pcDNA3.1 or pcDNA3.1-LINC00886 in Hep3B and Huh7 cells. Western blotting (C and D) was utilized to analysis the expression of NF-κB pathway-associated proteins (IκBα, p-IκBα, IKKβ, p-IKKα/β, total p65, total p50, nuclear p65 and p50). *P<0.05, **P<0.01, ***P<0.001, ****P<0.0001, respectively. Abbreviation: HCC, hepatocellular carcinoma. |
miR-409-3p or miR-214-5p is a Target of LINC00886
LINC00886 was predominantly enriched in the cytoplasm of Hep3B (Figure 4A) and Huh7 cells (Figure 4B) using subcellular fraction analysis, which was confirmed by FISH experiments (Figure 4C and D), suggesting that LINC00886 may act as a sponge for miRNAs. The online software starbase demonstrated 20 estimated miRNAs for LINC00886 targets, and two of these miRNAs (miR-409-3p and miR-214-5p) were thought to be strongly associated with multiple tumors. Moreover, miR-409-3p and miR-214-5p expression in the Si-LINC00886 group showed significant elevation compared to the Si-NC group in HCC cells. Additionally, the expression of these two miRNAs was visibly reduced in the pcDNA3.1-LINC00886 group versus the control group in Hep3B and Huh7 cells (Figure 4E and F). The predicted binding locus of LINC00886 are illustrated in Figure 4G for miR-409-3p or miR-214-5p. Finally, the interaction relationship was verified utilizing dual-luciferase reporter assays. The result indicated that the luciferase activities were remarkably restrained in the LINC00886-WT group upon transfection of miR-409-3p mimic (Figure 4H) or miR-214-5p mimic (Figure 4I) versus miR-NC transfection (P < 0.0001). In parallel, the LINC00886-MUT group did not detect significant differences. Therefore, these findings evidenced that LINC00886 binds to miR-409-3p or miR-214-5p in a direct manner.
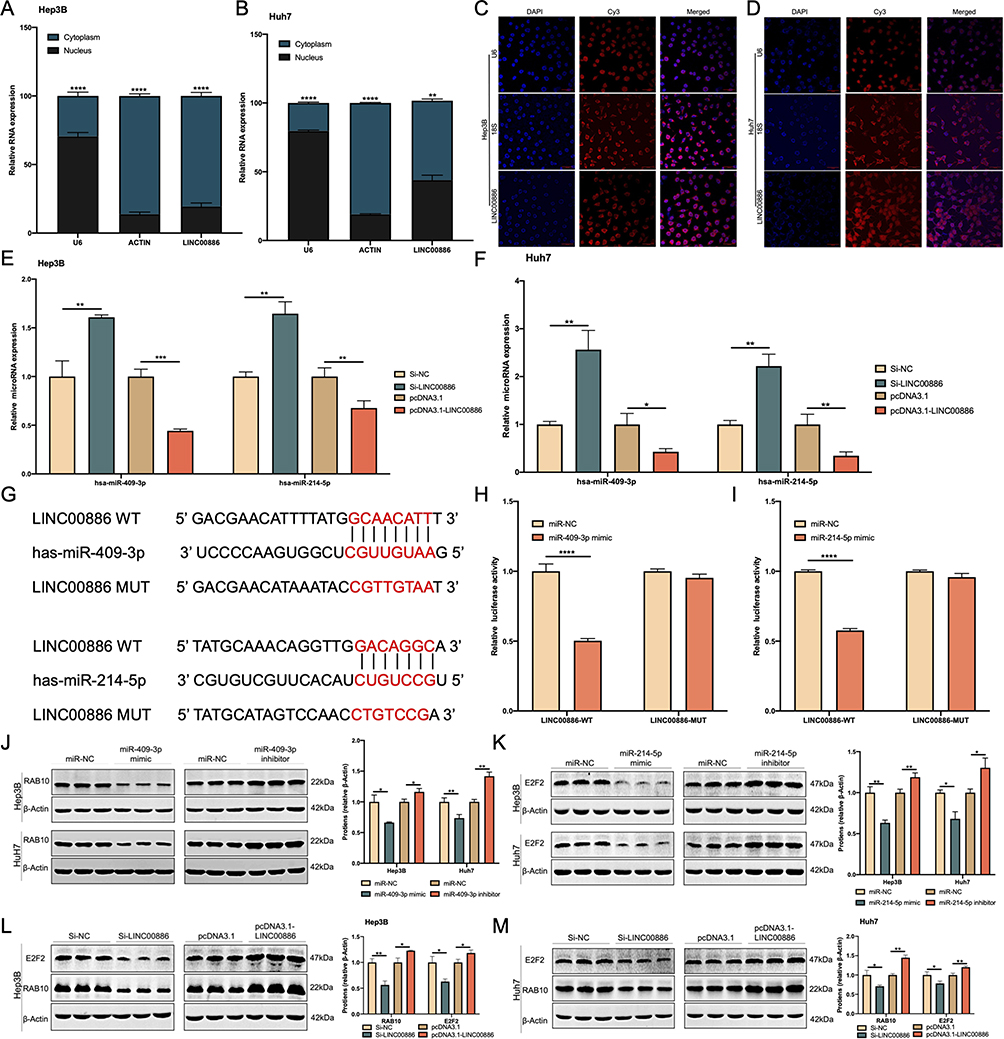 |
Figure 4 miR-409-3p or miR-214-5p is a target of LINC00886. The subcellular LINC00886 expression of Hep3B (A) and Huh7 cells (B) was examined. (C and D) FISH assay was performed in Hep3B and Huh7 cells to identify subcellular location of LINC00886 (Scale bar, 50 μm). (E and F) qRT-PCR was administrated to estimate the expression of miR-409-3p and miR-214-5p following HCC cell transfection of Si-NC, Si-LINC00886, pcDNA3.1 or pcDNA3.1-LINC00886. (G) Binding sites of LINC00886 on miR-409-3p or miR-214-5p predicted using starbase were demonstrated. (H and I) Direct binding of LINC00886 on miR-409-3p or miR-214-5p was validated vis dual-luciferase reporter assays. Western blotting was utilized to access the protein levels of RAB10 (J) and E2F2 (K) after transfection of HCC cells with miR-NCs, miR-409-3p /miR-214-5p mimics, and miR-409-3p/miR-214-5p inhibitors, respectively. (L and M) Western blotting was administrated to access the protein levels of RAB10 and E2F2 following HCC cell transfection of Si-NC, Si-LINC00886, pcDNA3.1 or pcDNA3.1-LINC00886, respectively. *P<0.05, **P<0.01, ***P<0.001, ****P<0.0001, respectively. Abbreviations: qRT-PCR, quantitative reverse-transcriptase polymerase chain reaction; FISH; Fluorescent in situ hybridization. |
LINC00886-miR-409-3p/miR-214-5p Axis Regulates RAB10 and E2F2 Expression in HCC
Previous studies have shown that RAB10 is the combine target of miR-409-3p,30 and E2F2 is the binding target of miR-214-5p.31 We further investigated whether LINC00886 could regulate RAB10 and E2F2 via miR-409-3p or miR-214-5p in HCC. When HCC cells were transfected with miR-409-3p mimics, the protein and mRNA levels of RAB10 were considerably decreased relative to the control group. Conversely, there was a noteworthy rise in the protein and mRNA levels of RAB10 in comparison to the control group following the transfection of HCC cells with miR-409-3p inhibitors. (Figures 4J and S2A). Similarly, the transfection of HCC cells with miR-214-5p mimics led to a significant reduction in the protein and mRNA levels of E2F2 compared to the control group. In contrast, the transfection of miR-214-5p inhibitors into HCC cells caused a significant increase in the protein and mRNA levels of E2F2 in comparison to the control group (Figures 4K and S2B). Besides, RAB10 and E2F2 expression exhibited an upward trajectory in PBMCs of CON, LC and HCC groups (Figure S2C). The protein and mRNA expression levels of RAB10 and E2F2 also exhibited a significant upregulation in both HCC tissues (Figure S2D and S2E) and HCC cells (Figure S2F and S2G).
Furthermore, upon transfection of HCC cells with Si-LINC00886, there was a statistically significant reduction observed in the protein and mRNA expression levels of RAB10 and E2F2, as compared to the control group. In contrast, transfection of HCC cells with pcDNA3.1-LINC00886 resulted in a statistically significant upregulation of both protein and mRNA expression levels of RAB10 and E2F2, compared to the plasmid-free transfected group (Figure 4L, M, S2H and S2I). Collectively, these findings indicated that LINC00886-miR-409-3p/miR-214-5p axis could regulate RAB10 and E2F2 expression during hepatocarcinogenesis.
miR-409-3p Inhibition Counteracts the Curbing Effect of LINC00886 Silencing on HCC Progression
qRT-PCR was then applied to analyze miR-409-3p expression in HCC tissues, cells and PBMCs. miR-409-3p expression tended to progressively decline in the three groups of liver samples (n=5 per group, P < 0.0001, Figure S3A) and the same tendency was also observed in PBMCs (n=20 per group, P < 0.0001, Figure S3B). Besides, miR-409-3p expression was substantially poorer in Hep3B and Huh7 cells in contrast to LX2 cells (P < 0.0001, Figure S3C), implying that miR-409-3p is adversely correlated with liver carcinogenesis. To further explore whether LINC00886 could interact with miR-409-3p during HCC pathogenesis, rescue experiments were conducted by transfection of Si-LINC00886+miR-NC, pcDNA3.1-LINC00886+miR-NC, Si-LINC00886+miR-409-3p inhibitor or pcDNA3.1-LINC00886+miR-409-3p mimic into Hep3B and Huh7 cells. The suppressive effects of Si-LINC00886 on cell proliferation, migration, and invasion, as well as the pro-apoptotic effects were offset by miR-409-3p silencing in Hep3B and Huh7 cells. Meanwhile, the promotion of cell proliferation (Figure 5A-D), migration and invasion (Figure 5E and F), as well as the apoptotic suppression (Figure 6A and B) induced by pcDNA3.1-LINC00886, were also counteracted after transfecting miR-409-3p mimic into HCC cells. Furthermore, silencing of LINC00886 suppressed the mRNA and protein levels of RAB10 and inhibited NF-κB signaling by decreasing the ratio of p-IκBα/IκBα and p-IKKα/β/IKKβ, as well as depleting the nuclear and whole cell lysis of NF-κB p65 and p50 levels, which was inverted upon transfection of miR-409-3p inhibitor. In contrast, miR-409-3p upregulation reversed the contribution of pcDNA3.1-LINC00886 to RAB10 overexpression and NF-κB pathway activation (Figures S3D, 6C and D). Thus, these findings concluded that LINC00886/miR-409-3p axis regulates HCC progression by uplifting RAB10 expression via activating the NF-κB signaling.
 |
Figure 5 miR-409-3p suppression counteracts the inhibitory impact of LINC00886 silencing on HCC progression. Edu assay (Scale bar, 100 µm) and CCK-8 (A-D) were applied to analyze proliferative cells after introduction of Si-LINC00886+miR-NC, pcDNA3.1-LINC00886+miR-NC, Si-LINC00886+miR-409-3p inhibitor or pcDNA3.1-LINC00886+miR-409-3p mimic into Hep3B and Huh7 cells. (E and F) Migratory and invasive cells were evaluated utilizing Transwell (Scale bar, 50 µm) and Scratch assays (Scale bar, 200 µm). *P<0.05, **P<0.01, ***P<0.001, ****P<0.0001, respectively. #P<0.05, ##P<0.01, ####P<0.0001, respectively. Abbreviations: HCC, hepatocellular carcinoma; CCK8, Cell Counting Kit-8. |
 |
Figure 6 Suppression of miR-409-3p offsets the pro-apoptotic role of LINC00886 silencing in HCC via NF-κB pathway. (A and B) Apoptotic cells were monitored via TUNEL assay (Scale bar, 100 µm) after introduction of Si-LINC00886+miR-NC, pcDNA3.1-LINC00886+miR-NC, Si-LINC00886+miR-409-3p inhibitor or pcDNA3.1-LINC00886+miR-409-3p mimic into Hep3B and Huh7 cells. (C and D) Western blotting was employed to evaluate RAB10 expression and NF-κB pathway-related markers. *P<0.05, **P<0.01, ***P<0.001, ****P<0.0001, respectively. Abbreviation: HCC, hepatocellular carcinoma. |
miR-214-5p Upregulation Attenuates the Effect of LINC00886 Overexpression on HCC Progression
Subsequently, the biological involvement of miR-214-5p in the role of LINC00886 on HCC progression was explored. The decreasing expressed tendency of miR-214-5p was detected in the three groups (n=5 liver samples per group, P < 0.0001, Figure S3E), and a similar pattern was noted in PBMCs (n=20 per group, P < 0.0001, Figure S3F). Additionally, miR-214-5p expression was visibly declined in Hep3B and Huh7 cells in comparison to LX2 cells (P < 0.0001, Figure S3G), indicating an unfavorable impact of miR-214-5p on hepatocarcinogenesis. Subsequently, we transfected Si-LINC00886+miR-NC, pcDNA3.1-LINC00886+miR-NC, Si-LINC00886+miR-214-5p inhibitor or pcDNA3.1-LINC00886+miR-214-5p mimic into Hep3B and Huh7 cells to perform rescue experiments. Upregulation of miR-214-5p levels was capable of counteracting the cell proliferation, migration, and invasion-promoting and apoptosis-suppressing effects of pcDNA3.1-LINC00886 in Hep3B and Huh7 cells. Similarly, miR-214-5p suppression attenuated the HCC cell proliferative (Figure 7A-D), migratory and invasive ability (Figure 7E and F) of Si-LINC00886 as well as the pro-apoptotic potential (Figure 8A and B).
 |
Figure 7 miR-214-5p upregulation attenuates the impact of LINC00886 overexpression on HCC progression. (A-D) Edu (Scale bar, 100 µm) and CCK-8 assays were applied to access proliferative potential of HCC cells after transfection of Si-LINC00886+miR-NC, pcDNA3.1-LINC00886+miR-NC, Si-LINC00886+miR-214-5p inhibitor or pcDNA3.1-LINC00886+miR-214-5p mimic into Hep3B and Huh7 cells. (E and F) Migrated and invaded cells was evaluated via Transwell (Scale bar, 50 µm) and Scratch assays (Scale bar, 200 µm). **P<0.01, ***P<0.001, ****P<0.0001, respectively. ###P<0.001, ####P<0.0001, respectively. Abbreviations: HCC, hepatocellular carcinoma; CCK8, Cell Counting Kit-8. |
 |
Figure 8 miR-214-5p Overexpression abrogates the apoptotic suppression function of LINC00886 upregulation in HCC by means of NF-κB pathway. (A and B) Apoptotic cells were monitored utilizing TUNEL assay (Scale bar, 100 µm) after transfection of Si-LINC00886+miR-NC, pcDNA3.1-LINC00886+miR-NC, Si-LINC00886+miR-214-5p inhibitor or pcDNA3.1-LINC00886+miR-214-5p mimic into Hep3B and Huh7 cells. (C and D) Western blotting was utilized to quantify E2F2, IκBα, p-IκBα, IKKβ, p-IKKα/β, total p65, total p50, nuclear p65 and p50 protein levels. *P<0.05, **P<0.01, ***P<0.001, ****P<0.0001, respectively. Abbreviation: HCC, hepatocellular carcinoma. |
Moreover, overexpressed mRNA and protein levels of E2F2 and activation of NF-κB signaling elicited by pcDNA3.1-LINC00886, with elevated expression of the nuclear and whole cell lysis of NF-κB p65 and p50, as well as increased ratio of p-IκBα/IκBα and p-IKKα/β/IKKβ, was compromised following miR-214-5p upregulation, whereas silencing of miR-214-5p released E2F2 expression and the NF-κB pathway from the Si-LINC00886 suppressive effect (Figure S3H, 8C and D). Collectively, our findings demonstrated that LINC00886/miR-214-5p axis contributes to tumorigenesis in HCC.
Discussion
Accumulating evidence reveals that aberrantly expressed lncRNAs can exert a role via functioning as oncogenes or tumor suppressors during hepatocarcinogenesis.32 As for a tumor that occurs in a multi-step state, an in-depth understanding of the biological mechanisms of lncRNAs can offer innovative perspectives for HCC diagnosis and treatment. Hence, our study presented a comprehensive analysis of lncRNAs profiling from CON to LC and HCC, and LINC00886 with an abnormal increasing pattern in liver tissues was identified combined with the analysis of TCGA-HCC. Previous research has also indicated that abnormal expression of LINC00886 is closely correlated with oncogenesis in several tumors. For instance, Dong et al demonstrated that LINC00886 silencing contributes to the vicious progression of esophageal squamous cell carcinoma.28 Lan et al unveiled that LINC00886 upregulation suppressed neoplastic growth of laryngeal carcinoma in vitro and in vivo.33 Thus, to our knowledge, the impact of LINC00886 on hepatocarcinogenesis was first investigated in our study.
Our data exhibited the incremental expressed pattern of LINC00886 in HCC tissues and cells. Furthermore, LINC00886 silencing dramatically restrained the proliferative, migratory, and invasive potential of HCC cells and raised the apoptotic cell ratio, while the contrary effect was noted for LINC00886 overexpression. Therefore, these experimental data demonstrated that LINC00886 facilitated the oncogenesis and progression of HCC. PBMCs, composed of immune cells, are characterized as a reflection of the body’s reaction to various diseases34 and have been used as liquid biopsy to identify diagnostic or prognostic biomarkers for diverse malignancies, such as breast cancer,35 pancreatic cancer,36 and renal cell carcinoma.37 Previous study has demonstrated that aberrantly expressed lncRNAs in PBMCs can distinguish HCC from non-HCC patients.38 Thus, our study also detected LINC00886 secretion in PBMCs of CON, LC, and HCC subjects. The results revealed significantly exceptionally elevated expression of LINC00886 in PBMCs from CON to LC and HCC patients, suggesting LINC00886 may serve as a novel non-invasion biomarker for HCC progression with clinical use. Further studies with larger cohorts are warranted for confirmation of our findings.
As is known, the subcellular localization of lncRNA contributes to its biological functions. The lncRNAs located at the nuclear compartment mediate genome organization via chromatin remodeling and structural scaffolding.39 On the other hand, cytoplastic lncRNAs serve to modulate signaling pathways, translation processes, and posttranscriptional gene regulation, with a key function of interacting with miRNAs.8,40 Thus, the subcellular analysis was applied to demonstrate that LINC00886 was primarily present at the cytoplasm of HCC cells, suggesting LINC00886 could serve as a sponge for miRNAs. miR-409-3p and miR-214-5p were estimated to be binding targets of LINC00886 and verified utilizing dual-luciferase reporter gene assays. Notably, miR-409-3p and miR-214-5p have been revealed to hinder oncogenesis in multiple tumor types, including HCC.41,42 In HCC tissues and cells, we observed a progressive reduction of miR-409-3p or miR-214-5p expression. Meanwhile, a downward tendency of miR-409-3p or miR-214-5p expression was detected in PBMCs, which was coinciding with the expression patterns of these two miRNAs in liver tissues, indicating the identification of LINC00886-miR-409-3p/miR-214-5p axis for monitoring hepatocarcinogenesis in PBMCs. In addition, miR-214-5p or miR-409-3p suppression dampened the anti-tumor effect of LINC00886 silencing on HCC, while miR-214-5p or miR-409-3p overexpression partially counteracted the pro-cancer role of LINC00886 overexpression in HCC. Thus, an essential feedback loop of the LINC00886-miR-409-3p/miR-214-5p axis was uncovered in HCC.
RAB10 is a member of Rab family. Wang et al demonstrated that RAB10 knockdown hindered HCC growth in vitro and in vivo.43 Besides, miR-409-3p suppressed proliferation and migration of ovarian cancer cells via binding to RAB10.30 As an important member of the E2F family, E2F2 upregulation has been evidenced to predict poor prognosis in HCC patients.44 In addition, lncRNA RCAT1 promoted renal cell carcinoma progression by modulating miR-214-5p/E2F2 axis.31 In this study, the increasing expression patterns of RAB10 and E2F2 were observed in HCC tissues, PBMCs and HCC cells. The present study also established the targeting relationships between miR-409-3p and RAB10, as well as between miR-214-5p and E2F2, in HCC. Furthermore, rescue experiments identified that LINC00886-miR-409-3p/miR-214-5p axis could modulate RAB10 and E2F2 expression during hepatocarcinogenesis.
The NF-κB signaling has been documented to exert a vital effect in the biological mechanism of inflammation-associated tumorigenesis.45,46 Recent studies evidenced that NF-κB pathway activation exerts an oncogenic contribution in the HCC progression.29,47 Wang et al demonstrated that RAB10 regulates LPS-initiated activation of NF-κB pathways.48 Besides, previous study has shown that E2F2 can activate NF-κB pathway and improve the translocation of p65 into the nucleus.49 Therefore, whether the LINC00886-miR-409-3p/miR-214-5p axis regulates HCC progression in an NF-κB signaling-dependent manner was studied. Our findings revealed that LINC00886 silencing restrained the expression of RAB10 and E2F2 and inhibited NF-κB signaling, and these were rescued by suppression of miR-409-3p/miR-214-5p. While LINC00886 overexpression-induced NF-κB pathway activation and elevated expression of RAB10 and E2F2 were partially compensated by miR-409-3p/miR-214-5p upregulation. Thus, this study demonstrated that LINC00886-miR-409-3p/miR-214-5p axis exerts a tumor-promoting role via regulating RAB10 and E2F2 through activation of NF-κB signaling in HCC.
Conclusion
In conclusion, LINC00886 was firstly revealed to modulate the malignant hallmarks of HCC by regulating miR-409-3p/RAB10 or miR-214-5p/E2F2 axis through activating NF-κB signaling in this study. Our study highlights a novel perspective on HCC-associated lncRNAs, with LINC00886 being a promising non-invasion target for tailored therapy to facilitate precision and personalized medicine and improve outcomes of HCC patients.
Acknowledgments
The authors thank AiMi Academic Services (www.aimieditor.com) for English language editing and review services.
Abbreviations
HCC, hepatocellular carcinoma; LC, liver cirrhosis; PBMC, peripheral blood mononuclear cell; DELs: differentially expressed lncRNAs; qRT-PCR, quantitative reverse-transcriptase polymerase chain reaction; CCK8: Cell Counting Kit-8; FISH: Fluorescent in situ hybridization.
Data Sharing Statement
Data used in this manuscript can be obtained from the corresponding author by contacting [email protected] upon reasonable request.
Ethics Approval and Informed Consent
Written informed consent was provided from enrolled individuals with the authorization of the local ethics committee of the Third Hospital of Hebei Medical University.
Funding
This project was supported by the Key Research and Development Program of Hebei Province in 2019 (No. 19277779D); the introduction of foreign intelligence program in Hebei Province in 2020.
Disclosure
The authors declare no conflicts of interest in this work.
References
1. Sung H, Ferlay J, Siegel RL, et al. Global Cancer Statistics 2020: GLOBOCAN Estimates of Incidence and Mortality Worldwide for 36 Cancers in 185 Countries. CA Cancer J Clin. 2021;71(3):209–249. doi:10.3322/caac.21660
2. Llovet JM, Kelley RK, Villanueva A, et al. Hepatocellular carcinoma. Nat Rev Dis Primer. 2021;7(1):6. doi:10.1038/s41572-020-00240-3
3. Shao M, Wang Y, Dong H, et al. From liver fibrosis to hepatocarcinogenesis: role of excessive liver H2O2 and targeting nanotherapeutics. Bioact Mater. 2023;23:187–205. doi:10.1016/j.bioactmat.2022.11.001
4. Fujiwara N, Friedman SL, Goossens N, Hoshida Y. Risk factors and prevention of hepatocellular carcinoma in the era of precision medicine. J Hepatol. 2018;68(3):526–549. doi:10.1016/j.jhep.2017.09.016
5. Nakagawa S, Wei L, Song WM, et al. Molecular Liver Cancer Prevention in Cirrhosis by Organ Transcriptome Analysis and Lysophosphatidic Acid Pathway Inhibition. Cancer Cell. 2016;30(6):879–890. doi:10.1016/j.ccell.2016.11.004
6. Forner A, Llovet JM, Bruix J. Hepatocellular carcinoma. The Lancet. 2012;379(9822):1245–1255. doi:10.1016/S0140-6736(11)61347-0
7. Derrien T, Johnson R, Bussotti G, et al. The GENCODE v7 catalog of human long noncoding RNAs: analysis of their gene structure, evolution, and expression. Genome Res. 2012;22(9):1775–1789. doi:10.1101/gr.132159.111
8. Yao RW, Wang Y, Chen LL. Cellular functions of long noncoding RNAs. Nat Cell Biol. 2019;21(5):542–551. doi:10.1038/s41556-019-0311-8
9. Jin S, Yang X, Li J, Yang W, Ma H, Zhang Z. p53-targeted lincRNA-p21 acts as a tumor suppressor by inhibiting JAK2/STAT3 signaling pathways in head and neck squamous cell carcinoma. Mol Cancer. 2019;18(1):38. doi:10.1186/s12943-019-0993-3
10. Xia R, Geng G, Yu X, et al. LINC01140 promotes the progression and tumor immune escape in lung cancer by sponging multiple microRNAs. J Immunother Cancer. 2021;9(8):e002746. doi:10.1136/jitc-2021-002746
11. Zhang Y, Miao Y, Shang M, et al. LincRNA-p21 leads to G1 arrest by p53 pathway in esophageal squamous cell carcinoma. Cancer Manag Res. 2019;11:6201–6214. doi:10.2147/CMAR.S197557
12. Li G-H, Ma Z-H, Wang X. Long non-coding RNA CCAT1 is a prognostic biomarker for the progression of oral squamous cell carcinoma via miR-181a-mediated Wnt/β-catenin signaling pathway. Cell Cycle. 2019;18(21):2902–2913. doi:10.1080/15384101.2019.1662257
13. Wu P, Mo Y, Peng M, et al. Emerging role of tumor-related functional peptides encoded by lncRNA and circRNA. Mol Cancer. 2020;19(1):22. doi:10.1186/s12943-020-1147-3
14. Xie C, Li SY, Fang JH, Zhu Y, Yang JE. Functional long non-coding RNAs in hepatocellular carcinoma. Cancer Lett. 2021;500:281–291. doi:10.1016/j.canlet.2020.10.042
15. Lim LJ, Wong SYS, Huang F, et al. Roles and Regulation of Long Noncoding RNAs in Hepatocellular Carcinoma. Cancer Res. 2019;79(20):5131–5139. doi:10.1158/0008-5472.CAN-19-0255
16. Huang Z, Zhou JK, Peng Y, He W, Huang C. The role of long noncoding RNAs in hepatocellular carcinoma. Mol Cancer. 2020;19(1):77. doi:10.1186/s12943-020-01188-4
17. Pan W, Li W, Zhao J, et al. lnc
18. Sheng JQ, Wang MR, Fang D, et al. LncRNA NBR2 inhibits tumorigenesis by regulating autophagy in hepatocellular carcinoma. Biomed Pharmacother. 2021;133:111023. doi:10.1016/j.biopha.2020.111023
19. Zhao D, Zhang X, Tang Y, et al. Identification and Validation of Novel Biomarkers for Hepatocellular Carcinoma, Liver Fibrosis/Cirrhosis and Chronic Hepatitis B via Transcriptome Sequencing Technology. J Hepatocell Carcinoma. 2022;9:389–403. doi:10.2147/JHC.S357380
20. Angeli P, Bernardi M, Villanueva C, et al. EASL Clinical Practice Guidelines for the management of patients with decompensated cirrhosis. J Hepatol. 2018;69(2):406–460. doi:10.1016/j.jhep.2018.03.024
21. Fukui H, Saito H, Ueno Y, et al. Evidence-based clinical practice guidelines for liver cirrhosis 2015. J Gastroenterol. 2016;51(7):629–650. doi:10.1007/s00535-016-1216-y
22. Vogel A, Cervantes A, Chau I, et al. Hepatocellular carcinoma: ESMO Clinical Practice Guidelines for diagnosis, treatment and follow-up. Ann Oncol. 2018;29:iv238–iv255. doi:10.1093/annonc/mdy308
23. Tomczak K, Czerwińska P, Wiznerowicz M. The Cancer Genome Atlas (TCGA): an immeasurable source of knowledge. Contemp Oncol Pozn. 2015;1A:68–77. doi:10.5114/wo.2014.47136
24. Li Y, Zhang Y, Zhang S, et al. circRNA circARNT2 Suppressed the Sensitivity of Hepatocellular Carcinoma Cells to Cisplatin by Targeting the miR-155-5p/PDK1 Axis. Mol Ther - Nucleic Acids. 2021;23:244–254. doi:10.1016/j.omtn.2020.08.037
25. Liu W, Yao Y, Shi L, Tang G, Wu L. A novel lncRNA LOLA1 may predict malignant progression and promote migration, invasion, and EMT of oral leukoplakia via the AKT/GSK‐3β pathway. J Cell Biochem. 2021;122(10):1302–1312. doi:10.1002/jcb.29951
26. Kumar L, Futschik ME. Mfuzz: a software package for soft clustering of microarray data. Bioinformation. 2007;2(1):5–7. doi:10.6026/97320630002005
27. McCarthy DJ, Chen Y, Smyth GK. Differential expression analysis of multifactor RNA-Seq experiments with respect to biological variation. Nucleic Acids Res. 2012;40(10):4288–4297. doi:10.1093/nar/gks042
28. Dong Z, Yang L, Lu J, et al. Downregulation of LINC00886 facilitates epithelial–mesenchymal transition through SIRT7/ELF3/miR-144 pathway in esophageal squamous cell carcinoma. Clin Exp Metastasis. 2022;39(4):661–677. doi:10.1007/s10585-022-10171-w
29. He G, Karin M. NF-κB and STAT3 – key players in liver inflammation and cancer. Cell Res. 2011;21(1):159–168. doi:10.1038/cr.2010.183
30. Li Y, Chen L, Zhang B, Ohno Y, Hu H. miR-409-3p inhibits the proliferation and migration of human ovarian cancer cells by targeting Rab10. Cell Mol Biol. 2020;66(7):197–201. doi:10.14715/cmb/2020.66.7.30
31. Guo R, Zou B, Liang Y, et al. LncRNA RCAT1 promotes tumor progression and metastasis via miR-214-5p/E2F2 axis in renal cell carcinoma. Cell Death Dis. 2021;12(7):689. doi:10.1038/s41419-021-03955-7
32. Li C, Yang J, Liu C, Wang X, Zhang L. Long non-coding RNAs in hepatocellular carcinoma: ordering of the complicated lncRNA regulatory network and novel strategies for HCC clinical diagnosis and treatment. Pharmacol Res. 2020;158:104848. doi:10.1016/j.phrs.2020.104848
33. Lan L, Cao H, Chi W, et al. Aberrant DNA hypermethylation-silenced LINC00886 gene accelerates malignant progression of laryngeal carcinoma. Pathol Res Pract. 2020;216(4):152877. doi:10.1016/j.prp.2020.152877
34. Mosallaei M, Ehtesham N, Rahimirad S, Saghi M, Vatandoost N, Khosravi S. PBMCs: a new source of diagnostic and prognostic biomarkers. Arch Physiol Biochem. 2022;128(4):1081–1087. doi:10.1080/13813455.2020.1752257
35. Čelešnik H, Potočnik U. Peripheral Blood Transcriptome in Breast Cancer Patients as a Source of Less Invasive Immune Biomarkers for Personalized Medicine, and Implications for Triple Negative Breast Cancer. Cancers. 2022;14(3):591. doi:10.3390/cancers14030591
36. Li H, Mao Y, Xiong Y, et al. A Comprehensive Proteome Analysis of Peripheral Blood Mononuclear Cells (PBMCs) to Identify Candidate Biomarkers of Pancreatic Cancer. Cancer Genomics - Proteomics. 2019;16(1):81–89. doi:10.21873/cgp.20114
37. Twine NC, Stover JA, Marshall B, et al. Disease-associated Expression Profiles in Peripheral Blood Mononuclear Cells from Patients with Advanced Renal Cell Carcinoma. Cancer Res. 2003;63(18):6069–6075.
38. Kunadirek P, Pinjaroen N, Nookaew I, Tangkijvanich P, Chuaypen N. Transcriptomic Analyses Reveal Long Non-Coding RNA in Peripheral Blood Mononuclear Cells as a Novel Biomarker for Diagnosis and Prognosis of Hepatocellular Carcinoma. Int J Mol Sci. 2022;23(14):7882. doi:10.3390/ijms23147882
39. Sun Q, Hao Q, Prasanth KV. Nuclear Long Noncoding RNAs: key Regulators of Gene Expression. Genomics Proteomics Bioinformatics. 2018;34(2):142–157. doi:10.1016/j.tig.2017.11.005
40. Dykes IM, Emanueli C. Transcriptional and Post-transcriptional Gene Regulation by Long Non-coding RNA. Genomics Proteomics Bioinformatics. 2017;15(3):177–186. doi:10.1016/j.gpb.2016.12.005
41. Pang J, Li Z, Wang G, Li N, Gao Y, Wang S. miR‐214‐5p targets KLF5 and suppresses proliferation of human hepatocellular carcinoma cells. J Cell Biochem. 2019;120(2):1850–1859. doi:10.1002/jcb.27498
42. Zhang CS, Lin Y, Sun FB, Gao J, Han B, Li SJ. miR-409 down-regulates Jak-Stat pathway to inhibit progression of liver cancer. Eur Rev Med Pharmacol Sci. 2019;23(1):146–154. doi:10.26355/eurrev_201901_16758
43. Wang W, Jia WD, Hu B, Pan YY. RAB10 overexpression promotes tumor growth and indicates poor prognosis of hepatocellular carcinoma. Oncotarget. 2017;8(16):26434–26447. doi:10.18632/oncotarget.15507
44. Zeng Z, Cao Z, Tang Y. Increased E2F2 predicts poor prognosis in patients with HCC based on TCGA data. BMC Cancer. 2020;20(1):1037. doi:10.1186/s12885-020-07529-2
45. Fan Y, Mao R, Yang J. NF-κB and STAT3 signaling pathways collaboratively link inflammation to cancer. Protein Cell. 2013;4(3):176–185. doi:10.1007/s13238-013-2084-3
46. Karin M. Nuclear factor-κB in cancer development and progression. Nature. 2006;441(7092):431–436. doi:10.1038/nature04870
47. Luedde T, Schwabe RF. NF-κB in the liver—linking injury, fibrosis and hepatocellular carcinoma. Nat Rev Gastroenterol Hepatol. 2011;8(2):108–118. doi:10.1038/nrgastro.2010.213
48. Wang D, Lou J, Ouyang C, et al. Ras-related protein Rab10 facilitates TLR4 signaling by promoting replenishment of TLR4 onto the plasma membrane. Proc Natl Acad Sci. 2010;107(31):13806–13811. doi:10.1073/pnas.1009428107
49. Wang S, Wang L, Wu C, Sun S. E2F2 directly regulates the STAT1 and PI3K/AKT/NF-κB pathways to exacerbate the inflammatory phenotype in rheumatoid arthritis synovial fibroblasts and mouse embryonic fibroblasts. Arthritis Res Ther. 2018;20(1):225. doi:10.1186/s13075-018-1713-x
 © 2023 The Author(s). This work is published and licensed by Dove Medical Press Limited. The
full terms of this license are available at https://www.dovepress.com/terms
and incorporate the Creative Commons Attribution
- Non Commercial (unported, 3.0) License.
By accessing the work you hereby accept the Terms. Non-commercial uses of the work are permitted
without any further permission from Dove Medical Press Limited, provided the work is properly
attributed. For permission for commercial use of this work, please see paragraphs 4.2 and 5 of our Terms.
© 2023 The Author(s). This work is published and licensed by Dove Medical Press Limited. The
full terms of this license are available at https://www.dovepress.com/terms
and incorporate the Creative Commons Attribution
- Non Commercial (unported, 3.0) License.
By accessing the work you hereby accept the Terms. Non-commercial uses of the work are permitted
without any further permission from Dove Medical Press Limited, provided the work is properly
attributed. For permission for commercial use of this work, please see paragraphs 4.2 and 5 of our Terms.