")
Back to Journals » Adolescent Health, Medicine and Therapeutics » Volume 12
Leptin is Associated with the Tri-Ponderal Mass Index in Children: A Cross-Sectional Study
Authors Empringham B, Jennings WJ, Rajan R , Fleming AJ , Portwine C, Johnston DL, Zelcer SM, Rassekh SR, Tran V, Burrow S, Thabane L, Samaan MC
Received 10 November 2020
Accepted for publication 5 February 2021
Published 9 March 2021 Volume 2021:12 Pages 9—15
DOI https://doi.org/10.2147/AHMT.S289973
Checked for plagiarism Yes
Review by Single anonymous peer review
Peer reviewer comments 2
Editor who approved publication: Professor Alastair Sutcliffe
Brianna Empringham,1,2 William J Jennings,1,2 Raeesha Rajan,1– 3 Adam J Fleming,1,4 Carol Portwine,1,4 Donna L Johnston,5 Shayna M Zelcer,6 Shahrad Rod Rassekh,7 Victoria Tran,1,2 Sarah Burrow,8 Lehana Thabane,3,9– 11 M Constantine Samaan1– 3
1Department of Pediatrics, McMaster University, Hamilton, Ontario, Canada; 2Division of Pediatric Endocrinology, McMaster Children’s Hospital, Hamilton, Ontario, Canada; 3Department of Health Research Methods, Evidence and Impact, McMaster University, Hamilton, Ontario, Canada; 4Division of Pediatric Hematology/Oncology, McMaster Children’s Hospital, Hamilton, Ontario, Canada; 5Division of Pediatric Hematology/Oncology, Children’s Hospital of Eastern Ontario, Ottawa, Ontario, Canada; 6Pediatric Hematology Oncology, Children’s Hospital, London Health Sciences Center, London, Ontario, Canada; 7Division of Pediatric Hematology/Oncology/BMT, Department of Pediatrics, British Columbia’s Children’s Hospital, Vancouver, BC, Canada; 8Division of Orthopedic Surgery, Department of Surgery, McMaster University Medical Centre, Hamilton, Ontario, Canada; 9Department of Anesthesia, McMaster University, Hamilton, Ontario, Canada; 10Centre for Evaluation of Medicines, St. Joseph’s Health Care, Hamilton, Ontario, Canada; 11Biostatistics Unit, St Joseph’s Healthcare-Hamilton, Hamilton, Ontario, Canada
Correspondence: M Constantine Samaan
Department of Pediatrics, McMaster University, Division of Pediatric Endocrinology, McMaster Children’s Hospital, 1280 Main Street West, 3A-57, Hamilton, Ontario, L8S 4K1 Tel +001-905-521-2100, ext. 75926
Fax +001-905-308-7548
Email [email protected]
Background: Obesity is characterized by the disproportionate expansion of the fat mass and is most commonly diagnosed using the Body Mass Index (BMI) z-score or percentile in children. However, these measures associate poorly with the fat mass. This is important, as adiposity is a more robust predictor of cardiometabolic risk than BMI-based measures, but there are limited clinical measures of adiposity in children. A new measure, the Tri-ponderal Mass Index (TMI, kg/m3) has recently demonstrated robust prediction of adiposity in children. The aim of this study is to explore the association of leptin, a validated biomarker of the fat mass, with TMI.
Methods: One hundred and eight children and adolescents were included in this cross-sectional study. Height and weight were used to calculate TMI. Plasma leptin was measured using ELISA. Multivariable regression analysis was applied to determine the predictors of TMI.
Results: The age range of participants included in this study was 8.00– 16.90 years (female n=48, 44%). Leptin correlated with BMI percentile (r=0.64, p-value < 0.0001) and TMI (r=0.71, p-value < 0.0001). The multivariable regression analysis revealed that BMI percentile (Estimated Beta-coefficient 0.002, 95% CI 0.002– 0.003, p-value < 0.0001) and Leptin (Estimated Beta-coefficient 0.05, 95% CI 0.02– 0.07, p-value 0.013) were associated with TMI.
Conclusion: Leptin is associated with TMI in healthy children. The TMI is a feasible clinical measure of adiposity that may be used to stratify children and adolescents for further assessments and interventions to manage and attempt to prevent cardiometabolic comorbidities.
Keywords: Tri-ponderal mass index, adiposity, leptin, children
Introduction
One of the consequences of the lifestyle changes embraced over the past few decades is the emergence of an obesity epidemic that is impacting a third of the world’s population.1–4 Children have been affected by the obesogenic environment, and childhood obesity rates have tripled over the past 30 years.4,5
While many obese adults were lean as children,6 obese children have a significant risk of obesity persisting into adulthood.7,8 Obesity or rapid weight gain during childhood are substantial risk factors for future type 2 diabetes, cardiovascular disease, hypertension, dyslipidemia, fatty liver disease, and sleep apnea.6,9–11
While obesity is characterized by the disproportionate expansion of the adipose tissue compared to the muscle and bone compartments,12 the current tools used to measure obesity in children, namely the Body Mass Index (BMI) z-score and percentiles, are limited in their reliability in measuring adiposity.13,14 Also, the use of devices including Dual Energy X-ray Absorptiometry (DXA) scans and bioelectrical impedance (BIA) scales is limited in the clinical setting and population-based studies due to their cost and relative unavailability.
As adiposity may be a predictor of future cardiometabolic risk in children,15–18 the definition of clinical and molecular measures of adiposity and its associated cardiometabolic outcomes are critical. It will help prioritize those children and adolescents in need of monitoring and interventions to improve their future cardiometabolic outcomes.
The Tri-ponderal Mass Index (TMI, kg/m3) has recently been proposed as a feasible and reliable clinical marker of the fat mass in 8–17 year old children.14,19–23 TMI is derived from the measurement of weight and height cubed (kg/m3), allowing for the age-driven change in pediatric growth trajectories.14 The variables used in TMI calculation are derived from routine clinical measures, height and weight, and TMI has critical advantages over BMI-based measures, being age- and puberty-independent.14
Leptin is an adipocyte-derived anorexigenic hormone that plays a critical role in metabolic regulation and is a biomarker of fat mass.24–27
Previous work did demonstrate that leptin is associated with BIA-measured adiposity and that BMI correlated with the TMI.2,3,19 In this exploratory study, we tested the hypothesis that in healthy children, leptin is associated with TMI.
Subjects and Methods
This study is a secondary cross-sectional analysis of a data subset from the Canadian Study of Determinants of Endometabolic Health in Children (CanDECIDE study), a prospective cohort study examining inflammation and endometabolic health outcomes in healthy children who are compared to a group of childhood brain tumor survivors.28,29
Study Participants
The participants included healthy children recruited from the Orthopedic clinics at McMaster Children’s Hospital, a tertiary pediatric academic center in Hamilton, Ontario, Canada. These children would have attended the clinic having sustained a fracture or injury. They were recruited to perform study procedures after the healing of their injury and the return to their normal lifestyle.
We included boys and girls, 8–17 years of age, who had not received immunosuppressants or steroids above the daily maintenance dose of 6–8 mg/m2/day or had an infection two weeks before enrolment. Participants were included regardless of their ethnicity and BMI z-scores. Exclusion criteria included smoking, pregnancy, and inability to consent to study procedures. None of the participants in this substudy were on maintenance steroid therapy.
Consents and Ethical Considerations
Potential participants were scheduled to attend a research clinic visit. The study was presented to participants and their guardians, and if there was an agreement to proceed with participation, written informed consent was obtained. Those participants who were 16 years and older provided their consents. For participants between 7 and 15 years of age, written informed consent was obtained from parents or guardians, and the participants signed an assent form.
This project complies with the Declaration of Helsinki regarding the ethical conduct of research involving human subjects. The Hamilton Integrated Research Ethics Board has approved the study.
Study Procedures
A detailed description of the CanDECIDE study procedures has already been reported.28,29 Participants were recruited between November 2012-December 2016. To avoid selection bias, we consecutively recruited participants from clinics. After signing the consent forms, participants had their height measured to the closest 0.1 cm using a stadiometer and weight measured using an electronic scale (Seca, USA). BMI was calculated from the measured height and weight and reported in kg/m2, while the TMI was calculated from the measured height and weight and reported in kg/m3. The BMI z-score was calculated based on the CDC charts, while the BMI percentile was calculated using the Children’s BMI Tool for Schools.
Adiposity was assessed using a BIA fat mass scale (Tanita Corporation, Illinois, USA) and reported as a percentage.
Waist and hip circumferences were measured to the closest 0.1 cm using a spring-loaded tape measure. Pulse rate and systolic and diastolic blood pressure (mmHg) was measured in duplicate while participants were seated using a digital device.
Participants and their parents or guardians then filled several questionnaires to enquire about their diet, physical activity, sleep, mental wellbeing, built environment, and puberty. We also collected data regarding medical history, family history, birth and feeding history, schooling, and sociodemographic variables.30–35
Biological Sampling
Certified personnel collected whole blood samples into EDTA tubes and isolated plasma for measurement of leptin.28,29 Sampling was done in the fasted state, and samples were centrifuged at 1500 g for 15 minutes at room temperature. All samples were aliquoted into cryovials, and stored at −80°C until further processing.
Enzyme-Linked Immunosorbent Assay (ELISA) Quantification of Leptin
The samples were thawed on ice and centrifuged once at 1500 g for 15 minutes at room temperature for processing. Leptin levels were assayed using the Human Leptin Quantikine ELISA Kit (R&D Systems, Minneapolis, USA) as per the manufacturer’s recommendations. Some of the participant and leptin data for the current research question have been reported in a prior manuscript that addressed a separate research question describing the association of leptin with BIA-measured adiposity.36
Statistical Analyses
SPSS Version 25.0 (IBM Corporation, Armonk, NY, USA) was used to conduct the statistical analyses. Sample size calculation was performed according to Norman and Steiner, assigning at least 10 participants per variable tested in the analyses.37 We assessed the data for the presence of outliers and normality of distribution using the Shapiro–Wilk test; log transformation was performed for non-normally distributed data. Multiple imputations were used to deal with missing data.38 Statistical analyses involved calculating the mean (SD) and proportions (%) from participants’ data unless otherwise reported. An independent sample t-test was used to define sex differences in leptin. Correlation analyses were performed using the Spearman correlation test. A multivariable regression analysis was conducted with TMI as the dependent variable and adjusted for age, sex, puberty, BMI z-score, and leptin levels as the predictor variables. Data are reported as unstandardized coefficients with 95% Confidence Intervals (95% CI), with alpha set at 0.05 to delineate statistical significance. The Receiver Operating Characteristic (ROC) curve and Area Under the Curve (AUC) analyses were used to determine the association between leptin level and TMI.
Results
The characteristics of study participants are reported in Table 1. The study included 108 children and youth (female n=48, 44%) with an age range between 8.00 and 16.90 years. The BMI z-score assessment revealed that 38.90% (n=42, female n=15 (31.30%)) of participants were overweight/obese with BMI z-score ≥85th percentile.
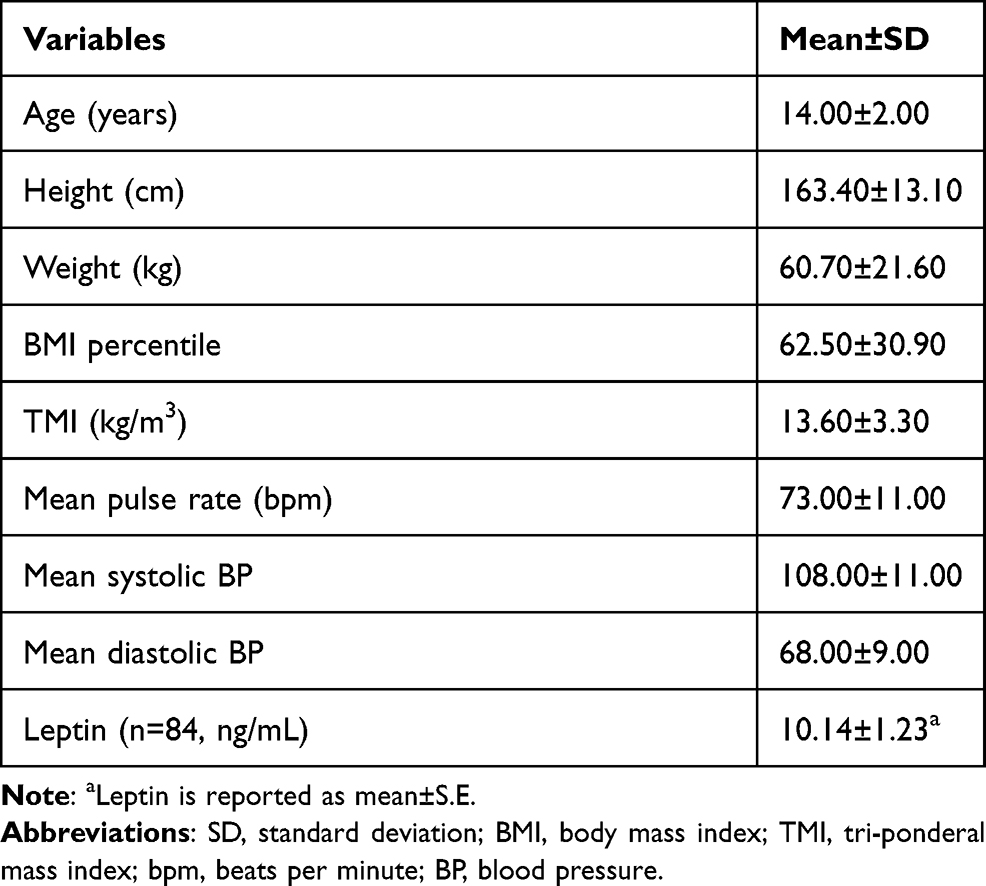 |
Table 1 Participants’ Characteristics (n=108) |
The TMI values were similar between female and male participants (Female: 13.50±2.50 kg/m3; Male: 13.80±3.80 kg/m3, p-value 0.910). Leptin levels trended higher in females compared to males (Female (n=40): 10.98±1.50 ng/mL; Male (n=44): 9.40±1.90 ng/mL, p-value 0.010).
The correlation tests are reported in Table 2 and Figure 1 A-E. Both BMI percentile and TMI did not correlate with age (Figure 1A and B). Leptin levels strongly correlated with BMI percentile (r=0.64, p-value <0.0001, Figure 1C) and TMI (r=0.71, p-value <0.0001, Figure 1D). The BMI percentile and TMI correlated strongly with each other (r=0.95, p-value <0.0001, Figure 1E).
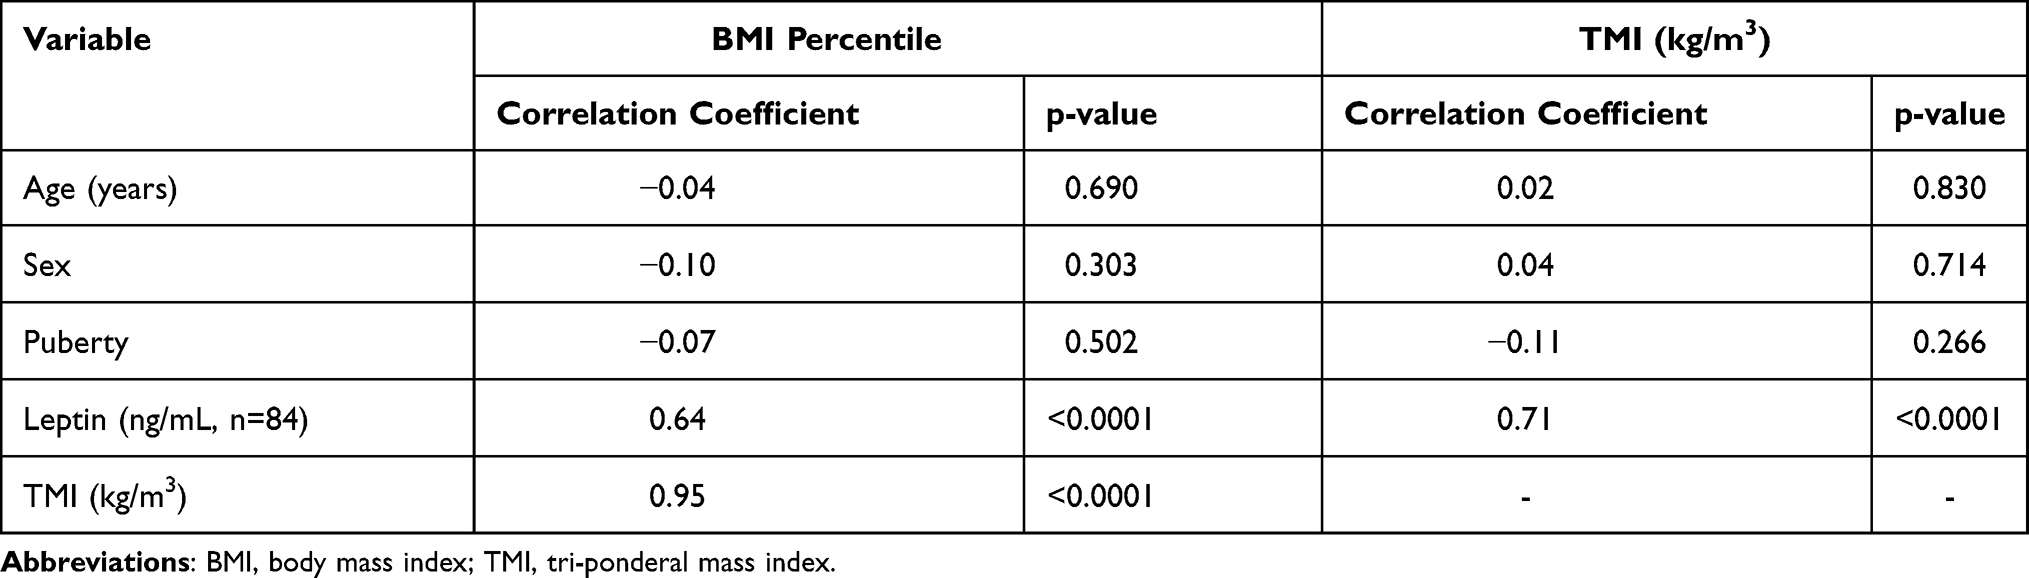 |
Table 2 Correlation Analyses for BMI Percentile and TMI with Age, Sex, Puberty and Leptin Levels (n=108) |
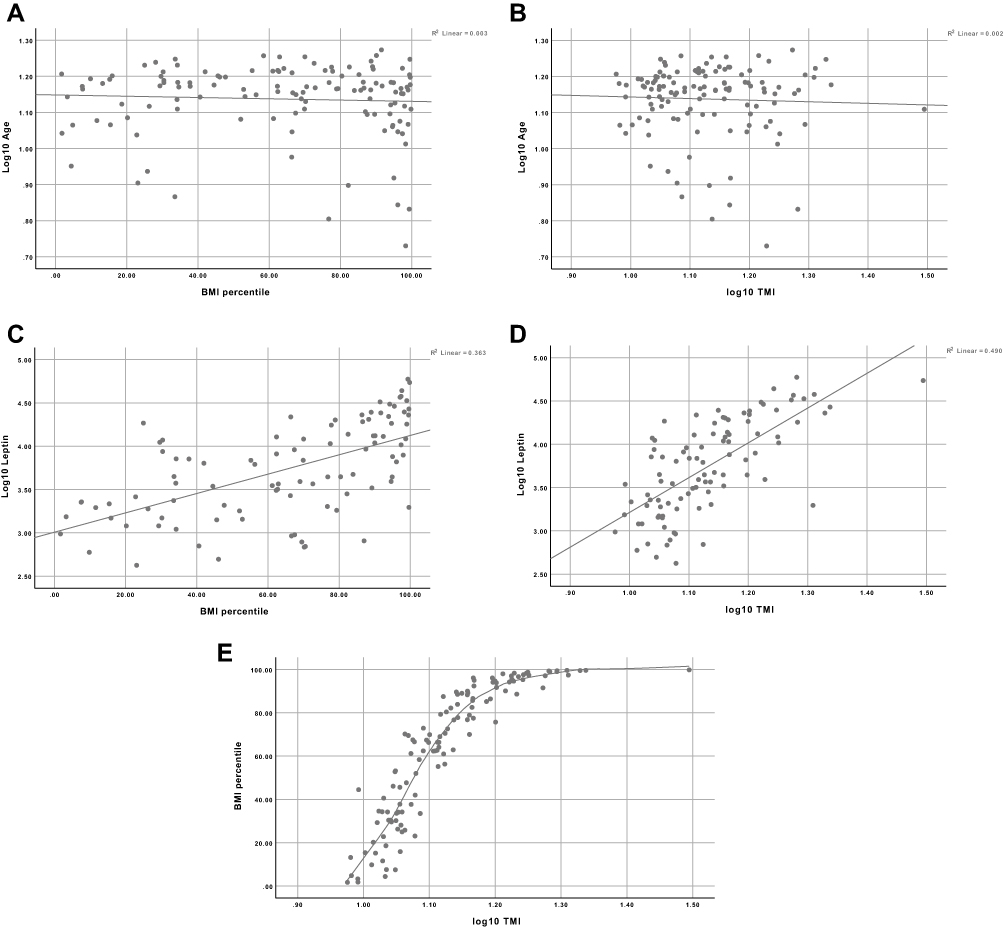 |
Figure 1 (A) Correlation of BMI Percentile with Age. (B) Correlation of TMI with age. (C) Correlation of BMI percentile with leptin. (D) Correlation of TMI with leptin. (E) Correlation of TMI with BMI percentile. |
To determine the association of leptin with TMI, we performed multivariable regression analysis (Table 3). The BMI percentile (Estimated Beta-coefficient 0.002, 95% CI 0.002–0.003, p-value <0.0001) and Leptin (Estimated Beta-coefficient 0.05, 95% CI 0.02–0.07, p-value 0.013) were associated with TMI. Furthermore, the ROC curve (Figure 2) and AUC demonstrated the association of leptin with TMI (0.87, 95% CI 0.82–0.91, p-value <0.0001).
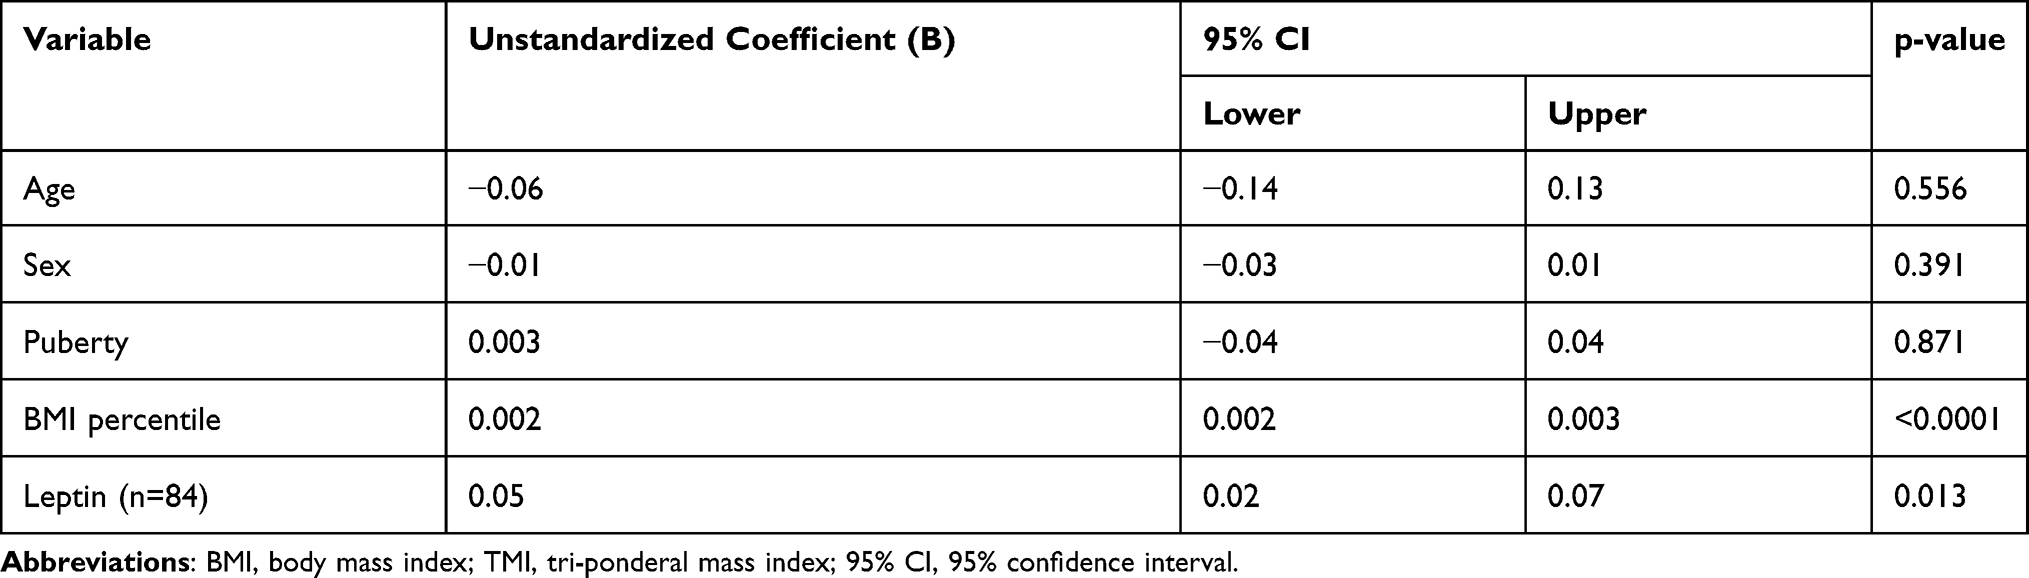 |
Table 3 Multivariable Regression Analyses of TMI Adjusted for Age, Sex, Puberty, BMI z-Score, and Leptin (n=108) |
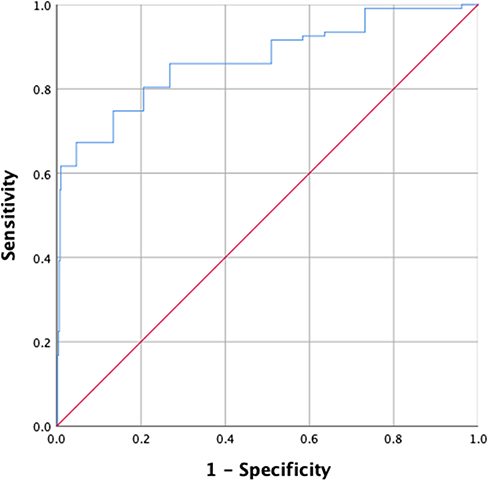 |
Figure 2 Receiver Operating Characteristic Curve for the Association of Leptin with TMI. |
Taken together, these data reveal that leptin is associated with TMI in healthy children.
Discussion
The prediction of obesity-driven morbidities may require clinical and molecular biomarkers to pinpoint individuals at risk of developing cardiovascular disease and type 2 diabetes.
However, measuring adiposity biomarkers is not a routine clinical test. Also, some of the devices used to estimate the adipose mass, including DXA and BIA, are rather costly, not routinely available in clinical settings, and necessitate trained personnel for equipment use and result interpretation.39,40 There is a critical need for sustainable measures of adiposity that may also potentially stratify cardiometabolic risk.
In this study, we identified the positive association of leptin with TMI. Our results are congruent with recent evidence that assessed the association of leptin and TMI and evidence that leptin is a biomarker of the fat mass.14,19,20,41 This adds to the value of TMI as a clinical index of adiposity, having been already validated against BMI-based measures.14,19
Age and puberty did not emerge as TMI predictors, which is consistent with the evidence that TMI is stable across different ages and puberty stages.14 The independence of TMI from age and puberty is a significant advantage to strengthen its use in children.
In a recent study using data from the National Health and Nutrition Examination Survey (NHANES), the proposed TMI cut-offs for being overweight was 16.00 kg/m3 for overweight, and 18.80 kg/m3 for obesity in boys, and 16.80 kg/m3 for overweight and 19.70 kg/m3 for obesity in girls. The cut-off levels will need further validation across different pediatric populations.14
There are several advantages of using TMI in measuring adiposity when compared to BMI-based measures. While BMI is used to measure adiposity in adults, it is an imperfect measurement tool of body fat in children, especially in boys, where it explains only 38% of the adiposity variance.14,15 While BMI predicted adiposity in girls more robustly than it did in boys, TMI was still a robust measure of adiposity in boys.14
The TMI considers that weight does not regress to height squared during adolescence, whereby the fat mass changes with age and height. On the other hand, the BMI considers the regression of weight to occur to a static height, which miscalculates body fat.
Therefore, the TMI is stable with age change in boys and girls. The TMI can also help estimate body fat mass across a range of adiposity levels and is more accurate with higher adiposity. It also has a relatively lower rate of adolescents' misclassification into normal weight or overweight groups by about 50% compared to BMI. The derivation of TMI from routine clinical measures makes it feasible and sustainable to perform.14
Elevated leptin levels have been noted in adult patients with metabolic syndrome42,43 and atherosclerosis in type 2 diabetes patients,44 although its reported association with cardiovascular disease has been questioned previously.43,45 While it is unclear if leptin is a mechanistic driver of adverse cardiovascular events in adults, it may represent a potential biomarker of future adiposity and cardiometabolic outcomes. This question requires further study.
This study's main strength is the validation of TMI as a clinical measure of adiposity by demonstrating its association with leptin as a biomarker of the fat mass. This association highlights the potential for TMI generalizability as a clinical marker of the fat mass for use in the general pediatric population.
The limitations of this study include the lack of DXA-based data to validate the TMI against a validated standard in adiposity measurement in children. Future studies need to focus on a longitudinal follow-up approach to determine if high TMI and leptin levels during childhood can predict adult adiposity and cardiometabolic outcomes in pediatric populations with chronic health conditions. Further research is needed to also focus on building risk prediction models to clarify which adiposity measure(s) early on in childhood are linked to future adverse health outcomes and may need to include leptin and TMI.
In conclusion, TMI is a valid measure of the fat mass that can be implemented in clinical settings and population-based studies to define those children who are at risk of excess adiposity.
Having a clinical tool that can predict adiposity is critical. Healthcare teams can counsel those patients and families about healthy lifestyles and prioritize further screening for comorbidities and interventions to manage excess adiposity, which may improve future health outcomes.
Abbreviations
TMI, tri-ponderal mass index; BMI, body mass index; SD, standard deviation; SE, standard error; BP, blood pressure; bpm, beats per minute.
Acknowledgments
We are grateful to all the study participants and their families for taking part in the study.
Author Contributions
All authors contributed to data analysis, drafting or revising the article, have agreed on the journal to which the article will be submitted, gave final approval of the version to be published, and agree to be accountable for all aspects of the work.
Disclosure
M.C.S. was funded by the Pediatric Oncology Group of Ontario Research Unit and Hamilton Health Sciences and Foundation. B.E. received funding from Regional Medical Associates (RMA) Hamilton. The funding agencies had no participation in the conception of the research question, study design, data collection and analysis or conclusions. The authors report no other conflicts of interest in this work.
References
1. Collaborators GO. Health effects of overweight and obesity in 195 countries over 25 years. N Eng J Med. 2017;377(1):13–27.
2. Yayan EH, Çelebioğlu A. Effect of an obesogenic environment and health behaviour-related social support on body mass index and body image of adolescents. Glob Health Promot. 2018;25(3):33–42.
3. Conroy SM, Shariff-Marco S, Yang J, et al. Characterizing the neighborhood obesogenic environment in the Multiethnic Cohort: a multi-level infrastructure for cancer health disparities research. Cancer Causes Control. 2018;29(1):167–183.
4. Barquera S, Hernández-Barrera L, Rothenberg SJ, Cifuentes E. The obesogenic environment around elementary schools: food and beverage marketing to children in two Mexican cities. BMC Public Health. 2018;18(1):461.
5. Lake A, Townshend T. Obesogenic environments: exploring the built and food environments. J R Soc Promot Health. 2006;126(6):262–267.
6. Llewellyn A, Simmonds M, Owen CG, Woolacott N. Childhood obesity as a predictor of morbidity in adulthood: a systematic review and meta‐analysis. Obesity Rev. 2016;17(1):56–67.
7. Whitaker RC, Wright JA, Pepe MS, Seidel KD, Dietz WH. Predicting obesity in young adulthood from childhood and parental obesity. N Eng j Med. 1997;337(13):869–873.
8. Simmonds M, Llewellyn A, Owen CG, Woolacott N. Predicting adult obesity from childhood obesity: a systematic review and meta‐analysis. Obesity Rev. 2016;17(2):95–107.
9. Baker JL, Olsen LW, Sørensen TI. Childhood body-mass index and the risk of coronary heart disease in adulthood. N Eng j Med. 2007;357(23):2329–2337.
10. Barker DJ, Osmond C, Forsén TJ, Kajantie E, Eriksson JG. Trajectories of growth among children who have coronary events as adults. N Eng J Med. 2005;353(17):1802–1809.
11. Bastien M, Poirier P, Lemieux I, Després J-P. Overview of epidemiology and contribution of obesity to cardiovascular disease. Prog Cardiovasc Dis. 2014;56(4):369–381.
12. Goossens GH. The metabolic phenotype in obesity: fat mass, body fat distribution, and adipose tissue function. Obes Facts. 2017;10(3):207–215.
13. Daniels SR, Khoury PR, Morrison JA. The utility of body mass index as a measure of body fatness in children and adolescents: differences by race and gender. Pediatrics. 1997;99(6):804–807.
14. Peterson CM, Su H, Thomas DM, et al. Tri-ponderal mass index vs body mass index in estimating body fat during adolescence. JAMA Pediatr. 2017;171(7):629–636.
15. Bibbins-Domingo K, Coxson P, Pletcher MJ, Lightwood J, Goldman L. Adolescent overweight and future adult coronary heart disease. N Eng J Med. 2007;357(23):2371–2379.
16. Li S, Chen W, Srinivasan SR, et al. Childhood cardiovascular risk factors and carotid vascular changes in adulthood: the Bogalusa Heart Study. JAMA. 2003;290(17):2271–2276.
17. Raitakari OT, Juonala M, Kähönen M, et al. Cardiovascular risk factors in childhood and carotid artery intima-media thickness in adulthood: the Cardiovascular Risk in Young Finns Study. JAMA. 2003;290(17):2277–2283.
18. Morrison JA, Friedman LA, Wang P, Glueck CJ. Metabolic syndrome in childhood predicts adult metabolic syndrome and type 2 diabetes mellitus 25 to 30 years later. J Pediatr. 2008;152(2):201–206.
19. Sims ED, Wang K-W, Fleming A, et al. Tri-ponderal mass index in survivors of childhood brain tumors: a cross-sectional study. Sci Rep. 2018;8(1):1–7.
20. Carrascosa A, Yeste D, Moreno-Galdó A, et al. Body mass index and tri-ponderal mass index of 1453 healthy non-obese, non-undernourished millennial children. The Barcelona longitudinal growth study. Anales De Pediatría. 2018;89(3):137–143.
21. Matsuo AR, Lopes WA, Locatelli JC, Simoes CF, de Oliveira GH, Nardo NJ. Tri-ponderal mass index as a tool for insulin resistance prediction in overweight adolescents: a cross-sectional study. Nutrition. 2020;74:110744. doi:10.1016/j.nut.2020.110744
22. De Lorenzo A, Romano L, Di Renzo L, et al. Triponderal mass index rather than body mass index: an indicator of high adiposity in Italian children and adolescents. Nutrition. 2019;60:41–47. doi:10.1016/j.nut.2018.09.007
23. Ramirez-Velez R, Correa-Bautista JE, Carrillo HA, et al. Tri-Ponderal Mass Index vs. Fat Mass/Height(3) as a Screening Tool for Metabolic Syndrome Prediction in Colombian Children and Young People. Nutrients. 2018;10(4):412. doi:10.3390/nu10040412
24. Antunes H, Santos C, Carvalho S. Serum leptin levels in overweight children and adolescents. Br j Nutrition. 2008;101(8):1262–1266.
25. Falorni A, Galmacci G, Bini V, et al. Fasting serum leptin levels in the analysis of body mass index cut-off values: are they useful for overweight screening in children and adolescents? A school population-based survey in three provinces of central Italy. Int J Obes. 1998;22(12):1197–1208.
26. Blum WF, Englaro P, Hanitsch S, et al. Plasma leptin levels in healthy children and adolescents: dependence on body mass index, body fat mass, gender, pubertal stage, and testosterone. J Clin Endocrinol Metab. 1997;82(9):2904–2910.
27. Frederich RC, Hamann A, Anderson S, Löllmann B, Lowell BB, Flier JS. Leptin levels reflect body lipid content in mice: evidence for diet-induced resistance to leptin action. Nat Med. 1995;1(12):1311–1314.
28. Samaan MC, Scheinemann K, Burrow S, et al. Recruitment feasibility to a cohort study of endocrine and metabolic health among survivors of childhood brain tumours: a report from the Canadian study of Determinants of Endometabolic Health in ChIlDrEn (CanDECIDE). BMJ Open. 2014;4(6):2014. doi:10.1136/bmjopen-2014-005295
29. Samaan MC, Thabane L, Burrow S, Dillenburg RF, Scheinemann K. Canadian Study of Determinants of Endometabolic Health in ChIlDrEn (CanDECIDE study): a cohort study protocol examining the mechanisms of obesity in survivors of childhood brain tumours. BMJ Open. 2013;3(6):2013. doi:10.1136/bmjopen-2013-002869
30. Rockett HR, Breitenbach M, Frazier AL, et al. Validation of a youth/adolescent food frequency questionnaire. Prev Med. 1997;26(6):808–816.
31. Hay JA, Cairney J. Development of the Habitual Activity Estimation Scale for clinical research: a systematic approach. Pediatr Exerc Sci. 2006;18(2):193–202.
32. Chervin RD, Hedger K, Dillon JE, Pituch KJ. Pediatric sleep questionnaire (PSQ): validity and reliability of scales for sleep-disordered breathing, snoring, sleepiness, and behavioral problems. Sleep Med. 2000;1(1):21–32.
33. Faulstich M. Depression–pediatric. Psychiatry. 1986;143:1024–1027.
34. Brownson RC, Chang JJ, Eyler AA, et al. Measuring the environment for friendliness toward physical activity: a comparison of the reliability of 3 questionnaires. Am J Public Health. 2004;94(3):473–483.
35. Coleman L, Coleman J. The measurement of puberty: a review. J Adolesc. 2002;25(5):535–550.
36. Sims ED, Jennings WJ, Empringham B, et al. Circulating leptin levels are associated with adiposity in survivors of childhood brain tumors. Sci Rep. 2020;10(1):4711. doi:10.1038/s41598-020-61520-2
37. Norman G, Streiner D. PDQ Statistics. 2003. Hamilton Ont. 2003;3.
38. Graham JW, Olchowski AE, Gilreath TD. How many imputations are really needed? Some practical clarifications of multiple imputation theory. Prevent Sci. 2007;8(3):206–213.
39. Freedman DS, Ogden CL, Berenson GS, Horlick M. Body mass index and body fatness in childhood. Curr Opin Clin Nutr Metab Care. 2005;8(6):618–623.
40. Goran MI. Measurement issues related to studies of childhood obesity: assessment of body composition, body fat distribution, physical activity, and food intake. Pediatrics. 1998;101(Supplement2):505–518.
41. Akcan N, Obaid M, Salem J, Bundak R. Evidence in obese children: contribution of tri-ponderal mass index or body mass index to dyslipidemia, obesity-inflammation, and insulin sensitivity. J Pediatr Endocrinol Metab. 2020;33(2):223–231. doi:10.1515/jpem-2019-0106
42. Li W-C, Hsiao K-Y, Chen I-C, Chang Y-C, Wang S-H, Wu K-H. Serum leptin is associated with cardiometabolic risk and predicts metabolic syndrome in Taiwanese adults. Cardiovasc Diabetol. 2011;10(1):36.
43. Franks PW, Brage S, Luan JA, et al. Leptin predicts a worsening of the features of the metabolic syndrome independently of obesity. Obes Res. 2005;13(8):1476–1484.
44. Reilly MP, Iqbal N, Schutta M, et al. Plasma leptin levels are associated with coronary atherosclerosis in type 2 diabetes. J Clin Endocrinol Metab. 2004;89(8):3872–3878.
45. Martin SS, Blaha MJ, Muse ED, et al. Leptin and incident cardiovascular disease: the Multi-ethnic Study of Atherosclerosis (MESA). Atherosclerosis. 2015;239(1):67–72.
 © 2021 The Author(s). This work is published and licensed by Dove Medical Press Limited. The
full terms of this license are available at https://www.dovepress.com/terms.php
and incorporate the Creative Commons Attribution
- Non Commercial (unported, v3.0) License.
By accessing the work you hereby accept the Terms. Non-commercial uses of the work are permitted
without any further permission from Dove Medical Press Limited, provided the work is properly
attributed. For permission for commercial use of this work, please see paragraphs 4.2 and 5 of our Terms.
© 2021 The Author(s). This work is published and licensed by Dove Medical Press Limited. The
full terms of this license are available at https://www.dovepress.com/terms.php
and incorporate the Creative Commons Attribution
- Non Commercial (unported, v3.0) License.
By accessing the work you hereby accept the Terms. Non-commercial uses of the work are permitted
without any further permission from Dove Medical Press Limited, provided the work is properly
attributed. For permission for commercial use of this work, please see paragraphs 4.2 and 5 of our Terms.