Back to Journals » Journal of Pain Research » Volume 15
Lean Mass is Associated with, but Does Not Mediate Sex Differences in Pressure Pain Sensitivity in Healthy Adults
Authors Peterson JA ![]() , Lohman C, Larson RD, Bemben MG
, Lohman C, Larson RD, Bemben MG ![]() , Black CD
, Black CD ![]()
Received 10 September 2022
Accepted for publication 12 November 2022
Published 16 December 2022 Volume 2022:15 Pages 3981—3994
DOI https://doi.org/10.2147/JPR.S387635
Checked for plagiarism Yes
Review by Single anonymous peer review
Peer reviewer comments 3
Editor who approved publication: Dr Jonathan Greenberg
Jessica A Peterson,1– 3 Cameron Lohman,1 Rebecca D Larson,1 Michael G Bemben,1 Christopher D Black1
1Department of Health and Exercise Science, University of Oklahoma, Norman, OK, USA; 2Department of Community Dentistry and Behavioral Science, University of Florida, Gainesville, FL, USA; 3Pain Research and Intervention Center of Excellence, University of Florida, Gainesville, FL, USA
Correspondence: Christopher D Black, Department of Health and Exercise Science, University of Oklahoma, Norman, OK, 73069, USA, Tel +1 706-255-3750, Email [email protected]
Background: Sex differences exist in pain sensitivity, however, the underlying mechanism(s) that explain these differences are not fully understood. Pain sensitivity has been shown to be influenced by body mass index, but limited data exist on the role of body composition on pain sensitivity. The purpose was to examine the influence of body composition on pain sensitivity in males and females.
Methods: This cross-sectional study design used pressure pain thresholds (PPT) of 87 participants (45 female) who were assessed in the vastus lateralis (leg PPT) and brachioradialis (arm PPT) using a pressure algometer. Fat and lean tissue were assessed via dual-energy X-ray absorptiometry (DXA). A two group by two limb, repeated measured ANOVA was used to assess differences between limbs and sex. Spearman correlations and hierarchical regression analyses were employed to determine the association between body composition and PPT.
Results: Males had higher PPTs then females (P< 0.05) and had higher DXA assessed lean and lower levels fat mass (P< 0.05). Total body and limb specific lean mass was associated with PPTs (r≥ 0.34; P< 0.05). Hierarchical regression analysis revealed lean mass was a significant predictor of 8% of the variance in arm PPT (P< 0.006) and 18% of the variance in leg PPT (P< 0.001). However, lean mass was not found to statistically mediate the observed sex differences in PPT.
Conclusion: This finding suggests lean mass may play a previously unknown role in sex differences in pressure pain sensitivity. Future studies are needed to confirm this finding and a larger sample size is likely required to have sufficient power to perform the mediation analysis.
Keywords: lean mass, fat mass, pressure pain thresholds, sex differences
Introduction
Sex differences in clinical and experimental pain have been well-established.1–4 Females tend to report lower pain threshold and higher ratings of common noxious stimuli1–4 and are at a higher risk of developing chronic pain conditions compared to their male counterparts.1,5–8 Despite this clear and consistent disparity, females remain understudied.9,10 To date a mechanism(s) underlying the commonly observed sex differences has not been definitively established. Proposed explanations include gender role expectations,11 differences in psychological states12 such as anxiety13 and catastrophizing,14 differences in past pain experiences,15,16 sex-related hormone differences,17 and a greater density of sensory nerve fibers associated with skeletal muscle.18
The potential influence of weight status and body composition on pain outcomes in general and on sex differences in pain in particular has not been widely studied. Obesity (defined by body mass index; BMI) and abdominal fat distribution are associated with chronic pain.19–24 Results are inconsistent (for review see25 when comparing BMI groups and experimentally induced pain with some of the variance likely related to differences in the location (arm, leg, hand, finger, abdomen, etc.) and type of noxious stimuli (pressure, thermal, or electrical) applied.25 These regional (abdominal vs forehead and hand) differences in pain sensitivity observed between obese and normal weight individuals highlights a key limitation of BMI – that it treats all body tissue as homogenous and does not account for tissue type (fat, muscle, bone) and distribution of body weight.26 Males and females have whole body and site-specific differences in lean (muscle) and adipose tissue mass, with females tending to have lower lean and higher relative fat mass at similar BMIs.27,28 One method to dichotomize tissue type (fat mass vs lean mass) is to use dual-energy X-ray absorptiometry (DXA), and this may help clarify the complex relationship between body weight, tissue type, and pain sensitivity.29 Several recent studies have found arm-specific lean mass from DXA imaging to be associated with conditioned pain modulation (CPM) and exercise-induced hypoalgesia (EIH) in adolescents30 and to mediate the sex difference in temporal summation in healthy young adults.31 Heightened levels of pro-inflammatory cytokines, such as IL-6 and TNF-α, due to increases adipose tissue in obese individuals has been suggested as a potential mechanism by which obesity and increased body fat may lead to greater pain sensitivity.24,32 To our knowledge, no study has examined whether the established sex differences in lean and adipose tissue mass (ie reduced lean mass and greater adipose mass in females compared to males)27 might play a role in the commonly observed sex differences in pain sensitivity whereby females tend to be more sensitive to pain.1–4
The aim of this study was to examine the impact of DXA-assessed total body and regional lean and adipose tissue mass on pressure pain sensitivity in healthy, adult males and females. We hypothesized (1) that males would be less sensitive to pain than females and (2) based upon the limited available evidence from studies of pain modulation30,31,33 that lean tissue mass, but not adipose tissue mass would be related to pressure pain sensitivity.
Methods and Materials
Sample
This study was part of a larger cross sectional study on sex differences in pain sensitivity and modulation.34 A total of 102 participants were recruited and completed all testing (51 males, 51 females) for the larger study. An outlier analysis was performed using Cook’s distance on total body lean mass and fat mass as well as pressure pain thresholds (PPT) at each of the four assessment sites and six participants were excluded (Cook’s distance >4/n). Nine additional participants were removed from the analysis for this study due to being over the age of 40. In the fifth decade of life, many of our measures become more variable due to muscle mass decline, hormonal changes particularly in females, and pain sensitivity tends to vary as we age, thus we wanted to limit age as a confounding factor. Thus a final sample of 87 (42 males, 45 females) was used for analysis. A sample of 87 was sufficient to detect a small effect (Cohen’s d of 0.22 SD) using a two group (males vs females), two assessment site (arm and leg) mixed-model analysis of variance (ANOVA; for the interaction), assuming a correlation between repeated measures of 0.9.
All participants self-reported being free of any musculoskeletal injuries, chronic pain conditions, and other diseases known to affect sensory processing at the time of data collection. Potential participants who had a current diagnosis of depression, were experiencing amenorrhea, or were taking medications known to affect pain sensitivity were excluded. The participants provided written informed consent prior to the experiment, and all testing procedures were approved by the University of Oklahoma IRB board and ethics committee and complied with the Declaration of Helsinki.
Experimental Design
Participants completed three testing visits in the Sensory and Muscle Function Lab at the University of Oklahoma. During visit one informed consent and medical history were obtained. Next, participants completed questionnaires concerning their self-reported physical activity (International Physical Activity Questionnaire, IPAQ); pain catastrophizing (Pain Catastrophizing Scale, PCS;35 and their attitudes toward pain (Pain Attitudes Questionnaire, PAQ).36 These questionnaires were administered as physical activity,37–39 pain catastrophizing,40 and pain attitudes, especially stoicism and cautiousness41 have been shown to relate to pain experiences. Female participants were tested during the luteal phase of their menstrual cycle which was self-reported and were required to complete a pregnancy test to confirm they were not pregnant in order to perform a whole body DXA scan. After the measures of body composition were taken, the participants were then familiarized to the PPT protocol as we have shown this improves assessment reliability.42 During visits two and three, PPTs were measured on the right and left brachioradialis (BR) and vastus lateralis (VL). This was done as part of a larger study and as such PPTs at each site were averaged between visit two and three. At least 24 h separated visit two from visit three.
Assessment of PPT
An FDIX Force One Pressure Algometer (Wagner Instruments, Greenwich, CT, USA) with a 1 cm diameter circular rubber tip interfaced with Medoc Algomed Software (Medoc Ltd, Ramat Yishai, Israel) was used to assess PPT. Assessments were performed over the belly of the BR of the left and right forearm (L-BR and R-BR, respectively) and the belly of the VL of the left and right leg (L-VL and R-VL, respectively). Two marks were placed approximately one inch apart over the belly of each tested muscle with indelible ink to ensure accurate algometer placement for each assessment across the multiple trial in each visit. Assessments were made while participants were seated in a chair and rested their arms on a solid, flat surface for determination of BR PPT in both arms. Participants remained seated with their feet flat on the ground, knees flexed at approximately 90° with both legs relaxed for assessment of VL PPT in both legs. The algometer was placed perpendicular to the muscle being tested and pressure was applied at a rate of ~30 kilopascals (kPa) per second. Visual feedback was provided to the researcher via Medoc software to ensure a consistent rate of pressure application. Participants indicated when the pressure first became painful (described as the point at which the pressure went from uncomfortable to painful/hurting) by pressing a handheld button that stopped the Medoc Algomed Software which then indicated the pressure when the button was pressed. Two trials were performed in all four limbs, unless a difference of more than 20% between the two trails was observed, then a third PPT was conducted. The two trails in each limb were then averaged as the PPT for that testing visit and the values from test visit two and test visit three were averaged as they showed good reliability across visit two and visit three (ICC3, 1 >0.82 for day-to-day reliability across the four testing sites). The values from the right and left side were similar, thus they were averaged to yield a criterion value for PPT in the arm (PPT arm) and PPT in the leg (PPT leg). The reliability of PPTs in our study were similar to previous work.42
DXA Scan
Body composition was determined with a whole body DXA scan (Lunar Prodigy Advance; GE-Medical Systems, Madison, WI, USA) and corresponding analysis software (enCore 2011, version 13.60, GE-Healthcare). Scans and analysis were performed according to the manufacturer’s instructions. A urine sample was taken prior to the scan to assess urine specific gravity, and females were subjected to a pregnancy test. Once hydration and pregnancy status were established, participants were instructed to lie in a supine position with their arms resting against the sides of the body approximately 6.5–7 cm away from their torso. A block was placed between their feet and the participants were instructed to maintain a stationary position for the duration of the scan. DXA equipment was calibrated on a daily basis according to the protocol provided by the manufacturer. The operators defined the regions of interest (ROI) for the limb specific measures and custom ROI boxes were draw for the two specific sites. The ROI for the legs followed the inguinal line (cutting through the neck of the femur) to the bottom of the femur and the ROI for the arms followed the head of the radius (at the elbow) and dissected at the radiocarpal joint (of the wrist).
Statistical Analysis
All statistical analyses were performed using SPSS 27 (IBM Corporation, Armonk, NY USA). Independent measure t-tests were used to compare values for measures of body size and composition (eg height, weight, BMI, total and limb-specific body fat percent, total lean and fat mass, etc), PCS, PAQ and its associated subscales, and IPAQ domains between males and females. PPTs were compared using a two group (male vs female) × two PPT testing site (PPT leg and PPT arm) repeated measures ANOVA. Findings of a significant interaction comparing the two assessment sites within males and females, using simple comparisons at a given site between males and females and among the individual sites performed using a Bonferroni correction for multiple comparisons. Bivariate relationships among PPTs, body composition measures, psychological measures and physical activity were examined using Spearman ρ (rho) correlation coefficients. In addition, hierarchical linear regressions were performed to determine the association between body composition and PPT while controlling for factors such as age, physical activity, PCS, and PAQ that have been shown to potentially influence experimentally assessed pain. Age was entered in the first block, vigorous intensity physical activity in the second, PCS in the third, and PAQ in the fourth block as they have been shown to potentially influence pain.37,39,43–45 Total and limb specific fat and lean tissue mass were entered in blocks 5 and 6, respectively.
Using the Hayes PROCESS macro (model 4) that was downloaded into IBM SPSS 27, linear regression-based mediation analyses were used to assess biological sex and its association with pressure pain sensitivity in the arm and leg with body composition variables (ie whole body lean, whole body fat mass, limb specific fat mass and limb-specific lean mass) as separate mediators. Using this pathway analysis, we input sex as the independent variable (X), the body composition variables as the mediators (M), and pressure pain thresholds as the dependent variable (Y). This model calculated the indirect effects of X on Y through M. To overcome potential unmet assumptions commonly found in mediation analysis, bootstrapping procedures were employed for all analyses with 5000 samples and reported as estimates and standard errors or as 95% bootstrapped confidence intervals.
Statistical significance was set a priori at α <0.05. Effect sizes were calculated as a Cohen’s d statistic as the differences in means divided by the pooled standard deviation of the means. Effects of ~0.20 are judged to be small, ~0.50 are judged to be moderate, and ≥0.80 are judged to be large. In addition, effect sizes for η2 and ηp2 were calculated for ANOVA models. Values are reported as means ±SD.
Results
Descriptive Statistics
Descriptive characteristics of the two groups are shown in Table 1. Males were taller (P<0.001; d=1.36), and weighed more (P<0.001; d=1.38) than females. Females had a higher percentage of body fat (P<0.001; d=−1.33), and had less total lean mass (P<0.001; d=3.39) than their male counterparts. Total fat mass did not differ between males and females (P=0.11; d=−0.34) nor did BMI (P=0.11; d=0.35).
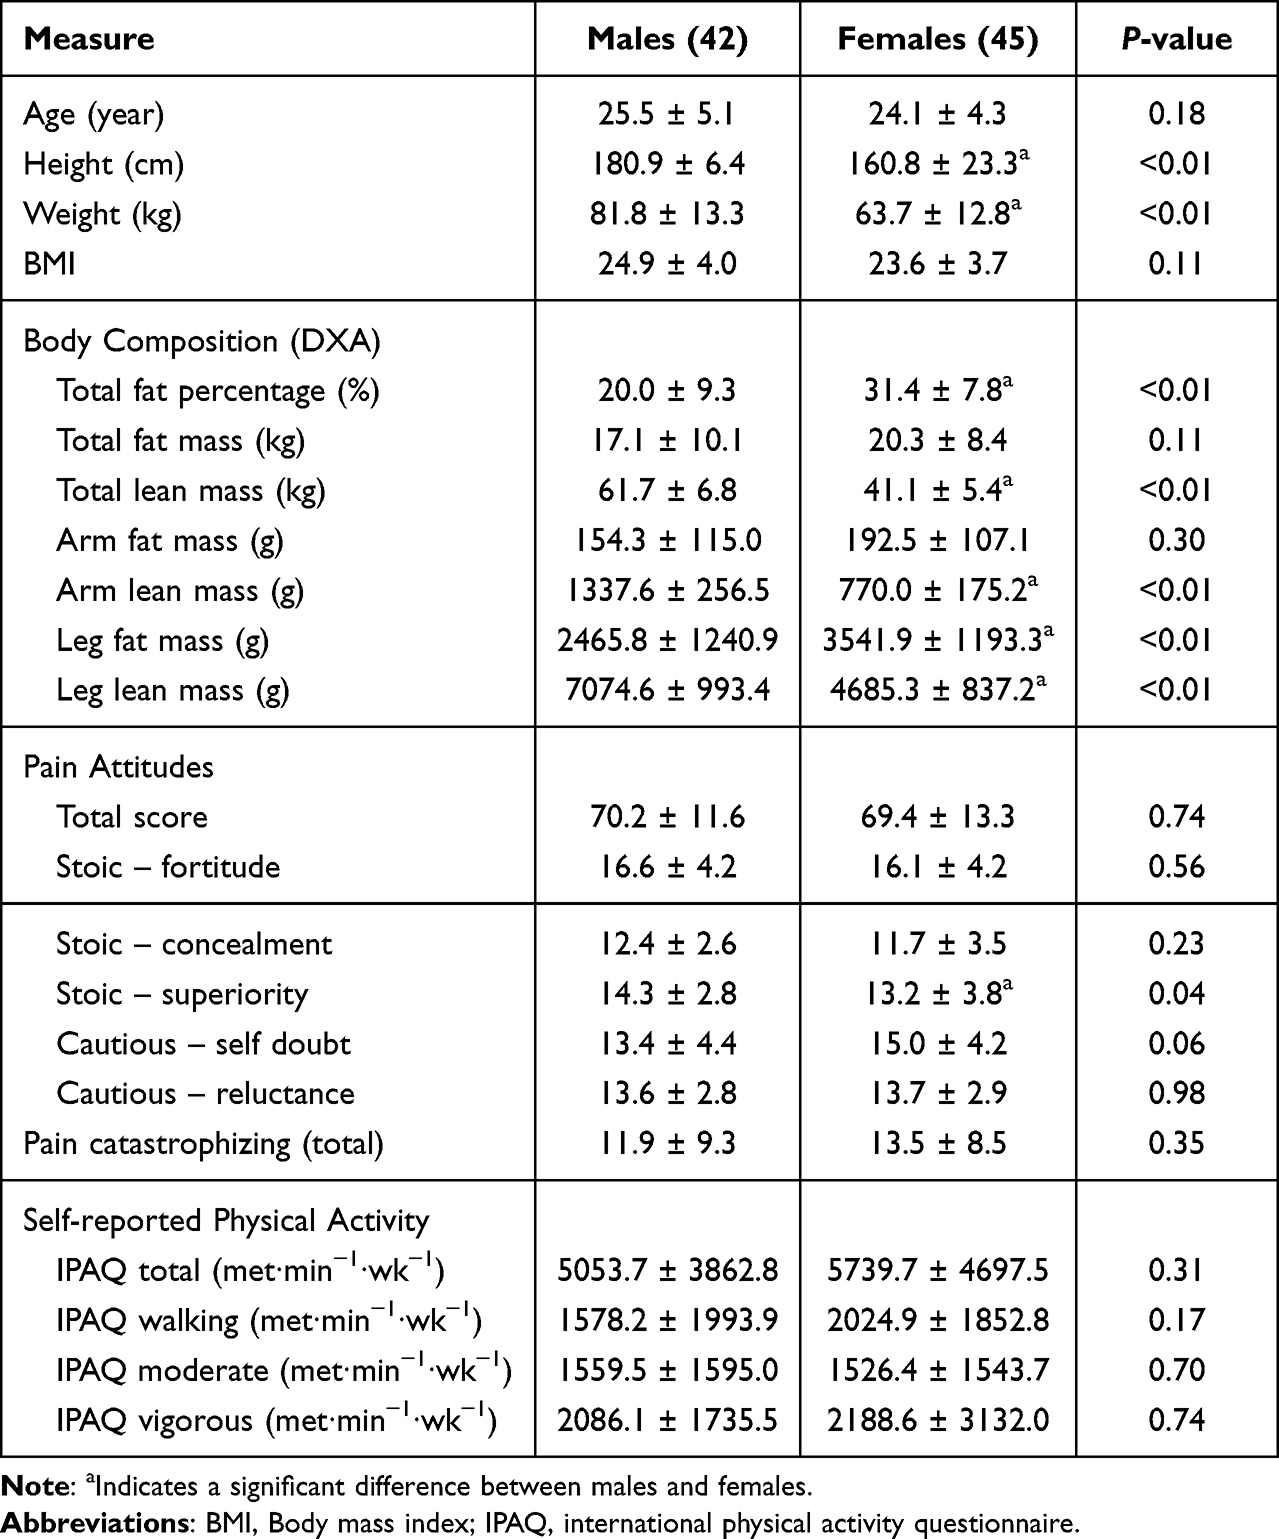 |
Table 1 Sex Differences in Body Composition, Psychological Outcomes, and Physical Activity |
Limb specific fat and lean tissue mass are also shown in Table 1. In the leg females had greater fat mass (P<0.001; d=−0.88) and lower lean mass (P<0.001; d=2.61) compared to males. However, in the arm fat mass did not differ between males and females (P=0.30; d=−0.34), but females had reduced lean mass compared to males (P<0.001; d=2.63). PCS scores did not differ between males and females (P=0.13; d=−0.18; Table 1) nor did the total score on the pain attitudes scale (P=0.70; d=0.06; Table 1). Self-reported physical activity data from IPAQ are also included in Table 1. No differences were observed in total (P=0.31; d=−0.14), walking (P=0.17; d=−0.23), moderate (P=0.70; d=0.02), or vigorous intensity MET∙min−1∙wk−1 (P=0.74; d=−0.04) between males and females.
Pain Sensitivity
Figure 1 shows mean values for PPT in the arm and leg between males and females. A significant group × testing site interaction was found (P<0.001). Pairwise comparisons demonstrated males had higher values (less sensitivity) compared to females in arm (P<0.001; d=0.87) and in the leg (P<0.001; d=1.2). In addition, PPT values in the leg were significantly higher than in the arm in both females (P<0.001) and males (P<0.001).
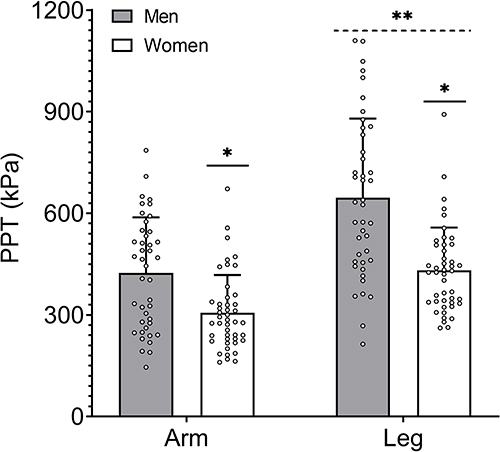 |
Figure 1 Sex differences in absolute pressure pain threshold (PPT) for each of the arm and leg. *Significant difference between males and females in that limb. **Significant difference between PPT values in the arm and leg. |
Relationship Between Body Composition and Pain Sensitivity
Spearman rho correlations coefficients are displayed in Table 2. PPTs in the arm and leg were highly correlated (P<0.001). Age, weight, and BMI did not correlate with arm PPT (P>0.16), however, leg PPT did correlate with weight (P=0.006). Total body adipose tissue mass was inversely correlated with arm PPT (P=0.03), but not leg PPT (P=0.18). Total body lean mass correlated with arm PPT and leg PPT (P<0.001 for both). Limb-specific fat mass was inversely related to leg PPT (P=0.03), but was not related to arm PPT (P=0.10). Limb-specific lean was positively correlated with both arm and leg PPT (P<0.001 for both). No significant relationships were observed between arm PPT and leg PPT and PCS, PAQ-total, and each dimension of physical activity (P>0.15 for all). Figure 2 displays the significant correlations found between arm and leg PPT and whole body and limb-specific lean mass.
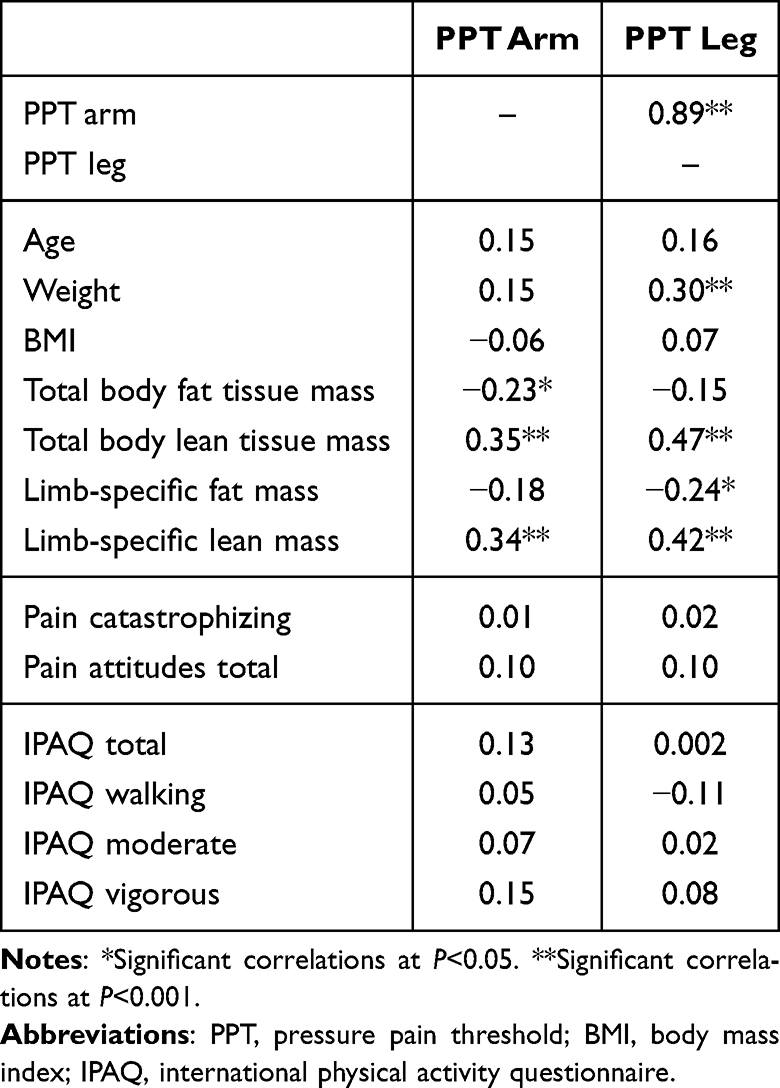 |
Table 2 Spearman Rho Correlations Among Selected Variables and Pain Sensitivity |
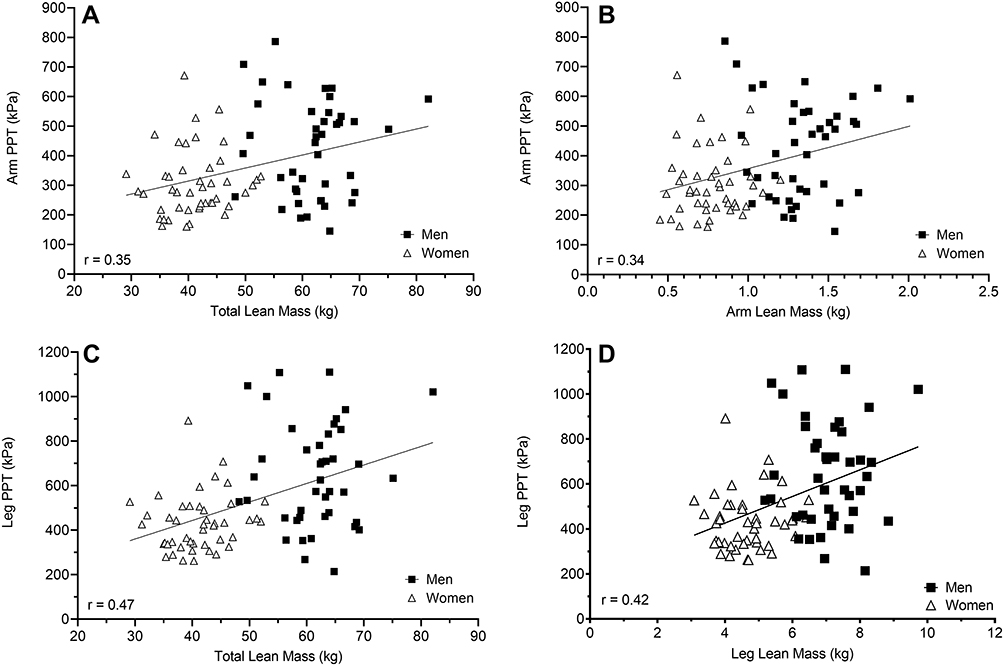 |
Figure 2 Correlations of total lean mass to arm PPT (A) and leg PPT (C) and of limb-specific lean mass to arm PPT (B) and leg PPT (D). In all instances, greater lean mass was associated with higher (less sensitive) PPTs. |
Hierarchical Regressions
Regression analysis revealed that when controlling for age, vigorous PA, PCS, and PAQ-total, that total body fat mass was a significant predictor (7% of the variance) of arm PPT (β= −0.25; P=0.02), but not for leg PPT (P=0.15 for β; Table 3). Total body lean mass was a significant predictor of 8% of the variance in arm PPT (β=0.30; P=0.005) and 18% of the variance in leg PPT (β=0.44; P<0.001). Age (P≥0.12), vigorous PA (P≥0.49), PCS (P≥0.53), and PAQ-total (P≥0.68) were not found to be significant predictors of arm PPT or leg PPT. When limb-specific fat and lean mass were used in the model, limb-specific fat mass was not a significant predictor of arm PPT (P=0.19) or leg PPT (P=0.07; Table 3). Limb-specific lean mass was a significant predictor of 9% of the variance in arm PPT (β=0.31; P=0.004) and 12% of the variance in leg PPT (β=0.36; P<0.001). Age (P≥0.07), vigorous PA (P≥0.42), PCS (P≥0.62), and PAQ-total (P≥0.64) were not found to be significant predictors of arm PPT or leg PPT.
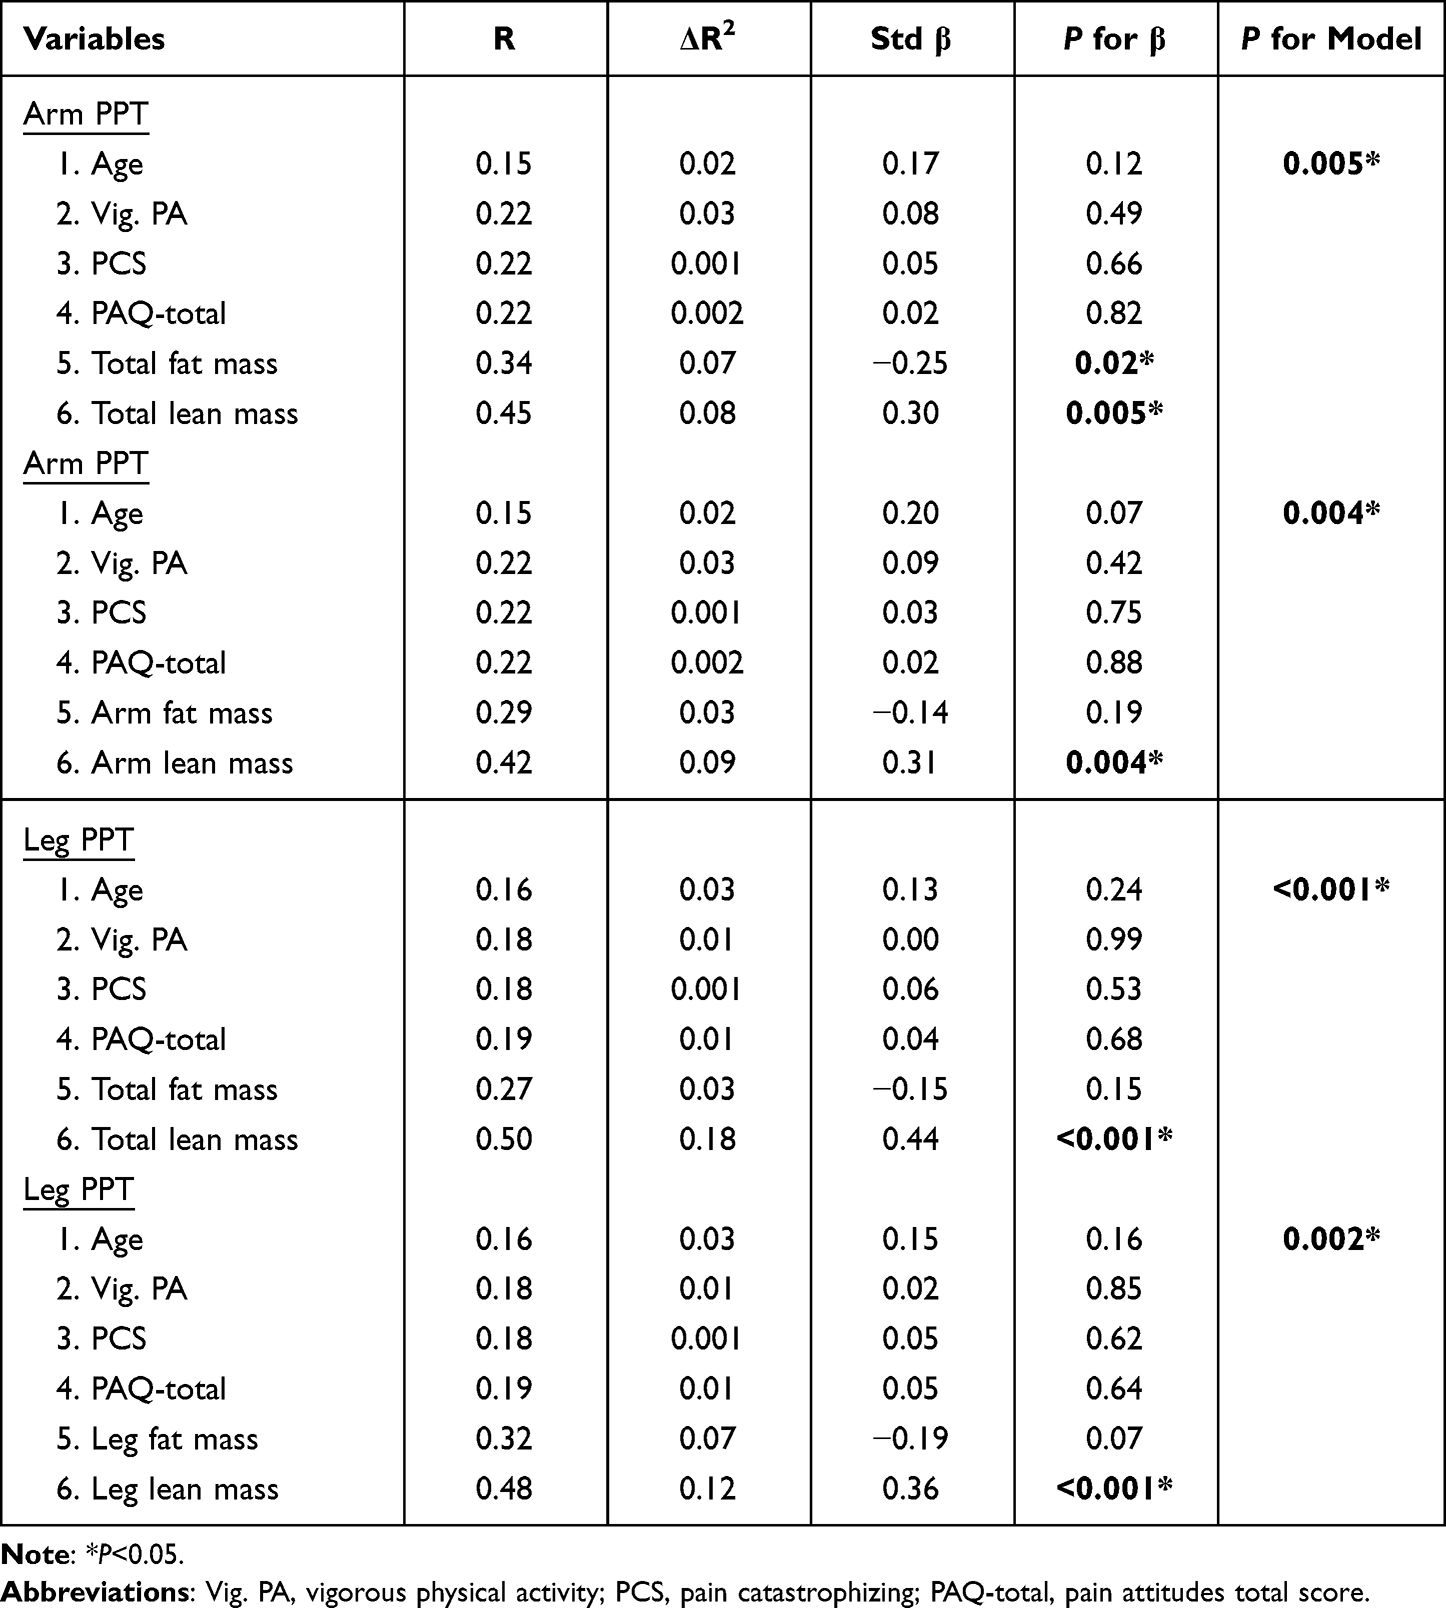 |
Table 3 Summary of Hierarchical Regression Analysis for PPT with Total and Limbspecific Fat and Lean Mass |
Mediation Analysis
A schematic of the mediation analysis can be seen in Figure 3. Since lean mass was associated with both sex and pressure pain sensitivity, follow-up exploratory analysis were run to determine if certain body composition variables mediated the relationship found between sex and PPTs. Sex predicted whole body lean mass and limb-specific lean mass in both the arm and the leg, however sex predicted fat mass in the leg only (Table 4). Despite the hierarchical regression analysis revealing an association between lean mass pressure pain thresholds, none of the body composition measures in this pathway analysis predicted arm or leg PPTs (Table 5). With arm and leg PPTs as the dependent variables, neither fat mass or lean mass mediated the effect of sex and therefore was not statistically significant (ie, included zero) as evaluated with the bootstrapped confidence interval method (Table 6).
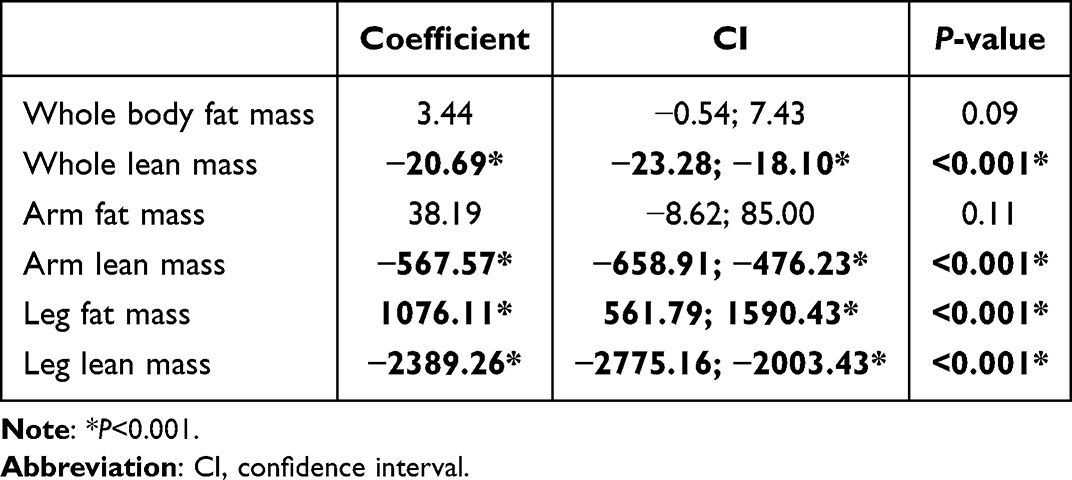 |
Table 4 Path A – Effect of Sex (Independent Variable) on Body Composition Variables (Mediator) |
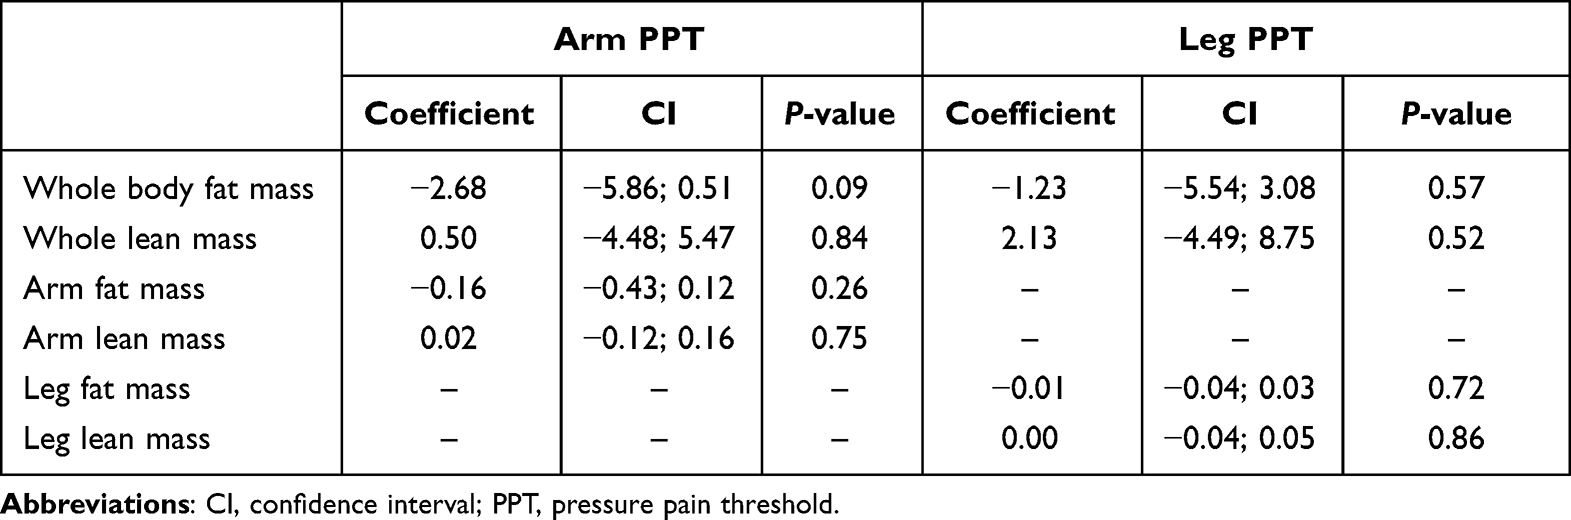 |
Table 5 Path B – Effect of Body Composition Variable (Mediator) on Pressure Pain Variable (Dependent Variable) |
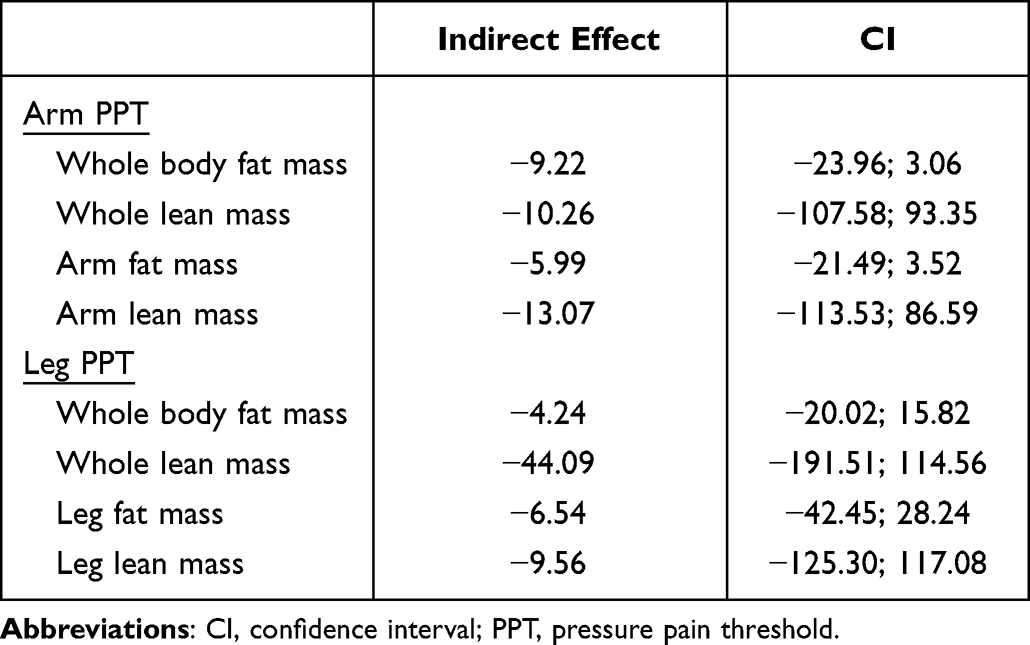 |
Table 6 Indirect Effect Estimates of Sex and Body Composition Variables on Pressure Pain Variables, with Bootstrapped Confidence Intervals |
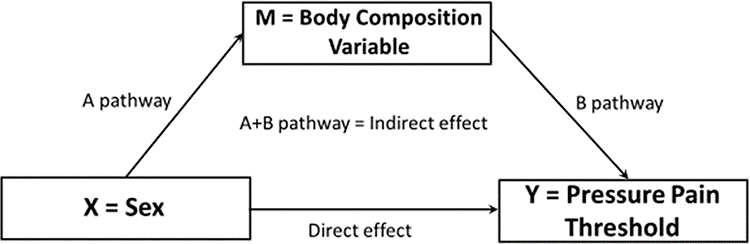 |
Figure 3 Schematic of mediation analysis using sex as the predictor for pressure pain thresholds, and body composition variables (ie whole body lean, whole body fat mass, limb-specific fat mass and limb-specific lean mass) as the mediators. |
Normalized PPTs
To further explore the observed relationships between body weight and body composition and pain sensitivity we normalized arm and leg PPTs by expressing them relative to body weight, total body fat and lean tissue, and limb-specific fat and lean mass. Values for normalized PPTs can be seen in Figure 4. When normalized to body weight there was a significant limb by sex interaction (P=0.009). Follow-up analysis found no sex differences between males and females for arm PPT (P=0.49) or leg PPT (P=0.09), however values in the leg were greater for males (P<0.001) and females (P<0.001). When normalized to total body fat mass (Panel C) or limb-specific fat mass (Panel E) there was a significant limb × sex interaction (P<0.001). The sex difference persisted when normalized to fat mass, with females having lower values in the arm (P<0.002) and leg (P<0.001). The limb difference also persisted when normalized to total or limb-specific fat mass (P<0.001). When normalized to total body lean mass there was no limb × sex interaction (P=0.17). There was no main effect for sex (P=0.65), but there was an effect for limb (P<0.001) with higher values observed in the leg. When normalized to limb specific lean mass the limb × sex interaction was significant (P=0.009). The sex difference in PPT persisted in the arm (P=0.03), but females were found to be less sensitive than males. The sex difference did not persist in the leg (P=0.99). Again the limb difference remained for both males and females (P<0.001 for both), but when normalized to limb lean mass the arms demonstrated less sensitivity than the legs.
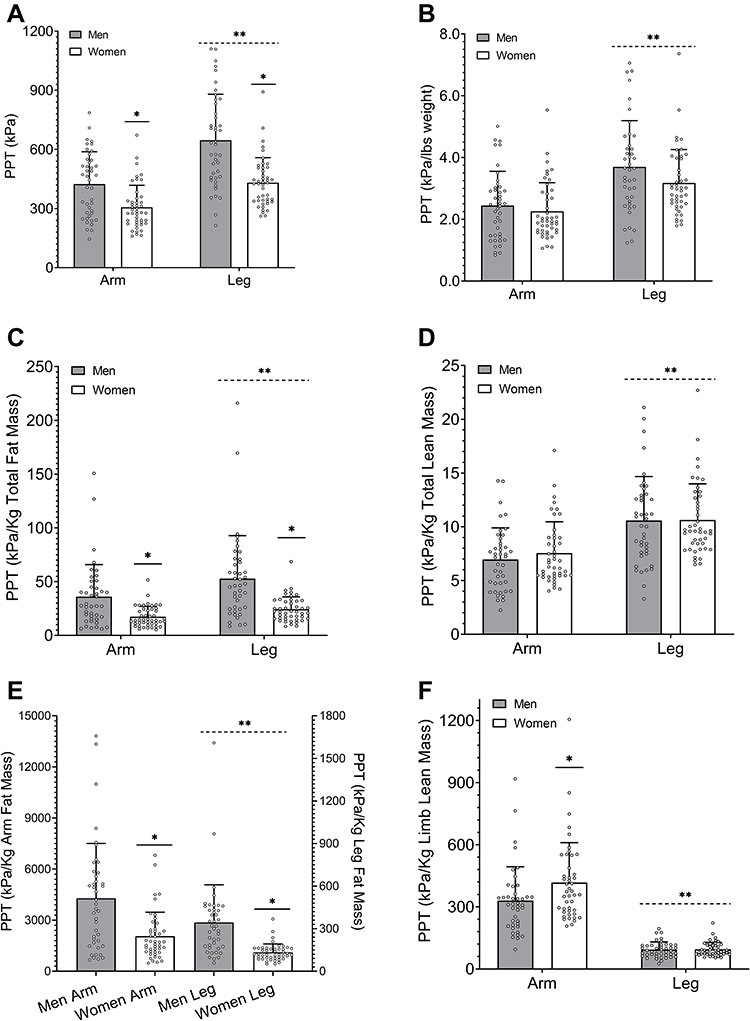 |
Figure 4 Absolute (A) and arm and leg PPTs normalized relative to body weight (B), total body fat mass (C), total body lean mass (D), limb-specific fat mass (E), and limb-specific lean mass (F). *Significant difference between males and females in that limb. **Significant difference between limbs for both males and females. |
Discussion
The primary findings of the present study were that (1) as expected, males and females differed in pressure pain sensitivity with males being less sensitive, (2) whole body and site-specific lean mass were positively correlated with pressure pain sensitivity and explained a small (8–18%), but significant portion of the variation in PPT when controlling for age, physical activity, and psychological variables, and (3) despite the association, neither total body nor limb specific lean mass mediated PPTs.
Our finding that males exhibit a higher pressure pain threshold than females (indicating less sensitivity) has been demonstrated in a host of previous research on experimentally induced pain.1–4,46–48 We found large and consistent differences with Cohen’s d ranging from 0.87 to 1.20 SDs between males and females in the arm and legs, respectively. Studies examining sex differences in experimental pain, especially older studies, have often lacked sufficient statistical power due to small sample sizes.49 Using the findings from their meta-analysis Riley et al49 suggest groups of at least 41 (our sample included 45 females and 42 males) were needed to achieve adequate statistical power. A meta-analysis of only studies with sufficient power found males had higher PPTs compared to females with effect sizes ranging from 0.46 to 1.19 with a mean adjusted effect size of 0.59 SD.49 As such, the findings of the present study add to the growing consensus that females overwhelmingly demonstrate greater sensitivity to pressure pain than males do. Multiple explanations have been suggested to underlie females’ greater sensitivity to noxious stimuli. Two of those are reduced physical activity37,39,45 in females and differences in psychosocial variables such as greater catastrophizing and reduced stoicism compared to males.50 In the present study, males and females did not differ in their PCS scores nor was PCS correlated to arm or leg PPT. Females exhibited reduced stoic-superiority compared to males, but no other differences were observed in the individual dimensions of the PAQ-R and males and females had similar PAQ-total scores. Sex differences were also not observed for any domain of self-reported physical activity in the present study. Taken together these finding suggest the males and females in the present study were very similar in these areas and therefore these variables likely played little to no role in our observed sex differences in PPT. As such, other variables are likely mediating the observed differences in our sample.
To our knowledge, this was the first study to examine the relationship between body composition (total and limb-specific lean and fat mass) pressure pain sensitivity to determine if differences in tissue composition might be related to and/or mediate sex differences in pain sensitivity. In agreement with previous studies51,52 we found males had greater absolute and relative lean mass and females had a greater relative fat mass, although their BMIs were similar. Several previous studies have grouped participants as “obese” and “non-obese” based upon BMI53–56 in an effort to determine the role of body fat and its distribution on pain sensitivity. Inconsistent results have been found with obese (by BMI) individuals being more,53,54 less,56 or not different55 from normal weight individuals to pressure stimuli. However, none of these studies accounted for sex differences in body composition at similar BMI levels. Therefore, based upon limited evidence30,31,33 demonstrating a relationship between DXA derived arm specific lean mass and pain modulatory function as well as that arm-specific lean mass mediated the difference in temporal summation between males and females,31 we hypothesized lean mass, but not fat mass would be related to PPTs in our study sample. We found that lean mass, both whole body and limb specific, consistently demonstrated a weak (in the arm) and moderate (in the leg), positive relationships with PPTs. Interestingly, a weak negative relationship was observed between total fat mass and Arm PPT and leg-specific fat mass and leg PPT. When controlling for age, physical activity, catastrophizing and pain attitudes, we found that lean mass uniquely predicted between 8 and 18% of the variance in PPTs. Despite the variance explained, total or limb specific lean mass did not statistically mediate the differences in pain sensitivity.
Reconciling these disparate findings is difficult. Females have been shown to have greater epidermal nerve fiber density57–59 and greater nerve fiber density in connective tissue associated with skeletal muscle.60 It has been suggested these differences may play a role in females’ greater sensitivity to pressure pain.59 Although not measured in the present study, greater nerve fiber density could explain our lack of a mediating effect of lean mass on PPTs. If females have greater nociceptors per unit area of tissue (regardless of the tissue) then the relative amounts of lean mass would not be expected mediate PPTs. However, our results do not necessarily fit this explanation. We explored this idea by normalizing PPTs to lean mass (see Figure 4). However, when we did so the sex difference was eliminated. If the difference was primarily mediated by receptor density, given the similarity in our sample on PCS, PAQ-total, and physical activity, then the difference should have persisted when normalizing to lean mass. This finding does not lend support to the idea that sex differences in PPTs are related to differences in receptor density. Another issue to consider in regard to our mediation analysis is the collinearity of sex and lean mass. Strong correlations were found between sex and total body (r=0.87), leg (r=0.80), and arm (r=0.80) lean mass. Strong correlations between mediators (lean mass in this study) and independent variables (sex) can dramatically reduce the statistical power of the mediation analysis due to an increase in the standard error of the product test.61 Therefore, it is possible that our study was underpowered to detect a mediation effect of lean mass on the sex differences in PPT. Conversely, it is also possible that factors inherent to biological sex such as differences in estrogen and testosterone influence both lean mass and pressure pain sensitivity. As such, there may not be a true mechanistic relationship between lean mass per se and PPT, but rather lean mass functions as a proxy for biological sex and some other sex-related variable that was not tested in the current study mediates the difference in PPT. Furthermore, while our sample size for this study was greater than previous studies, we were still below the recommended size for mediation analysis (N=100). Our confidence intervals were trending towards zero on several variables and larger sample sizes could aid future studies employing a similar design.
A more apt explanation of our findings may be more methodologically explained rather than focusing on a mechanism. Pressure pain algometry is a reliable technique for the assessment of mechanical pain sensitivity of deep somatic structures. However, it is highly variable between participants. We demonstrated an association between measures of body composition and pressure pain sensitivity whereby those who were heavier and had more muscle mass, per se, were less sensitive to pain. Raw data are difficult to interpret and summarize due to individualized differences in body size. Summary scores created from normalized data can be used to control for these differences, reduce variance and minimize the chance of finding false-positive results. Neuromuscular and cardiovascular research has answered challenges associated with interpreting raw values in both clinical practice and research by normalizing variables to body mass. Therefore, we demonstrate why it might be beneficial for pain researchers that use algometry to normalize pressure pain measures that assess somatic pressure pain to body weight or lean mass in order to accommodate the high variability that we see in pressure pain sensitivity measures.
This study has several experimental considerations of note. First, we had a relatively young group of adults who participated with an age range of 18–40 years old with all females being premenopausal. Age has been shown to influence pain sensitivity with older adults showing greater sensitivity.44 The age range was similar between males and females, and was not a significant predictor of PPT therefore, we are confident it did not influence the results of the present study. However, further study is required to determine if sex differences persist and are related to lean tissue mass in older adults. Second, our participants were very active by self-report. Only one participant did not meet the American College of Sports Medicine recommended guidelines for weekly PA. Recent estimates indicate nearly 50% of adults do not meet these recommendations. Thus, it is also unclear the extent to which our findings would generalize to a less active group who might have reduced lean mass and greater fat mass.
Conclusions
This study examined the influence of body composition on sensitivity to noxious pressure. Total body and limb specific lean mass, but not fat mass, were associated with and a significant predictor of a small portion of the variance in PPT between males and females. However, lean mass did not statistically mediate the sex difference. This finding suggests that lean mass may play a previously under studied role in pain sensitivity. Future studies with larger samples are needed to confirm our finding. In addition, studies examining whether interventions designed to alter lean mass, such as resistance training, or bed rest could provide important insights into this relationship as well. It may be useful for future studies using pressure pain sensitivity to “normalize” or “control” for body composition variables to assess differences across groups that may be contributing to the variability observed in pressure pain assessments.
Data Sharing Statement
The datasets during and/or analyzed during the current study available from the corresponding author on reasonable request.
Ethics Approval and Consent to Participate
Written informed consent was provided by the participants prior to the experiment, and all testing procedures were approved by the University of Oklahoma Ethics Committee and complied with the Declaration of Helsinki.
Consent for Publication
The authors grant consent to publish the manuscript and related images. All authors have seen the content of the manuscript.
Acknowledgments
The authors wish to thank the participants for their time and effort.
Funding
No sources of funding for this study were provided.
Disclosure
The authors report no conflicts of interest in this work.
References
1. Bartley EJ, Fillingim RB. Sex differences in pain: a brief review of clinical and experimental findings. Br J Anaesth. 2013;111(1):52–58. doi:10.1093/bja/aet127
2. Racine M, Tousignant-Laflamme Y, Kloda LA, Dion D, Dupuis G, Choiniere M. A systematic literature review of 10 years of research on sex/gender and experimental pain perception - part 1: are there really differences between women and men? Pain. 2012;153(3):602–618. doi:10.1016/j.pain.2011.11.025
3. Berkley KJ. Sex differences in pain. Behav Brain Sci. 1997;20(3):371–380. doi:10.1017/S0140525X97221485
4. Unruh AM. Gender variations in clinical pain experience. Pain. 1996;65(2–3):123–167. doi:10.1016/0304-3959(95)00214-6
5. Fillingim RB, King CD, Ribeiro-Dasilva MC, Rahim-Williams B, Riley IIIJL. Sex, gender, and pain: a review of recent clinical and experimental findings. J Pain. 2009;10(5):447–485. doi:10.1016/j.jpain.2008.12.001
6. Bartley EJ, King CD, Sibille KT, et al. Enhanced pain sensitivity among individuals with symptomatic knee osteoarthritis: potential sex differences in central sensitization. Arthritis Care Res. 2016;68(4):472–480. doi:10.1002/acr.22712
7. Tsang A, Von Korff M, Lee S, et al. Common chronic pain conditions in developed and developing countries: gender and age differences and comorbidity with depression-anxiety disorders. J Pain. 2008;9(10):883–891. doi:10.1016/j.jpain.2008.05.005
8. Andersson HI, Ejlertsson G, Leden I, Rosenberg C, Centre BH. Chronic pain in a geographically defined general population: studies of differences in age, gender, social class, and pain localization. Clin J Pain. 1993;9(3):174–182. doi:10.1097/00002508-199309000-00004
9. Mogil JS. Sex differences in pain and pain inhibition: multiple explanations of a controversial phenomenon. Nat Rev Neurosci. 2012;13(12):859. doi:10.1038/nrn3360
10. Mogil JS, Chanda ML. The case for the inclusion of female subjects in basic science studies of pain. Pain. 2005;117(1):1–5. doi:10.1016/j.pain.2005.06.020
11. Levine FM, De Simone LL. The effects of experimenter gender on pain report in male and female subjects. Pain. 1991;44(1):69–72. doi:10.1016/0304-3959(91)90149-R
12. Fillingim R, Keefe F, Light K, Booker D, Maixner W. The influence of gender and psychological factors on pain perception. J Gender Cult Health. 1996;1:21–36.
13. Rollman GB. Gender Differences in Pain: Role of Anxiety. American Pain Society by Churchill Livingstone; 1995:231–234.
14. Edwards RR, Haythornthwaite JA, Sullivan MJ, Fillingim RB. Catastrophizing as a mediator of sex differences in pain: differential effects for daily pain versus laboratory-induced pain. Pain. 2004;111(3):335–341. doi:10.1016/j.pain.2004.07.012
15. Granot M, Somer E, Zisman-Ilani Y, et al. Characteristics of response to experimental pain in sexually abused women. Clin J Pain. 2011;27(7):616–622. doi:10.1097/AJP.0b013e3182132963
16. Dionne RA, Bartoshuk L, Mogil J, Witter J. Individual responder analyses for pain: does one pain scale fit all? Trends Pharmacol Sci. 2005;26(3):125–130. doi:10.1016/j.tips.2005.01.009
17. Fillingim RB, Ness T. Sex-related hormonal influences on pain and analgesic responses. Neurosci Biobehav Rev. 2000;24(4):485–501. doi:10.1016/S0149-7634(00)00017-8
18. Alhilou AM, Shimada A, Svensson CI, et al. Nerve growth factor and glutamate increase the density and expression of substance P-containing nerve fibers in healthy human masseter muscles. Sci Rep. 2021;11(1):15673. doi:10.1038/s41598-021-95229-7
19. Cameron AJ, Magliano DJ, Dunstan DW, et al. A bi-directional relationship between obesity and health-related quality of life: evidence from the longitudinal AusDiab study. Int J Obes. 2012;36(2):295–303. doi:10.1038/ijo.2011.103
20. Bigand T, Wilson M, Bindler R, Daratha K. Examining risk for persistent pain among adults with overweight status. Pain Manag Nurs. 2018;19(5):549–556. doi:10.1016/j.pmn.2018.02.066
21. Hitt HC, McMillen RC, Thornton-Neaves T, Koch K, Cosby AG. Comorbidity of obesity and pain in a general population: results from the southern pain prevalence study. J Pain. 2007;8(5):430–436. doi:10.1016/j.jpain.2006.12.003
22. Majedi H, Amini MH, Yousefshahi F, et al. Predicting factors of pain duration in patients with chronic pain: a large population-based study. Anesth Pain Med. 2020;10(1):e95776. doi:10.5812/aapm.95776
23. McCarthy LH, Bigal ME, Katz M, Derby C, Lipton RB. Chronic pain and obesity in elderly people: results from the Einstein aging study. J Am Geriatr Soc. 2009;57(1):115–119. doi:10.1111/j.1532-5415.2008.02089.x
24. Ray L, Lipton RB, Zimmerman ME, Katz MJ, Derby CA. Mechanisms of association between obesity and chronic pain in the elderly. Pain. 2011;152(1):53–59. doi:10.1016/j.pain.2010.08.043
25. Torensma B, Thomassen I, van Velzen M, In ‘t Veld BA. Pain experience and perception in the obese subject systematic review (revised version). Obes Surg. 2016;26(3):631–639. doi:10.1007/s11695-015-2008-9
26. Romero-Corral A, Lopez-Jimenez F, Sierra-Johnson J, Somers VK. Differentiating between body fat and lean mass-how should we measure obesity? Nat Clin Pract Endocrinol Metab. 2008;4(6):322–323. doi:10.1038/ncpendmet0809
27. Bredella MA. Sex differences in body composition. In: Sex and Gender Factors Affecting Metabolic Homeostasis, Diabetes and Obesity. Springer; 2017:9–27.
28. Zhu K, Briffa K, Smith A, et al. Gender differences in the relationships between lean body mass, fat mass and peak bone mass in young adults. Osteoporos Int. 2014;25(5):1563–1570. doi:10.1007/s00198-014-2665-x
29. Walsh TP, Arnold JB, Evans AM, Yaxley A, Damarell RA, Shanahan EM. The association between body fat and musculoskeletal pain: a systematic review and meta-analysis. BMC Musculoskelet Disord. 2018;19(1):233. doi:10.1186/s12891-018-2137-0
30. Stolzman S, Hoeger Bement M. Lean mass predicts conditioned pain modulation in adolescents across weight status. Eur J Pain. 2016;20(6):967–976. doi:10.1002/ejp.821
31. Awali A, Alsouhibani AM, Bement MH. Lean mass mediates the relation between temporal summation of pain and sex in young healthy adults. Biol Sex Differ. 2018;9(1):42. doi:10.1186/s13293-018-0200-z
32. Zhang JM, An J. Cytokines, inflammation, and pain. Int Anesthesiol Clin. 2007;45(2):27–37. doi:10.1097/AIA.0b013e318034194e
33. Stolzman S, Danduran M, Hunter SK, Bement MH. Pain response after maximal aerobic exercise in adolescents across weight status. Med Sci Sports Exerc. 2015;47(11):2431–2440. doi:10.1249/MSS.0000000000000678
34. Peterson JA, Lohman C, Larson RD, Bemben MG, Black CD. Body composition does not influence conditioned pain modulation and exercise‐induced hyperalgesia in healthy males and females. Eur J Pain. 2022;26(8):1800–1810. doi:10.1002/ejp.2005
35. Sullivan M, Bishop S, Pivik J. The pain catastrophizing scale: development and validation. Psych Assess. 1995;7(4):524–532. doi:10.1037/1040-3590.7.4.524
36. Yong HH, Gibson SJ, Horne DJ, Helme RD. Development of a pain attitudes questionnaire to assess stoicism and cautiousness for possible age differences. J Gerontol B Psychol Sci Soc Sci. 2001;56(5):P279–84. doi:10.1093/geronb/56.5.P279
37. Ellingson LD, Colbert LH, Cook DB. Physical activity is related to pain sensitivity in healthy women. Med Sci Sports Exerc. 2012;44(7):1401–1406. doi:10.1249/MSS.0b013e318248f648
38. Lemley KJ, Hunter SK, Bement MK. Conditioned pain modulation predicts exercise-induced hypoalgesia in healthy adults. Med Sci Sports Exerc. 2015;47(1):176–184. doi:10.1249/MSS.0000000000000381
39. Naugle KM, Riley JL
40. George SZ, Wittmer VT, Fillingim RB, Robinson ME. Sex and pain-related psychological variables are associated with thermal pain sensitivity for patients with chronic low back pain. J Pain. 2007;8(1):2–10. doi:10.1016/j.jpain.2006.05.009
41. Hsieh AY, Tripp DA, Ji LJ, Sullivan MJ. Comparisons of catastrophizing, pain attitudes, and cold-pressor pain experience between Chinese and European Canadian young adults. J Pain. 2010;11(11):1187–1194. doi:10.1016/j.jpain.2010.02.015
42. Black CD, Pickowitz KE. Day-to-day reliability of pressure pain threshold and pain ratings in college-aged men. Int J Rehabil Res. 2015;38(3):213–218. doi:10.1097/MRR.0000000000000111
43. Naugle KM, Naugle KE, Fillingim RB, Riley JL
44. Naugle KM, Naugle KE, Riley JL
45. Naugle KM, Ohlman T, Naugle KE, Riley ZA, Keith NR. Physical activity behavior predicts endogenous pain modulation in older adults. Pain. 2017;158(3):383–390. doi:10.1097/j.pain.0000000000000769
46. Chesterton LS, Sim J, Wright CC, Foster NE. Interrater reliability of algometry in measuring pressure pain thresholds in healthy humans, using multiple raters. Clin J Pain. 2007;23(9):760–766. doi:10.1097/AJP.0b013e318154b6ae
47. Fischer AA. Pressure algometry over normal muscles. Standard values, validity and reproducibility of pressure threshold. Pain. 1987;30(1):115–126. doi:10.1016/0304-3959(87)90089-3
48. Noboa K, Keller J, Hergenrader K, et al. Men exhibit greater pain pressure thresholds and times to task failure but not performance fatigability following self-paced exercise. Percept Mot Skills. 2021;128(5):2326–2345. doi:10.1177/00315125211035028
49. Riley JL, Robinson ME, Wise EA, Myers CD, Fillingim RB. Sex differences in the perception of noxious experimental stimuli: a meta-analysis. Pain. 1998;74(2–3):181–187. doi:10.1016/S0304-3959(97)00199-1
50. Forsythe LP, Thorn B, Day M, Shelby G. Race and sex differences in primary appraisals, catastrophizing, and experimental pain outcomes. J Pain. 2011;12(5):563–572. doi:10.1016/j.jpain.2010.11.003
51. Pasco JA, Nicholson GC, Brennan SL, Kotowicz MA. Prevalence of obesity and the relationship between the body mass index and body fat: cross-sectional, population-based data. PLoS One. 2012;7(1):e29580. doi:10.1371/journal.pone.0029580
52. Lemieux S, Prud’homme D, Bouchard C, Tremblay A, Després J-P. Sex differences in the relation of visceral adipose tissue accumulation to total body fatness. Am J Clin Nutr. 1993;58(4):463–467. doi:10.1093/ajcn/58.4.463
53. Mckendall MJ, Haier RJ. Pain sensitivity and obesity. Psychiat Res. 1983;8(2):119–125. doi:10.1016/0165-1781(83)90099-9
54. Tashani OA, Astita R, Sharp D, Johnson MI. Body mass index and distribution of body fat can influence sensory detection and pain sensitivity. Eur J Pain. 2017;21(7):1186–1196. doi:10.1002/ejp.1019
55. Price RC, Asenjo JF, Christou NV, Backman SB, Schweinhardt P. The role of excess subcutaneous fat in pain and sensory sensitivity in obesity. Eur J Pain. 2013;17(9):1316–1326. doi:10.1002/j.1532-2149.2013.00315.x
56. Khimich S. Level of sensitivity of pain in patients with obesity. Acta Chir Hung. 1997;36(1–4):166–167.
57. Goransson LG, Mellgren SI, Lindal S, Omdal R. The effect of age and gender on epidermal nerve fiber density. Neurology. 2004;62(5):774–777. doi:10.1212/01.wnl.0000113732.41127.8f
58. Provitera V, Gibbons CH, Wendelschafer-Crabb G, et al. A multi-center, multinational age- and gender-adjusted normative dataset for immunofluorescent intraepidermal nerve fiber density at the distal leg. Eur J Neurol. 2016;23(2):333–338. doi:10.1111/ene.12842
59. Selim MM, Wendelschafer-Crabb G, Hodges JS, et al. Variation in quantitative sensory testing and epidermal nerve fiber density in repeated measurements. Pain. 2010;151(3):575–581. doi:10.1016/j.pain.2010.06.034
60. Alhilou AM, Shimada A, Svensson CI, Ernberg M, Cairns BE, Christidis N. Density of nerve fibres and expression of substance P, NR2B-receptors and nerve growth factor in healthy human masseter muscle: an immunohistochemical study. J Oral Rehabil. 2021;48(1):35–44. doi:10.1111/joor.13109
61. Beasley TM. Tests of mediation: paradoxical decline in statistical power as a function of mediator collinearity. J Exp Educ. 2014;82(3):283–306. doi:10.1080/00220973.2013.813360
 © 2022 The Author(s). This work is published and licensed by Dove Medical Press Limited. The
full terms of this license are available at https://www.dovepress.com/terms
and incorporate the Creative Commons Attribution
- Non Commercial (unported, 3.0) License.
By accessing the work you hereby accept the Terms. Non-commercial uses of the work are permitted
without any further permission from Dove Medical Press Limited, provided the work is properly
attributed. For permission for commercial use of this work, please see paragraphs 4.2 and 5 of our Terms.
© 2022 The Author(s). This work is published and licensed by Dove Medical Press Limited. The
full terms of this license are available at https://www.dovepress.com/terms
and incorporate the Creative Commons Attribution
- Non Commercial (unported, 3.0) License.
By accessing the work you hereby accept the Terms. Non-commercial uses of the work are permitted
without any further permission from Dove Medical Press Limited, provided the work is properly
attributed. For permission for commercial use of this work, please see paragraphs 4.2 and 5 of our Terms.