")
Back to Journals » Drug Design, Development and Therapy » Volume 14
LC-MS/MS Estimation of the Anti-Cancer Agent Tandutinib Levels in Human Liver Microsomes: Metabolic Stability Evaluation Assay
Authors Attwa MW , Abdelhameed AS , Al-Shakliah NS, Kadi AA
Received 4 August 2020
Accepted for publication 9 October 2020
Published 23 October 2020 Volume 2020:14 Pages 4439—4449
DOI https://doi.org/10.2147/DDDT.S274118
Checked for plagiarism Yes
Review by Single anonymous peer review
Peer reviewer comments 2
Editor who approved publication: Dr Qiongyu Guo
Mohamed W Attwa, Ali S Abdelhameed, Nasser S Al-Shakliah, Adnan A Kadi
1 Department of Pharmaceutical Chemistry, College of Pharmacy, King Saud University, Riyadh, Saudi Arabia
Correspondence: Ali S Abdelhameed
Department of Pharmaceutical Chemistry, College of Pharmacy, King Saud University, P.O. Box 2457, Riyadh 11451, Saudi Arabia
Tel +966 1146 70237
Fax +966 1146 76220
Email [email protected]
Purpose: Tandutinib (MLN518 or CT 53518) (TND) is a novel, oral, small-molecule inhibitor of type III receptor tyrosine kinases utilized for the treatment of acute myeloid leukemia (AML).
Materials and Methods: In silico prediction of hepatic drug metabolism for TND was determined using the StarDrop® WhichP450™ module to confirm its metabolic liability. Second, an efficient and accurate LC-MS/MS method was established for TND quantification to evaluate metabolic stability. TND and entrectinib (ENC) (internal standard; IS) were resolved using an isocratic elution system with a reversed stationary phase (C8 column).
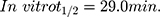
Results: The established LC-MS/MS method exhibited linearity (5– 500 ng/mL) with r2 ≥ 0.9999 in the human liver microsomes matrix. The method sensitivity was indicated by the limit of quantification (3.8 ng/mL), and reproducibility was revealed by inter- and intraday precision and accuracy (below 10.5%). TND metabolic stability estimation was calculated using intrinsic clearance (22.03 μL/min/mg) and in vitro half-life (29.0 min) values.
Conclusion: TND exhibited a moderate extraction ratio indicative of good bioavailability. According to the literature, the approach developed in the present study is the first established LC-MS/MS method for assessing TND metabolic stability.
Keywords: tandutinib, metabolic stability assessment, in vitro half-life, validated LC-MS/MS methodology
Plain Language Summary
Tandutinib is a novel anti-cancer agent that is used for the treatment of acute myeloid leukemia via the inhibition of type III receptor tyrosine kinases. The method developed in this study is the first validated LC-MS/MS analytical approach for tandutinib quantification in the human liver microsomal (HLM) matrix. The methodology showed adequate sensitivity, was ecofriendly (due to less consumption of organic solvent), accurate, had a high percent recovery, and required little time to complete. The method was applied to evaluate tandutinib metabolic stability in the HLM matrix. In silico evaluation and experimental metabolic stability analyses were performed. The experimental data was analyzed using in silico WhichP450™ module of StarDrop software. Drug discovery studies can be performed utilizing this approach and will allow the development of a new drugs with greater safety profiles without affecting pharmacological activity. The estimation of tandutinib metabolic stability was determined by calculating its intrinsic clearance (22.03 µL/min/mg) and in vitro half-life (29.0 min). Tandutinib exhibited a moderate extraction ratio from the liver compared to other previously studied tyrosine kinase inhibitors which indicates its potential for good in vivo bioavailability. From these positive outcomes, we tandutinib administered to patients will not be subject to rapid excretion or dose accumulation inside the human body.
Introduction
Tyrosine kinase inhibitors (TKIs) are a class of drugs that inhibit the intracellular signals stimulating malignant cell proliferation by selectively blocking kinase enzyme activity.1 Tyrosine kinases are enzymes that regulate the transfer of a phosphate group of ATP to the hydroxyl groups of a tyrosine moiety on target proteins. These kinases act as switch (on or off) for several cellular functions.2 Tyrosine kinase activity controls crucial cellular processes, including the cell cycle, cell death, and proliferation. Uncontrolled proliferation in several types of cancers is induced by growth factor receptor-mediated signaling. In cancer cells, a failure in the control mechanism may result in excessive phosphorylation and persistent pathways in an activated state of growth.3,4 Acute myeloid leukemia (AML) is considered a myeloid malignancy that consists of a heterogeneous molecular panel of mutations contributing to differentiation blockade and accumulation of myeloid progenitor cells and hematopoietic stem cell proliferation.5 The first-generation inhibitors of FMS-like tyrosine kinase 3 (FLT3) mainly included lestaurtinib (CEP-701), midostaurin (PKC412), sunitinib (SU11248), and tandutinib (TND).6
TND (Figure 1, MLN518, or CT 53518) is a novel, oral, small molecule designed to treat AML by inhibiting the tyrosine kinase (type III receptor), which includes the receptor-type tyrosine-protein kinase FLT3 in addition to platelet-derived growth factor receptor and tyrosine-protein kinase Kit (CD117).7 TND administered alone showed narrow activity in Phase I and II clinical trials in patients with myelodysplastic syndrome and AML but, when co-administered with daunorubicin and cytarabine, it showed encouraging anti-leukemic activity in phase I/II trials in AML patients and prevented FLT3-ITD leukemia cell proliferation and induced cell apoptosis.8 In combination with bevacizumab, TND can be utilized for the treatment of glioblastoma.9 The maximally tolerated dose of TND is 525 mg twice daily.10 TND has been approved for fast-track status by the United States Food and Drug Administration (FDA) to treat AML.11
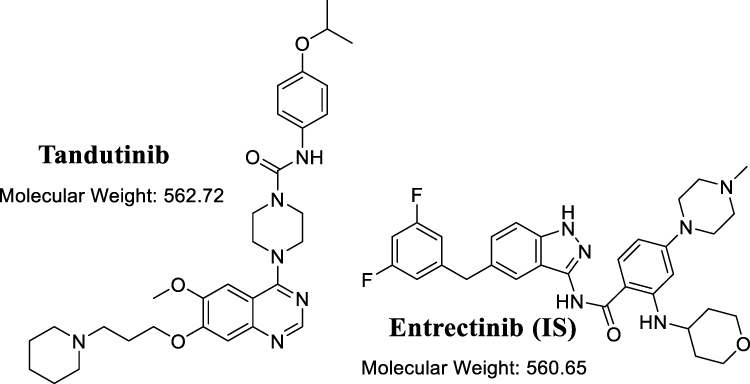 |
Figure 1 Chemical structures of tandutinib and entrectinib (internal standard; IS). |
To estimate the rate of in vivo metabolism using in vitro metabolism data, three basic models could be used: parallel tube, dispersion, and venous equilibrium.12,13 In the present study, the TND intrinsic clearance and in vitro half-life (t1/2) in human liver microsomes (HLMs) were calculated following an “in vitro t1/2” approach utilizing the “well-stirred” model14,15 as it is the most frequently utilized model in experiments of drug metabolism due to its simplicity. These parameters (in vitro t1/2 and intrinsic clearance) could be utilized to compute different physiological parameters (eg, in vivo t1/2 and liver clearance). The estimation of drug bioavailability provides a clear approach to predict its metabolic mechanisms in vivo. If the examined drug undergoes fast metabolism, it will exhibit a short duration of action and low in vivo bioavailability value.16–20
Before beginning practical metabolic stability experiments, TND should be tested for its liability to drug metabolism in the liver. Thus, we performed in silico metabolic vulnerability for TND using the WhichP450™ module of StarDrop® software. In addition, a literature review indicated that TND could be subjected to hepatic metabolism.21 However, there are no analytical methods reported for the quantification of TND in the current literature. Thus, the aim of the present study was to develop a validated liquid chromatography-tandem mass spectrometry (LC-MS/MS) method to quantify TND levels in the HLMs matrix. This method should be useful to calculate the intrinsic clearance (CLint) and in vitro half-life (t1/2) of TND.20 Thus, we performed in silico and practical metabolic stability studies to determine the metabolic stability of TND to provide information relative to its metabolic rate and to allow estimation of in vivo bioavailability.
Materials and Methods
Pooled HLMs (M0567, Male human liver) were purchased from Sigma-Aldrich (West Chester, PA, USA) and then stored at −70 °C until use. HLMs contain a mixture of HLMs pooled from different human donors. The protein content was labelled as 20 mg/mL (250 mM sucrose). All solvents used in the current study were HPLC grade. All drugs and other used chemicals are of analytical grade. TND (99.48%) and entrectinib (99.32%) (ENC) were procured from MedChem. Express Company (Woburn, MA, USA). Acetonitrile, ammonium formate, and formic acid were purchased from Sigma-Aldrich (West Chester, PA, USA). Water (HPLC grade quality) was prepared using Milli-Q plus purification equipment from Millipore (Millipore, Bedford, MA, USA).
TND Metabolic Vulnerability Assessment Using the WhichP450TM Module of StarDrop Software
Characterization of TND liability for metabolism was performed utilizing the WhichP450™ module of StarDrop software. The composite site lability (CSL) value was used to indicate the degree of metabolism.22–25
LC-MS/MS Methodology
LC-MS/MS chromatographic parameters were adjusted to achieve a good resolution of TND and ENC (internal standard, IS) with adequate sensitivity (Table 1). The Agilent Mass Analyzer (6410 QqQ) equipped with an electrospray ionization source (ESI) was operated in the positive mode of ionization and was utilized for ion generation. Nitrogen gas (11 L/min) was used for spray droplets evaporation and for fragmentation of ions at 55 psi in the collision cell. The flow injection analysis autosampler program was utilized to optimize the parameters of the Agilent 6410 QQQ mass spectrometer to achieve the elevated ion sensitivity. ESI positive mode for generation of ions exhibited a higher peak intensity compared to the negative mode as these compounds are basic. The capillary voltage was optimized at 4000 V to avoid parent insource fragmentation that results in decreasing peak intensity. ESI temperature was adjusted to 350°C. Agilent Mass Hunter software was utilized to manage instruments, data acquisition, and data analysis of the outcomes. TND was estimated using the multiple reactions monitoring (MRM) mode (parent to fragment ions) from 563→126 for TND (Figure 2A) and 561→302 and 561→284 for ENC (Figure 2B). The collision energy (CE) inside the collision cell was adjusted to 20 eV and 15 eV for TND and ENC, respectively, while the fragmentor voltage (FV) inside the ESI source was adjusted to 140 V and 135 V for TND and ENC, respectively. The MRM mode was used to avoid HLMs matrix-related interference and to increase the sensitivity of the developed LC-MS/MS analytical method (Figure 2).
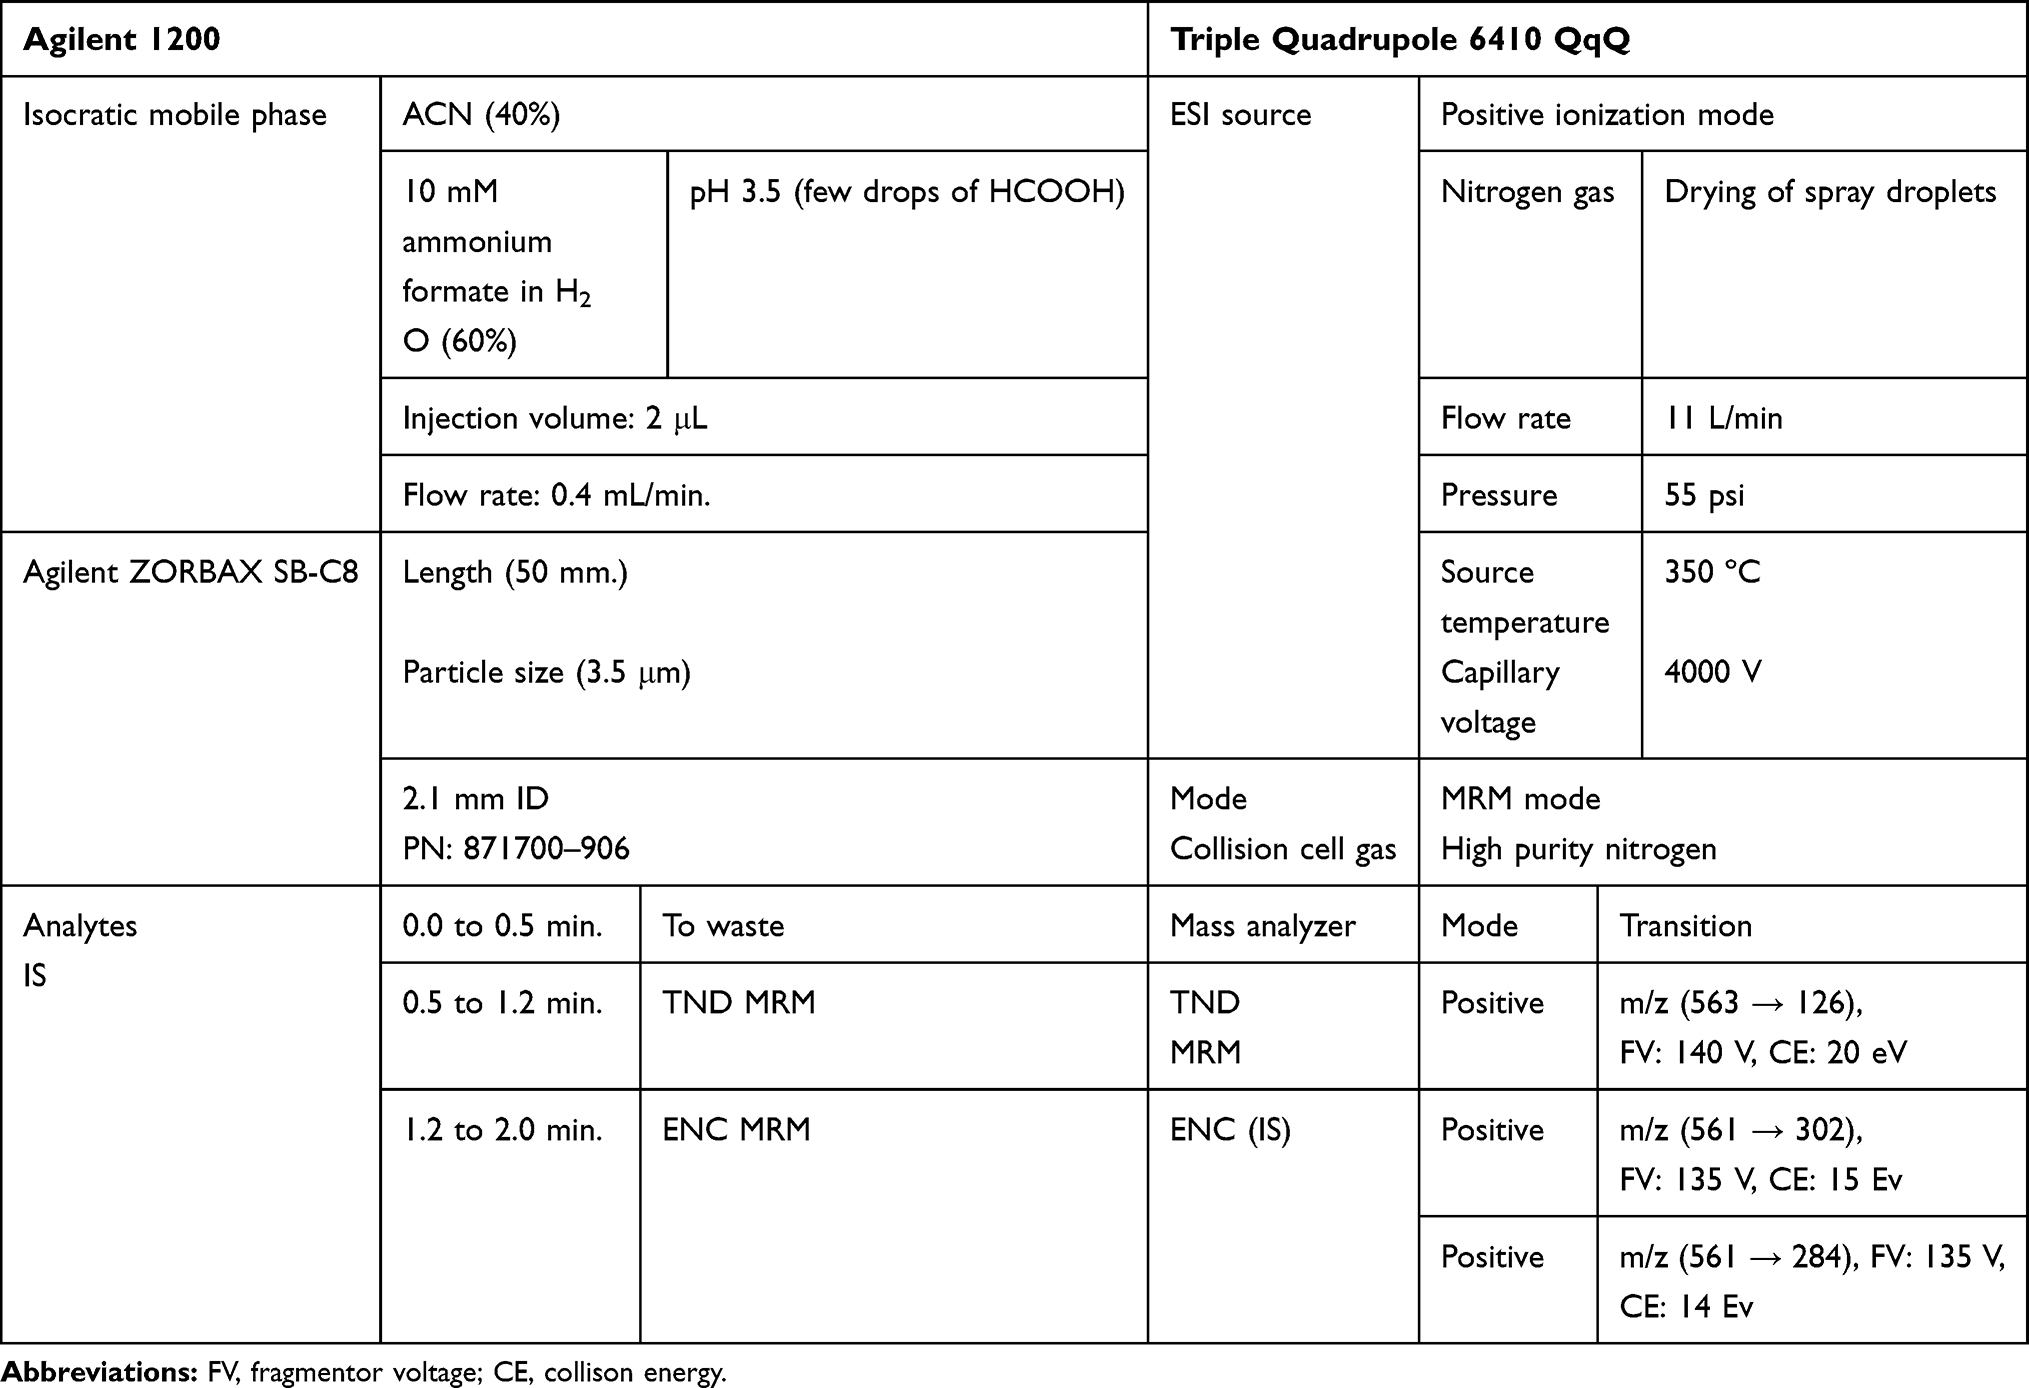 |
Table 1 Analytical Parameters |
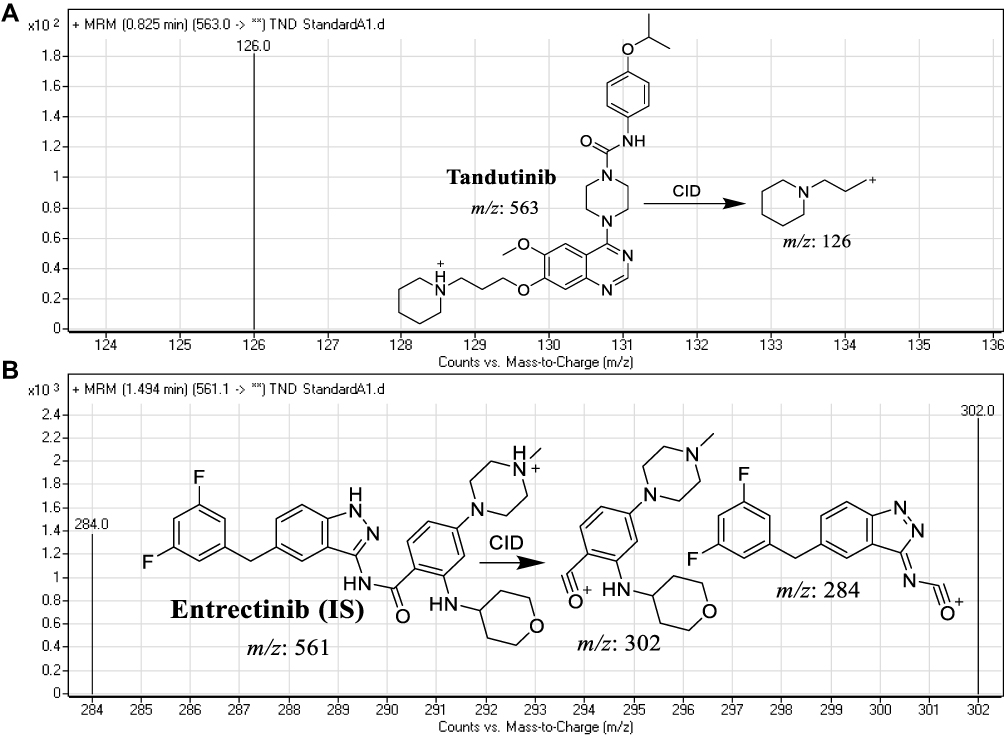 |
Figure 2 MRM mass spectra Tandutinib (TND) (A) and entrectinib (internal standard; IS) (B) presenting the proposed fragmentation pattern. |
TND Working Solutions
TND and ENC exhibited good solubility in dimethyl sulfoxide (DMSO) at concentrations of 35 mg/mL and 31 mg/mL, respectively. Stock solutions (SS) were obtained by dissolving the appropriate weight of each powder in DMSO to a concentration of 1 mg/mL. The TND working solution (WK) 1 (100 µg/mL) was prepared by ten-fold dilution of TND SS (1 mg/mL) with the mobile phase. A second dilution of WK1 for the mobile phase was prepared as WK2 (10 µg/mL). ENC WK3 (2 µg/mL) was prepared by a two-step dilution of the ENC SS (1 mg/mL) in the mobile phase.
TND Calibration Standards
The HLMs matrix was prepared by mixing the mobile phase with 30 µL HLMs (1 mg protein/phosphate buffer) after deactivation with DMSO. Calibration standards were prepared by diluting TND WK2 with the HLM matrix to generate nine calibration standards: 5, 10, 30, 50, 80, 100, 200, 300, and 500 ng/mL that were utilized for construction of the TND calibration curve. Four levels (5, 400, 150, and 15 ng/mL) were selected as quality controls for the analytical method: a lower limit of quantification (LLOQ), a high quality control (HQC), a medium quality control (MQC), and a quality control (LQC), respectively. A 50 µL volume of ENC WK3 (2 µg/mL) was added as the IS to all prepared quality controls (QC) and calibration levels. A protein precipitation extraction methodology was used for TND and ENC extraction.26–28 Precipitation of proteins was achieved by adding 2 mL of acetonitrile to standard levels and quality controls. Next, removal of precipitated undesired proteins was performed by centrifugation at 14,000 rpm for 12 min in a refrigerated centrifuge (4°C). Confirmation of the purity of the supernatant was achieved by filtration of 1 mL using a 0.22 µm syringe filter then the filtrates were transferred to 1.5 mL vials and 5 µL was injected into the LC-MS/MS system. Control samples were prepared as mentioned above without HLMs to confirm the absence of interference from matrix constituents during the elution times of the analytes. A TND calibration curve was constructed by drawing the peak area ratio of TND to ENC (y-axis) and TND exact values (x-axis). The analytical method linearity was verified by calculating the linear regression equation.
Method Validation
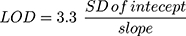
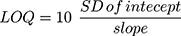
Different validation parameters for the established LC-MS/MS analytical method were calculated following the guidelines for bioanalytical method validation established by the FDA in addition to the general regulations of the International Conference on Harmonization (ICH).26,29 The validation of the developed methodology was determined using specificity, sensitivity, linearity, accuracy, precision, extraction recovery, stability, and the matrix effect. The statistical method (least squared: y = ax + b) was used to compute the equation of the calibration curve for TND. The LOD and LOQ were computed as recommended by the Pharmacopeia30 using slope of the calibration plot and the standard deviation (SD) of the intercept:
TND Metabolic Stability Estimation
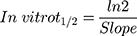
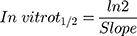
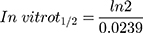
The metabolic clearance of TND including the intrinsic clearance and in vitro t1/2 were calculated by estimation of the TND level after metabolic incubation with HLMs for 50 min in the presence of cofactors. Metabolic incubations were achieved in phosphate buffer (pH 7.4) with 3.3 mM MgCl2. Briefly, 1 µM of TND was incubated with 30 µL HLMs (1 mg protein/mL phosphate buffer) at 37°C for 10 min before the addition of NADPH. To confirm outcomes, the same metabolic experiment was performed three times.31 The start of the metabolic pathways was triggered by adding NADPH (1 mM) for certain time intervals. Quenching of the metabolic sequence was performed at certain time points: 0, 2.5, 5.0, 7.5, 15, 20, 30, 40, and 50 min by adding 2 mL ice-cold ACN. The extraction and injection procedures were performed as described earlier. Analysis of data was performed using the Mass Hunter software, the TND concentration at each time point was determined, and the TND metabolic stability curve was plotted. Considering the TND level at 0 min time was 100%, the residual percentage of TND was plotted against time. From this plot, linear range points were selected to establish the curve indicating the natural logarithm of the proportion of TND remaining over time. The linear part of the slope indicated the rate constant for the TND metabolic decrease that was utilized to calculate the in vitro t1/2 calculation according to the following equation:
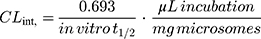
Next, the TND intrinsic clearance CLint (µL/min/mg) was computed using the following equation:32
The CLint could be classified using the average liver weights and microsomal protein concentrations reported in the literature.14,33–35
Results and Discussion
In silico TND Metabolic Liability
The definition of the metabolic landscape of TND provides an indication of the vulnerability of the molecules chemically active sites with reference to metabolism by CYP3A4 enzymes, and to better understand the formation of TND metabolites and to determine potential chemical structure modifications able to enhance metabolic stability. This reveals that at position C35, C36, C37, C38, and C39 of the piperidine ring, the methylene group at position C33 adjacent to piperidine ring, C1, C2, and C3 of the isopropoxy group are the most labile sites of metabolism while the C41 methoxy group is moderately liable. These results indicated that the piperidine ring is responsible for the metabolic instability of TND, which was in agreement with our practical experiments. The CSL exhibited in the top-left of the metabolic landscape with a value of 0.988 indicated it was a high liability area for TND metabolism; thus, the method developed herein was used to study the metabolic stability of TND (Figure 3).
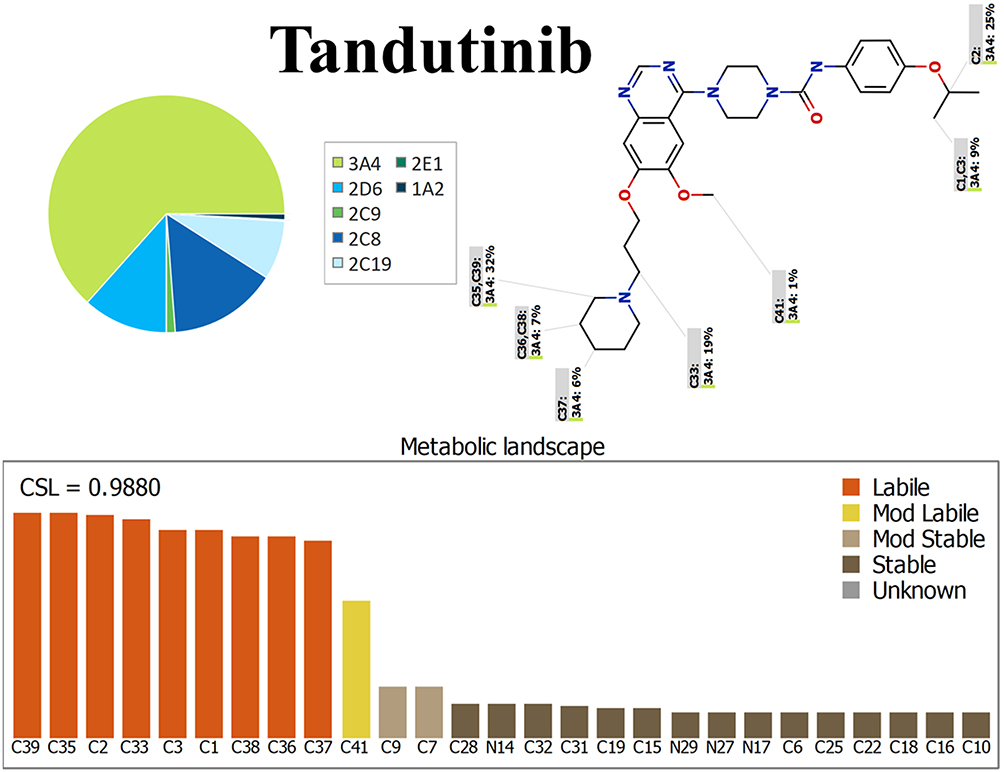 |
Figure 3 Proposed metabolic vulnerability of TND using StarDrop software (WhichP450™ module). |
The Development of the LC–MS/MS Analytical Method
ENC was chosen as the IS in the TND estimation as the protein extraction methodology could result in impurities from the HLMs matrix. TND and ENC extraction recoveries were 102.67% ± 4.17% and 98.4% ± 0.75%, respectively. The elution timepoint of the ENC elution near the TND was an indicator of good resolution. The run time was rapid (2 min). TND and ENC are both TKIs and will not be co-administered to the same patient; thus, the developed methodology could be used for pharmacokinetics or therapeutic drug monitoring for patients under TND treatment.
Parameters for the liquid chromatographic separation of TND and ENC that define the resolution of analytes, including the stationary phase nature, pH, and mobile phase composition were optimized. The pH of the 10 mM ammonium formate solution was adjusted to 3.5. Increasing pH above than this value caused a peak tailing and increased retention time. The mobile phase was composed of 60% 10 mM ammonium formate solution and 40% ACN. Increasing the ACN concentration generated overlapping peaks and a poor separation, while decreasing ACN generated an increase in the run time. Different compositions of stationary phases were tested, such as polar columns (HILIC columns), however, neither analyte (TND or ENC) was retained and the best outcomes were achieved utilizing a C8 column (L: 50 mm, PS: 3.5 μm and ID: 2.1 mm) (Figure 4).
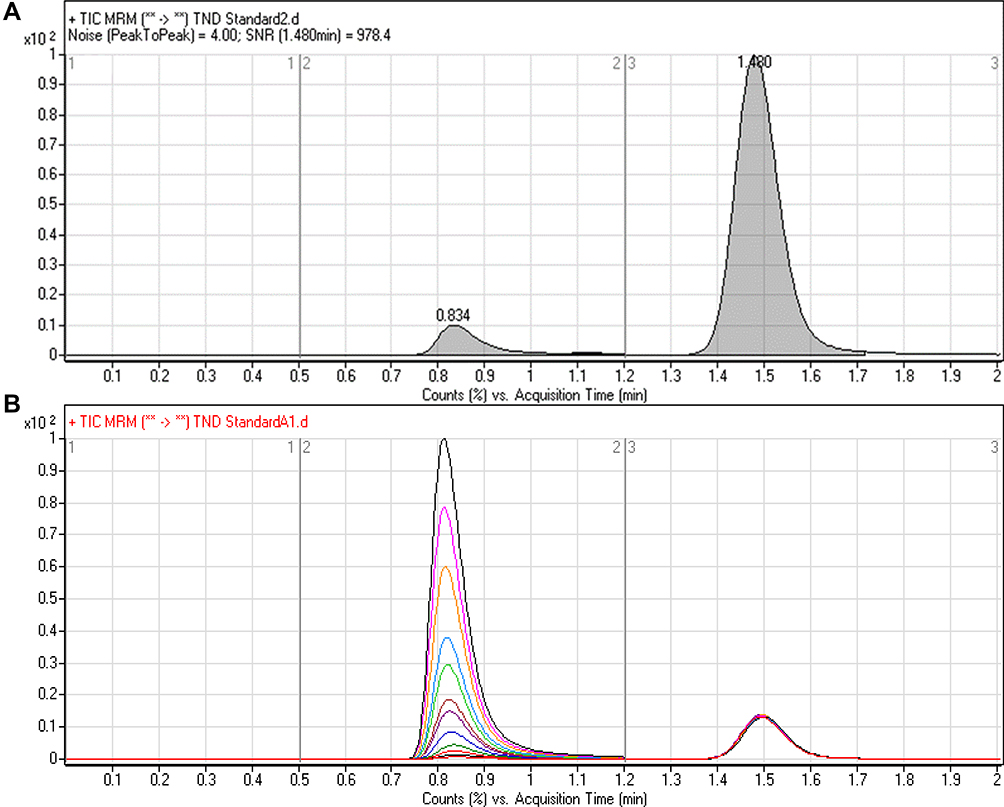 |
Figure 4 Signal-to-noise ratio (S/N) of TND LLQC (5 ng/mL) showing very good sensitivity (A) and overlayed MRM chromatograms of the TND calibration levels (B) showing the TND peak (0.82 min) and ENC peak (1.49 min). |
TND and ENC were eluted at 0.82 min and 1.49 min, respectively, with satisfactory peak resolution. The elution time for the established chromatographic method was 2 min. There was no observed carryover from the control HLMs matrix chromatograms. Figure 4B shows the TND calibration levels overlayed with the MRM chromatograms.
Validation Parameters
Specificity of the LC-MS/MS Method
Figure 4 shows the adequate separation of the TND and ENC chromatographic peaks and the absence of interference peaks in the control HLMs matrix at the analyte retention times, and reveals the specificity of the established chromatographic method. In the blank MRM total ion chromatograms, no carry-over effect of TND and ENC was observed.
Linearity and Sensitivity of the LC-MS/MS Method
The developed method showed a linear range (5–500 ng/mL) and r2 (≥0.9999) for the analytical method. The TND calibration curve regression equation was y = 1.1998x–1.768. The LLQC chromatographic peak showed a good signal-to-noise ratio and an optimized peak symmetry supporting the sensitivity of the LC-MS/MS method (Figure 4A). The RSD values for the six replicates of each calibration standard were <3.65% (Table 2). Back calculations for the 12 TND levels (calibration and QC standards) in the HLMs matrix revealed the success of the established chromatographic method. The LOD and LOQ were 1.3 ng/mL and 3.8 ng/mL, respectively.
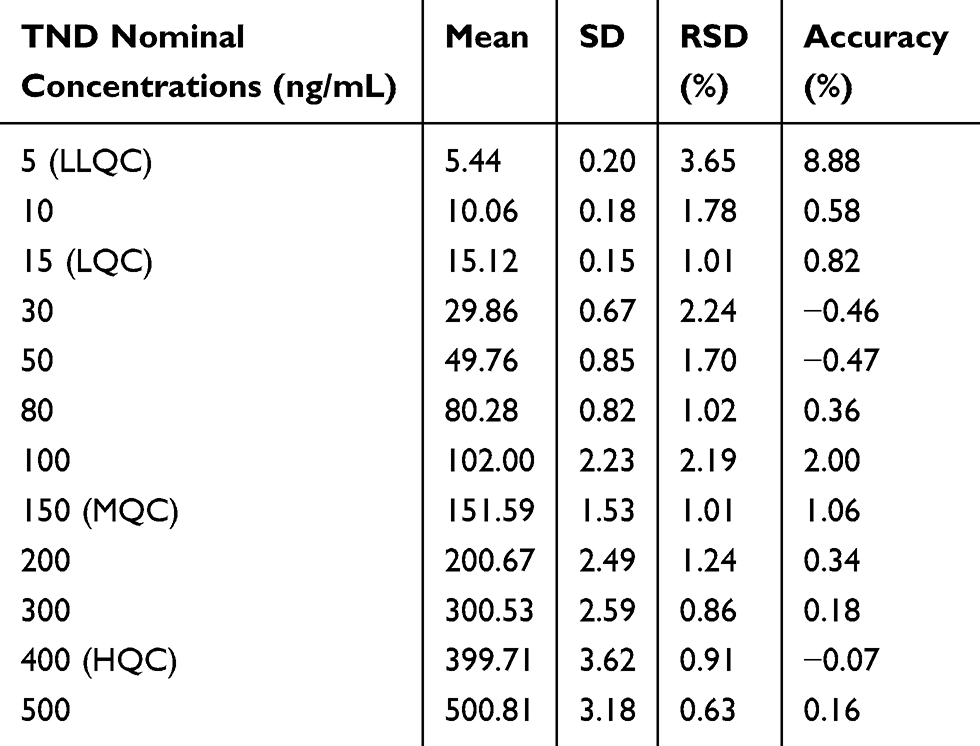 |
Table 2 TND Back-Calculation of Six Replicates of the Calibration Standards |
Accuracy and Precision of the LC-MS/MS Method
Precision and accuracy of results were in accordance with the FDA guidelines.36 The values of intraday and interday accuracy and precision of the developed method ranged −1.31 to 10.48 and 0.91 to 4.03, respectively (Table 3).
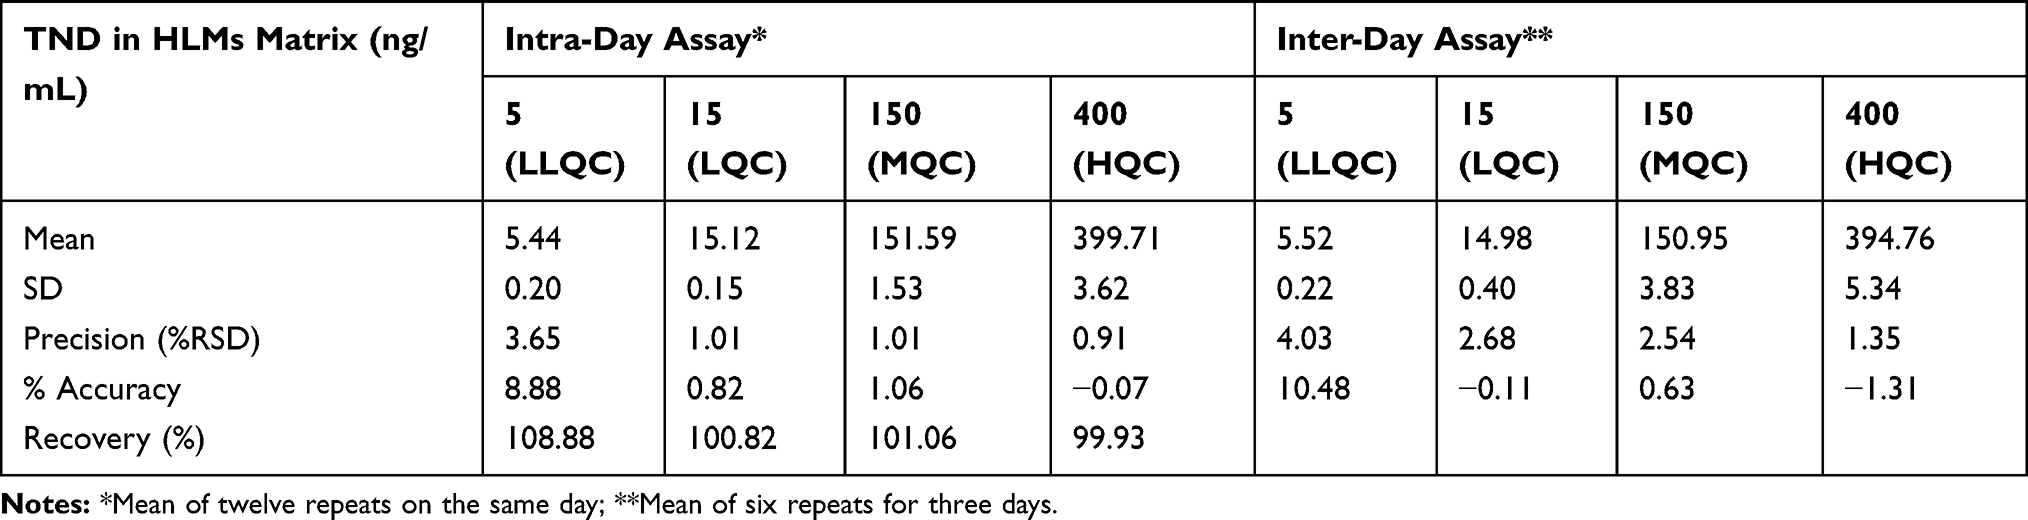 |
Table 3 Intra-Day and Inter-Day (Precision and Accuracy) of the Developed LC-MS/MS Method |
Extraction Recovery and Matrix Effects of TND
The recovery of the TND QC levels in the spiked HLMs matrix was 102.67% ± 4.17% (RSD < 4.1%) (Table 3). The ENC recovery was 98.4% ± 0.75%. The absence of a matrix effect on TND or ENC ionization was verified by running two HLMs batches (set 1 and set 2). Set 1 batches were spiked with the TND LQC (15 ng/mL) and ENC (50 ng/mL), while set 2 batches were made substituting the mobile phase for the HLMs matrix. The matrix effects (ME) for TND and ENC were calculated using the following equations:

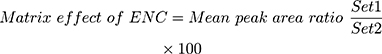
The HLMs containing TND and ENC exhibited an ME of 104.53 ± 3.87% and 101.85 ± 2.3%, respectively. The IS normalized ME was calculated using the following equation:
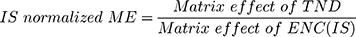
The IS normalized ME was 1.026 and was within the accepted range.37 Therefore, these results confirmed that the HLMs matrix exerted no noticeable effect on the degree of ionization of either TND or ENC.
Metabolic Stability
The TND concentration in metabolic stability experiments was adjusted to 1 µM to ensure that it was below the Michaelis–Menten constant for linearity between the ratio of metabolism versus the incubation time. HLMs (1 mg protein/mL) were used to verify the lack of non-specific protein binding. The TND concentration was calculated using the regression equation of the concurrent injected calibration curve. The metabolic stability curve of the TND was constructed by plotting the incubation time (x-axis) against the percentage remaining TND (y-axis) (Figure 5A). From the constructed curve, the concentrations that exhibited linearity (0–20 min) were selected to plot another curve of time versus natural logarithm (Ln)TND remaining (Figure 5B). The slope of the linear portion (0.02239) described the rate constant for TND metabolism. The linear curve regression equation was y = −0.0239x + 4.5469 with r2 = 0.9502, which was utilized for the computation of TND in vitro t1/2 (Table 4).19,38–40
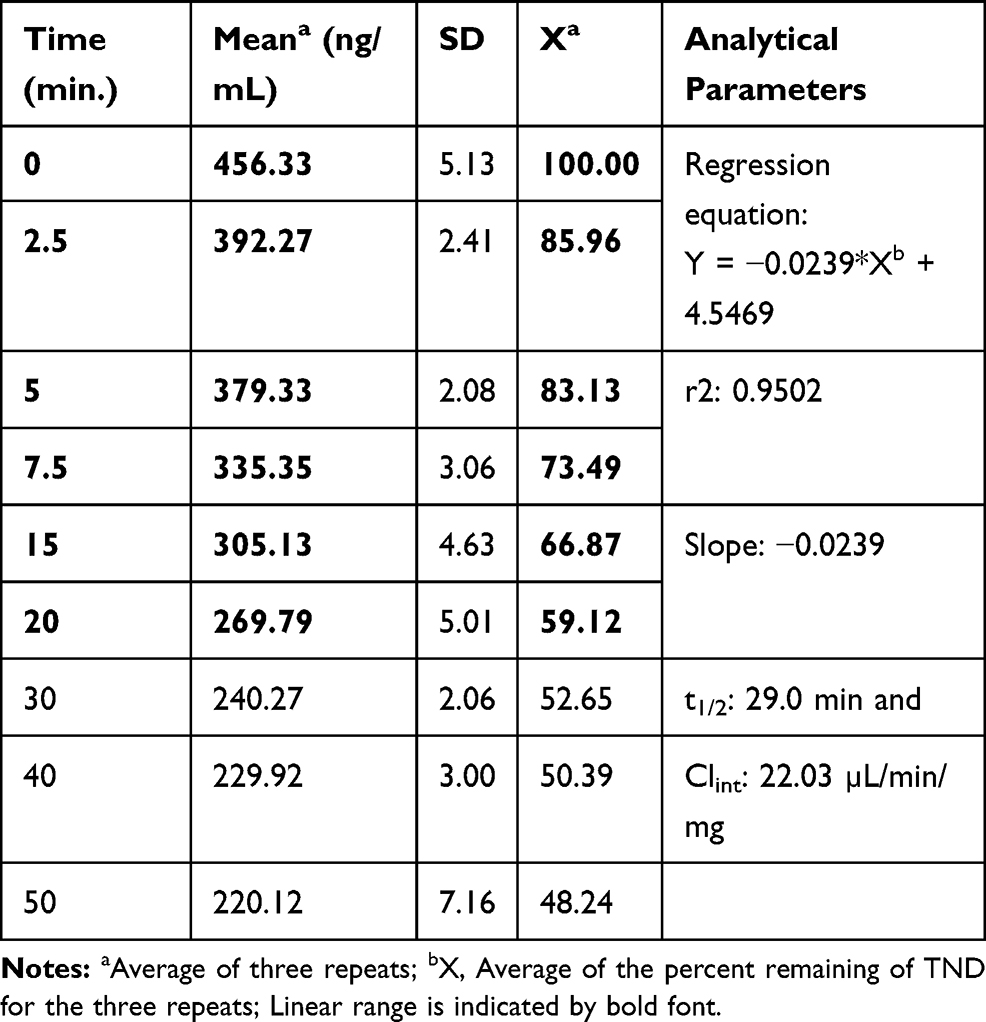 |
Table 4 TND Metabolic Stability Curve Parameters |
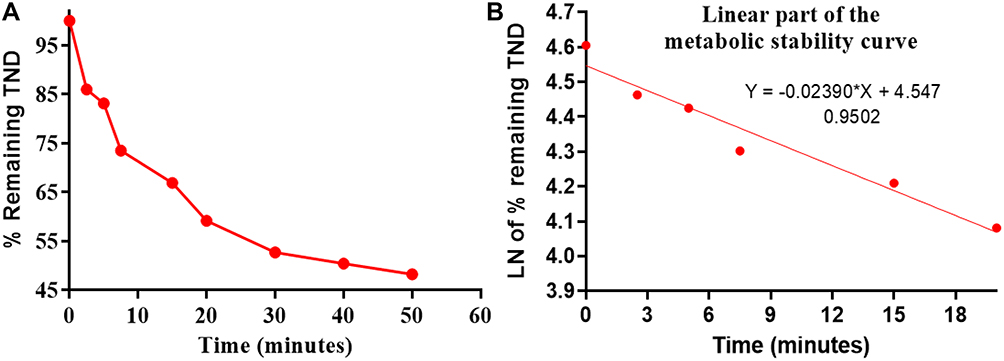 |
Figure 5 The metabolic stability curve of TND in HLMs (A) and the regression equation of the linear part of the curve (B). |
Using the following equations:
TND intrinsic clearance was calculated utilizing the in vitro t1/2 method16 as shown in the following equation:41
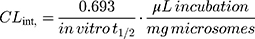
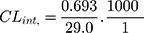

The in vitro t1/2 and Clint of TND were found to be 29.0 min and 22.03 µL/min/mg, respectively. Based on these results, it can be concluded that TND is a drug with a medium extraction ratio that shows moderate excretion from the body. This reveals a moderate possibility of accumulation inside the body and potentially good bioavailability if compared to other TKIs (eg dacomitinib). Using the simulation software Cloe PK, these results could be also used to predict the in vivo pharmacokinetics of TND.42
Conclusions
An analytical method based on LC-MS/MS was developed and validated to estimate the pharmacological activity of TND. The developed methodology showed adequate sensitivity, ecofriendliness (due to less consumption of organic solvent), accuracy, high recovery percent, and rapid execution. The method was applied to evaluate TND metabolic stability in the HLM matrix. Our results showed that TND metabolic stability exhibited an in vitro t1/2 values (29.0 min) and moderate Clint (22.03 µL·min−1·mg−1) that suggestive of a moderate rate of TND hepatic clearance, consequently an adequate in vivo bioavailability could be predicted. From these good outcomes, we propose that TND could be administered to patients without a rapid excretion or dose accumulation inside the human body. The experimental data was supported using in silico WhichP450™ module of StarDrop software. Further drug discovery studies may be performed utilizing this approach, which will allow the development of a new series of drugs having an increased safety profile and no effect on their pharmacological activity.
Ethics Approval
The study design using in vitro experiments with commercially available human liver microsomes exempts it from the need of the Ethics Committees approval.
Acknowledgments
The authors extend their appreciation to the Deputyship for Research & Innovation, “Ministry of Education“ in Saudi Arabia for funding this research work through the project number IFKSURG-1435-025.
Author Contributions
All authors made substantial contributions to the conception and design, acquisition of data, or analysis and interpretation of the data; took part in drafting the article or revising it critically for important intellectual content; agreed to submit to the current journal; gave final approval of the version to be published; and agreed to be accountable for all aspects of the work.
Disclosure
The authors declare no competing interests.
References
1. Natoli C, Perrucci B, Perrotti F, Falchi L, Iacobelli S. Tyrosine kinase inhibitors. Curr Cancer Drug Targets. 2010;10:462–483. doi:10.2174/156800910791517208
2. Lemmon MA, Schlessinger J. Cell signaling by receptor tyrosine kinases. Cell. 2010;141:1117–1134. doi:10.1016/j.cell.2010.06.011
3. Özvegy-Laczka C, Cserepes J, Elkind NB, Sarkadi B. Tyrosine kinase inhibitor resistance in cancer: role of ABC multidrug transporters. Drug Resist Updat. 2005;8:15–26. doi:10.1016/j.drup.2005.02.002
4. Steeghs N, Nortier JW, Gelderblom H. Small molecule tyrosine kinase inhibitors in the treatment of solid tumors: an update of recent developments. Ann Surg Oncol. 2007;14:942–953.
5. Im A, Sehgal A, Carroll M, et al. DNMT3A and IDH mutations in acute myeloid leukemia and other myeloid malignancies: associations with prognosis and potential treatment strategies. Leukemia. 2014;28:1774–1783. doi:10.1038/leu.2014.124
6. Garcia JS, Stone RM. The development of FLT3 inhibitors in acute myeloid leukemia. Hematol Oncol Clin. 2017;31:663–680. doi:10.1016/j.hoc.2017.03.002
7. Cheng Y, Paz K. Tandutinib, an oral, small-molecule inhibitor of FLT3 for the treatment of AML and other cancer indications. IDrugs. 2008;11:46–56.
8. Schittenhelm MM, Kampa KM, Yee KW, Heinrich MC. The FLT3 inhibitor tandutinib (formerly MLN518) has sequence-independent synergistic effects with cytarabine and daunorubicin. Cell Cycle. 2009;8:2621–2630. doi:10.4161/cc.8.16.9355
9. Haque A, Banik NL, Ray SK. Progress in Molecular Biology and Translational Science. Elsevier; 2011:187–234.
10. Odia Y, Sul J, Shih JH, et al. A phase II trial of tandutinib (MLN 518) in combination with bevacizumab for patients with recurrent glioblastoma. CNS Oncol. 2016;5:59–67. doi:10.2217/cns-2015-0010
11. Yuan T, Qi B, Jiang Z, et al. Dual FLT3 inhibitors: against the drug resistance of acute myeloid leukemia in recent decade. Eur J Med Chem. 2019;178:468–483. doi:10.1016/j.ejmech.2019.06.002
12. Rowland M, Benet LZ, Graham GG. Clearance concepts in pharmacokinetics. J Pharmacokinet Biopharm. 1973;1:123–136. doi:10.1007/bf01059626
13. Wilkinson GR, Shand DG. Commentary: a physiological approach to hepatic drug clearance. Clin Pharmacol Ther. 1975;18:377–390. doi:10.1002/cpt1975184377
14. Houston JB. Utility of in vitro drug metabolism data in predicting in vivo metabolic clearance. Biochem Pharmacol. 1994;47:1469–1479. doi:10.1016/0006-2952(94)90520-7
15. Obach RS, Baxter JG, Liston TE, et al. The prediction of human pharmacokinetic parameters from preclinical and in vitro metabolism data. J Pharmacol Exp Ther. 1997;283:46–58.
16. Baranczewski P, Stańczak A, Sundberg K, et al. Introduction to in vitro estimation of metabolic stability and drug interactions of new chemical entities in drug discovery and development. Pharmacol Rep. 2006;58:453–472.
17. Darwish HW, Attwa MW, Kadi AA. Rapid validated liquid chromatographic method coupled with Tandem mass spectrometry for quantification of nintedanib in human plasma. Trop J Pharm Res. 2016;15:2467–2473. doi:10.4314/tjpr.v15i11.23
18. Darwish HW, Kadi AA, Attwa MW, Almutairi HS. Investigation of metabolic stability of the novel ALK inhibitor brigatinib by liquid chromatography tandem mass spectrometry. Clinica Chimica Acta. 2018;480:180–185. doi:10.1016/j.cca.2018.02.016
19. Attwa MW, Kadi AA, Darwish HW, Amer SM, Alrabiah H. A reliable and stable method for the determination of foretinib in human plasma by LC-MS/MS: application to metabolic stability investigation and excretion rate. Eur J Mass Spectrom. 2018;24:344–351. doi:10.1177/1469066718768327
20. Amer SM, Kadi AA, Darwish HW, Attwa MW. Liquid chromatography tandem mass spectrometry method for the quantification of vandetanib in human plasma and rat liver microsomes matrices: metabolic stability investigation. Chem Cent J. 2017;11:45. doi:10.1186/s13065-017-0274-4
21. J Yang J, N Milton M, Yu S, et al. P-glycoprotein and breast cancer resistance protein affect disposition of tandutinib, a tyrosine kinase inhibitor. Drug Metab Lett. 2010;4:202–212. doi:10.2174/187231210792928279
22. Tyzack JD, Kirchmair J. Computational methods and tools to predict cytochrome P450 metabolism for drug discovery. Chem Biol Drug Des. 2019;93:377–386. doi:10.1111/cbdd.13445
23. Attwa MW, Kadi AA, Abdelhameed AS, Alhazmi HA. Metabolic stability assessment of new PARP inhibitor talazoparib using validated LC–MS/MS methodology: in silico metabolic vulnerability and toxicity studies. Drug Des Devel Ther. 2020;14:783. doi:10.2147/DDDT.S239458
24. Attwa MW, Kadi AA, Abdelhameed AS. Phase I metabolic profiling and unexpected reactive metabolites in human liver microsome incubations of X-376 using LC-MS/MS: bioactivation pathway elucidation and in silico toxicity studies of its metabolites. RSC Adv. 2020;10:5412–5427. doi:10.1039/C9RA09115G
25. Alsubi TA, Attwa MW, Bakheit AH, Darwish HW, Abuelizz HA, Kadi AA. In silico and in vitro metabolism of ribociclib: a mass spectrometric approach to bioactivation pathway elucidation and metabolite profiling. RSC Adv. 2020;10:22668–22683. doi:10.1039/D0RA01624A
26. Kadi AA, Abdelhameed AS, Darwish HW, Attwa MW, Al‐Shakliah NS. A highly efficient and sensitive LC‐MS/MS method for the determination of afatinib in human plasma: application to a metabolic stability study. Biomed Chromatogr. 2016;30:1248–1255. doi:10.1002/bmc.3674
27. Attwa MW, Kadi AA, Abdelhameed AS. Reactive intermediates and bioactivation pathways characterization of avitinib by LC–MS/MS: in vitro metabolic investigation. J Pharm Biomed Anal. 2019;164:659–667. doi:10.1016/j.jpba.2018.11.033
28. Attwa MW, Kadi AA, Darwish HW, Amer SM, Al-Shakliah NS. Identification and characterization of in vivo, in vitro and reactive metabolites of vandetanib using LC-ESI-MS/MS. Chem Cent J. 2018;12:99. doi:10.1186/s13065-018-0467-5
29. Abdelhameed AS, Attwa MW, Kadi AA. An LC–MS/MS method for rapid and sensitive high‐throughput simultaneous determination of various protein kinase inhibitors in human plasma. Biomed Chromatogr. 2017;31:e3793. doi:10.1002/bmc.3793
30. AlRabiah H, Kadi AA, Aljohar HI, et al. A new validated HPLC-MS/MS method for quantification and pharmacokinetic evaluation of dovitinib, a multi-kinase inhibitor, in mouse plasma. Drug Des Devel Ther. 2020;14:407–415. doi:10.2147/DDDT.S223573
31. Attwa MW, Kadi AA, Abdelhameed AS. Detection and characterization of olmutinib reactive metabolites by LC–MS/MS: elucidation of bioactivation pathways. J Sep Sci. 2020;43:708–718. doi:10.1002/jssc.201900818
32. Attwa MW, Darwish HW, Alhazmi HA, Kadi AA. Investigation of metabolic degradation of new ALK inhibitor: entrectinib by LC-MS/MS. Clinica Chimica Acta. 2018;485:298–304. doi:10.1016/j.cca.2018.07.009
33. Davies B, Morris T. Physiological parameters in laboratory animals and humans. Pharm Res. 1993;10:1093–1095. doi:10.1023/a:1018943613122
34. Barter ZE, Bayliss MK, Beaune PH, et al. Scaling factors for the extrapolation of in vivo metabolic drug clearance from in vitro data: reaching a consensus on values of human microsomal protein and hepatocellularity per gram of liver. Curr Drug Metab. 2007;8:33–45. doi:10.2174/138920007779315053
35. Iwatsubo T, Suzuki H, Sugiyama Y. Prediction of species differences (rats, dogs, humans) in the in vivo metabolic clearance of YM796 by the liver from in vitro data. J Pharmacol Exp Ther. 1997;283:462–469.
36. Health, U. D. o, Services, H. Bioanalytical method validation, guidance for industry. 2001. Available from: http://www. fda. gov./cder/guidance/4252fnl. htm.
37. Kadian N, Raju KSR, Rashid M, Malik MY, Taneja I, Wahajuddin M. Comparative assessment of bioanalytical method validation guidelines for pharmaceutical industry. J Pharm Biomed Anal. 2016;126:83–97. doi:10.1016/j.jpba.2016.03.052
38. Scott WJ, Hentemann MF, Rowley RB, et al. Discovery and SAR of novel 2,3-dihydroimidazo[1,2-c]quinazoline PI3K inhibitors: identification of copanlisib (BAY 80-6946). ChemMedChem. 2016;11:1517–1530. doi:10.1002/cmdc.201600148
39. Attwa MW, Kadi AA, Darwish HW, Abdelhameed AS. Investigation of the metabolic stability of olmutinib by validated LC-MS/MS: quantification in human plasma. RSC Adv. 2018;8:40387–40394. doi:10.1039/C8RA08161A
40. Kadi AA, Darwish HW, Attwa MW, Amer SM. Validated LC-MS/MS method for the quantification of ponatinib in Plasma: application to metabolic stability. PLoS One. 2016;11:e0164967. doi:10.1371/journal.pone.0164967
41. Dammacco F, Silvestris F, editors. Oncogenomics. Academic Press; 2019:477–486.
42. Leahy DE. Integrating in vitro ADMET data through generic physiologically based pharmacokinetic models. Expert Opin Drug Metab Toxicol. 2006;2:619–628. doi:10.1517/17425255.2.4.619
 © 2020 The Author(s). This work is published and licensed by Dove Medical Press Limited. The full terms of this license are available at https://www.dovepress.com/terms.php and incorporate the Creative Commons Attribution - Non Commercial (unported, v3.0) License.
By accessing the work you hereby accept the Terms. Non-commercial uses of the work are permitted without any further permission from Dove Medical Press Limited, provided the work is properly attributed. For permission for commercial use of this work, please see paragraphs 4.2 and 5 of our Terms.
© 2020 The Author(s). This work is published and licensed by Dove Medical Press Limited. The full terms of this license are available at https://www.dovepress.com/terms.php and incorporate the Creative Commons Attribution - Non Commercial (unported, v3.0) License.
By accessing the work you hereby accept the Terms. Non-commercial uses of the work are permitted without any further permission from Dove Medical Press Limited, provided the work is properly attributed. For permission for commercial use of this work, please see paragraphs 4.2 and 5 of our Terms.