")
Back to Journals » International Journal of Chronic Obstructive Pulmonary Disease » Volume 18
Knockdown of GNL3L Alleviates the Progression of COPD Through Inhibiting the ATM/p53 Pathway
Authors Cai Q, Chen S, Zhu Y, Li Z
Received 19 July 2023
Accepted for publication 27 October 2023
Published 18 November 2023 Volume 2023:18 Pages 2645—2659
DOI https://doi.org/10.2147/COPD.S424431
Checked for plagiarism Yes
Review by Single anonymous peer review
Peer reviewer comments 2
Editor who approved publication: Dr Richard Russell
Qian Cai,1 Sirui Chen,2 Yingqun Zhu,1 Zhe Li1
1Department of Respiratory and Critical Care Medicine, The Third Hospital of Changsha, Changsha City, Hunan Province, 410015, People’s Republic of China; 2Department of Emergency Medicine, The Third Hospital of Changsha, Changsha City, Hunan Province, 410015, People’s Republic of China
Correspondence: Sirui Chen, Department of Emergency Medicine, The Third Hospital of Changsha, No. 176, Laodong West Road, Tianxin District, Changsha City, Hunan Province, 410015, People’s Republic of China, Tel +86-0731-85171616, Email [email protected]
Background: Chronic obstructive pulmonary disease (COPD) is a persistent chronic bronchitis disease, and its potential biomarkers have not been fully expounded. This study aims to explore the role of Guanine nucleotide binding protein like-3-like (GNL3L) in COPD induced by cigarette smoking (CS) in vivo.
Methods: Two microarray datasets of COPD were selected to screen differentially expressed genes (DEGs). A protein–protein interaction network was constructed to find hub genes. The COPD model was conducted using CS/LPS-induced mouse and cigarette smoke extract induced human bronchial epithelial cells. The pathological changes of lung tissue in mice were observed by hematoxylin–eosin staining and mean linear intercept. Cell viability was measured by CCK8 assay. Oxidative stress-related indicators, inflammatory factors, and ATM/p53 related-proteins were assessed using ELISA and Western blot.
Results: In this study, there were 110 common DEGs identified from the two datasets (GSE5058 and GSE38974). The key gene GNL3L was the optimal indicator to distinguish between samples with COPD and healthy controls. Through the in vivo and in vitro experiments, GNL3L knockdown significantly improved the pathological features of CS/LPS-induced COPD mice, promoted cell viability, inhibited inflammation (IL-1β, IL-8, and TNF-α), oxidative stress (MDA, SOD, and CAT), and ATM/p53 related-proteins (ATM, p53, and p21).
Conclusion: GNL3L is a novel biomarker of COPD, and knockdown of GNL3L participates in the progression of COPD by inhibiting ATM/p53 pathway.
Keywords: COPD, ATM/p53 pathway, hub genes, GNL3L
Introduction
Chronic obstructive pulmonary disease (COPD) is a common chronic bronchitis disease characterized by persistent airflow limitation, which can be prevented and treated. COPD is the third leading cause of death in the world reported in 2020.1 With the progression of the disease, COPD will lead to respiratory failure, pulmonary hypertension, pulmonary heart disease, resulting in repeated aggravation of the disease, and even affect the living quality and life expectancy of patients.2 Therefore, exploring the mechanism of the occurrence and progression of COPD is helpful for the prevention and treatment of the disease.
Guanine nucleotide binding protein like-3-like (GNL3L) is a nuclear-cytoplasmic shuttle protein that is of vital importance in controlling the cell cycle during cell proliferation.3 It is reported that GNL3L promotes tumorigenesis through NF-κB activation in colorectal cancer.4 In addition, GNL3L has been found to be highly expressed in esophageal cancer, renal cancer, and colorectal cancer3,5,6 and can take effect in tumorigenesis and progression by regulating NF-κB signaling.6 At present, the studies on GNL3L are almost focused on cancer, and the role of GNL3L in regulation of respiratory diseases is still unknown.
Ataxia Telangiectasia Mutated Protein (ATM), a number of the kinase family, is a crucial regulator of multiple signaling cascades. It regulates its downstream targets including Chk1, Chk2, tumor suppressors such as p53, BRCA, and other signaling molecules by phosphorylation.7 p53 protein is a transcription factor that regulates multiple pathways, such as cell cycle arrest, apoptosis, autophagy, metabolism, and DNA repair.8 In patients with COPD, large amounts of free radicals are generated by cigarette smoking, which cause oxidative stress, thereby ATM-regulated p53 pathway is activated, inhibiting cell cycle and inducing apoptosis.9 Studies have found that p53 is pivotal in the prevention of emphysema and is associated with acute lung injury (ALI), COPD, pulmonary hypertension, and other respiratory diseases.10 p53 attenuates ALI by negatively regulating LPS-induced NF-κB activity.11 In fibrotic lung disease, serpine 1 can mediate alveolar type II cell senescence by regulating p53 and p53-p21-Rb pathway.12 Until now, the study of GNL3L regulating ATM/p53 in COPD has not been reported.
Therefore, in this study, bioinformatics analysis and experiments were performed to explore the role of GNL3L in the progression of COPD in vivo and in vitro by activating the ATM/p53 pathway. The results showed that GNL3L was significantly up-regulated in the COPD group compared with control group. Knocking down GNL3L also inhibited the expression of ATM/p53 pathway protein and reduced inflammation and oxidative stress in mice. Briefly, this paper identified the potential mechanism of GNL3L in the progression of COPD through ATM/p53 pathway, and GNL3L can be used as a biomarker of COPD, providing potential value for the prevention and treatment of COPD in the future.
Materials and Methods
Source of Microarray Data and Analysis of Differentially Expressed Genes (DEGs)
In this study, the gene expression profiles were downloaded from the National Center for Biotechnology Information (NCBI) Gene Expression Omnibus (GEO) database (https://www.ncbi.nlm.nih.gov/geo/). Two microarray data sets (GSE5058 and GSE38974) related to COPD were obtained from the database. The GEO2R tool (www.ncbi.nlm.nih.gov/geo/geo2r) was used to analyze the data sets. DEGs were identified in the GSE5058 data set based on p≤0.05 and |logFC|≥3, and in the GSE38974 data set based on p≤0.05 and |logFC|≥1. The identified DEGs were visualized using heat maps and volcano plots, and the data set samples were standardized and corrected using boxplots. Volcano plots were generated using fold change and adjusted p-values, while boxplots were generated using the ggplot2 package in R. The expression heat maps were displayed using the pheatmap package in R. The Venn diagram tool was used to generate a Venn diagram of DEGs between the two data sets.
Functional Enrichment Analysis
Gene Ontology (GO) and Kyoto Encyclopedia of Genes and Genomes (KEGG) analysis were performed on the selected overlapping DEGs using the bioinformatics database DAVID (https://david.ncifcrf.gov/summary.jsp). The GO enrichment analysis was classified according to the molecular function MF, biological process BP and cell component CC, and significance was defined as p<0.05. The KEGG Pathway with p-value < 0.05 was screened, and the top 10 pathways with the most significant enrichment were drawn for visualization. The results were visualized and integrated using the bioinformatics website (http://www.bioinformatics.com.cn/login/) to generate GO and KEGG enrichment plots.
Establishment of Protein–Protein Interaction (PPI) Network and Identification of Hub Genes
PPI analysis was conducted to predict the interaction relationships between genes encoding proteins to filter out hub genes. The analysis was constructed using the STRING online database (https://cn.string-db.org/) with interaction score >0.4. Subsequently, the network was constructed and visualized by the Cytoscape software (http://www.cytoscape.org/). MCODE was applied to identify key modules from the PPI network of DEGs. The Cytoscape plugin CytoHubba Version 0.1 was exploited to calculate the degree of each protein node and filter out hub genes based on connectivity.
Analysis of Hub Genes
Based on the expression of hub genes in the original sample data, a ridgeline plot was drawn using the R language. Principal component analysis (PCA) was performed using the expression levels of hub genes as variables, and after R language function processing, two principal component variables PC1 and PC2 were obtained. The receiver operating characteristic (ROC) curve was drawn by gene expression profile interaction analysis (http://gepia.cancer-pku.cn/), and the diagnostic accuracy of the selected genes was evaluated by the corresponding area under the ROC curve (AUC). In addition, the matrix heat map was drawn to visualize the correlation of genes.
Real-Time Fluorescence Quantitative PCR (RT-qPCR)
TRIZOL (Invitrogen Corporation, USA) method was performed to extract total RNA from mouse lung tissue. cDNA synthesis was carried out using the Hiscript II QRT Supermix for qPCR reverse transcription kit from Novogene (Beijing, China). RT-qPCR was performed using an ABI 7500 quantitative PCR instrument (Applied Biosystems, Inc., USA). The reaction conditions were as follows: pre-denaturation at 95°C for 30s, followed by 40 cycles of denaturation at 95°C for 10s and annealing at 60°C for 30s. GAPDH was chosen as the internal control. The obtained Ct values were analyzed using the 2−ΔΔCt method. The primer sequences are listed in Table S1.
Animal Models of COPD
Male BABL/C mice (6–8 weeks old, weight 20–22g) were purchased from SPF Biotechnology (Beijing, China). The animals were housed in a 12-hour light/12-hour dark cycle, at a temperature of 18–22°C and a humidity of 50–60%, and allowed to acclimate for 1 week prior to the start of the experiment. The mice were randomly divided into four groups (n=6/group): (1) Control group (normal control); (2) COPD group (exposed to cigarette smoke, CS, and intranasally administered with lipopolysaccharide (LPS)); (3) LV-NC group (injected with lentivirus encoding negative control shRNA and exposed to CS and LPS treatment); (4) LV-GNL3L group (injected with lentivirus encoding GNL3L shRNA and exposed to CS and LPS treatment). The lentiviral particles encoding GNL3L shRNA or negative control shRNA (1.0×10⁹ TU, 50 μL) were subcutaneously injected into the shaved dorsal skin of the mice to establish the GNL3L knockdown mouse model.
Two weeks after injection, on the first day of inducing the COPD model, 2 μL of 5 mg/mL LPS solution was intranasally instilled into the mice in the last three groups to stimulate infection, followed by continuous cigarette induction for 1 month. The cigarette induction procedure was as follows: CS was generated from Double happiness (China, 12 mg of tar). The mice were exposed to CS with ten cigarettes (one puff/min, 35 mL puff volume over 2s, every 60s) per day using a CS generator, followed by placing the mice in the box for half an hour. It was done continuously for 6–8 weeks. On the last day of modeling, an additional 2 μL of 5 mg/mL LPS solution was instilled intranasally to increase infection. The mice were sacrificed after 48 hours for the final CS exposure. Lung edema was assessed by the Wet/Dry (W/D) weight ratio method.
Hematoxylin-Eosin Staining (HE Staining)
The pathological changes of lung tissue in mice were observed. The procedures were as follows: Lung tissues were collected and fixed in 4% paraformaldehyde solution, and then the tissues were dehydrated with ethanol, embedded in paraffin, sliced, stained with hematoxylin and eosin, and finally sealed. The staining results were observed under an optical microscope. As described above, scores ranged from 0 (none) to 4 (severe) for histological changes, including inflammatory cell infiltration and epithelial thickness changes (Table S2). Meanwhile, the mean linear intercept (MLI) was determined.
Cell Culture and Treatment
Human bronchial epithelial (HBE) cells were obtained from American Type Culture Collection (ATCC, USA) and cultured in RPMI-1640 medium containing 10% FBS at 37°C, 5% CO2. HBE cells were treated with cigarette smoke extract (CSE) for 3 days to conduct COPD cell model. The cells were divided into Control, CSE, CSE+ LV-NC, and CSE+LV-GNL3L for following experiments.
Cell Counting Kit-8 (CCK8) Assay
CCK8 kit (Solarbio, Beijing, China) was applied to measure cell viability. Briefly, the HBE cells (2 × 10⁴/well) were seeded into a 96-well plate and cultured for 24, 48, and 72 h, respectively. Cells were incubated with CCK8 reagent for 2 h, and then the OD value was measured at 450 nm by a microplate reader.
Enzyme Linked Immunosorbent Assay (ELISA)
ELISA kits from Esebio Co., Ltd (Shanghai, China) were performed to measure levels of the inflammatory cytokines IL-1β, IL-8, and TNF-α, as well as oxidative stress indicators malondialdehyde (MDA), superoxide dismutase (SOD), and catalase (CAT). The sample concentration was calculated using the equation generated by the standard curve.
Western Blot Analysis
The protein expression levels of ATM, p53 and p21 in each group were detected by Western blot, and β-actin was used as the internal control. Sodium dodecyl sulfate polyacrylamide gel electrophoresis was performed to separate proteins in each sample, and then proteins were transferred to PVDF membrane. The membrane was blocked with 5% skim milk-TBST and oscillated at room temperature for 2 h. Later, PVDF membrane was incubated all night with anti-ATM (ab199726, 1:2000), anti-p53 (ab32049, 1:2000), anti-p21 (ab109199, 1:1000) diluted with TBST at 4°C. Subsequently, secondary antibodies diluted with TBST were added and incubated at room temperature for 1 h, and the membrane was washed again. The PVDF membrane added with ECL solution was exposed by a Tanon 5200 chemiluminescence imaging system.
Statistical Analysis
All data were processed using GraphPad Prism 7.0 statistical software. Data are presented as either multiple sets of replicate data or means ± SD. One-way ANOVA or two-way ANOVA was utilized for comparison between multiple groups, and Tukey’s multiple comparisons test was used for pairwise comparison after ANOVA analysis. t-test was used for comparison between the two groups, and the difference was considered statistically significant at p<0.05.
Results
Selection of DEGs
By bioinformatics, GSE5058 contains 39 samples, including 12 normal non-smokers, 12 phenotypically normal smokers, 9 early-stage COPD patients, and 6 COPD patients, with 1284 DEGs were identified. GSE38974 contains 32 tissue samples, including 9 normal lung tissue samples and 23 COPD tissue samples, with 937 DEGs were identified. The GEO2R analysis corrected the data for 12 samples in GSE5058 and 32 samples in GSE38974. Additionally, the volcano plots of the two gene datasets showed significant up-regulation and down-regulation of genes in the COPD group compared to the control group (Figure 1A and B). By taking the intersection of DEGs in the two datasets, 110 common genes were selected (Figure 1C) and were used as the focus of the subsequent research. The expressions of 110 common DEGs in the two datasets were listed (Tables S3 and S4) and drawn by heatmaps (Figure S1).
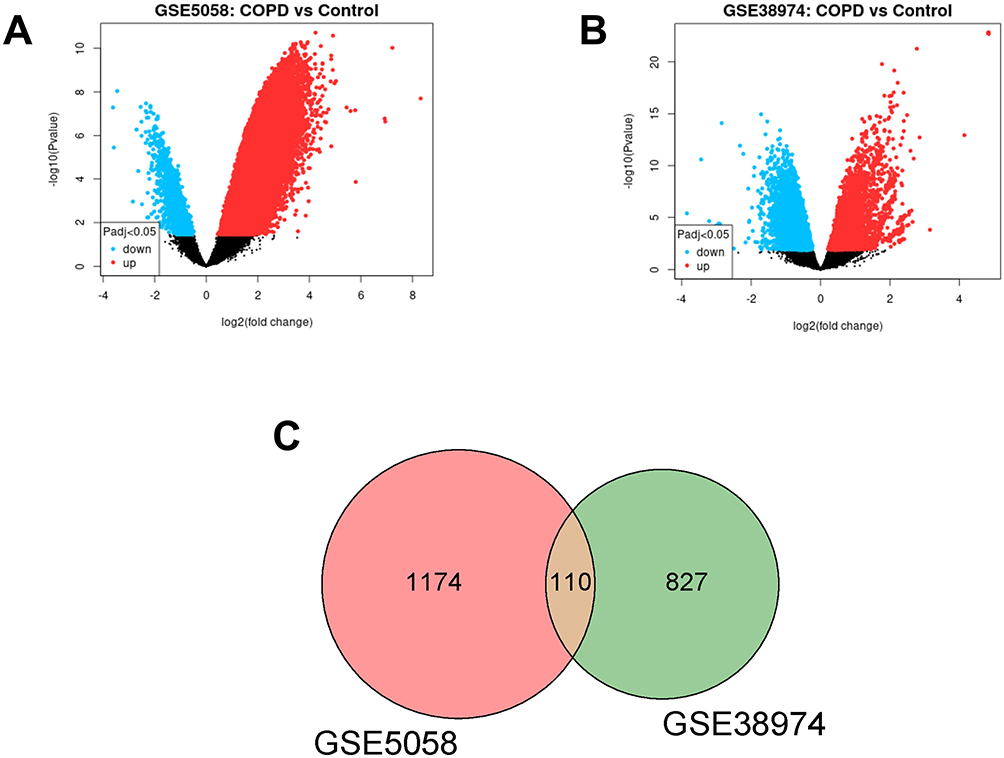 |
Figure 1 (A and B) Volcano plot of differentially expressed genes (DEGs) from dataset GSE5058 and GSE38974. The abscissa is log2(fold change) and the ordinate is -log10(p-value). Red dots represent up-regulated genes in this group, blue dots represent down-regulated genes in this group, and black dots represent non-significant DEGs. (C) Venn diagram of DEGs. The sum of the numbers in each circle represents the total number of differential genes in the comparison group, and the overlapping part of the circle represents the common differential genes between the two comparison groups. |
GO and KEGG Enrichment Analysis of DEGs
DEGs obtained by intersecting the above screened data sets were subjected to GO and KEGG enrichment analysis. The top six enriched GO terms with the smallest p-value for each GO category were selected for display (Figure 2A and B). The results showed that the functions of DEGs were mainly enriched in biological processes (BP) including the intrinsic apoptotic signaling pathway in response to DNA damage, in cellular components (CC) including platelet alpha granule lumen and secretory granule, and in molecular functions (MF) including receptor binding.
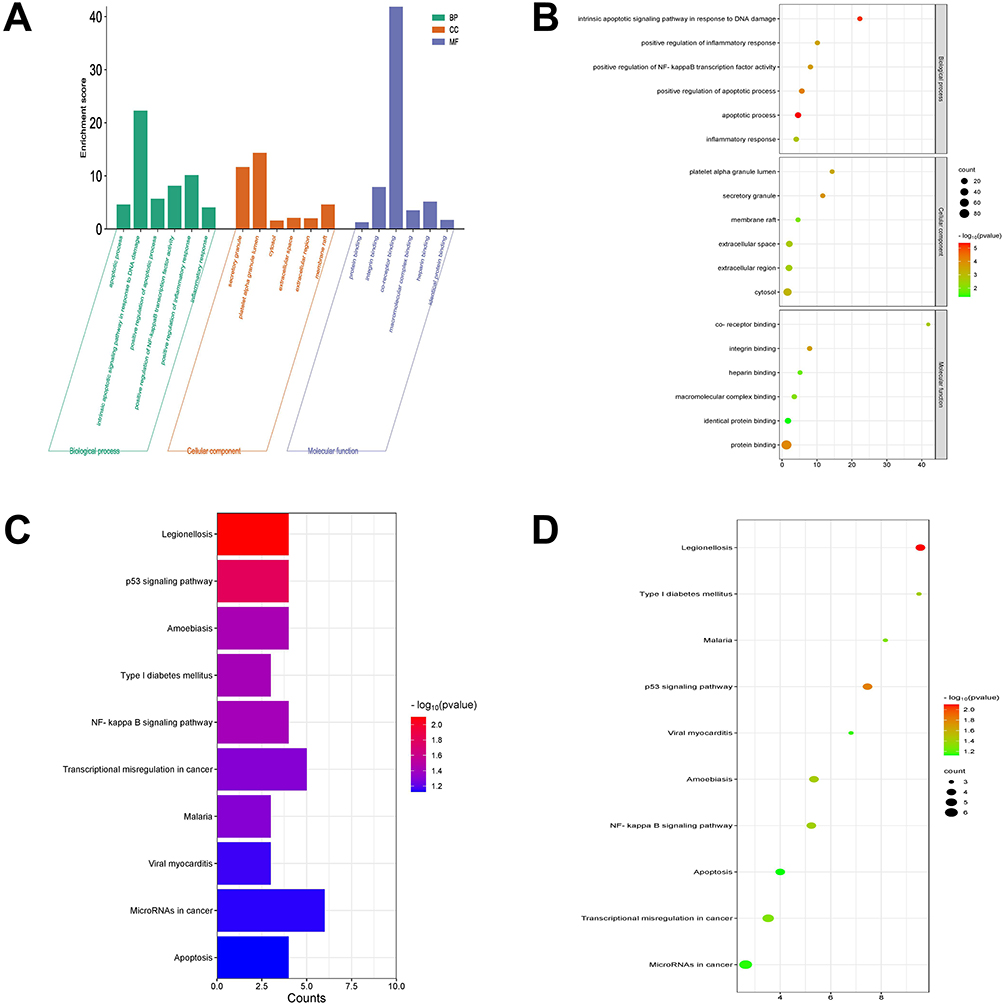 |
Figure 2 Functional enrichment analysis of differentially expression genes. (A) Histogram of Gene Ontology (GO) analysis. (B) Bubble plot of GO analysis. The color depth of the node represents the corrected p-value, and the size of the node refers to the number of genes involved. (C) Histogram of Kyoto Encyclopedia of Genes and Genomes (KEGG) analysis. (D). Bubble plot of KEGG analysis. |
The top 10 enriched KEGG terms with the smallest FDR value were selected based on p-values. The KEGG enrichment results demonstrated that DEGs were mainly enriched in miRNAs in cancer, transcriptional misregulation in cancer, the p53 signaling pathway, and the NF-κB signaling pathway (Figure 2C and D).
PPI Network
The filtered DEGs obtained above were uploaded to the STRING database to construct a PPI network, which resulted in a panoramic view of the PPI network (Figure S2A). Cytoscape was performed to visualize the PPI network model for further network construction. Two highly interconnected hub gene clusters were identified from the DEG’s PPI network by MCODE, and GNL3L, ITGB2, LILRB2, POLR1E, RRP12, S100A8, S100A12, SPP1, and THBS1 were selected. The nodes of hub genes were 3, 10, 7, 3, 3, 7, 5, 6, and 6, respectively (Figure S2B and C). The relevant figures were output directly from the Cytoscape, and the expressions of hub genes in GSE5058 and GSE38974 were drawn (Figure S3).
Analysis of Hub Genes
The expression data of hub genes in GSE38974 raw data samples were utilized to draw the expression ridgeline plot using the R language (Figure 3A). PCA was performed on the expression of selected hub genes as a variable. After processing it with R language functions, we obtained two principal component variables, PC1 and PC2, which together can provide an explanation rate of 76.3%. These can be used as a basis for distinguishing between control group and model group. The scatter plot made using PC1 and PC2 as the x- and y-axis showed good separation between the two samples, further confirming the effectiveness of PC1 and PC2 (Figure 3B). In order to better show the relationship between proteins and pathways and reveal the correlation of the selected genes in different sample data, the expression data of hub genes in GSE38974 was applied to draw a matrix heat map for visualization (Figure 3C).
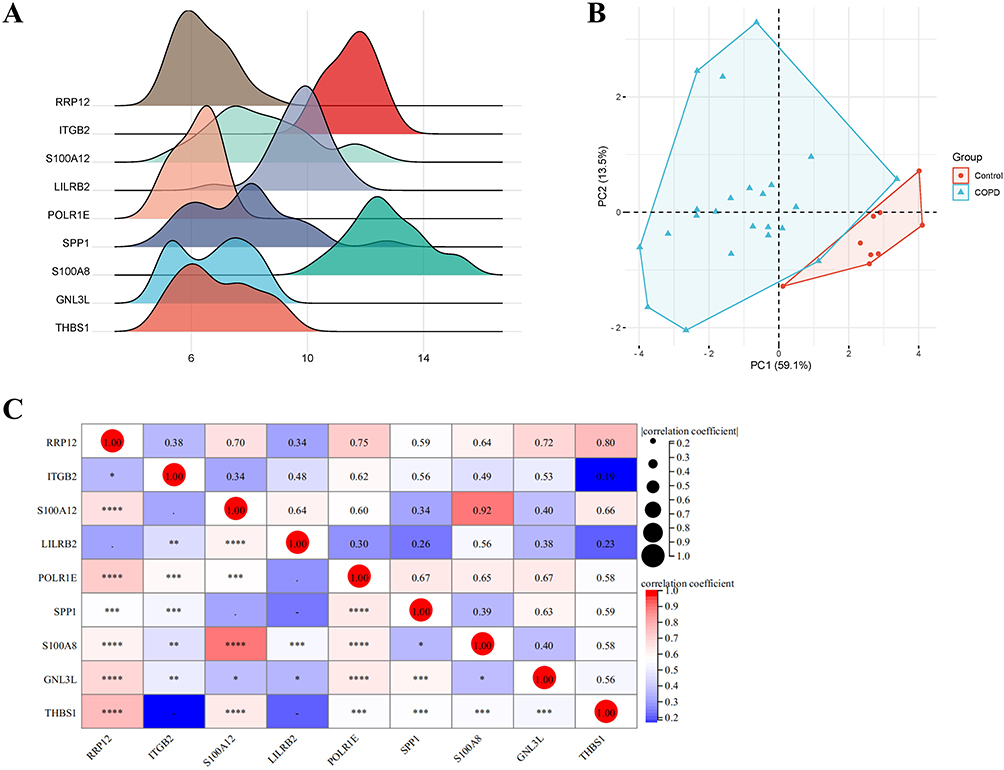 |
Figure 3 (A) Ridgeline plot of hub genes. The x-axis represents gene expression levels, and the shape of the peak represents the dispersion of data in a group, with the height representing the number of samples corresponding to the gene expression level. (B) Principal component analysis (PCA) plot of hub genes. The coordinate axes PC1 and PC2 represent the first and second principal components (ie, the explanation rates of latent variables for differences); points represent samples, with different colors indicating different groups. (C) Matrix correlation analysis of hub genes. Matrix analysis is used to perfectly display the correlation of genes between matrices and visualize them. Asterisk indicators (*, **, ***, ****) indicate a gradually increasing correlation. The red circles represent the greatest correlation. |
AUC Analysis
In order to verify the classification effect of GNL3L expression levels between samples with COPD and healthy controls, we used the raw sample data from GSE38974 and plotted ROC curves for GNL3L, ITGB2, LILRB2, POLR1E, RRP12, S100A8, S100A12, SPP1, and THBS1 using R language. The results showed that GNL3L had the highest AUC value of 0.995 (Figure 4), indicating a false positive rate of 0.5% and a true positive rate of 99.5%, showing that GNL3L was the optimal indicator to distinguish between samples with COPD and healthy controls.
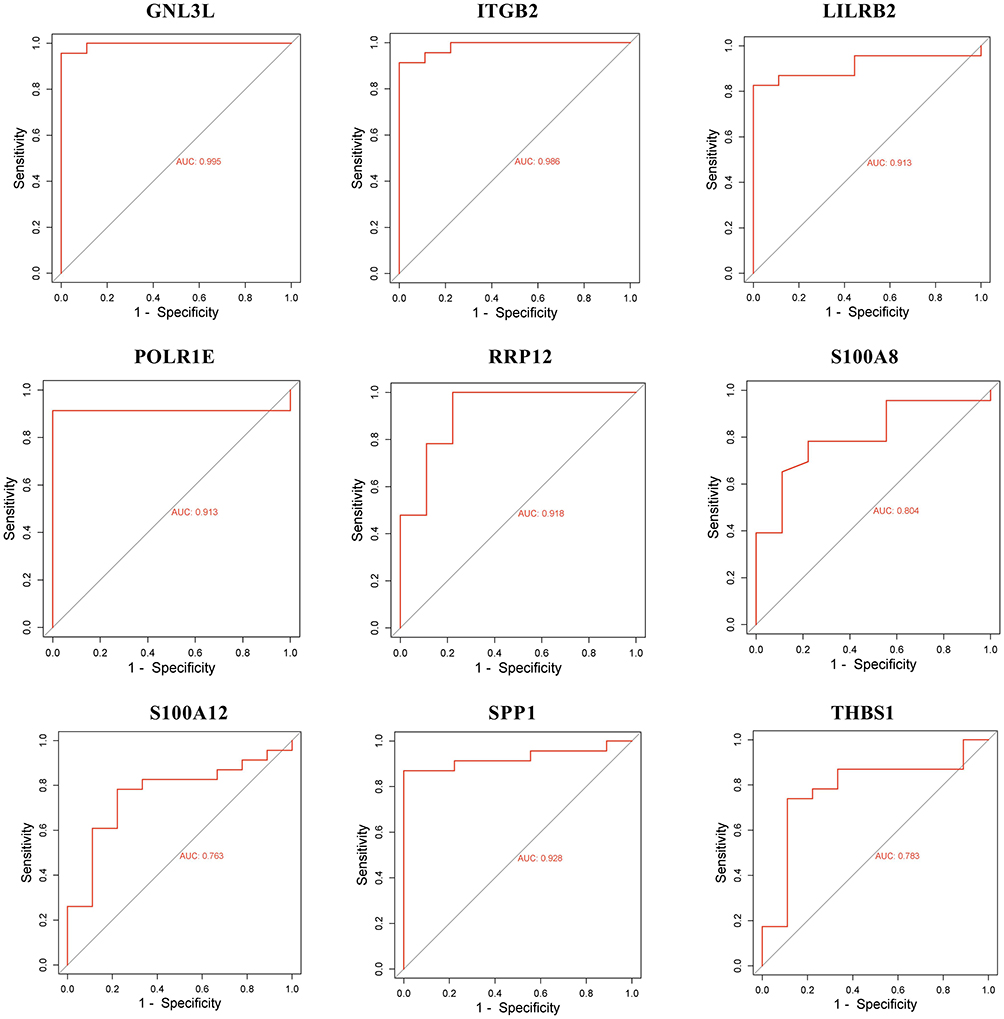 |
Figure 4 Receiver operating characteristic (ROC) analysis curves for GNL3L, ITGB2, LILRB2, POLR1E, RRP12, S100A8, S100A12, SPP1 and THBS1. The x-axis represents the false positive rate and the y-axis represents the true positive rate, while the expression values of the genes in the sample data are shown. |
Expression Verification of GNL3L in Tissues
To verify the reliability of the bioinformatics, we performed RT-qPCR to detect the expression of hub genes. The results of RT-qPCR showed that compared with the Control group, the mRNA levels of GNL3L, ITGB2, LILRB2, POLR1E, RRP12, S100A8, S100A12, SPP1, and THBS1 were significantly up-regulated (p < 0.01, Figure 5) in the COPD model group, which was consistent with the results of bioinformatics analysis.
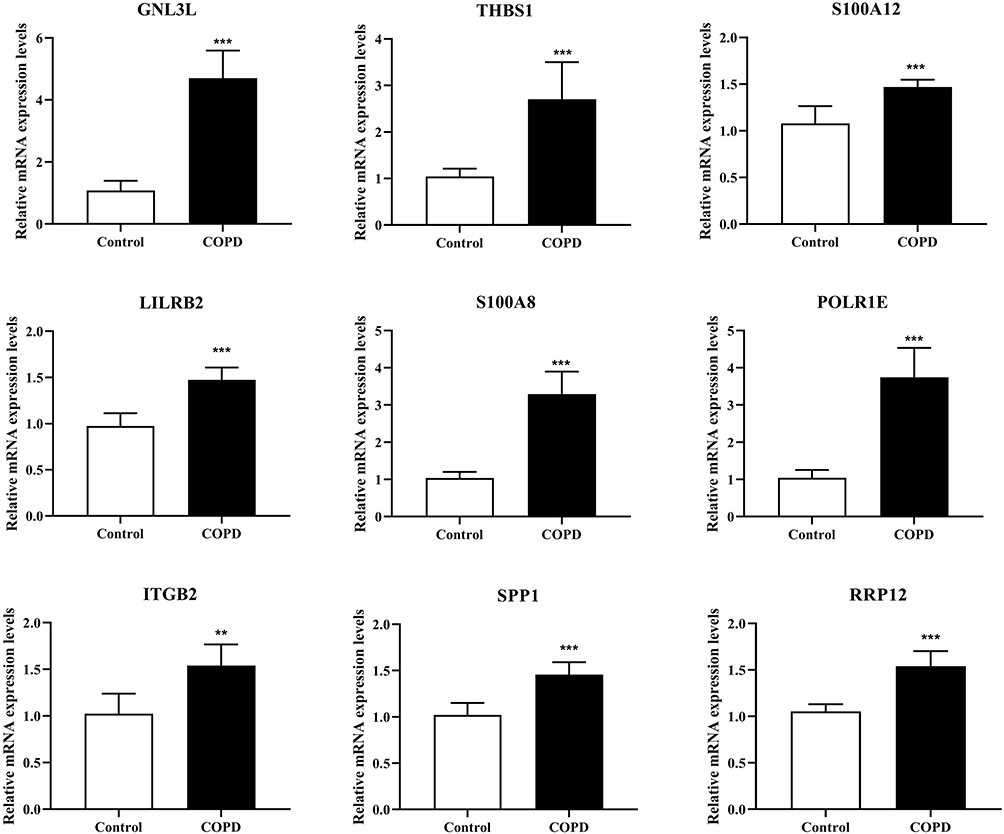 |
Figure 5 RT-qPCR was performed to detect the mRNA expression levels of GNL3L, ITGB2, LILRB2, POLR1E, RRP12, S100A8, S100A12, SPP1 and THBS1 in mouse tissues. ***p < 0.001 compared with the Control group. |
Effects of GNL3L on CS/LPS-Induced COPD Mouse Model Evaluated by Histological Examination
The knockdown efficiency of GNL3L was detected by qPCR, indicating that the expression of GNL3L was significantly decreased in the LV-GNL3L group (Figure 6A). In the COPD mouse model, lung injury scores and lung W/D weight ratios were significantly increased, but GNL3L knockdown decreased these scores and ratios (Figure 6B and C).
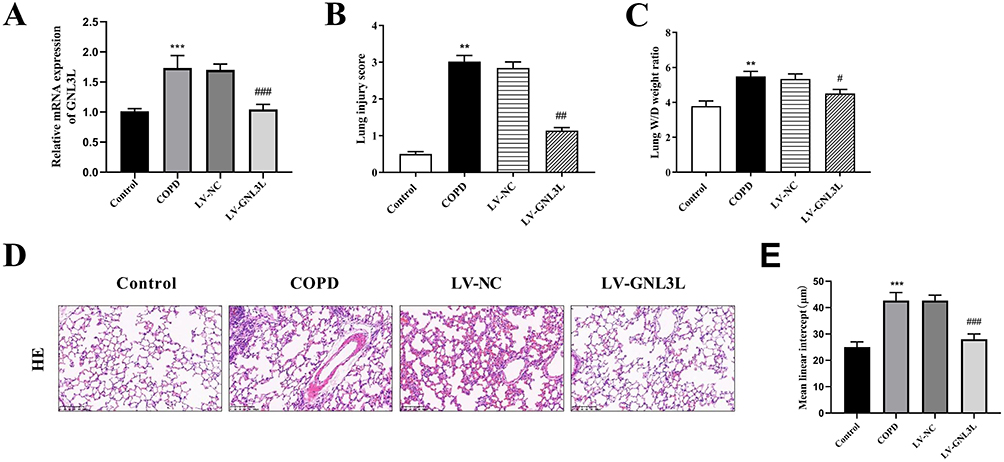 |
Figure 6 (A) RT-qPCR detection of GNL3L expression. (B) Lung injury score. (C) Lung Wet/Dry weight ratio. (D) Representative images of lung tissue with Hematoxylin-eosin staining in each group (magnification: 200×; scale bar: 100 μm). (E) Mean linear intercept (MLI) of alveolar in lung tissues. Compared with the Control group, **p<0.01, ***p<0.001; compared with the LV-NC group, #p<0.05, ##p<0.01, ###p<0.001. |
As shown in Figure 6D, in the Control group, the airway epithelial cells of mice were intact, without degeneration, necrosis, thickening, or narrowing, and the alveolar structure was continuous and intact. In the COPD model, the bronchial epithelial cells of the mice fell off, plenty of inflammatory cells infiltrated in the lung tissue, the number of alveolar cells was decreased, and some of them had obvious alveolar fusion. Compared with the LV-NC group, a reduction in inflammatory cell infiltration was observed in GNL3L-knockdown mice with COPD (Figure 6D).
In addition, MLI was measured as indicators of lung morphological changes in each group, showing that MLI in COPD mice was significantly increased, while the value was lower after knocking down GNL3L (Figure 6E). Therefore, the results indicated that GNL3L knockdown significantly improved the pathological features of CS/LPS-induced COPD mice.
Knockdown of GNL3L Reduced Inflammatory Response and Oxidative Stress, and Inhibited the Expression of ATM/p53 Pathway Protein in CS/LPS-Induced COPD Mice
To elucidate the effects of GNL3L on pulmonary inflammatory response and oxidative stress, ELISA was executed to detect the expression levels of IL-1β, IL-8, TNF-α, and oxidative stress indicators including MDA, SOD, and CAT. Based on the experimental results, the levels of IL-1β, IL-8, and TNF-α in the COPD model group mice showed a significant upward trend in the inflammation-related indicators compared with the control group (Figure 7A, p<0.01). Knockdown of GNL3L reduced the elevation of the expression of IL-1β, IL-8, and TNF-α induced by COPD (p<0.01). Knockdown of GNL3L resulted in a decrease in MDA level and an increase in SOD and CAT levels compared with the LV-NC group (Figure 7B, p<0.01).
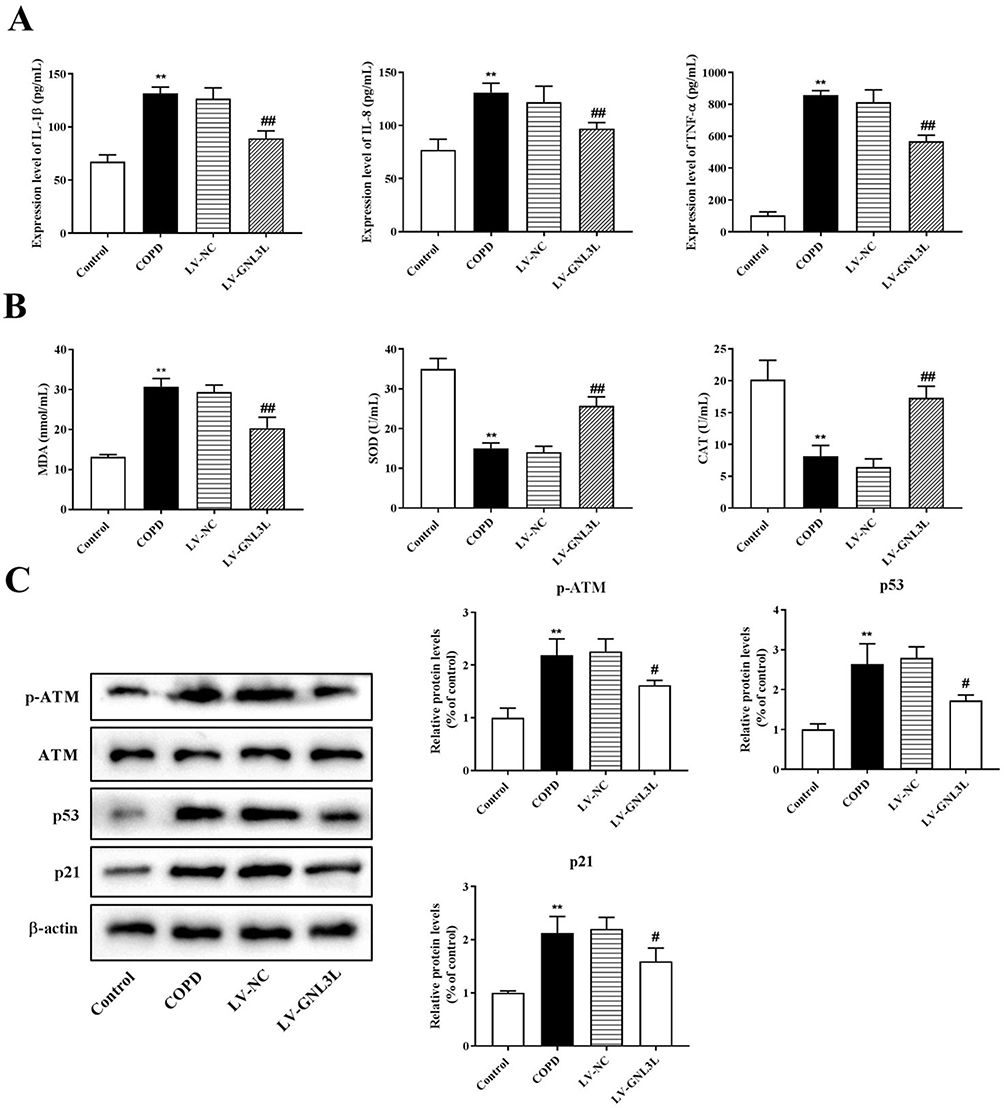 |
Figure 7 ELISA was executed to detect the expression of inflammatory factors (A) and oxidative stress-related factors (B). (C) Western blot was performed to detect the expression of ATM/p53 pathway-related proteins in the tissues. Compared with the Control group, **p<0.01; compared with the LV-NC group, #p<0.05, ##p<0.01. |
Western blot was performed to detect the levels of ATM, p53, and downstream target p21. Compared with the control group, the expression levels of ATM, p53, and p21 in the COPD model group were significantly increased. In comparison to the LV-NC group, knockdown of GNL3L reduced the expression of ATM, p53, and p21 (Figure 7C). These results demonstrated that GNL3L regulated the expression of ATM/p53 pathway-related proteins in COPD.
Knockdown of GNL3L Promoted Cell Proliferation, Reduced Inflammatory Response, and Oxidative Stress, and Inhibited the Expression of ATM/p53 Pathway Protein in CSE-Induced HBE Cells
The transfection efficiency was detected by qPCR (Figure 8A), showing that compared with the COPD group, there was no significant change in the LV-NC group, and the expression of GNL3L in the LV-GNL3L-1, LV-GNL3L-2, and LV-GNL3L-3 groups was significantly down-regulated, of which LV-GNL3L-2 with the highest knockdown efficiency was selected for subsequent experiments.
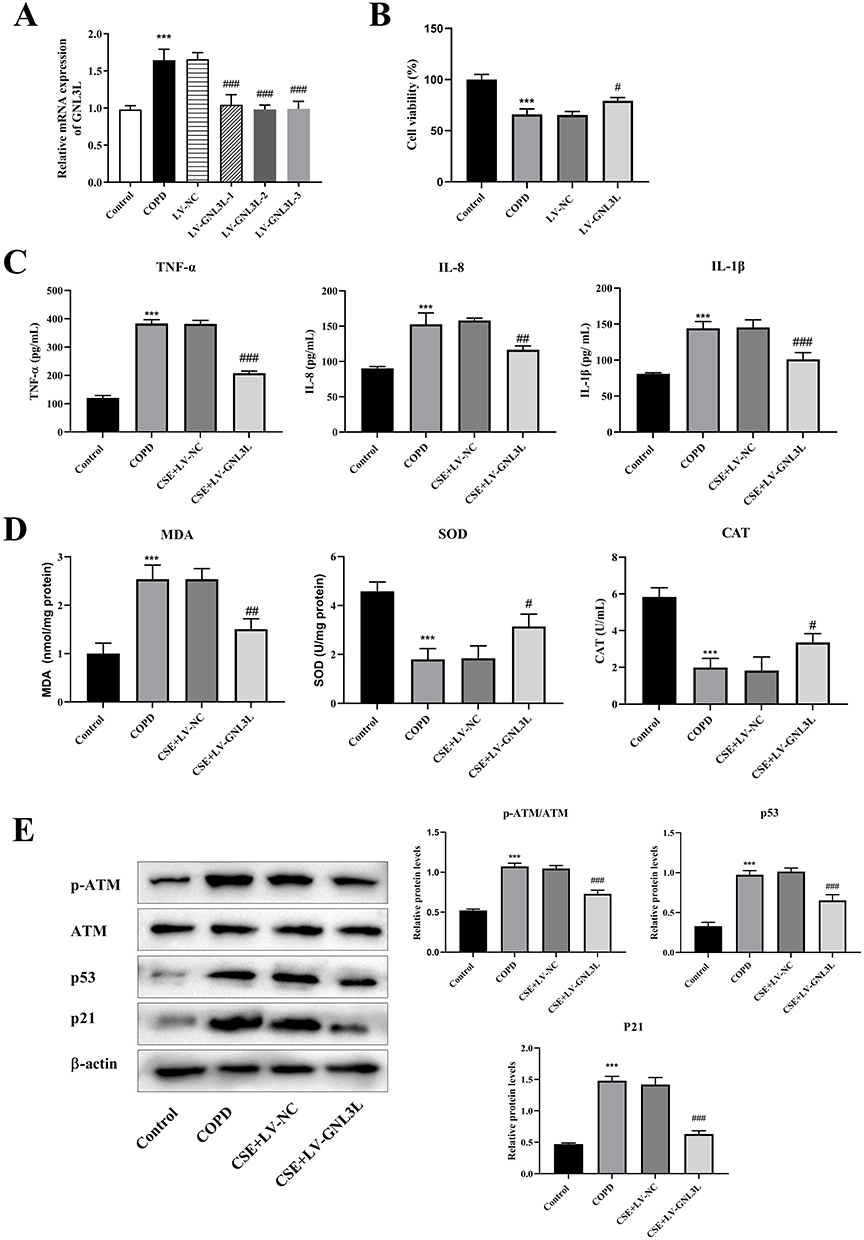 |
Figure 8 (A) RT-qPCR detection of LV-GNL3L transfection efficiency. (B) CCK8 was used to detect cell viability. (C) ELISA was used to detect the contents of inflammatory factors (IL-1β, IL-8 and TNF-α). (D) ELISA was performed to detect oxidative stress indicators (MDA, SOD, CAT). (E) Western blot was applied to detect the protein expression of ATM/p53 pathway-related proteins. Compared with Control group, ***p<0.001, compared with LV-NC group, #p<0.05, ##p<0.01, ###p<0.001. |
CCK-8 was executed to detect cell viability (Figure 8B), which demonstrated that compared with the Control group, the cell proliferation in the COPD group was significantly reduced, while LV-GNL3L restored cell viability.
Moreover, the levels of inflammatory factors (IL-1β, IL-8, and TNF-α), oxidative stress-related indicators (MDA, SOD, and CAT), and ATM/p53 pathway-related proteins in cells were measured by ELISA and Western blot (ATM, p53, and p21), further illustrating that knockdown of GNL3L reduced inflammatory response and oxidative stress, and inhibited ATM/p53 pathway in CSE-induced HBE cells (Figure 8C–E).
Discussion
COPD is a chronic bronchitis disease whose pathogenesis has not been fully elucidated. Studies have shown that its pathogenesis is mainly related to inflammatory mediators, innate immunity, oxidative stress, and protease/antiprotease imbalance.13,14 In this study, GNL3L was discovered by bioinformatics analysis. Histological examination showed that knockdown of GNL3L could significantly improve the pathological characteristics of the mice of CS/LPS-induced COPD group. Through the in vitro and in vivo experiments, knockdown of GNL3L suppressed inflammation, oxidative stress and the ATM/p53 pathway to alleviate COPD.
Bioinformatic methods have been widely applied to search for DEGs related to the progression of diseases for decades. Zhu et al have confirmed the role of spiperone in COPD through bioinformatics analysis.15 It has been widely used to find hub genes to explore the potential mechanism of COPD progression.16 Five ferroptosis-related hub genes are found to affect COPD by regulating ferroptosis.17 EGR2 is identified to aggravate hypoxia-induced cardiomyocyte inflammation and apoptosis, which is a hub gene in myocardial infarction.18 In addition, this method has also been implemented in cervical cancer and breast cancer.19,20 In this study, using bioinformatic analysis, we selected the key gene GNL3L, which may be of vital importance in the progression of COPD.
GNL3L is a newly discovered and evolutionarily conserved GTP binding nucleolar protein,21 which is a nucleo-cytoplasmic shuttling protein, belongs to the HSR1-MMR1 family. GNL3L is also discovered to contribute to the cancer progression and metastasis, and silencing miR-4454 promotes the aggression of colorectal cancer via the GNL3L and NF-κB pathway.4 Calycosin can suppress the proliferation of lung cancer cells by inhibiting the LDOC1/GNL3L/NFκB pathway.22 Moreover, it is also found that GNL3L-LDOC1 regulates cell proliferation to be involved in the occurrence of tumors by regulating NF-κB pathway.6 In our study, GNL3L knockdown reduced the increased expression of inflammatory factors, MDA level, and cell infiltration induced by COPD, and induced an increase in SOD and CAT levels, hinting that knockdown of GNL3L alleviated COPD progression through inhibiting inflammation and oxidative stress.
ATM belongs to the kinase family, which has sequence homology with phosphoinositide 3-kinase and can respond to DNA double-strand breaks. Then ATM activates tumor suppressor protein p53 and up-regulates cyclin-dependent kinase inhibitor p21, leading to cell cycle arrest, which is a major hallmark of senescent cells.23 p53 is involved in inducing cell senescence and is associated with chronic pulmonary inflammation.24 In addition, p53 plays an important role in most respiratory diseases such as ALI,11,25 pulmonary fibrosis,12 pulmonary artery atherosclerosis.26 Acrolein in CS can promote apoptosis and cause lung injury, and Kurotani et al found a secreted protein in lung and tracheal epithelial cells, secretoglobin (SCGB) 3A2, which can inhibit apoptosis by reducing p53 phosphorylation, thereby alleviating lung injury.27 Knockout of p53 reduces chronic bronchitis and airway dilatation following chronic LPS exposure and limits chronic airway inflammation.24 The absence of p53 increases cell proliferation in vivo and accelerates atherosclerosis.26 Besides, it is proved that p53 deficiency enhances the LPS-induced ALI in vivo.25 Caveolin-1 is identified a novel transduction factor and involved in the progression of pulmonary emphysema by activating ATM-p53-p21 pathway.28 Moreover, in COPD patients, p53/p21 pathway can be activated by up-regulating USP7 to mediate cell premature senescence.29 Our results showed that knockdown of GNL3L inhibited the expression of ATM-p53 pathway-related proteins (ATM, p53, and p21) and improved pathological features of COPD mice. In the study of Tiwari et al, the inhibition of p53 can alleviate apoptosis and lung injury.30 Collectively, GNL3L may be involved in the occurrence of COPD by promoting ATM-p53 pathway.
In this paper, through the in vitro and in vivo experiments, knockdown of GNL3L alleviated inflammation and oxidative stress in COPD mice, inhibited ATM-p53 pathway-related protein expression, and significantly reduced inflammatory cell infiltration in lung tissue. In summary, GNL3L may be involved in the progression of COPD by activating the ATM/p53 pathway, providing a new therapeutic target for COPD.
Data Sharing Statement
The datasets generated and/or analysed during the current study are available from the corresponding author upon reasonable request. The data can be accessed from https://www.ncbi.nlm.nih.gov/geo/query/acc.cgi. (Accession: GSE5058, GSE38974).
Ethics Approval and Consent to Participate
This study was approved by the Ethics Review Committee of the Third Hospital of Changsha (No: 2017-S004). All animals housing and experiments were conducted in strict accordance with the institutional guidelines for care and use of laboratory animals. All the procedures were performed in accordance with the Declaration of Helsinki and relevant national policies.
According to the study protocol, human data in the study is downloaded from the GEO DataSets (GSE5058 and GSE38974) (https://www.ncbi.nlm.nih.gov/), which is not related to the use of human clinical data from our hospital. Since the above databases are public resources and all registered users can view and use the data in the databases, the ethical approval of human-related biomedical research by our hospital’s Ethics Committee is not required in this study.
Author Contributions
All authors made a significant contribution to the work reported, whether that is in the conception, study design, execution, acquisition of data, analysis and interpretation, or in all these areas; took part in drafting, revising or critically reviewing the article; gave final approval of the version to be published; have agreed on the journal to which the article has been submitted; and agree to be accountable for all aspects of the work.
Funding
National Natural Science Foundation of China, No. 62071178; Health Commission of Hunan Province, No. A20182005; Natural Science Foundation of Changsha City of Hunan Province, No. kq2014009.
Disclosure
The authors declare that they have no competing interests in this work.
References
1. Soriano JB, Kendrick PJ, Paulson KR; Collaborators GCRD. Prevalence and attributable health burden of chronic respiratory diseases, 1990–2017 a systematic analysis for the Global Burden of Disease Study 2017. Lancet Respir Med. 2020;8(6):585–596. doi:10.1016/S2213-2600(20)30105-3
2. Wu J, Zhao X, Xiao C, et al. The role of lung macrophages in chronic obstructive pulmonary disease. Respir Med. 2022;205:107035. doi:10.1016/j.rmed.2022.107035
3. Thoompumkal IJ, Subba Rao MR, Kumaraswamy A, Krishnan R, Mahalingam S. GNL3L Is a Nucleo-Cytoplasmic Shuttling Protein: role in Cell Cycle Regulation. PLoS One. 2015;10(8):e0135845. doi:10.1371/journal.pone.0135845
4. Kannathasan T, Kuo WW, Chen MC, et al Chemoresistance-associated silencing of miR-4454 promotes colorectal cancer aggression through the GNL3L and NF-κB pathway. Cancers (Basel). 2020;12(5):1231. doi:10.3390/cancers12051231
5. Dai G, Guo Z, Chen H, et al. High expression of guanine nucleotide-binding protein-like-3-like is associated with poor prognosis in esophageal cancer. Medicine. 2021;100(21):e25993. doi:10.1097/MD.0000000000025993
6. Thoompumkal IJ, Rehna K, Anbarasu K, Mahalingam S. Leucine Zipper down-regulated in Cancer-1 (LDOC1) interacts with Guanine nucleotide binding protein-like 3-like (GNL3L) to modulate Nuclear Factor-kappa B (NF-κB) signaling during cell proliferation. Cell Cycle. 2016;15(23):3251–3267.
7. Halaby MJ, Hibma JC, He J, Yang DQ. ATM protein kinase mediates full activation of Akt and regulates glucose transporter 4 translocation by insulin in muscle cells. Cell Signal. 2008;20(8):1555–1563. doi:10.1016/j.cellsig.2008.04.011
8. Wang H, Guo M, Wei H, Chen Y. Targeting p53 pathways: mechanisms, structures, and advances in therapy. Signal Transduct Target Ther. 2023;8(1):92. doi:10.1038/s41392-023-01347-1
9. Yamamura K, Nojiri M, Nishiki K, et al. Serum derivatives of reactive oxygen metabolites are associated with severity of chronic obstructive pulmonary disease and affected by a p53 gene polymorphism. Int J Chron Obstruct Pulmon Dis. 2022;17:1589–1600. doi:10.2147/COPD.S366792
10. Uddin MA, Barabutis N. P53 in the impaired lungs. DNA Repair (Amst). 2020;95:102952. doi:10.1016/j.dnarep.2020.102952
11. Liu G, Park Y-J, Tsuruta Y, Lorne E, Abraham E. p53 Attenuates Lipopolysaccharide-Induced NF-κB activation and acute lung Injury 1. J Immunol. 2009;182(8):5063–5071. doi:10.4049/jimmunol.0803526
12. Jiang C, Liu G, Luckhardt T, et al. Serpine 1 induces alveolar type II cell senescence through activating p53-p21-Rb pathway in fibrotic lung disease. Aging Cell. 2017;16(5):1114–1124. doi:10.1111/acel.12643
13. Disease GIfCOL. Global strategy for the diagnosis, management, and prevention of chronic obstructive pulmonary disease. Report [EB/OL]; 2022.
14. Cho WK, Lee CG, K LK. COPD as a disease of immunosenescence. Yonsei Med J. 2019;60(5):407–413. doi:10.3349/ymj.2019.60.5.407
15. Zhu D, Ma N, Chen L, Huang J, Zhong X. Verification of the role of spiperone in the treatment of COPD through bioinformatics analysis. Int Immunopharmacol. 2021;101:108308. doi:10.1016/j.intimp.2021.108308
16. Chen L, Zhu D, Huang J, Zhang H, Zhou G, Zhong X. Identification of hub genes associated with COPD through integrated bioinformatics analysis. Int J Chron Obstruct Pulmon Dis. 2022;17:439–456. doi:10.2147/COPD.S353765
17. Yang YC, Zhang MY, Liu JY, Jiang YY, Ji XL, Qu YQ. Identification of ferroptosis-related hub genes and their association with immune infiltration in chronic obstructive pulmonary disease by bioinformatics analysis. Int J Chron Obstruct Pulmon Dis. 2022;17:1219–1236. doi:10.2147/COPD.S348569
18. Bo Z, Huang S, Li L, et al. EGR2 is a hub-gene in myocardial infarction and aggravates inflammation and apoptosis in hypoxia-induced cardiomyocytes. BMC Cardiovasc Disord. 2022;22(1):373. doi:10.1186/s12872-022-02814-3
19. Simei T, Zhang H, Yang X, et al. Screening of cervical cancer-related hub genes based on comprehensive bioinformatics analysis. Cancer Biomark. 2021;32(3):303–315. doi:10.3233/CBM-203262
20. Tang D, Zhao X, Zhang L, Wang Z, Wang C. Identification of hub genes to regulate breast cancer metastasis to brain by bioinformatics analyses. J Cell Biochem. 2019;120(6):9522–9531. doi:10.1002/jcb.28228
21. Rao MR, Kumari G, Balasundaram D, Sankaranarayanan R, Mahalingam S. A novel lysine-rich domain and GTP binding motifs regulate the nucleolar retention of human guanine nucleotide binding protein, GNL3L. J Mol Biol. 2006;364(4):637–654.
22. Li CC, Lu CY, Hsu CH, et al. Calycosin inhibits gemcitabine-resistant lung cancer cells proliferation through modulation of the LDOC1/GNL3L/NFκB. Chin J Physiol. 2023;66(4):189–199. doi:10.4103/cjop.CJOP-D-23-00009
23. Birch J, Barnes PJ, Passos JF. Mitochondria, telomeres and cell senescence: implications for lung ageing and disease. Pharmacol Ther. 2018;183:34–49.
24. Sagiv A, Bar-Shai A, Levi N, et al. p53 in bronchial club cells facilitates chronic lung inflammation by promoting senescence. Cell Rep. 2018;22(13):3468–3479. doi:10.1016/j.celrep.2018.03.009
25. Uddin MA, Akhter MS, Kubra K-T, Barabutis N. P53 deficiency potentiates LPS-Induced acute lung injury in vivo. Curr Res Physiol. 2020;3:30–33. doi:10.1016/j.crphys.2020.07.001
26. Guevara NV, Kim H-S, Antonova EI, Chan L. The absence of p53 accelerates atherosclerosis by increasing cell proliferation in vivo. Nat Med. 1999;5(3):335–339. doi:10.1038/6585
27. Kurotani R, Shima R, Miyano Y, et al. SCGB3A2 Inhibits acrolein-induced apoptosis through decreased p53 phosphorylation. Acta Histochem Cytochem. 2015;48(2):61–68. doi:10.1267/ahc.14065
28. Volonte D, Kahkonen B, Shapiro S, Di Y, Galbiati F. Caveolin-1 expression is required for the development of pulmonary emphysema through activation of the ATM-p53-p21 pathway*. J Biol Chem. 2009;284(9):5462–5466. doi:10.1074/jbc.C800225200
29. Zeng M, Zhang X, Xing W, Wang Q, Liang G, He Z. Cigarette smoke extract mediates cell premature senescence in chronic obstructive pulmonary disease patients by up-regulating USP7 to activate p300-p53/p21 pathway. Toxicol Lett. 2022;359:31–45. doi:10.1016/j.toxlet.2022.01.017
30. Tiwari N, Marudamuthu AS, Tsukasaki Y, Ikebe M, Fu J, Shetty S. p53- and PAI-1-mediated induction of C-X-C chemokines and CXCR2: importance in pulmonary inflammation due to cigarette smoke exposure. Am J Physiol Lung Cell Mol Physiol. 2016;310(6):L496–L506. doi:10.1152/ajplung.00290.2015
 © 2023 The Author(s). This work is published and licensed by Dove Medical Press Limited. The full terms of this license are available at https://www.dovepress.com/terms.php and incorporate the Creative Commons Attribution - Non Commercial (unported, v3.0) License.
By accessing the work you hereby accept the Terms. Non-commercial uses of the work are permitted without any further permission from Dove Medical Press Limited, provided the work is properly attributed. For permission for commercial use of this work, please see paragraphs 4.2 and 5 of our Terms.
© 2023 The Author(s). This work is published and licensed by Dove Medical Press Limited. The full terms of this license are available at https://www.dovepress.com/terms.php and incorporate the Creative Commons Attribution - Non Commercial (unported, v3.0) License.
By accessing the work you hereby accept the Terms. Non-commercial uses of the work are permitted without any further permission from Dove Medical Press Limited, provided the work is properly attributed. For permission for commercial use of this work, please see paragraphs 4.2 and 5 of our Terms.