")
Back to Journals » OncoTargets and Therapy » Volume 11
Knockdown of fibrous sheath interacting protein 1 expression reduces bladder urothelial carcinoma cell proliferation and induces apoptosis via inhibition of the PI3K/AKT pathway
Authors Sun M , Chen Z, Tan S, Liu C, Zhao W
Received 28 November 2017
Accepted for publication 31 January 2018
Published 5 April 2018 Volume 2018:11 Pages 1961—1971
DOI https://doi.org/10.2147/OTT.S158275
Checked for plagiarism Yes
Review by Single anonymous peer review
Peer reviewer comments 2
Editor who approved publication: Dr Carlos E Vigil
This paper has been retracted.
Ming Sun,1 Zhaofu Chen,1 Shutao Tan,1 Caigang Liu,2 Wenyan Zhao3
1Department of Urology, 2Department of Breast Surgery, 3Department of General Surgery, Shengjing Hospital of China Medical University, Shenyang, People’s Republic of China
Background: FSIP1 plays a vital role in tumorigenesis and cancer progression. In bladder cancer, FSIP1 overexpression was associated with poor prognosis of bladder urothelial carcinoma. In this study, we investigated whether FSIP1 is essential in the progression of bladder cancer and the mechanism by which it mediates this effect.
Methods: FSIP1 expression was knocked down in bladder cancer cells using lentiviral-mediated short hairpin RNA (shRNA). FSIP1 expression was detected using Western blotting, immunohistochemistry (IHC), and quantitative reverse transcriptase-polymerase chain reaction (qRT-PCR). The effects of FSIP1 knockdown on tumor cells were assessed using colony formation, 3-(4,5-Dimethylthiazol-2-yl)-2,5-diphenyltetrazolium bromide (MTT), and flow cytometry (FCM) apoptosis assays in vitro and BALB/c nude mouse xenograft model in vivo.
Results: The findings suggested that FSIP1 protein was highly expressed in bladder cancer cell lines. Knockdown of FSIP1 resulted in reduced tumor cell viability, cell cycle arrest at G0/G1 phase and apoptosis of bladder cancer cell lines (P<0.05). Moreover, knockdown of FSIP1 expression suppressed the tumor formation and growth of bladder cancer xenografts (P<0.05). At the gene level, knockdown of FSIP1 expression downregulated the activity of the PI3K/AKT signaling pathway.
Conclusion: This study demonstrated that knockdown of FSIP1 suppressed bladder cancer cell malignant behaviors in vitro and in vivo through the inhibition of the PI3K/AKT signaling pathway, suggesting that targeting FSIP1 could be further evaluated as a potential therapeutic strategy in bladder cancer.
Keywords: bladder urothelial carcinoma, FSIP1, proliferation, apoptosis, tumorigenicity
Introduction
Bladder cancer is one of the most common malignancies in the urinary system and is the fourth most prevalent cancer in men and the eighth most prevalent cancer in women.1,2 Histologically, urothelial carcinoma (formerly known as transitional cell carcinoma) has been recognized as the most common pathological type of bladder cancer (>90% of all bladder cancer); thus, the majority of the pathological types of bladder cancer are known as urothelial carcinoma.3 Most patients (>70%) have a superficial tumor (Tin situ, Ta, or T1 stage) at the initial diagnosis. However, other patients diagnosed with an invasive tumor (T2–4 stage) are more susceptible to tumor metastases and recurrence.4,5 In general, patients with invasive bladder cancer have a relatively low 5-year overall survival rate (<40%),1,2,6–8 but it reaches 77% in the USA (US cancer statistics review data, https://seer.cancer.gov/statfacts/html/urinb.html). Through the past several decades, the discovery of several novel molecular targets and cancer etiology could potentially benefit bladder cancer patients by improving prevention, early diagnosis, prediction of prognosis, or even treatment strategies,9–18 but much more is needed to improve the overall survival of cancer patients. Therefore, it is meaningful to identify and evaluate reliable molecular prognostic markers and therapeutic targets for bladder cancer patients.
Fibrous sheath interacting protein 1 (FSIP1) is a recently identified gene, which is normally expressed in the testis but aberrantly expressed in different human cancers, including bladder cancer.19–23 Previous studies have shown that FSIP1 was a potential target for breast cancer therapy since FSIP1 level was higher in tumor tissues than in normal breast tissues and FSIP1 overexpression was associated with poor prognosis.21,24 Recent research reports indicated that FSIP1 was able to regulate the chromosome segregation in cancer cells.22,25,26 Moreover, FSIP1 was found to be a target for steroid receptor coactivator-3, a gene associated with cancer and nuclear receptor co-activator.27–29 Our published data revealed that FSIP1 protein was significantly upregulated in bladder cancer tissues, and it was associated with unfavorable clinicopathological features as well as poor survival of bladder cancer patients.30 Thus, further investigation of FSIP1 involvement in bladder cancer could provide a novel insightful information for the role of FSIP1 in the regulation of bladder cancer biological behavior, such as tumorigenesis, progression, and therapeutic strategy.
In this study, we first assessed the level of FSIP1 expression in a panel of bladder cancer and normal bladder epithelial cell lines. Bladder cancer cells that are highly expressing FSIP1 were used for further FSIP1 knockdown using lentivirus carrying FSIP1 short hairpin RNA (shRNA). We then investigated the effect of FSIP1 knockdown on bladder cancer cell viability, colony formation, cell cycle distribution, apoptosis, and gene expression in vitro and in nude mouse xenografts. Our study is aimed to provide useful information regarding the role of FSIP1 in bladder cancer progression and to investigate whether FSIP1 is a potential target in bladder cancer.
Materials and methods
Cell lines and culture
Bladder cancer 5637 and T24 cell lines and a human embryonic kidney HEK293T cell line were obtained from Cell Bank of Chinese Academy of Science (Shanghai, China), and the human uroepithelial cell line SV-HUC-1 was purchased from American Type Culture Collection (ATCC) (Manassas, VA, USA). These cell lines were cultured in Dulbecco’s Modified Eagle’s Medium (DMEM; Thermo Fisher Scientific, Waltham, MA, USA) supplemented with 10% fetal bovine serum (FBS; Thermo Fisher Scientific) in a humidified incubator with 5% CO2 at 37°C.
Design of vector and production of lentivirus carrying FSIP1 shRNA
We utilized the BLOCK-iT™ RNAi Designer Software (Thermo Fisher Scientific) to design FSIP1 shRNA using FSIP1 cDNA from Genbank (NM_152597 with targeting sequence of 5′-GCAGATGCAGAAACTCAAT-3′), whereas a randomly shRNA without any homology to FSIP1 was used as a negative control (5′-TTCTCCGAACGTGTCACGT-3′) (FSIP1-shNC). The oligonucleotides were then chemically synthesized by GeneChem (Shanghai, China). According to the manufacturer’s instructions, the lentiviral vectors were constructed by cloning of these shRNA oligonucleotides into the pGCSIL-green fluorescent protein (GFP) (GeneChem). After DNA sequence confirmation, these vectors were transfected into HEK293T cells, together with the helper plasmids using Lipofectamine 2000 (Thermo Fisher Scientific). Lentiviral supernatants were then harvested 48 hours after gene transfection, and subsequently, the transfected HEK293T cells were centrifuged at the speed of 4,000× g with the temperature being controlled at 4°C for 10 minutes. The viral titer was measured by counting GFP-positive cell under fluorescence microscopy (Olympus Corporation, Tokyo, Japan) and then assayed for a multiplicity of infection (MOI) according to a standard protocol.
Infection of Lv-FSIP1-shRNA into T24 cells
T24 cells were seeded in six-well plates at a density of 3×10⁵ cells/well and incubated in a humidified incubator with 5% CO2 at 37°C for a day. The cells were then infected with Lv-FSIP1-shRNA (Group KF) or negative control lentivirus Lv-FSIP1-shNC (Group NC) at an MOI of 10 following our pre-experiment according to the manufacturer’s viral infection protocol. The cells infected with an empty vector were regarded as the blank control group (Group BC). After 72 hours of infection, the infection efficiency was identified through the detection of percentage of GFP-positive cells. Five days later, cells were harvested and subjected to quantitative reverse transcriptase polymerase chain reaction (qRT-PCR) and Western blot analysis of FSIP1 expression.
RNA isolation and qRT-PCR
Total RNA was isolated from cells using the TRIzol reagent (Thermo Fisher Scientific) and then reversely transcribed into cDNA using the High-Capacity cDNA Reverse Transcription Kit (Thermo Fisher Scientific) according to manufacturers’ protocols. The resulted cDNA samples were subjected to qRT-PCR amplification in the 7500 RT-PCR System (Thermo Fisher Scientific) using the SYBR Green Real-Time PCR Assay Kit (Takara, Otsu, Japan). The qRT-PCR conditions were set to a predenaturation cycle at 95°C for 10 minutes followed by 45 cycles of denaturation at 95°C for 10 seconds and extension at 60°C for 30 seconds. The primer sequences of FSIP1 were 5′-GCTCAGGGGTAAACACAACC-3′ (forward) and 5′-GCTCAACCAGCCTTTTCTTC-3′ (reverse), while the primer sequences of β-actin were 5′-CATGTACGTTGCTATCCAGGC-3′ (forward) and 5′-CTCCTTAATGTCACGCACGAT-3′ (reverse). For each experiment, the Ct value was calculated with the relative expression level vs β-actin and analyzed using the 2−ΔΔCt method. The experiments were conducted in triplicate and repeated at least once.
Western blotting
Cells were harvested 5 days after infection using the sodium dodecyl sulfate buffer, and total cellular protein was extracted using a protein extraction kit (ProMab, Richmond, CA, USA) and centrifuged at 20,000× g at 4°C for 10 minutes. The protein concentration was measured using a bicinchoninic acid assay kit (Santa Cruz Biotechnology Inc., Dallas, TX, USA). Subsequently, the protein lysate was added to sodium dodecylsulfate-polyacrylamide gel electrophoresis and then transferred onto polyvinylidene fluoride (PVDF) membranes (EMD Millipore, Billerica, MA, USA). For Western blotting, the membranes were blocked with 5% skimmed milk in Tris buffered saline Tween (TBST) at room temperature for 2 hours and then incubated with the primary antibody at 4°C overnight. On the next day, the membranes were washed with TBST briefly for three times and then further incubated with a horseradish peroxidase-conjugated secondary antibody (Santa Cruz Biotechnology Inc.) at a dilution of 1:1,000 at the room temperature for 1 hour. The primary antibodies rabbit anti-FSIP1 (1:500), anti-Bcl-2 (1:1,000), and anti-Bax (1:1,000) were purchased from Abcam (Cambridge, MA, USA) and anti-Cyclin D1 (1:1,000), anti-Cyclin B1 (1:1,000), anti-phospho-PI3K (1:1,000), anti-PI3K (1:1,000), anti-phospho-AKT (1:1,000), anti-AKT (1:1,000), and anti-cleaved-Caspase 3 (1:1,000) were obtained from Cell Signaling Technology (Beverly, MA, USA). To visualize the target protein band on the PVDF membrane, we applied a Pierce ECL Kit (Thermo Fisher Scientific) on it and the images were captured with the DNR Bio Imaging System (DNR, Jerusalem, Israel). β-Actin (Abcam) was used as a loading control at a dilution of 1:2,000.
Cell viability 3-(4,5-dimethylthiazol-2-yl)-2,5-diphenyltetrazolium bromide (MTT) assay
The effect of FSIP1 shRNA on T24 cell viability was assessed using the MTT assay kit (Hoffman-La Roche Ltd., Basel, Switzerland). In brief, cells were grown and transduced with lentiviruses for 5 days and the cells were seeded at a density of 3×10³ cells/well in 96-well plates and incubated at 37°C for an additional 24, 48, or 72 hours. At the end of each experiment, the MTT reagent was added to cell culture at a final concentration of 5 mg/mL, and the cells were further incubated at 37°C for additional 4 hours. The supernatant in each well was then removed, and dimethyl sulfoxide was added to completely dissolve the MTT-formed crystals. The plates were measured using the microplate reader (BioTek, Winooski, VT, USA) at a wavelength of 490 nm. Each experiment was done in triplicate and repeated at least three times.
Tumor cell colony formation assay
After lentiviral infection, cells were seeded into six-well plates at a density of 1×10³ cells/well and incubated at 37°C for 12 days. Subsequently, the plates were washed briefly with phosphate-buffered saline (PBS) and then fixed in 4% paraformaldehyde solution at the room temperature for 25 minutes. The cells were then stained with Giemsa solution (Tiangen Biotechnology, Beijing, China) for 20 minutes. The number of cell colonies (>50 cells/colony) was counted under an inverted microscope (Olympus Corporation). Each experiment was done in duplicate and repeated at least three times.
Flow cytometric cell cycle distribution assay
The cell cycle distribution was assayed using flow cytometry (FCM) after propidium iodide (PI) staining. In particular, cells were grown and infected with lentivirus for 5 days. T24 cells were then suspended at a density of 1×10⁵ cells/plate in PBS and fixed in ice-cold 70% ethanol at 4°C overnight. On the next day, the cells were washed with ice-cold PBS three times and then treated with the PI staining solution (50 μg/mL PI and 100 μg/mL RNase A; Sigma-Aldrich Co., St Louis, MO, USA) in the dark at the room temperature for 30 minutes. After that, the cell cycle distribution was detected using FCM (Becton Dickinson, San Jose, CA, USA) and analyzed using the proprietary software (Becton Dickinson). The experiment was performed in duplicate and repeated at least three times.
Flow cytometric apoptosis assay
Apoptosis level was detected using FCM after staining with the Annexin V-fluorescein isothiocyanate (FITC) Apoptosis Kit (Thermo Fisher Scientific). Briefly, cells were grown and infected with lentivirus for 5 days and collected and washed with PBS. After that, the cells were resuspended in 100 μL of the binding buffer and treated with 5 μL of Annexin V-FITC (BD Biosciences, San Jose, CA, USA) and 5 μL of the PI solution in the dark at the room temperature for 15 minutes. The cells were measured using the FCM (BD Bioscience) for apoptosis rate. The experiment was performed in duplicate and repeated at least three times.
Animal experiments
The animal protocol of this study was approved by the Institutional Animal Care and Use Committee (IACUC) of Shengjing Hospital of China Medical University (Shenyang, China) and followed the regulatory animal care guidelines of the United States National Institute of Health (Bethesda, MD, USA). A total of 30 BALB/c nude mice with the age of 6 weeks were obtained from the Experimental Animal Center of China Medical University (Shenyang, China) and kept in the specific pathogen-free (SPF) condition with the temperature being controlled.
For animal experiments, T24 cells were grown and infected with Lv-FSIP1-shRNA, Lv-FSIP1-shNC, or empty vector for 5 days and then harvested and suspended in serum-free DMEM. The BALB/c nude mice were randomly assigned to Group BC, Group NC, and Group KF and subcutaneously injected on the dorsum region with these T24 cells (1×10⁶ cells in 200 μL). The mice were kept in cages, and the diameter of the tumor cell xenografts was measured for the length (L) and width (W) weekly for 5 weeks. The xenograft volume and size were calculated using the following formula: volume (mm3) =0.5×(L×W2). At the end of animal experiments, the mice were sacrificed using CO2 and cervical dislocation and tumor cell xenografts were resected for the measurement of weight and other analysis.
Immunohistochemistry (IHC)
Tumor cell xenografts were fixed in 4% paraformaldehyde and tissue processing and then embedded in paraffin. For IHC, the tumor cell xenograft paraffin blocks were sectioned into 4 μm thick sections, which were deparaffinized in xylene and rehydrated in series of ethanol solutions. The sections were subjected to antigen retrieval by placing the sections into 0.1 M sodium citrate buffer (pH 6.0) and cooking in a high-pressure cooker for 10 minutes. The sections were left to cool down for 20 minutes and then rinsed in PBS. Next, the sections were incubated in 3% hydrogen peroxide in methanol for 10 minutes to inactivate potential endogenous peroxidase activity. After washing with tap water and PBS, the sections were incubated in 20% normal serum to block any nonspecific binding of the secondary antibody and further with the primary anti-FSIP1 antibody (Santa Cruz Biotechnology Inc.) at a dilution of 1:200 at 4°C overnight. On the next day, the sections were washed with PBS for three times followed by incubation with the secondary antibody for 1 hour at the room temperature and then with the SP staining kit (MaiXin, Fuzhou, China) according to manufacturer’s protocol. The color was developed using a diaminobenzidine kit (MaiXin). The sections were also counterstained with the hematoxylin solution and, then, mounted with a coverslip in a mounting medium (Thermo Shandon, Pittsburgh, PA, USA). The sections were reviewed and scored under a light microscope (Olympus Corporation), and cell membrane or cytoplasmic staining was considered to be immunostaining positive.
Statistical analysis
The data were summarized as mean ± standard deviation (SD) and statistically analyzed using the SPSS 19.0 software (IBM Corporation, Armonk, NY, USA). The differences among the experimental groups were statistically calculated using Student’s t-test. A P-value of <0.05 was considered as statistically significant.
Ethical standards
This study was approved by the Ethics Committee of Shengjing Hospital, China Medical University.
Results
Expression levels of FSIP1 protein in bladder cancer and normal bladder epithelial cells
Levels of FSIP1 expression in bladder cancer and normal bladder epithelial cells were assessed using Western blotting. As shown in Figure 1A and B, FSIP1 protein was highly expressed in bladder cancer cell lines, whereas the normal cells expressed very low levels of FSIP1 protein (P<0.05).
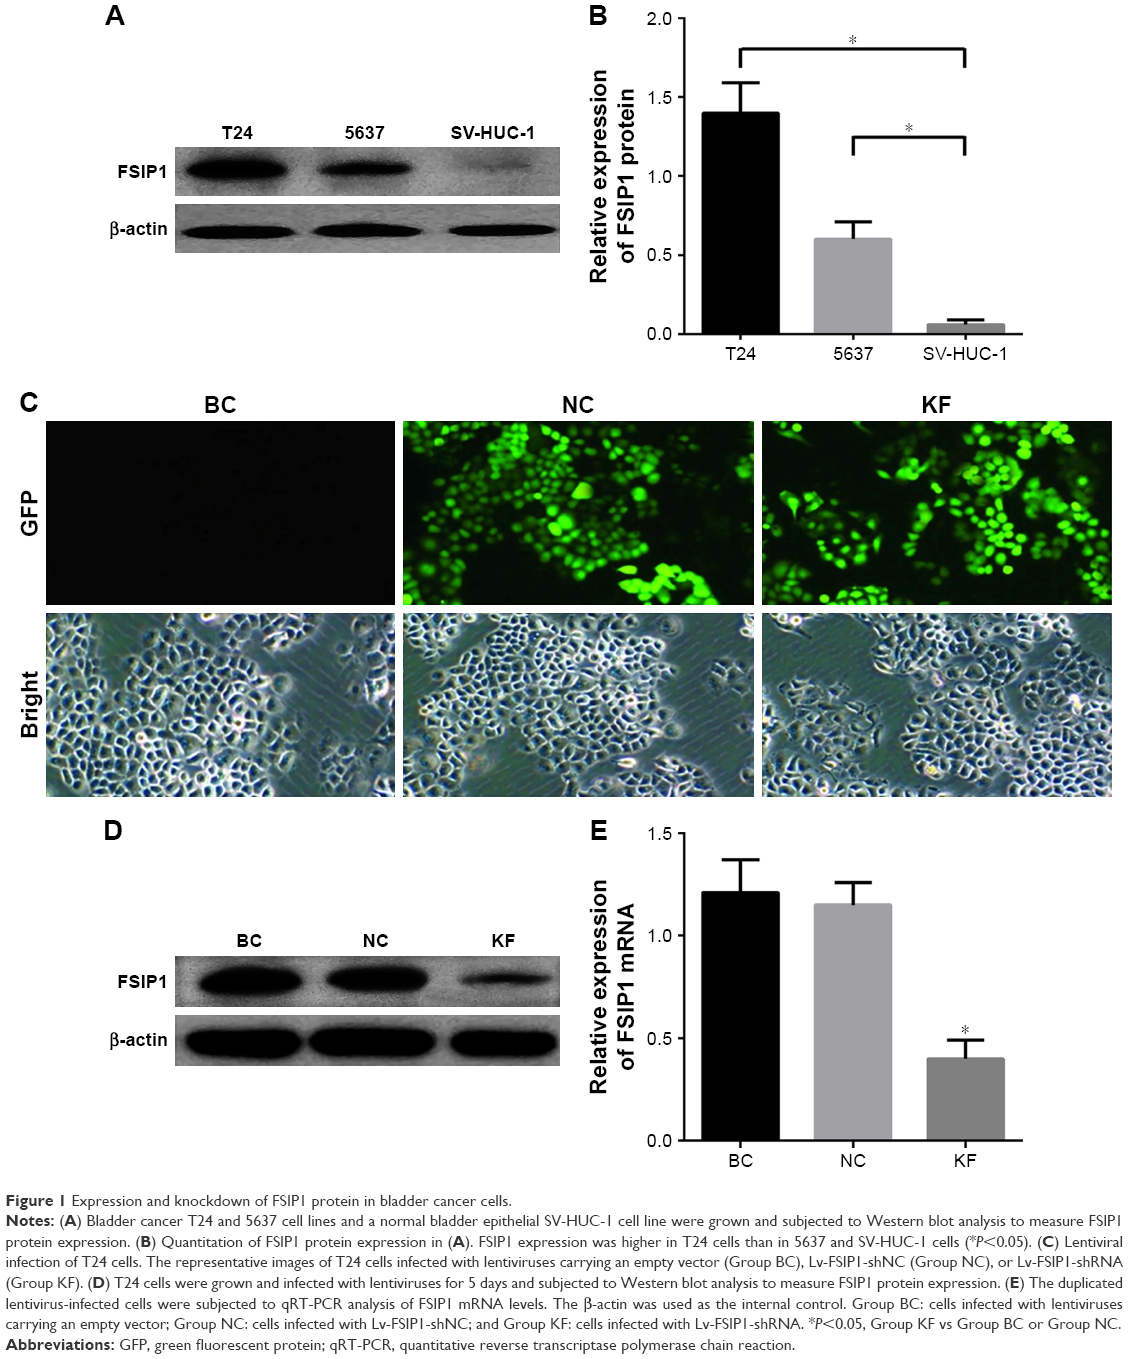 | Figure 1 Expression and knockdown of FSIP1 protein in bladder cancer cells. |
Lentivirus-mediated knockdown of FSIP1 expression in bladder cancer T24 cells
To assess the role of FSIP1 in bladder cancer, we infected T24 cells with lentiviruses carrying FSIP1 or negative control shRNA. The fluorescence microscopy showed that the lentivirus transduction was successfully performed in T24 cells with a transduction rate of >70% (Figure 1C). We then measured FSIP expression in these infected T24 cells and found that 120 hours after infection, levels of FSIP1 mRNA and protein were significantly decreased in Group KF than in Group NC or in Group BC (Figure 1D and E).
Reduction of bladder cancer cell proliferation after FSIP1 knockdown
The MTT assay was used to detect the effect of FSIP1 knockdown on the regulation of bladder cancer cell proliferation. As shown in Figure 2A, the viability of T24 cells transduced with Lv-FSIP1-shRNA for 48 and 72 hours was clearly reduced compared with that of either Group BC or Group NC (P<0.05). Nevertheless, there was no significant difference between Group BC and Group NC (P>0.05). This finding revealed that the proliferation capacity of T24 cells was reduced significantly after FSIP1 expression was suppressed. To further confirm this finding, we assessed the effect of FSIP1 knockdown on the cell growth of bladder cancer cells using the colony formation assay. Our results showed that the number of colonies in Group KF was declined significantly compared with that of either Group BC or Group NC (P<0.05; Figure 2B and C).
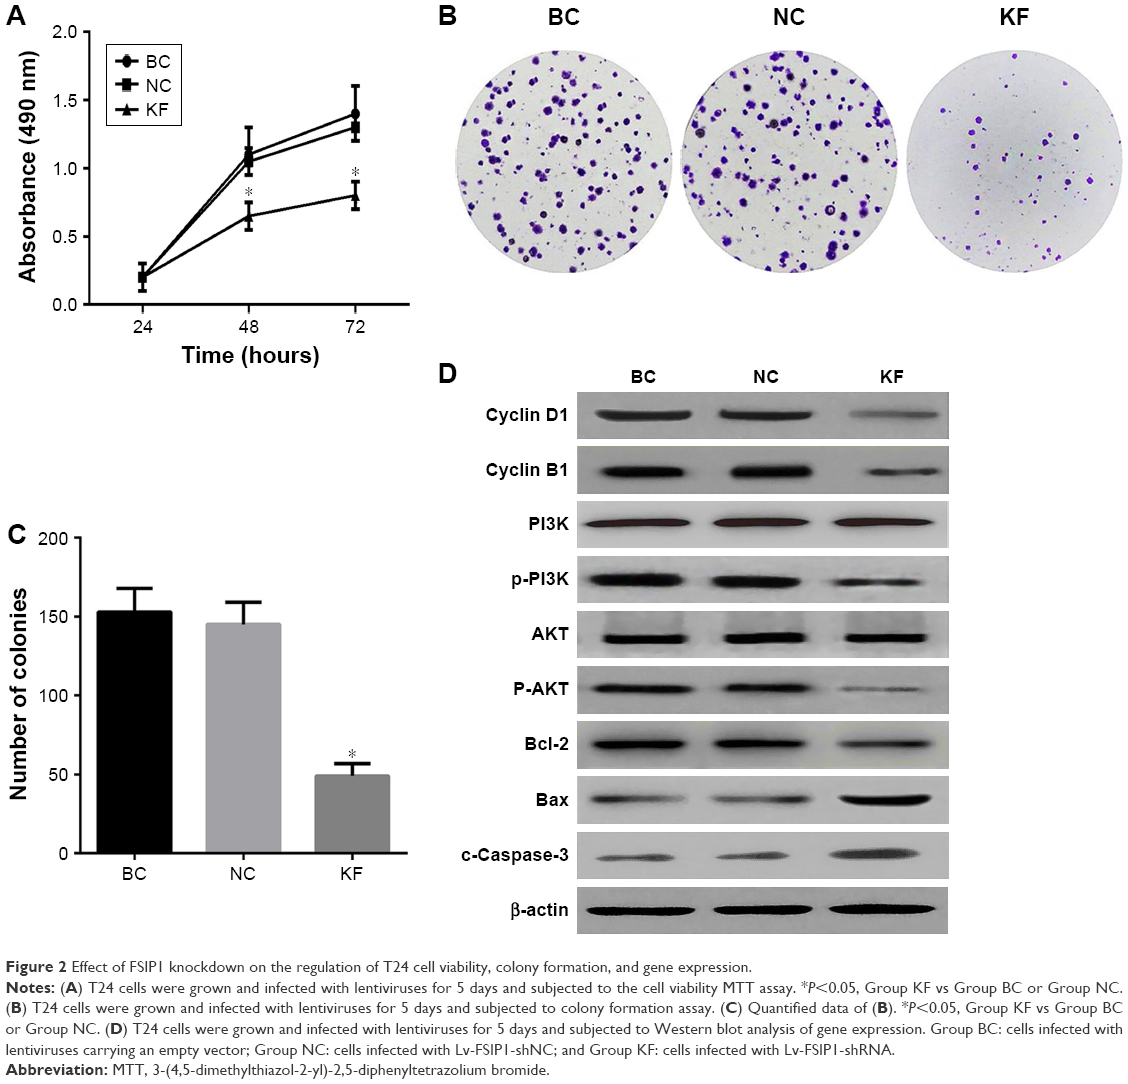 | Figure 2 Effect of FSIP1 knockdown on the regulation of T24 cell viability, colony formation, and gene expression. |
Induction of bladder cancer cell cycle arrest at G0/G1 phase after FSIP1 knockdown
Using PI staining-flow cytometric assay, our results showed that the S phase of the cell cycle was significantly reduced in T24 cells that were infected with Lv-FSIP1-shRNA vs Group BC or Group NC (15.49±2.23 vs 38.12±4.12 or 36.73±3.84, P<0.05; Figure 3A). Compared with Group BC or Group NC, the percentage of G0/G1-phased cells in Group KF was significantly increased from 50.34±5.89 or 51.06±5.93 to 71.07±6.94 (P<0.05; Figure 3A). These results indicate that FSIP1-shRNA tumor cells were arrested at the G0/G1 phase of the cell cycle (Figure 3B). However, there was no significant difference in G2/M phase among these three different groups (P>0.05; Figure 3A and B). Compared with Group BC and Group NC, levels of Cyclin D1 and Cyclin B1 expressions, the key regulators of the cell cycle progression, were significantly reduced after knockdown of FSIP1 expression in T24 cells (Figure 2D).
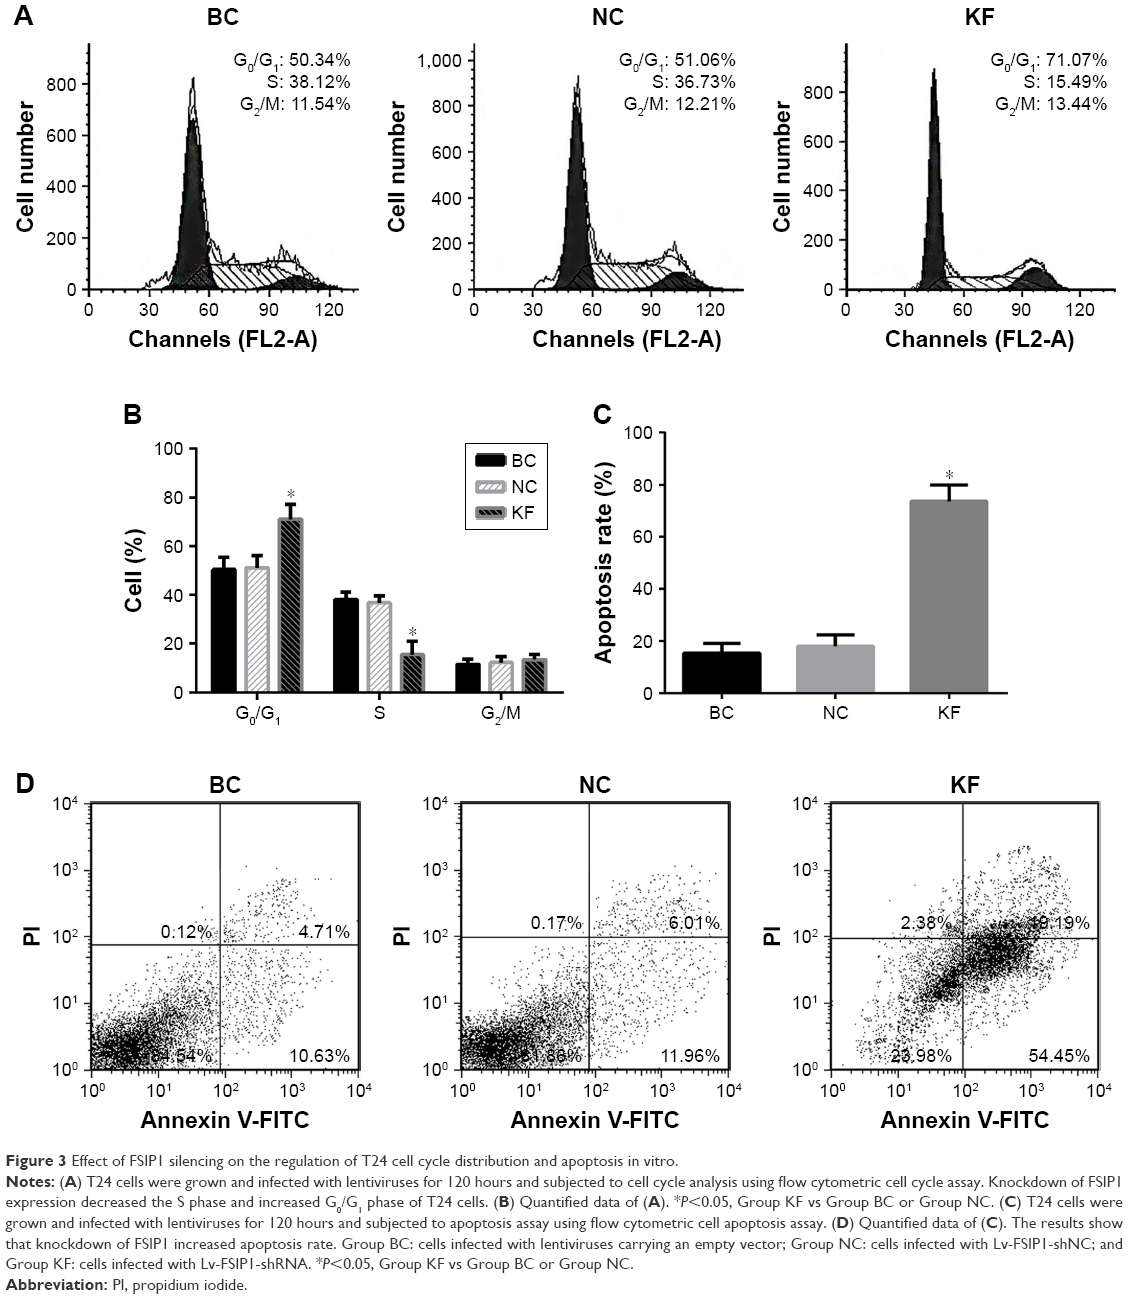 | Figure 3 Effect of FSIP1 silencing on the regulation of T24 cell cycle distribution and apoptosis in vitro. |
Induction of bladder cancer cell apoptosis after FSIP1 knockdown
The FCM and FITC-labeled Annexin V/PI double staining assay showed that the T24 cell apoptotic rate after 120 hours infection in Group KF was 54.45%±6.36%, which was much higher than that of either Group BC or Group NC (10.63±3.78 or 11.96%±4.28%, P<0.05; Figure 3C and D). However, there was no notable difference in apoptosis between Group BC and Group NC (P>0.05; Figure 3C).
Inhibition of T24 cell tumorigenesis after FSIP1 knockdown in vivo
Next, we investigated the effect of FSIP1 shRNA on the suppression of T24 cell tumorigenesis in nude mice xenograft model. After 35 days of tumor cell inoculation, the mean volume of tumor xenografts was markedly smaller in Group KF than in Group BC or in Group NC (P<0.05; Figure 4A and D) and the average tumor weight was also lighter in Group KF than in both Group BC and Group NC (P<0.05; Figure 4A and E). Nevertheless, there was no statistical difference in tumor weight and tumor volume between Group BC and Group NC (P>0.05; Figure 4D and E).
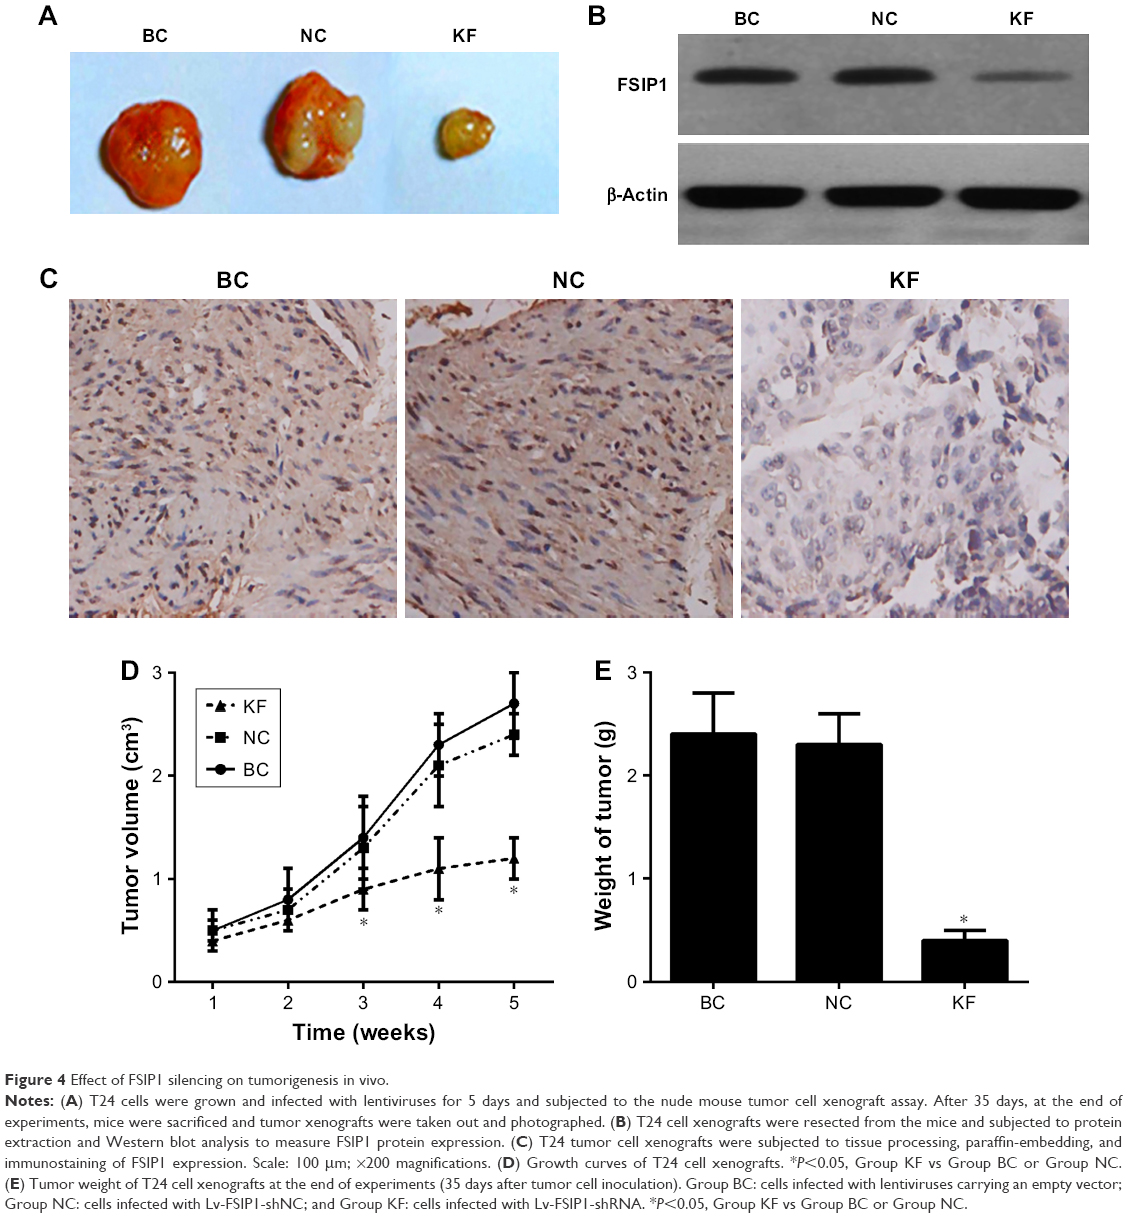 | Figure 4 Effect of FSIP1 silencing on tumorigenesis in vivo. |
Moreover, we assessed FSIP1 expression in tumor xenografts using IHC and Western blot and found that there was a notable decrease in FSIP1 expression level in Group KF than in both Group BC and Group NC (P<0.05; Figure 4B and C).
Reduction of PI3K/AKT signaling pathway activation in bladder cancer cells after FSIP1 knockdown
Thus far, we demonstrated that knockdown of FSIP1 expression in bladder cancer T24 cells significantly reduced tumor cell viability in vitro and tumorigenesis in vivo. We next explored the underlying molecular events by investigating whether FSIP1 alters the activity of the PI3K/AKT pathway. Our data showed that although the total PI3K and AKT proteins remained intact upon knockdown of FSIP1 expression, the phosphorylated PI3K and AKT levels were downregulated in Group KF compared with Group BC and Group NC (Figure 2D). Expression of Bcl-2 protein was also significantly reduced, whereas the levels of Bax and cleaved Caspase-3 proteins were increased in Group KF compared with Group BC and Group NC (Figure 2D). This finding suggests that the PI3K/AKT pathway is possibly mediating the effect of FSIP1 in T24 cells; however, further investigation is required to mechanistically prove this finding.
Discussion
In the current study, we first analyzed FSIP1 expression in bladder cancer and normal bladder epithelial cells and selected T24 cells for FSIP1 knockdown using lentivirus carrying FSIP1 shRNA. We found that FSIP1 protein was highly expressed in bladder cancer cells and that FSIP1 shRNA effectively knocked down FSIP1 expression in T24 cells. We also found that knockdown of FSIP1 expression reduced cell viability and induced apoptosis in bladder cancer cells. Moreover, knockdown of FSIP1 expression suppressed T24 cell tumorigenesis in nude mice. At the gene level, knockdown of FSIP1 expression reduced the activity of the PI3K/AKT signaling pathway. Our current study indicates that FSIP1 plays an important role in bladder cancer development and progression. FSIP1 might be a novel biomarker and have a potential therapeutic strategy for bladder cancer.
Indeed, lentiviral vector-carrying shRNA is a well-established technique that has been used as a useful tool to silence gene expression in mammalian cells and is considered as a promising therapeutic strategy for curing various human malignancies.31–33 In our study, we applied this technique to assess the effect of FSIP1 knockdown on the progression of bladder cancer.
FSIP1 is a part of the microtubule- and dynein-rich fibrous sheath and is necessary for flagellum function and sperm movement.19,25 Moreover, FSIP1 overexpression was found to induce cancer cell mitotic errors.25 Indeed, previous studies have shown that FSIP1 was overexpressed in non-small-cell lung carcinoma,23 breast cancer,21 and bladder cancer30 and its overexpression was associated with poor survival in patients carrying these tumors. Thus, FSIP1 is considered to be an oncogene in these cancers. In the current study, we assessed the effect of FSIP1 protein knockdown on the regulation of bladder cancer T24 cell biological behavior. Our results showed that knockdown of FSIP1 expression reduced bladder cancer cell viability and induced apoptosis in vitro. Knockdown of FSIP1 expression suppressed T24 cell tumorigenesis in nude mice. Our current data suggest that FSIP1 is a putative oncogene and as a valid target for therapeutic intervention in bladder cancer.
In tumor biology research, the abnormal cell proliferation and apoptosis play an important role in tumorigenesis and cancer progression and have been considered as useful targets for diagnosis and prognosis and therapy strategies.34,35 To date, there is no study that has demonstrated the role of FSIP1 in apoptosis in bladder cancer cells. Our current study showed that knockdown of FSIP1 expression induced bladder cells to undergo apoptosis in vitro and in nude mice, suggesting that overexpression of FSIP1 in bladder cancer or other human cancers could promote cancer progression. Knockdown of FSIP1 bladder cancer cells resulted in cell growth arrest at G0/G1 phase suggesting the regulatory role of FSIP1 in bladder cancer growth and proliferation. To explore the potential molecular mechanism underlying the G0/G1 phase arrest, we assessed the expression of cell cycle-regulatory proteins, such as Cyclin D1 and Cyclin B1. We found that downregulation of FSIP1 expression resulted in a marked decrease in Cyclin D1 and Cyclin B1 expressions, suggesting that FSIP1 might promote cell cycle checkpoint transitions in bladder cancer cells. These data demonstrated that FSIP1 regulated cell cycle progression and participated in tumor malignant progression by promoting cell proliferation.
Furthermore, the possible mechanisms by which FSIP1 affects bladder cancer cells have also been investigated in our current study. Our data suggest that the levels of PI3K and AKT phosphorylation were decreased after knockdown of FSIP1 expression. In fact, the PI3K/AKT pathway is a key regulator of various cell processes, including cell proliferation, differentiation, and apoptosis. Altered expression and activity of PI3K/AKT pathway components contribute to tumor formation.36–38 In various types of human cancers, the dysregulated expression or activity of AKT phosphorylation was considered as an important factor in antiapoptotic mechanism. In our current study, we also found that knockdown of FSIP1 expression inhibited levels of p-PI3K and p-AKT in T24 cells. Subsequently, level of Bcl-2 was reduced and Bax and cleavage of caspase-3 were induced, all of which indicate that knockdown of FSIP1 expression induced tumor cell apoptosis via the inactivation of the PI3K/AKT pathway; however, further study is needed to confirm whether knockdown or specific inhibitors of PI3K/p-AKT pathway genes can abolish apoptosis in this experimental setting. As we know, Bcl2 is an antiapoptotic protein and members of this family of proteins have vital regulatory effect in altering cell apoptosis.39 In contrast, Bax is a proapoptotic protein and Caspase-3 activation is an important marker of cell apoptosis.40
Conclusion
Our current study was just a proof-of-principle to demonstrate that FSIP1 was highly expressed in bladder cancer cells and that knockdown of FSIP1 significantly decreased tumor cell proliferation and induced apoptosis in vitro. Knockdown of FSIP1 expression also suppressed formation and growth of bladder cancer cell xenografts in nude mice. Our data suggest that knockdown of FSIP1 also inhibited activation of the PI3K/AKT pathway. FSIP1 stimulates the PI3K/AKT signaling to promote tumor growth and inhibit tumor cell apoptosis. Future investigation will be performed to assess therapeutic potential using this lentivirus carrying FSIP1 shRNA in bladder cancer.
Disclosure
The authors report no conflicts of interest in this work.
References
Li HT, Duymich CE, Weisenberger DJ, Liang G. Genetic and epigenetic alterations in bladder cancer. Int Neurourol J. 2016;20(Suppl):S84–S94. | ||
Antoni S, Ferlay J, Soerjomataram I, Znaor A, Jemal A, Bray F. Bladder cancer incidence and mortality: a global overview and recent trends. Eur Urol. 2017;71(1):96–108. | ||
Verdoorn BP, Kessler ER, Flaig TW. Targeted therapy in advanced urothelial carcinoma. Oncology (Williston Park). 2013;27(3):219–226. | ||
Kamat AM, Hahn NM, Efstathiou JA, et al. Bladder cancer. Lancet. 2016;388(10061):2796–2810. | ||
Zhao M, He XL, Teng XD. Understanding the molecular pathogenesis and prognostics of bladder cancer: an overview. Chin J Cancer Res. 2016;28(1):92–98. | ||
Milojevic B, Dzamic Z, Kajmakovic B, Milenkovic Petronic D, Sipetic Grujicic S. Urothelial carcinoma: recurrence and risk factors. J BUON. 2015;20(2):391–398. | ||
Sonpavde G, Jones BS, Bellmunt J, Choueiri TK, Sternberg CN. Future directions and targeted therapies in bladder cancer. Hematol Oncol Clin North Am. 2015;29(2):361–376. | ||
Anghel RM, Gales LN, Trifanescu OG. Outcome of urinary bladder cancer after combined therapies. J Med Life. 2016;9(2):153–159. | ||
Solomon JP, Hansel DE. Morphologic and molecular characteristics of bladder cancer. Surg Pathol Clin. 2015;8(4):663–676. | ||
Urquidi V, Goodison S, Cai Y, Sun Y, Rosser CJ. A candidate molecular biomarker panel for the detection of bladder cancer. Cancer Epidemiol Biomarkers Prev. 2012;21(12):2149–2158. | ||
Lambrou GI, Adamaki M, Delakas D, Spandidos DA, Vlahopoulos S, Zaravinos A. Gene expression is highly correlated on the chromosome level in urinary bladder cancer. Cell Cycle. 2013;12(10):1544–1559. | ||
Rodrigues D, Jerónimo C, Henrique R, et al. Biomarkers in bladder cancer: a metabolomic approach using in vitro and ex vivo model systems. Int J Cancer. 2016;139(2):256–268. | ||
Jones RT, Felsenstein KM, Theodorescu D. Pharmacogenomics: biomarker-directed therapy for bladder cancer. Urol Clin North Am. 2016;43(1):77–86. | ||
Costa-Pinheiro P, Montezuma D, Henrique R, Jerónimo C. Diagnostic and prognostic epigenetic biomarkers in cancer. Epigenomics. 2015;7(6):1003–1015. | ||
Zeegers MP, Tan FE, Dorant E, Van Den Brandt PA. The impact of characteristics of cigarette smoking on urinary tract cancer risk: a meta-analysis of epidemiologic studies. Cancer. 2000;89(3):630–639. | ||
Sun JW, Zhao LG, Yang Y, Ma X, Wang YY, Xiang YB. Obesity and risk of bladder cancer: a dose-response meta-analysis of 15 cohort studies. PLoS One. 2015;10(3):e0119313. | ||
Al-Zalabani AH, Stewart KF, Wesselius A, Schols AM, Zeegers MP. Modifiable risk factors for the prevention of bladder cancer: a systematic review of meta-analyses. Eur J Epidemiol. 2016;31(9):811–851. | ||
O’Brien T, Thomas K. Bladder cancer: photodynamic diagnosis can improve surgical outcome. Nat Rev Urol. 2010;7(11):598–599. | ||
Brown PR, Miki K, Harper DB, Eddy EM. A-kinase anchoring protein 4 binding proteins in the fibrous sheath of the sperm flagellum. Biol Reprod. 2003;68(6):2241–2248. | ||
Kim JY, Kim JH, Park TJ, et al. Positive association between aspirin-intolerant asthma and genetic polymorphisms of FSIP1: a case-case study. BMC Pulm Med. 2010;10:34. | ||
Zhang H, Luo M, Jin Z, et al. Expression and clinicopathological significance of FSIP1 in breast cancer. Oncotarget. 2015;6(12):10658–10666. | ||
Karagas MR, Andrew AS, Nelson HH, et al. SLC39A2 and FSIP1 polymorphisms as potential modifiers of arsenic-related bladder cancer. Hum Genet. 2012;131(3):453–461. | ||
Mao Y, Xu R, Liu X, Shi W, Han Y. Elevated fibrous sheath interacting protein 1 levels are associated with poor prognosis in non-small cell lung cancer patients. Oncotarget. 2017;8(7):12186–12193. | ||
Chapman KB, Prendes MJ, Kidd JL, Sternberg H, West MD, Wagner J. Elevated expression of cancer/testis antigen FSIP1 in ER-positive breast tumors. Biomark Med. 2013;7(4):601–611. | ||
Cappell KM, Sinnott R, Taus P, Maxfield K, Scarbrough M, Whitehurst AW. Multiple cancer testis antigens function to support tumor cell mitotic fidelity. Mol Cell Biol. 2012;32(20):4131–4140. | ||
Gjerstorff MF, Andersen MH, Ditzel HJ. Oncogenic cancer/testis antigens: prime candidates for immunotherapy. Oncotarget. 2015;6(18):15772–15787. | ||
Labhart P, Karmakar S, Salicru EM, et al. Identification of target genes in breast cancer cells directly regulated by the SRC-3/AIB1 coactivator. Proc Natl Acad Sci U S A. 2005;102(5):1339–1344. | ||
Won Jeong K, Chodankar R, Purcell DJ, Bittencourt D, Stallcup MR. Gene-specific patterns of coregulator requirements by estrogen receptor-α in breast cancer cells. Mol Endocrinol. 2012;26(6):955–966. | ||
Zhao W, Chang C, Cui Y, et al. Steroid receptor coactivator-3 regulates glucose metabolism in bladder cancer cells through coactivation of hypoxia inducible factor 1α. J Biol Chem. 2014;289(16):11219–11229. | ||
Sun M, Zhao W, Zeng Y, et al. Fibrous sheath interacting protein 1 overexpression is associated with unfavorable prognosis in bladder cancer: a potential therapeutic target. Onco Targets Ther. 2017;10:3949–3956. | ||
Maduri S. Applicability of RNA interference in cancer therapy: current status. Indian J Cancer. 2015;52(1):11–21. | ||
Buchholz CJ, Friedel T, Büning H. Surface-engineered viral vectors for selective and cell type-specific gene delivery. Trends Biotechnol. 2015;33(12):777–790. | ||
Oldham RA, Berinstein EM, Medin JA. Lentivial vectors in cancer immunotherapy. Immunotherapy. 2015;7(3):271–284. | ||
Croce CM, Reed JC. Finally, an apoptosis-targeting therapeutic for cancer. Cancer Res. 2016;76(20):5914–5920. | ||
Pistritto G, Trisciuoglio D, Ceci C, Garufi A, D’Orazi G. Apoptosis as anticancer mechanism: function and dysfunction of its modulators and targeted therapeutic strategies. Aging (Albany NY). 2016;8(4):603–619. | ||
Xu Y, Lv SX. The effect of JAK2 knockout on inhibition of liver tumor growth by inducing apoptosis, autophagy and anti-proliferation via STATs and PI3K/AKT signaling pathways. Biomed Pharmacother. 2016;84:1202–1212. | ||
Danielsen SA, Eide PW, Nesbakken A, Guren T, Leithe E, Lothe RA. Portrait of the PI3K/AKT pathway in colorectal cancer. Biochim Biophys Acta. 2015;1855(1):104–121. | ||
Wang T, Gong X, Jiang R, Li H, Du W, Kuang G. Ferulic acid inhibits proliferation and promotes apoptosis via blockage of PI3K/AKY pathway in osteosarcoma cell. Am J Transl Res. 2016;8(2):968–980. | ||
Schenk RL, Strasser A, Dewson G. BCL-2: long and winding path from discovery to therapeutic target. Biochem Biophys Res Commun. 2017;482(3):459–469. | ||
Juraver-Geslin HA, Durand BC. Early development of the neural plate: new roles for apoptosis and for one of its main effectors caspase-3. Genesis. 2015;53(2):203–224. |
 © 2018 The Author(s). This work is published and licensed by Dove Medical Press Limited. The full terms of this license are available at https://www.dovepress.com/terms.php and incorporate the Creative Commons Attribution - Non Commercial (unported, v3.0) License.
By accessing the work you hereby accept the Terms. Non-commercial uses of the work are permitted without any further permission from Dove Medical Press Limited, provided the work is properly attributed. For permission for commercial use of this work, please see paragraphs 4.2 and 5 of our Terms.
© 2018 The Author(s). This work is published and licensed by Dove Medical Press Limited. The full terms of this license are available at https://www.dovepress.com/terms.php and incorporate the Creative Commons Attribution - Non Commercial (unported, v3.0) License.
By accessing the work you hereby accept the Terms. Non-commercial uses of the work are permitted without any further permission from Dove Medical Press Limited, provided the work is properly attributed. For permission for commercial use of this work, please see paragraphs 4.2 and 5 of our Terms.