Back to Journals » OncoTargets and Therapy » Volume 13
KNDC1 Is a Predictive Marker of Malignant Transformation in Borderline Ovarian Tumors
Authors Yu S, Shen J, Fei J, Zhu X, Yin M, Zhou J
Received 15 July 2019
Accepted for publication 24 December 2019
Published 23 January 2020 Volume 2020:13 Pages 709—718
DOI https://doi.org/10.2147/OTT.S223304
Checked for plagiarism Yes
Review by Single anonymous peer review
Peer reviewer comments 2
Editor who approved publication: Prof. Dr. Nicola Silvestris
Shuqian Yu,1,* Jiayu Shen,2,* Jing Fei,2 Xiaoqing Zhu,2 Meichen Yin,2 Jianwei Zhou2
1Department of Gynecology, Tongde Hospital of Zhejiang Province, Hangzhou, Zhejiang 310012, People’s Republic of China; 2Department of Gynecology, The Second Affiliated Hospital, College of Medicine, Zhejiang University, Hangzhou, Zhejiang 310051, People’s Republic of China
*These authors contributed equally to this work
Correspondence: Jianwei Zhou
Department of Gynecology, The Second Affiliated Hospital, College of Medicine, Zhejiang University, Hangzhou, Zhejiang 310051, People’s Republic of China
Tel/Fax +86 571-87783128
Email [email protected]
Background: Few screening markers for malignant transformation in borderline ovarian tumors (BOT) have been clearly established. The kinase noncatalytic C-lobe domain containing 1 (KNDC1), a brain-specific Ras guanine nucleotide exchange factor, negatively regulates dendrite growth. However, the biological role and underlying mechanism of KNDC1 in human cancers, including ovarian cancer (OC), remain unknown.
Methods: Gene chip screening was used to detect the expression of KNDC1 mRNA in normal ovarian tissues, BOT tissues, and OC tissues. And results were further validated by RT-qPCR, Western blotting and immunohistochemistry. KNDC1 overexpression and knockdown ovarian cancer cells were established to study the possible pathways that KNDC1 was involved. The effects of KNDC1 on the malignant behaviors of ovarian tumors were also investigated both in vitro and in vivo.
Results: We observed that the expression of KNDC1 mRNA and KNDC1 protein in OC was significantly downregulated compared with BOT. Subsequent investigation revealed that knockdown of KNDC1 enhanced the proliferation of ovarian cancer cells in vitro via induction of ERK1/2 phosphorylation, whereas reinforcing the expression of KNDC1 attenuated the ERK1/2 activity. Similarly, knockdown of KNDC1 also promoted cell proliferation in vivo. Survival analysis showed that lower KNDC1 predicted a poor progression-free survival (PFS) for patients.
Conclusion: Collectively, we conclude that KNDC1 might function as a tumor suppressor in ovarian tumors, inhibiting the proliferation of ovarian cells by suppressing ERK1/2 activity and hindering the malignant transformation of BOT.
Keywords: KNDC1, borderline ovarian tumor, ovarian cancer, tumor marker, malignant transformation
Introduction
Ovarian cancer (OC) is the most lethal disease among gynecologic malignancies. Due to a lack of representative symptoms, sensitive screening and diagnostic approaches at an early stage, more than 70% of OC patients are diagnosed at an advanced stage (FIGO stage III or IV).1 The standard therapy for OC remains cytoreductive surgery and postoperative adjuvant chemotherapy. Despite the improvements in patient outcome with this combined treatment, the 5-year survival rate for patients with stage III-IV OC remains below 30% owing to frequent recurrence and poor prognosis.1,2 In contrast, the 5-year survival rate of patients diagnosed with stage I or II can be as high as 90%.3 Borderline ovarian tumor (BOT) is a rare neoplasm of low malignant potential, which is managed differently than high-grade carcinomas. BOT is characterized by slow progression and often presents at an early stage with no interstitial infiltration, exhibiting an intermediate behavior different from malignant ovarian cancer. BOT is generally managed with surgery, and chemotherapy is not necessary in most cases. BOT has a favorable overall prognosis, with a 5-year survival rate of 95%-97% for patients at stage I and 65%-87% for patients at stage II-II.4–6 However, due to the similarity in clinical manifestations of BOT and stage I OC, neither manifestation makes possible the distinction between BOT and stage I OC.7–9 While pathological examination is the gold standard for diagnosis of ovarian masses, it is difficult to accurately identify BOT based on merely intraoperative frozen section analysis, owing to limited sampling or misinterpretation.5,10 Therefore, BOT is usually overtreated due to being misdiagnosis as OC, whereas the misinterpretation of OC as BOT can result in incomplete operation, need for secondary surgery, and possible tumor spreading.10,11
Previous studies have presented a few screening markers for BOT and OC. For instance, it has been shown that there are remarkable differences in the protein levels of osteopontin12,13 and YKL-4014 between BOT and OC, suggesting their use as potential biomarkers for distinction between BOT and OC. Mutations in genes BRCA1 and BRCA2 are considered crucial biomarkers for the prognostic and predictive value in OC.15,16 However, the insufficient specificity and sensitivity restricts their clinical application. Therefore, it is important to develop new, effective, sensitive, and specific approaches in the diagnosis and treatment of ovarian masses.
Here, using gene chip sequencing, we found that the expression of KNDC1 in OC was significantly downregulated compared with BOT, indicating that KNDC1 might be a novel biomarker for the distinction between BOT and OC.
Materials and Methods
Tissue Collection
This study used 51 fresh clinical specimens, including 13 normal ovarian tissues, 14 BOT tissues, and 24 OC tissues, which were all obtained from the Second Affiliated Hospital, College of Medicine, Zhejiang University, between January 2005 to December 2011. All the tissue specimens were obtained immediately after surgery and frozen at −80°C. Seven paraffin-embedded tissue sections (including 3 BOT tissues and 4 OC tissues) were obtained from the Department of Pathology in the same hospital during January 2013 to June 2016. The inclusion criteria are listed below. All the patients were newly diagnosed and had neither radiotherapy nor chemotherapy before surgery. The pathological diagnosis was confirmed by a pathologist. All the specimens were selected by gynecological oncologists. Patients who were ever subjected to chemotherapy or radiotherapy before surgery, or those who had other tumors as well, were excluded from this study.
Ethics Statements
We verify that all the methods were performed in accordance with the relevant guidelines. All laboratory animal procedures were performed strictly in accordance with the Guidelines for the Management and Use of Laboratory Animals, and approved by the Animal Management and Use Committee of the Second Affiliated Hospital, College of Medicine, Zhejiang University. In accordance with the Declaration of Helsinki, written Informed consent was obtained from all participants prior to their inclusion in the study. Clinical specimens used in this study were approved for use by the Ethics Committee of the Second Affiliated Hospital, College of Medicine, Zhejiang University.
Gene Chip Scanning
Total RNA was extracted from three samples each of normal ovarian tissues, BOT tissues and OC tissues, and reverse transcribed into double-stranded cDNA. Labeled with cyanine-3-CTP, cRNA was hybridized onto the microarray (Agilent SurePrint G3 Human Gene Expression v3, ID:072363). After elution, an Agilent Scanner G2505C was used to scan the microarray, and raw data were normalized and processed to screen for differentially expressed genes (screening criteria: upregulation or downregulation fold change ≥2.0 and P value ≤0.05). This assay was conducted by the OE Biotech Company (Shanghai, China).
Cells and Cell Culture
Human OC cell lines (A2780, 3AO and CaoV3) and human embryonic kidney cell line (293T) were purchased from the Biological Sciences division of the Chinese Academy of Sciences (Shanghai, China). Normal ovarian cell line (IOSE) was purchased from Shanghai Huiying Biological Technology Co. Ltd. (Shanghai, China). A2780 and 3AO lines were cultured in RPMI-1640 medium (Corning, NY, USA), and CaoV3, 293T and IOSE lines were cultured in DMEM medium (Corning, NY, USA). All the media were supplemented with 100 IU/mL gentamycin and 10% fetal bovine serum (Hyclone, Logan, UT, USA). All the cells were cultured at 37°C in a humidified atmosphere containing 95% air and 5% CO2.
Western Blotting
Cells were harvested with trypsin, washed twice with PBS, and lysed using lysis buffer (containing 10 µL/mL NP-40, 2.5 mg/mL deoxycholic acid, 1:100 protease inhibitor, and 1:100 phosphorylase inhibitor) on ice for 30 mins. The samples were then centrifuged at 13,300 rpm for 10 mins. Tissues were cut as finely as possible, ground for 15 mins, and lysed for 30 mins on ice, followed by centrifugation at 13,300 rpm for 10 mins. After separation by 10% SDS-PAGE (sodium dodecylsulphate-polyacrylamide gel electrophoresis), the protein extracts were transferred to polyvinylidene fluoride (PVDF) membranes. The membranes were blocked with 5% FBS at room temperature (RT) for 1 hr, and then incubated for overnight at 4°C with appropriate primary antibody as follows: anti-KNDC1 (1:1000, Life-span Biosciences, Seattle, WA, USA), anti-β-tubulin (1:1000, Abcam, Cambridge, MA, USA), anti-GAPDH (1:1000, Kangchen Biotech, Shanghai, China), antibodies involved in signaling pathway (1:1000, Cell Signaling Technology, Danvers, MA, USA) including anti-ERK1/2, anti-p-ERK1/2, anti-p38, anti-p-p38, anti-SAPK/JNK, and anti-p-SAPK/JNK. After washing 5 times with Tris-buffered saline containing Tween-20, membranes were incubated with secondary mouse or rabbit IgG antibodies (1:3000, Kangchen Biotech, Shanghai, China) at RT for 1 hr. Finally, ECL (Electrochemiluminescence, Millipore, Darmstadt, Germany) was used to visualize the bands and autoradiograms were captured by Bio-Rad software. ImageJ software was applied to measure the optical density of individual bands.
Reverse-Transcription Quantitive Polymerase Chain Reaction (RT-qPCR)
Total RNA was extracted from collected tissues with TRIzol (Invitrogen, Carlsbad, CA, USA) and reverse transcribed to cDNA using the Takara 1st Strand cDNA kit (Takara, Tokyo, Japan), according to the manufacturer’s instructions. RT-qPCR was performed with Premix Ex Taq (Takara, Tokyo, Japan). GAPDH was used as a housekeeping control. Expression level of KNDC1 and GAPDH was calculated according to the 2−ΔΔCt method. Primer sequences for KNDC1 were as follows: 5ʹ-CTTTGGAGCGCTGCAGGATG-3ʹ (forward), 5ʹ-CTTCCGGGCCTCAGAGTCTC-3ʹ (reverse), 5ʹ-FAM-CGGCCTCCTGGGCCCAGCGT-TAMRA-3ʹ (probe). The primer sequences for GAPDH were as follows: 5ʹ-ATCATCCCTGCCTCTACTGG-3ʹ (forward), 5ʹ-GTCAGGTCCACCACTGACAC-3ʹ (reverse), 5ʹ-FAM-ACCTTGCCCACAGCCTTGGC-TAMRA-3ʹ (probe). All the primers were synthesized by Sangon Biotech company (Shanghai, China).
Plasmid Transformation and Lentiviral Infections
For KNDC1 overexpression, KNDC1 plasmid (GeneCopoeia, Rockville, MD, USA) and blank plasmid (GeneCopoeia, Rockville, MD, USA) were transformed into Escherichia coli cells, and then the cells were selected with 100 µg/mL neomycin. After extraction and purification, the plasmids were transfected into 293T cells using Lipofectamine 3000 reagent (Invitrogen, Carlsbad, CA, USA) when the 293T cells reached 70% confluence, and the cells were harvested 48 hrs after transfection for further experiments. For KNDC1 knockdown, 3AO cells were infected with KNDC1 shRNA (h) lentiviral particles (Santa Cruz Biotechnology, Inc., Dallas, Texas, USA) or Control shRNA (h) lentiviral particles-A (Santa Cruz Biotechnology, Inc., Dallas, Texas, USA). The cells were selected with 9 µg/mL puromycin for 7 d, and KNDC1 knockdown efficiency was verified by Western blotting.
Immunohistochemistry
Paraffin-embedded tissue sections were baked at 60°C for 20 mins. After being fully hydrated with xylene and gradient alcohol, the sections were heated in antigen-recovered solution (pH 8.0, 100 mM EDTA) for 30 mins and then cooled to RT. Subsequently, the sections were incubated in 3% hydrogen peroxide at RT for 15 mins, blocked with TBS containing 10% fetal bovine serum and 1% BSA for 1 hr, and then incubated for overnight at 4°C with primary antibody anti-KNDC1 (Abcam, Cambridge, MA Office, USA). The next day, the sections were incubated with biotin-labeled sheep anti-rabbit IgG antibody at RT for 30 mins, and then with HRP streptavidin solution at RT for 30 mins. Finally, DAB solution was added to sections, which were then counterstained with hematoxylin. PBS was used as a negative control.
Luciferase Reporter Assay
A pNF-κB-Luc plasmid was co-transfected with the pRL-TK plasmid into 3AO cells using Lipofectamine 3000. After 48 hrs, the luciferase reporter assay was performed using the Dual-Luciferase Reporter Assay System (Promega, Madison, WI, USA).
MTS Assay
After being cultured in serum-free medium for 24 hrs, the cells were diluted to a density of 7.5×10⁴/mL with 10% FBS medium, and plated in 96-well plates at 100 μL/well. After being cultured for 24, 48, or 72 hrs, the cells were incubated with 20 µL MTS (Promega, Madison, WI, USA) at 37°C for 4 hrs. The absorbance at 490 nm was recorded for each well.
Animal Tumor Model
Female Balb/c nude mice were purchased from Shanghai Laboratory Animal Center (Chinese Academy of Sciences) and bred in a SPF environment. The mice were randomly divided into groups and subcutaneously inoculated in the dorsal side of the right forelimb with 1 × 10⁶ cells of 3AO cells stably infected with KNDC1 shRNA or control shRNA. The major axis (a) and minor axis (b) of the transplanted tumors were measured every 7 days after inoculation, and tumor volumes were calculated as v=ab2/2. The transplanted tumors were weighed after 35 days.
Bioinformatics Analyses
The Oncomine database (http://www.oncomine.org/) was used to download KNDC1 mRNA expression datasets for comparing the levels of KNDC1 mRNA expression between OC tissues and BOT tissues.17 The Kaplan–Meier plot database (http://www.kmplot.com) was used to analyze the association between the expression level of KNDC1 and progression-free survival of patients with ovarian cancer.18 The cutoff value of high or low expression of KNDC1 is median based on the expression range of KNDC1 which is previously normalized. Namely, greater than or equal to median is thought to be high KNDC1 expression, conversely, less than median is thought to be low KNDC1 expression.
Statistical Analysis
All data are presented as mean ± SD of triplicate experiments and were analyzed by SPSS 20.0 (SPSS Inc., Chicago, IL, USA). The statistical significance of differences between groups was assessed by one-way ANOVA or Student’s t-test. P < 0.05 was considered statistically significant.
Results
KNDC1 Is an Important Molecule to Identify BOT and OC
To screen for a novel molecular marker of ovarian tumor, we analysed the gene expression in three samples each of normal ovary tissues, BOT tissues, and OC tissues using gene microarrays. The results showed that KNDC1 and DDX43 were the only two candidates whose mRNA expression apparently downregulated in the OC group compared with that in normal ovary and BOT groups (Figure 1A). Notably, recent studies indicate that KNDC1 serves as a key role in cellular senescence and carcinogenesis. Therefore, we chose KNDC1 for subsequent study. Furthermore, the same results were confirmed again in the experiment with increased sample size using RT-qPCR analysis, including 13 normal ovarian tissues, 14 BOT tissues, and 24 OC tissues (Figure 1B). Two independent datasets in the Oncomine database (http://www.oncomine.org/) indicated that KNDC1 mRNA expression in OC was remarkably reduced compared with that in BOT (Figure 1C–F).19,20 To further support the bioinformatic results, Western blotting was conducted to assess the expression of KNDC1 protein in five BOT and four OC specimens. Compared with the BOT group, the expression level of KNDC1 protein was markedly reduced in the OC group (Figure 2A and B). In addition, IHC assays also showed that the KNDC1 expression in OC tissues was prominently lower than that in the BOT tissues, and that the KNDC1 protein was localized mainly in the cytoplasm of cancer cell (Figure 2C). These results suggested that KNDC1 can serve as an important marker for the identification of OC and BOT.
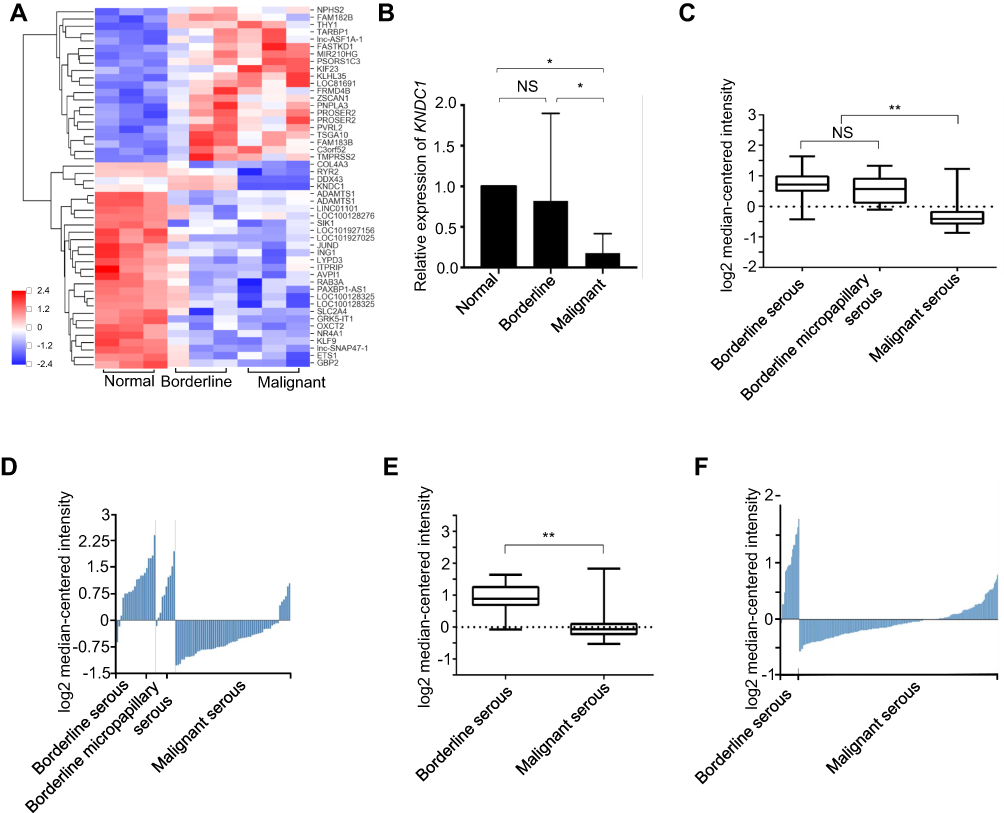 |
Figure 1 The KNDC1 mRNA expression is downregulated in OC tissues. Notes: (A) Gene chip screening was performed in three specimens each of normal ovary tissues, BOT tissues, and OC tissues. (B) RT-qPCR was performed to determine the KNDC1 mRNA expression with increased sample size in 13 normal ovary tissues, 14 BOT tissues, and 24 OC tissues (*P<0.05, ANOVA). (C and D) The Oncomine database was used to analyze KNDC1 mRNA expression in ovarian tumors, and the results showed that KNDC1 mRNA expression in serous OC was significantly downregulated compared with serous BOT and serous micropapillary BOT from Anglesio et al in the Oncomine database (n=20, 10, 60) (**P<0.01, Student’s t-test). (E and F) KNDC1 mRNA expression in serous OC was markedly downregulated in comparison to serous BOT, based on data from Tothill et al (n=18, 208) (**P<0.01, Student’s t-test). Abbreviation: NS, no significance. |
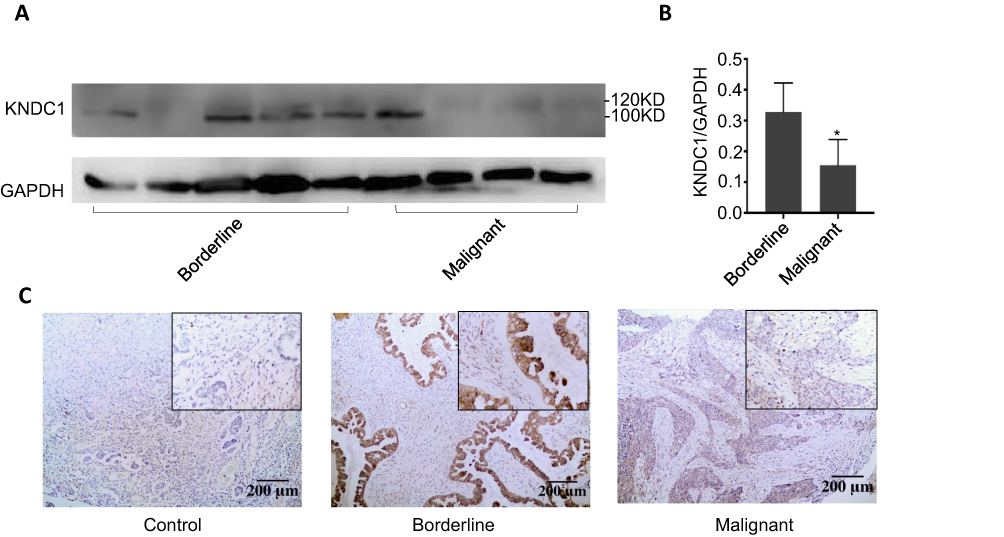 |
Figure 2 Characterization of KNDC1 protein expression in ovarian tumor tissues. Notes: (A and B) Western blotting was used to detect KNDC1 protein expression in BOT tissues and OC tissues (*P<0.05, Student’s t-test). (C) IHC staining was performed to measure KNDC1 protein expression in BOT tissues and OC tissues, along with a negative control (100X, 200X). |
KNDC1 Inhibits the Proliferation of Ovarian Cancer Cells
To elucidate the role of KNDC1 in malignant behavior of OC cells, we first evaluated the expression level of KNDC1 protein in three OC cell lines (3AO, A2780 and CaoV3) (Figure 3A). Considering the states of those cells, we infected 3AO cells with KNDC1 shRNA to knockdown KNDC1 or with control shRNA to build control sets for further analysis. Significant downregulation of KNDC1 was observed in KNDC1-knockdown cells using Western blotting, confirming the efficacy of gene knockdown (Figure 3B). MTS assays indicated that KNDC1 knockdown remarkably facilitated cell proliferation at 24, 48 and 72 hrs (Figure 3C). These results showed that KNDC1 might inhibit the proliferation of ovarian cancer cells.
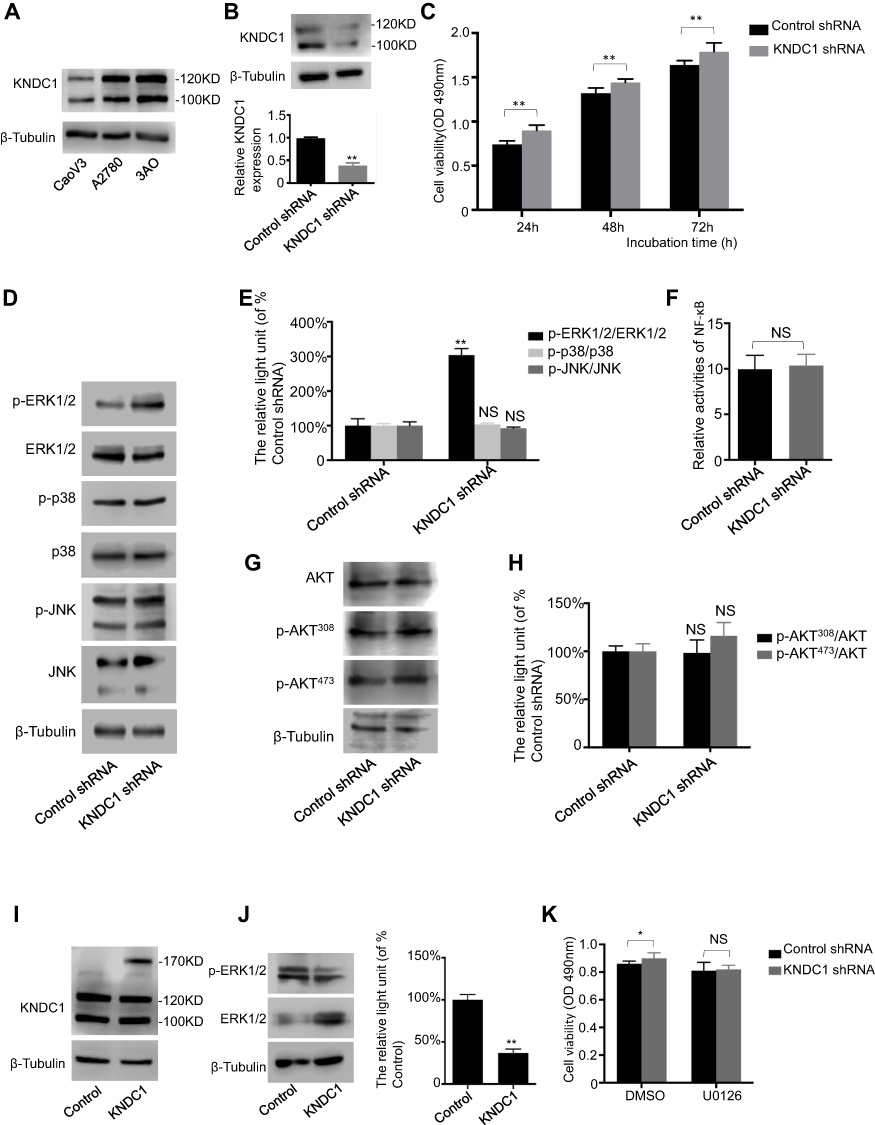 |
Figure 3 KNDC1 inhibits proliferation of ovarian cancer cells via the ERK1/2 pathway. Notes: (A) KNDC1 protein expression in CaoV3, A2780, and 3AO cells. (B) KNDC1 protein expression in 3AO cells stably infected with KNDC1 shRNA or control shRNA examined by Western blot (**P < 0.01, Student’s t-test). (C) MTS assay was conducted to determine cell proliferation in 3AO cells (**P<0.01, Student’s t-test). (D and E) Western blot was carried out to examine ERK1/2, p-ERK1/2, p38, p-p38, JNK, and p-JNK protein expression in 3AO cells (**P<0.01, Student’s t-test). (F) Luciferase reporter assay was performed by co-transfecting pNF-κB-Luc plasmid with pRL-TK plasmid into 3AO cells, and the relative luciferase activity did not change after KNDC1 knockdown (Student’s t-test). (G and H) Expression levels of AKT, p-AKT308 and p- AKT473, as examined by Western blot analysis (Student’s t-test). (I) Detection of KNDC1 in KNDC1-expressing cells. Western blot was performed to examine KNDC1 protein expression in 293T cells stably transfected with plasmid to overexpress KNDC1, and with blank plasmid as control. (J) Expression levels of ERK1/2 and p-ERK1/2, as detected by Western blot analysis in 293T cells (**P<0.01, Student’s t-test). (K) MTS assay was conducted to determine cell proliferation in 3AO cells. U0126 significantly reversed the KNDC1 knockdown-mediated promotion of proliferation (*P<0.05, Student’s t-test). Abbreviation: NS, no significance. |
KNDC1 Inhibits the Development of OC via the ERK1/2 Pathway
Studies have indicated an association of ERK1/2 phosphorylation with knockdown of KNDC1. Therefore, further investigation was conducted to determine if the MAPK pathway is involved in KNDC1 downregulation. Western blotting results revealed that the phosphorylation of ERK1/2, instead of p38 or JNK, was significantly upregulated in response to KNDC1 knockdown (Figure 3D and E), while the activity of NF-κB was not affected by KNDC1, as indicated by the luciferase reporter assay (Figure 3F). In addition, Western blot analysis revealed no difference in the expression levels of AKT pathway-related molecules between KNDC1-knockdown cells and the control group (Figure 3G and H). Subsequently, we transfected 293T cells with plasmids expressing KNDC1, and Western blotting analysis indicated that KNDC1 expression was markedly upregulated (Figure 3I), whereas p-ERK1/2 expression was observably downregulated, in KNDC1-overexpressing cells compared with the control group (Figure 3J). Finally, to further confirm the function of KNDC1, the MEK inhibitor U0126 was used to pretreat cells. MTS assays showed that the difference between the KNDC1 knockdown group and the control group lost its statistical significance, indicating that U0126 reversed KNDC1-knockdown-mediated promotion of proliferation (Figure 3K). Furthermore, a normal ovarian cell line IOSE and cancer cell line 3AO were used to evaluate the level of ERK1/2 activation, and result showed a higher expression of p-ERK1/2 in 3AO (Figure S1). These results showed that KNDC1 might inhibit the proliferation of OC through suppression of the ERK1/2 pathway, affecting the tumorigenesis and development of OC.
KNDC1 Acts as a Tumor Suppressor Gene in Ovarian Cancer
The above results demonstrated there was a strong negative correlation between the expression of KNDC1 and the proliferation of OC in vitro. Therefore, we explored whether KNDC1 affected the tumorigenesis of OC in vivo. 3AO cells stably transfected with KNDC1 shRNA or control shRNA were inoculated into nude mice. Thirty-five days after the injection, the results showed that both the volume and weight of subcutaneous transplanted tumors had increased significantly in the KNDC1 shRNA group compared with the control group (Figure 4A-D). Moreover, we further studied the association between the expression of KNDC1 and the prognosis of patients with OC, using the online Kaplan-Meier plot software (http://www.kmplot.com) in two independent datasets, and found that patients with higher KNDC1 expression levels exhibited longer progression-free survival (PFS) (Figure 4E and F).20,21 All these findings indicated that KNDC1 might play a role as a tumor suppressor gene in OC.
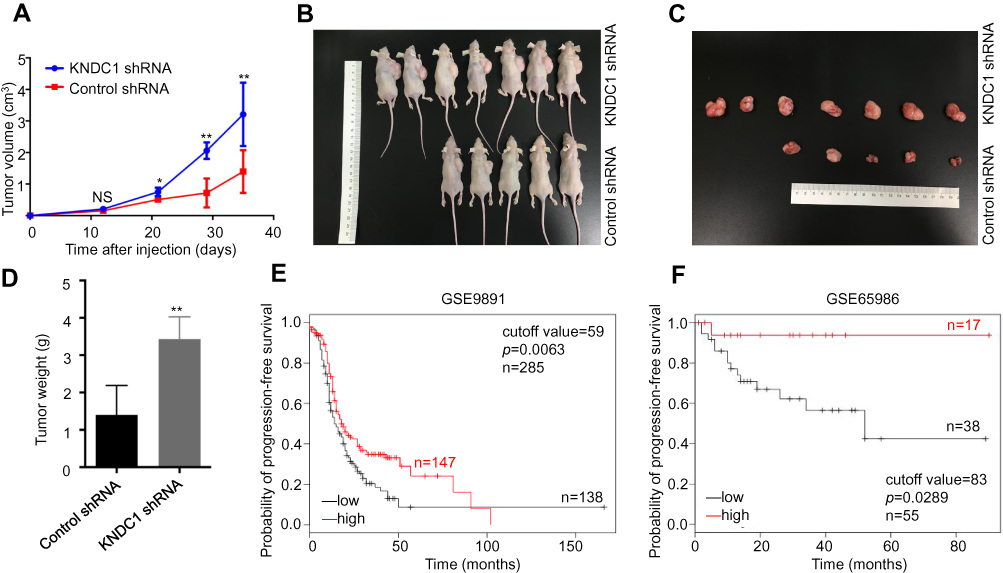 |
Figure 4 KNDC1 may act as a tumor suppressor gene in ovarian cancer. Notes: (A–C) Tumorigenicity of KNDC1 in mice. Nude mice were inoculated with 3AO cells stably infected with KNDC1 shRNA or control shRNA. Tumor volumes were calculated every 7 d (*P<0.05, **P<0.01, Student’s t-test). (D) At 35 d after inoculation, tumor weights were recorded (**P<0.01, Student’s t-test). (E and F) Longer progression-free survival was significantly correlated with high KNDC1 expression levels in OC. Using Kaplan–Meier plot database, we performed bioinformatic analysis: low KNDC1 expression is denoted in black, and high KNDC1 expression is denoted in red. Abbreviation: NS, no significance. |
Discussion
KNDC1(v-KIND) is a brain-specific Ras guanine nucleotide exchange factor that was first discovered in 2005. It is found in dendrites, guanine nucleotide exchange factor complexes, and neuronal cell bodies. KNDC1 is localized at chromosome 10q26.3 and has two isoforms, KIND1 and KIND2.22 Previous studies have indicated that KNDC1 is a putative protein-protein interaction module that participates in several signaling pathways related to crucial biological processes. For example, studies showed that knockdown or inhibition of KNDC1 promote the growth of cerebellar granule cells and neuron dendrites, suggesting that KNDC1 is a signaling molecule related to the development, regulation, and restriction of cell growth.23,24 Likewise, some studies showed that the expression levels of both KNDC1 mRNA and KNDC1 protein were upregulated in senescent human umbilical vein endothelial cells (HUVECs), indicating that overexpression of KNDC1 probably inhibits their proliferation and promotes senescence.25,26 These data suggest that KNDC1 serves a key role in cellular regulation. However, no previous studies have focused on the role of KNDC1 in the tumors, especially its relationship with gynecological diseases. To our knowledge, our study is the first to analyze the association between KNDC1 expression and ovarian tumors, and we report that KNDC1 expression in OC was prominently decreased compared with that in normal ovaries and BOT, suggesting that KNDC1 may serve as an important tumor marker to distinguish OC from BOT, and act as a tumor suppressive molecule. In vitro and in vivo experiments further elucidated that deficiency of KNDC1 may cause malignant transformation of ovarian cells and promote the occurrence of ovarian cancers. Unfortunately, we were unable to directly analyze the relationship between KNDC1 expression and the prognosis of clinical patients with OC, owing to the lack of follow-up data. Instead, bioinformatics analyses were carried out, and the data showed a strong and positive correlation between the expression of KNDC1 and progression-free survival of OC patients. Therefore, we hypothesized that KNDC1 expression may serve as an independent factor for evaluating the prognosis of patients with OC, and that low expression of KNDC1 may be related to the severity of OC. However, the association between KNDC1 expression and clinical characteristics, such as ovarian cancer staging and pathology remains to be studied.
KNDC1 plays a crucial role in various signal transduction pathways that aid in protein recognition and functional regulation, likely related to the activity of Ras guanine nucleotide exchange factor (RasGEF) and Ser/Thr protein kinases.27 Mitogen-activated protein kinases (MAPKs) are a series of serine/threonine protein kinases with four main subfamilies, ERK1/2, JNK, p38 and ERK5, which are widely expressed in mammalian cells, participating in various important physiological and pathological processes.28–34 Activation of ERK1/2 has been testified to be involved in the tumorigenesis of several tumors.35–38 For instance, study showed that oxidative stress stimulated an ERK1/2-dependent phosphorylation of mixed lineage kinase 3 (MLK3), which promoted MLK3-dependent ERK1/2 activation, finally enhancing the invasion of colon cancer cells.36 In a case-control study, data showed that the expression levels of p-ERK1/2, p-c-Fos, and p-c-Jun proteins were positively correlated with those of folate receptor α (FRα) protein in cervical squamous cell carcinoma. And in vitro experiments further confirmed that FRα-dependent phosphorylation of ERK1/2, c-Fos, and c-Jun was involved in the progression of cervical cancer.37 Besides, another study also showed that the expression of ERK1/2 and p-ERK1/2 was apparently increased in earlier clinical stages and in lymphatic metastasis, suggesting that ERK1/2 may play a crucial role in cervical epithelial carcinogenesis.38 Taking together, KNDC1 may exert its function through regulation of the MAPK signaling pathway. Previous research showed that knockdown of KNDC1 can not only increase ERK phosphorylation but also inhibit the p53-p21-p16 transduction cascade to promote HUVEC proliferation, ultimately delaying cellular senescence in HUVECs.26 It has been reported that KNDC1 activity of Ras GEF by JNK1 and/or ERK via the Ras-Raf-MAPK pathway induces MAP2 phosphorylation and microtubule-binding activity, ultimately modulating the dendritic growth in neuronal cells.23 In accordance with the previous studies, our study demonstrated that knockdown of KNDC1 enhanced the proliferation of ovarian cancer cells in vitro and tumor growth in vivo, by inducing ERK1/2 phosphorylation. Furthermore, U0126, a MEK inhibitor, reversed the proliferation-promoting effects of ovarian cancer cells induced by KNDC1 knockdown, strongly supporting the results above. Based on these and previous studies, we hypothesize that, as a potential tumor-suppressive gene, KNDC1 may inhibit the proliferation of ovarian cancer cells by attenuating ERK1/2 activity, thereby playing a crucial role in delaying the malignant transformation of BOT. However, multiple pathways are involved in tumorigenesis, and the underlying mechanisms of regulation of the malignant behaviors of ovarian cancers by KNDC1 remain to be further clarified.
In summary, this study demonstrated that KNDC1 expression is significantly downregulated in OC compared with BOT, suggesting its potential as a diagnostic biomarker to differentiate between OC and BOT and to assist with intraoperative pathology diagnosis. As a putative suppressor of the ERK1/2 pathway, KNDC1 inhibits the proliferation of ovarian cancer cells and subsequently plays an important role in inhibiting the malignant transformation of BOT, which further supports our findings that KNDC1 may be a diagnostic biomarker to distinguish between OC and BOT. However, additional studies are needed to elucidate the specific mechanisms of KNDC1 participation in the process of malignant transformation of BOT, which may help clinicians identify new therapeutic modalities for ovarian tumor.
Acknowledgment
This work was supported by The National Natural Science Foundation of China (81371881).
Disclosure
The authors declare no conflicts of interest.
References
1. Siegel RL, Miller KD, Jemal A. Cancer statistics. CA Cancer J Clin. 2019;69:7–34. doi:10.3322/caac.21551
2. Bristow RE, Chang J, Ziogas A, et al. Impact of National Cancer Institute Comprehensive Cancer Centers on ovarian cancer treatment and survival. J Am Coll Surg. 2015;220(5):940–950. doi:10.1016/j.jamcollsurg.2015.01.056
3. Jayson GC, Kohn EC, Kitchener HC, Ledermann JA. Ovarian cancer. Lancet. 2014;384(9951):1376–1388. doi:10.1016/S0140-6736(13)62146-7
4. Skirnisdottir I, Garmo H, Wilander E, Holmberg L. Borderline ovarian tumors in Sweden 1960-2005: trends in incidence and age at diagnosis compared to ovarian cancer. Int J Cancer. 2008;123(8):1897–1901. doi:10.1002/ijc.v123:8
5. Fischerova D, Zikan M, Dundr P, Cibula D. Diagnosis, treatment, and follow-up of borderline ovarian tumors. Oncologist. 2012;17(12):1515–1533. doi:10.1634/theoncologist.2012-0139
6. Zanetta G, Rota S, Chiari S, Bonazzi C, Bratina G, Mangioni C. Behavior of borderline tumors with particular interest to persistence, recurrence, and progression to invasive carcinoma: a prospective study. J Clin Oncol. 2001;19(10):2658–2664. doi:10.1200/JCO.2001.19.10.2658
7. Exacoustos C, Romanini ME, Rinaldo D, et al. Preoperative sonographic features of borderline ovarian tumors. Ultrasound Obstet Gynecol. 2005;25(1):50–59. doi:10.1002/uog.1823
8. Karadag B, Kocak M, Kayikcioglu F, et al. Risk for malignant and borderline ovarian neoplasms following basic preoperative evaluation by ultrasonography, ca125 level and age. Asian Pac J Cancer Prev. 2014;15(19):8489–8493. doi:10.7314/APJCP.2014.15.19.8489
9. deSouza NM, O’Neill R, McIndoe GA, Dina R, Soutter WP. Borderline tumors of the ovary: CT and MRI features and tumor markers in differentiation from stage I disease. AJR Am J Roentgenol. 2005;184(3):999–1003. doi:10.2214/ajr.184.3.01840999
10. Shah JS, Mackelvie M, Gershenson DM, et al. Accuracy of intraoperative frozen section diagnosis of borderline ovarian tumors by hospital type. J Minim Invasive Gynecol. 2019;26(1):87–93. doi:10.1016/j.jmig.2018.04.005
11. Song T, Choi CH, Kim HJ, et al. Accuracy of frozen section diagnosis of borderline ovarian tumors. Gynecol Oncol. 2011;122(1):127–131. doi:10.1016/j.ygyno.2011.03.021
12. Zivny JH, Leahomschi S, Klener P
13. Kim JH, Skates SJ, Uede T, et al. Osteopontin as a potential diagnostic biomarker for ovarian cancer. JAMA. 2002;287(13):1671–1679. doi:10.1001/jama.287.13.1671
14. Hogdall EV, Ringsholt M, Hogdall CK, et al. YKL-40 tissue expression and plasma levels in patients with ovarian cancer. BMC Cancer. 2009;9:8. doi:10.1186/1471-2407-9-8
15. Oaknin A, Guarch R, Barretina P, et al. Recommendations for biomarker testing in epithelial ovarian cancer: a National Consensus Statement by the Spanish Society of Pathology and the Spanish Society of Medical Oncology. Clin Transl Oncol. 2018;20(3):274–285. doi:10.1007/s12094-017-1719-x
16. Bolton KL, Chenevix-Trench G, Goh C, et al. Association between BRCA1 and BRCA2 mutations and survival in women with invasive epithelial ovarian cancer. JAMA. 2012;307(4):382–390. doi:10.1001/jama.2012.20
17. Rhodes DR, Kalyana-Sundaram S, Mahavisno V, et al. Oncomine 3.0: genes, pathways, and networks in a collection of 18,000 cancer gene expression profiles. Neoplasia. 2007;9(2):166–180. doi:10.1593/neo.07112
18. Gyorffy B, Lanczky A, Szallasi Z. Implementing an online tool for genome-wide validation of survival-associated biomarkers in ovarian-cancer using microarray data from 1287 patients. Endocr Relat Cancer. 2012;19(2):197–208. doi:10.1530/ERC-11-0329
19. Anglesio MS, Arnold JM, George J, et al. Mutation of ERBB2 provides a novel alternative mechanism for the ubiquitous activation of RAS-MAPK in ovarian serous low malignant potential tumors. Mol Cancer Res. 2008;6(11):1678–1690. doi:10.1158/1541-7786.MCR-08-0193
20. Tothill RW, Tinker AV, George J, et al. Novel molecular subtypes of serous and endometrioid ovarian cancer linked to clinical outcome. Clin Cancer Res. 2008;14(16):5198–5208. doi:10.1158/1078-0432.CCR-08-0196
21. Uehara Y, Oda K, Ikeda Y, et al. Correction: integrated copy number and expression analysis identifies profiles of whole-arm chromosomal alterations and subgroups with favorable outcome in ovarian clear cell carcinomas. PLoS One. 2015;10(7):e0132751. doi:10.1371/journal.pone.0132751
22. Mees A, Rock R, Ciccarelli FD, et al. Very-KIND is a novel nervous system specific guanine nucleotide exchange factor for Ras GTPases. Gene Expr Patterns. 2005;6(1):79–85. doi:10.1016/j.modgep.2005.04.015
23. Huang J, Furuya A, Hayashi K, Furuichi T. Interaction between very-KIND Ras guanine exchange factor and microtubule-associated protein 2, and its role in dendrite growth–structure and function of the second kinase noncatalytic C-lobe domain. FEBS J. 2011;278(10):1651–1661. doi:10.1111/j.1742-4658.2011.08085.x
24. Hayashi K, Furuya A, Sakamaki Y, et al. The brain-specific RasGEF very-KIND is required for normal dendritic growth in cerebellar granule cells and proper motor coordination. PLoS One. 2017;12(3):e0173175. doi:10.1371/journal.pone.0173175
25. Ji J, Hao Z, Liu H, et al. Effect of KNDC1 overexpression on the senescence of human umbilical vein endothelial cells. Mol Med Rep. 2018;17(5):7037–7044. doi:10.3892/mmr.2018.8775
26. Zhang C, Zhen YZ, Lin YJ, et al. KNDC1 knockdown protects human umbilical vein endothelial cells from senescence. Mol Med Rep. 2014;10(1):82–88. doi:10.3892/mmr.2014.2201
27. Ciccarelli FD, Bork P, Kerkhoff E. The KIND module: a putative signalling domain evolved from the C lobe of the protein kinase fold. Trends Biochem Sci. 2003;28(7):349–352. doi:10.1016/S0968-0004(03)00116-6
28. Johnson GL, Lapadat R. Mitogen-activated protein kinase pathways mediated by ERK, JNK, and p38 protein kinases. Science. 2002;298(5600):1911–1912. doi:10.1126/science.1072682
29. Zhang W, Liu HT. MAPK signal pathways in the regulation of cell proliferation in mammalian cells. Cell Res. 2002;12(1):9–18. doi:10.1038/sj.cr.7290105
30. Burotto M, Chiou VL, Lee JM, Kohn EC. The MAPK pathway across different malignancies: a new perspective. Cancer. 2014;120(22):3446–3456. doi:10.1002/cncr.28864
31. Wagle N, Van Allen EM, Treacy DJ, et al. MAP kinase pathway alterations in BRAF-mutant melanoma patients with acquired resistance to combined RAF/MEK inhibition. Cancer Discov. 2014;4(1):61–68. doi:10.1158/2159-8290.CD-13-0631
32. Corcoran RB, Ebi H, Turke AB, et al. EGFR-mediated re-activation of MAPK signaling contributes to insensitivity of BRAF mutant colorectal cancers to RAF inhibition with vemurafenib. Cancer Discov. 2012;2(3):227–235. doi:10.1158/2159-8290.CD-11-0341
33. Hsu CY, Bristow R, Cha MS, et al. Characterization of active mitogen-activated protein kinase in ovarian serous carcinomas. Clin Cancer Res. 2004;10(19):6432–6436. doi:10.1158/1078-0432.CCR-04-0893
34. Sheppard KE, Cullinane C, Hannan KM, et al. Synergistic inhibition of ovarian cancer cell growth by combining selective PI3K/mTOR and RAS/ERK pathway inhibitors. Eur J Cancer. 2013;49(18):3936–3944. doi:10.1016/j.ejca.2013.08.007
35. Chang L, Karin M. Mammalian MAP kinase signalling cascades. Nature. 2001;410(6824):37–40. doi:10.1038/35065000
36. Schroyer AL, Stimes NW, Abisaab WF, Chadee DN. MLK3 phosphorylation by ERK1/2 is required for oxidative stress-induced invasion of colorectal cancer cells. Oncogene. 2018;37(8):1031–1040. doi:10.1038/onc.2017.396
37. Liu C, Ding L, Bai L, et al. Folate receptor alpha is associated with cervical carcinogenesis and regulates cervical cancer cells growth by activating ERK1/2/c-Fos/c-Jun. Biochem Biophys Res Commun. 2017;491(4):1083–1091. doi:10.1016/j.bbrc.2017.08.015
38. Chang H, Shi Y, Tuokan T, Chen R, Wang X. Expression of aquaporin 8 and phosphorylation of Erk1/2 in cervical epithelial carcinogenesis: correlation with clinicopathological parameters.. Int J Clin Exp Pathol. 2014;7(7):3928–3937.
 © 2020 The Author(s). This work is published and licensed by Dove Medical Press Limited. The
full terms of this license are available at https://www.dovepress.com/terms
and incorporate the Creative Commons Attribution
- Non Commercial (unported, 3.0) License.
By accessing the work you hereby accept the Terms. Non-commercial uses of the work are permitted
without any further permission from Dove Medical Press Limited, provided the work is properly
attributed. For permission for commercial use of this work, please see paragraphs 4.2 and 5 of our Terms.
© 2020 The Author(s). This work is published and licensed by Dove Medical Press Limited. The
full terms of this license are available at https://www.dovepress.com/terms
and incorporate the Creative Commons Attribution
- Non Commercial (unported, 3.0) License.
By accessing the work you hereby accept the Terms. Non-commercial uses of the work are permitted
without any further permission from Dove Medical Press Limited, provided the work is properly
attributed. For permission for commercial use of this work, please see paragraphs 4.2 and 5 of our Terms.