")
Back to Journals » Cancer Management and Research » Volume 11
KIF15 promotes bladder cancer proliferation via the MEK–ERK signaling pathway
Authors Zhao H, Bo Q, Wu Z, Liu Q, Li Y, Zhang N, Guo H, Shi B
Received 22 October 2018
Accepted for publication 7 January 2019
Published 26 February 2019 Volume 2019:11 Pages 1857—1868
DOI https://doi.org/10.2147/CMAR.S191681
Checked for plagiarism Yes
Review by Single anonymous peer review
Peer reviewer comments 2
Editor who approved publication: Dr Ahmet Emre Eşkazan
Hongda Zhao,* Qiyu Bo,* Zonglong Wu, Qinggang Liu, Yan Li, Ning Zhang, Hu Guo, Benkang Shi
Department of Urology, Qilu Hospital of Shandong University, Jinan, China
*These authors contributed equally to this work
Background: Bladder cancer (BC) is the most common cancer of the urinary tract and invariably predicts a poor prognosis. In this study, we found a reliable gene signature and potential biomarker for predicting clinical prognosis.
Methods: The gene expression profiles were obtained from the GEO database. By performing GEO2R analysis, numerous differentially expressed genes (DEGs) were found. Three different microarray datasets were integrated in order to more precisely identify up-expression genes. Functional analysis revealed that these genes were mainly involved in cell cycle, DNA replication and metabolic pathways.
Results: Based on protein-protein interactome (PPI) networks that were identified in the current study and previous studies, we focused on KIF15 for further study. The results showed that KIF15 promotes BC cell proliferation via the MEK -ERK pathway, and Kaplan‐Meier survival analysis revealed that KIF15 expression was an independent prognostic risk factor in BC patients.
Conclusion: KIF15 may represent a promising prognostic biomarker and a potential therapeutic option for BC.
Keywords: KIF15, bladder cancer, proliferation, MEK–ERK
Introduction
Globally, bladder cancer (BC) is considered one of the most serious cancers, it is the ninth most common cancer and has the 13th highest rate of mortality when compared with 81,190 newly diagnosed cases, and 17,240 BC-related deaths was estimated in the USA in 2018.1 In China, the annual incidence rate is 80.5/100,000, and the estimated mortality rate is 32.9/100,000.2 Although treatment for BC has improved in recent decades, there are still areas of unmet need, such as the short survival time of patients with invasive stage tumors or metastatic diseases. Many studies have shown that the progression of BC is associated with proliferation and invasion.3 The development of BC is a complex process initiated by accumulation of genetic and epigenetic alterations. Therefore, it is necessary to investigate the fundamental mechanisms of BC development to find effective therapeutic strategies leading to improved survival.
Gene expression profiling has been recognized as a useful tool to reveal the mechanism of tumor progression and for biomarker prediction.4,5 As the body of expression data in public databases grows, reanalysis and integration of these available data are more likely to provide novel clues for other researches. We screened for genes with abnormal overexpression in BC using public databases with three gene expression profile microarrays. In addition, we used a network and pathway-based approach to find novel molecular biomarkers of BC. Using this approach, we found that KIF15, a gene encoding a member of the kinesin family of proteins, may play a crucial role in BC proliferation.
The kinesin-12 family member KIF15 is a plus-end directed kinesin that localizes in a mitosis-specific manner to both spindle microtubules and chromosomes.6–9 Most proteins of KIF family own ATP-dependent activity and can drive microtubule-dependent plus-end movement.10 Kinesins participate in the transport of macromolecules in several essential cellular processes, such as mitosis and meiosis.11 Studies have demonstrated that kinesin proteins play critical roles in the genesis and development of human cancers.12,13 Some kinesin proteins are associated with drug resistance in malignancy.14 Thus, KIF15 may be a potential anticancer biomarker.
In this study, we demonstrate that KIF15 promotes BC proliferation by the MEK–ERK signaling pathway. Our results suggest that KIF15 plays an important role in BC progression and is a novel therapeutic strategy for BC.
Materials and methods
Microarray data
The gene expression profiles of GSE27448, GSE40355, and GSE42089 were obtained from the National Center of Biotechnology Information GEO database (GEO, http://www.ncbi.nlm.nih.gov/geo/). The GSE27448 expression profile, which was based on GPL2895 GE Healthcare/Amersham Biosciences CodeLink Human Whole Genome Bioarray, was submitted by Zaravinos et al. The GSE40355 profile, submitted by Hecker et al, was based on GPL8227 Agilent-019118 Human miRNA Microarray 2.0 G4470B and GPL13497 Agilent-026652 Whole Human Genome Microarray 4 × 44K v2. The GSE42089 expression profile, which was based on GPL9828 [HG-U133_Plus_2] Affymetrix Human Genome U133 Plus 2.0 Array, was submitted by Sherman et al.
Differential gene expression analysis
The gene expression data were analyzed with GCBI online software GEO2R (https://www.gcbi.com.cn/gclib/html/index) and R software (version 3.4.0; https://www.r-project.org/). Data on upexpression genes were used to construct a customized Venn diagram. Differential gene expression showing ≥2-fold change was tested for statistical significance using t-test and a defined P-value cutoff of <0.05.
Functional and pathway enrichment analysis of upexpression differentially expressed genes (DEGs)
In order to investigate upexpression DEGs at the molecular and functional level, we used an online database. The Database for Annotation Visualization and Integrated Discovery (DAVID) is a method to carry out analysis of Gene Ontology (GO) and Kyoto Encyclopedia of Genes and Genomes (KEGG); DAVID has been previously described.15–17 We used the human genome as the background, with P<0.05 considered statistically significant.
Protein–protein interactome (PPI) network construction and modules selection
Search Tool for the Retrieval of Interacting Genes (STRING) is an online database (http://www.string-db.org) that was used to evaluate the interactions between different proteins. In order to identify interaction functions between upexpression DEGs, we entered the genes into STRING for further analysis. The upexpression DEGs showing significant upregulation were imported into the Cytoscape plugin for network visualizations. Next, we performed module analysis via the MCODE plugin with the following default parameters: degree cutoff ≥2, node score cutoff ≥2, K-core ≥2, and max depth =100.
Cell culture and reagents
BC cell lines were purchased from the American Type Q6 Culture Collection (Manassas VA, USA). The cell lines T24 and 253J were maintained in Roswell Park Memorial Institute 1640 medium supplemented with 10% FBS (Sigma-Aldrich Co., St. Louis, MO, USA). The cells were incubated at 37°C and 5% CO2.
Synthesis of si RNA and transfection of cells
Bladder cells T24 and 253J were transfected with specific siRNAs targeting KIF15 (si-KIF15). The sequences of siRNAs were
siRNA1: 5′-GCGGUUAUAAUGGUACCAUTT-3′
siRNA2: 5′-GCUGGAAAGAGUUUCCUUUTT-3′
siRNA3: 5′-GGAUUUAGCAGGAUCUGAATT-3′
The siRNA were purchased from GenePharma (Suzhou, China). Untreated BC cells were cultured for 24 hours before transfection. Cells were transfected with siRNA (100 nM) complexes using Lipofectamine 2000 Transfection Reagent (Invitrogen, Carlsbad, CA, USA) according to the manufacturer’s instructions.
Cell proliferation assay
Briefly, 5×10³ cells/well were seeded into a 96-well plate and transfected with siRNA. Cell proliferation was assessed by using cell counting kit-8 (CCK-8) (Beyotime Institute of Biotechnology, Shanghai, China) after 24, 48, 72, 96, and 120 hours; absorbance was measured by ELISA microplate reader (Bio-Rad Laboratories Inc., Hercules, CA, USA). Ethynyl deoxyuridine (Edu) assay was performed by using an Edu Kit (Ribobio, Guangzhou, China) following the manufacturer’s instructions. Experiments were repeated three times.
Colony formation assay
Approximately 1,500 BC cells were seeded into 6-well dishes with medium. One week later, the cells were transfected with siRNA, and after 2 weeks, viable colonies >0.1 mm in diameter were stained with crystal violet and scored. Data are presented as the mean ± SD, and experiments were performed in triplicate.
Patients and immunohistochemical analysis
This study was conducted in accordance with the Declaration of Helsinki and was approved by the Committee Board of Shandong University Qilu Hospital (Jinan, China). Written informed consent was obtained from all 106 patients. The patients underwent radical cystectomy for BC, which was diagnosed by imageological and pathology examination at our institution from 2009 to 2014. Patients with missing information were excluded from this study. Patients with autoimmune disease or cancer in other systems or who received neoadjuvant chemotherapy and radiotherapy were also excluded from study. The specimens were used after obtaining informed consent from the patients and were stained according to the manufacturer’s protocol (Immunostain SP Kit, Dako-Cytomation). For immunohistochemistry staining, briefly, paraffin-embedded sections of BC tissues were deparaffinized and then heated in a pressure pot for 3 minutes to retrieve the antigens. Then, the sections were incubated with primary antibodies against KIF15 (Proteintech, Rosemont, IL, USA) overnight at 4°C. Antibody binding was detected using a peroxidase-conjugated secondary antibody at 37°C for 30 minutes. A 3,3′-diaminobenzidine substrate kit was used to perform the chromogenic reaction. The intensity of the staining was rated using the following criteria: 0 = negative, 1 = low, 2 = medium, and 3 = high. The extent of staining was scored as 0 = 0% stained, 1 = 1%–25% stained, 2 = 26%–50% stained, and 3 = 51%–100% stained. Final scores were calculated by multiplying the score for intensity by the score for extent and dividing the samples by one of the four grades: 0 = negative, 1–2 = low staining, 3–4 = medium staining, and 4–6 = high staining. The following criteria were used to quantify the expression levels of KIF15 in BC tissues: high expression = final scores of 4–6 and low expression = final scores of 0–3.
Immunoblotting
Western blot analysis was performed as previously described.18 Briefly, 100 µg of protein was separated by 10% SDS-PAGE and transferred to polyvinylidene difluoride membranes. The membranes were blocked with 5% nonfat milk for 2 hours and were incubated at 4°C overnight with primary antibodies. The primary antibody used for immunoblotting was the same anti-KIF15 antibody (Proteintech) that was used for IHC. Other primary antibodies used for immunoblotting were antibodies against GAPDH (Affinity, Cincinnati, OH, USA), P-c-Raf, P-MEK, P-p90Rsk, P-ERK1/2, ERK1/2, CyclinD1, CyclinE2, CDK2, and CDK4 purchased from CST (Cell Signaling Technology, Danvers, MA, USA). Horseradish peroxidase-conjugated secondary antibodies were used to detect the primary antibodies, and protein bands were visualized using an Odyssey scanner (Li-COR Biosciences, Lincoln, NE, USA).
Statistical analysis
Statistical analyses were performed using the IBM SPSS Statistics Program. Each experiment was performed in triplicate, and the values are presented as the mean ± SD, unless otherwise stated. The variance between groups was statistically compared. Student’s t-test was used to compare the mean values. Kaplan–Meier curves were analyzed for relevant variables. The log-rank test was used to analyze differences in survival times among the patient subgroups. The risk factors associated with the prognoses of these patients were evaluated using Cox’s proportional hazard regression model. All probability values had a statistical power level of 90%, and a two-sided level of 5%; P<0.05 was considered to be significant.
Results
Identification of DEGs and aberrantly expressed mRNAs in BC
GEO is a free database that has various microarray profiles and next-generation sequencing data. In order to acquire a more reliable gene signature, we integrated the datasets GSE27448, GSE40355, and GSE42089 into the merged gene expression dataset. Using the criteria of P<0.05 and ≥2-fold change in expression over control , a total of 153 genes were identified after the analysis carried out by GEO2R and Venn diagram, which included 42 upexpression genes and 111 downexpression genes. The DEGs heat map, volcano plot, and integrated Venn diagram are presented in Figure 1. Then we analyzed the upexpression genes.
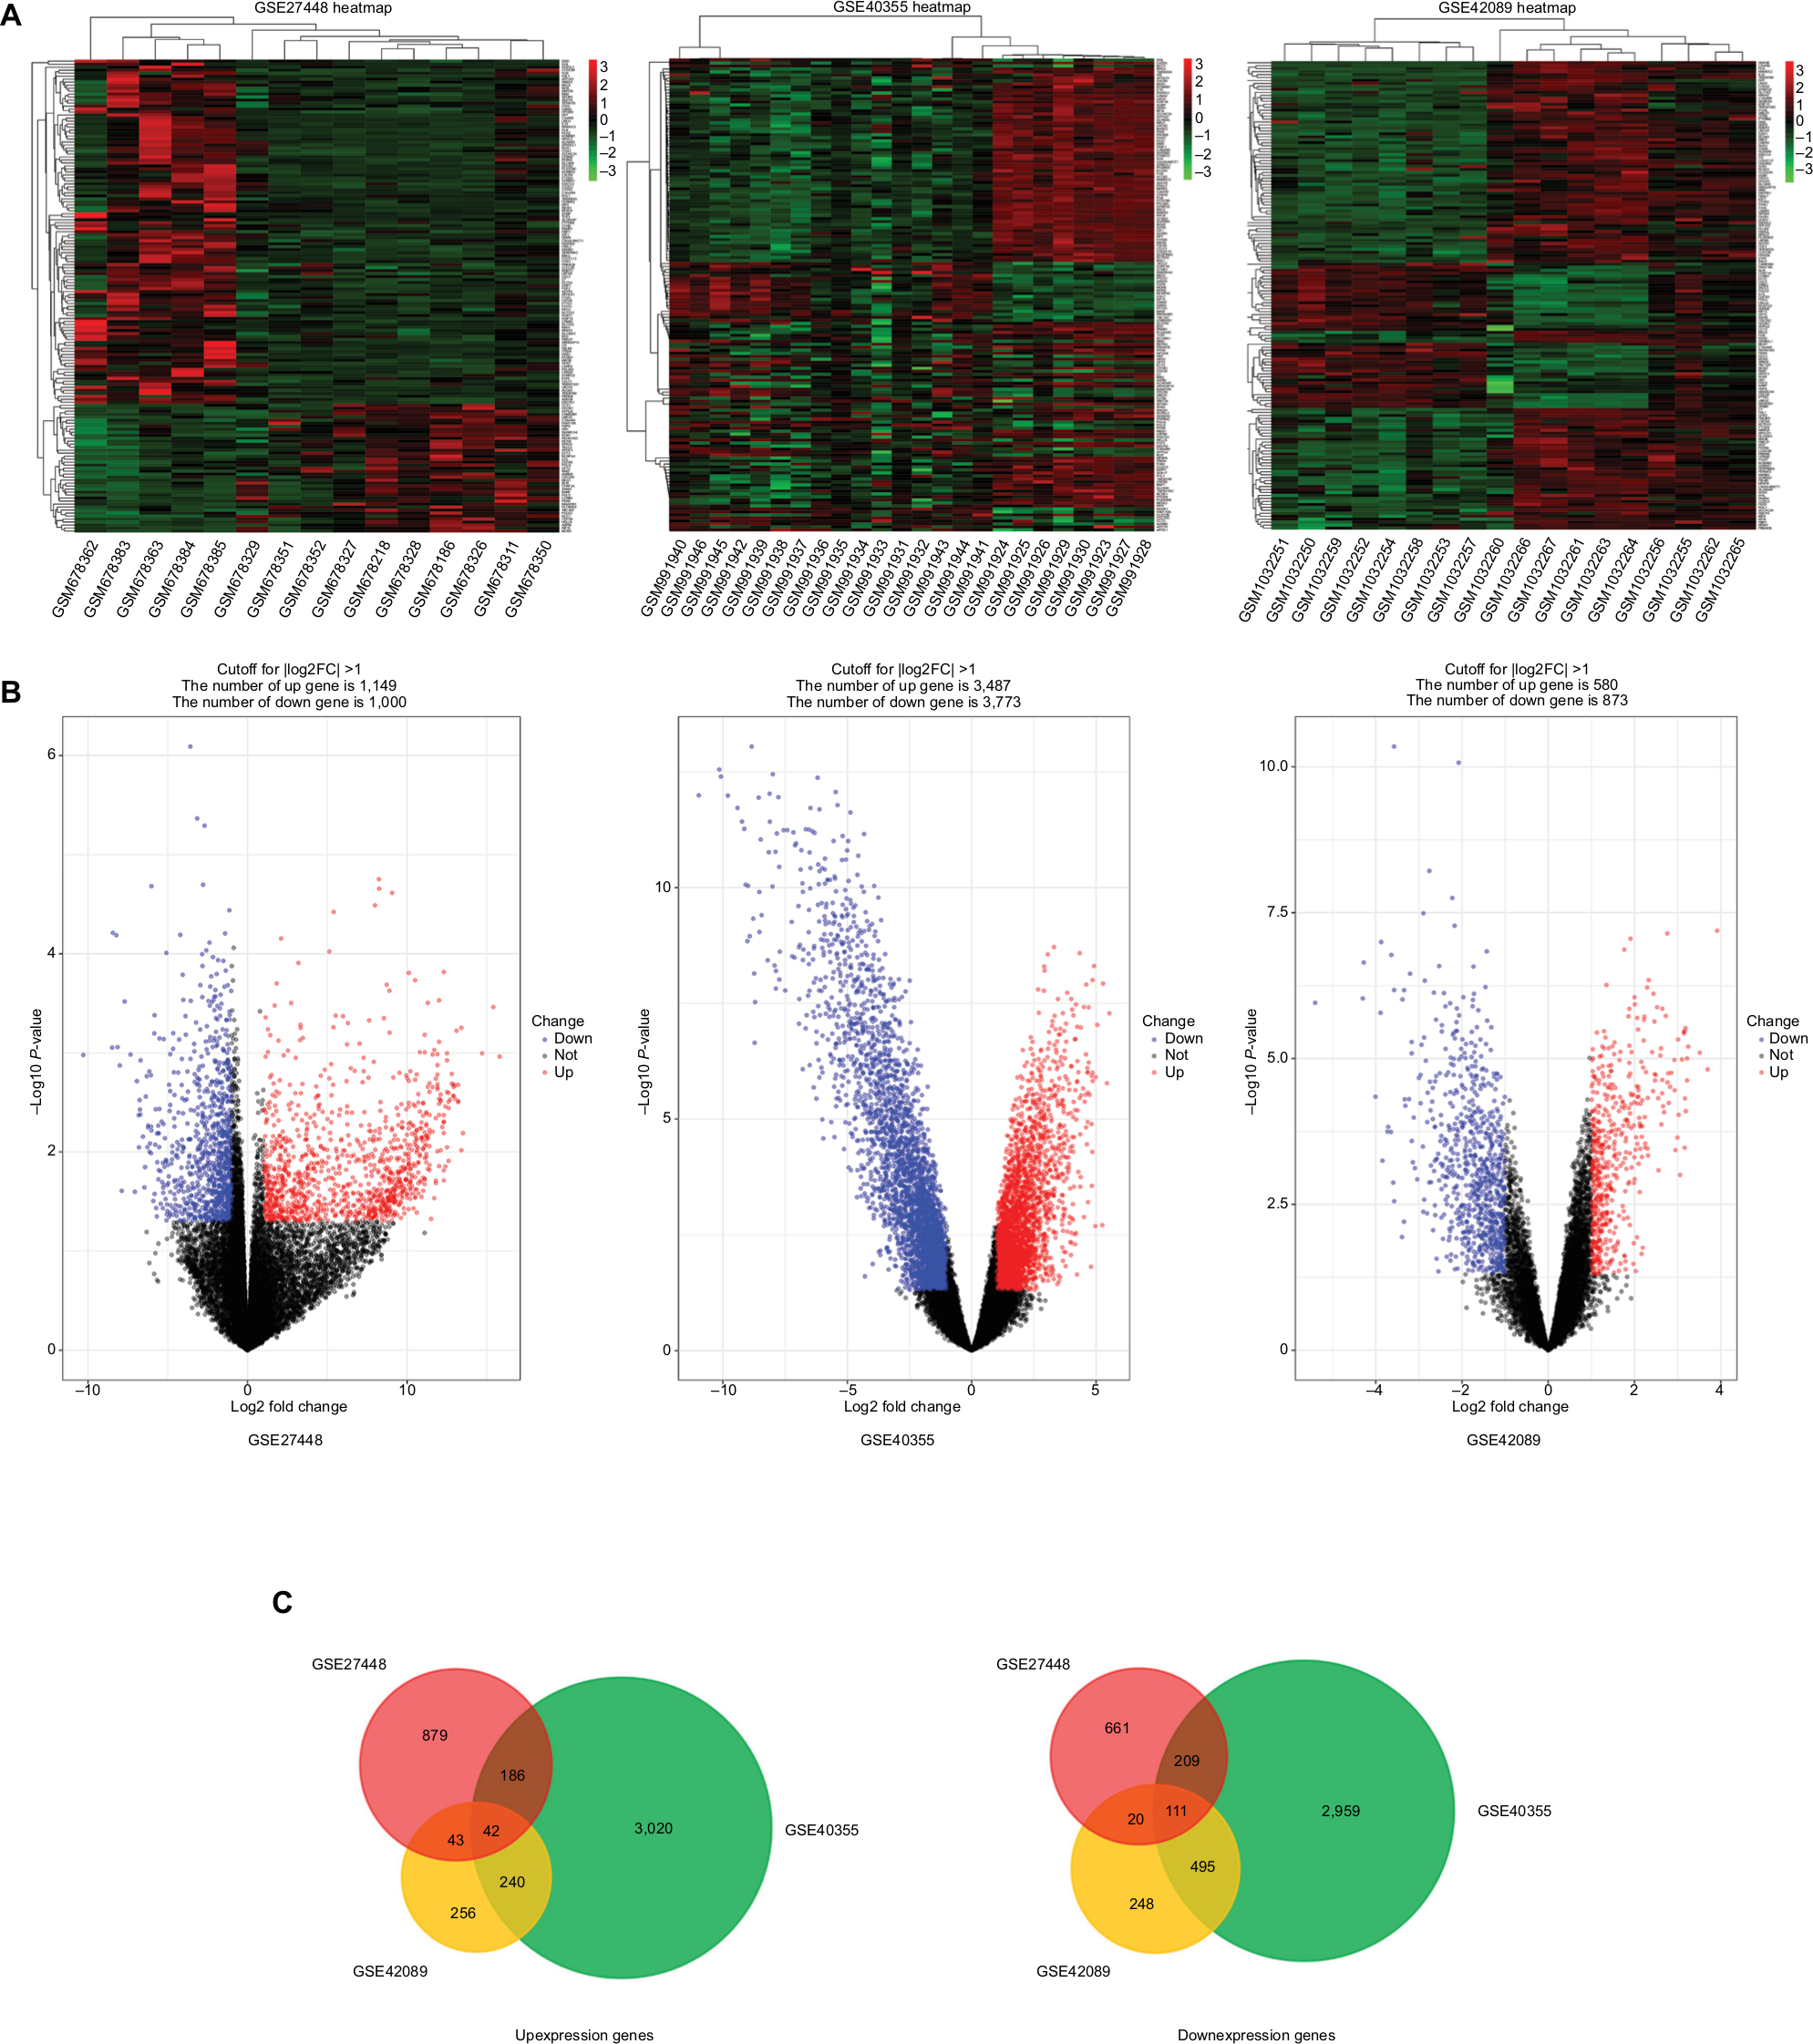 | Figure 1 The analysis result of GSE27448, GSE40355, and GSE42089. Notes: (A) Heatmap overview of the differentially expressed genes. Red: upregulation; green: downregulation. (B) Volcano plot of the differentially expressed genes. (C) The result of Venn diagram. DEGs were divided into two groups: upexpression and downexpression. Different color areas meant different datasets and the cross areas represented the commonly changed DEGs. Abbreviation: DEGs, differentially expressed genes. |
GO and KEGG analysis of upexpression genes
The 42 upexpression genes were inputted into the online biological tool DAVID.19 GO analysis included three aspects: molecular function (MF), biological process (BP), and cellular component (CC) (Table 1).20 The GO analysis results indicated that upexpression genes were enriched in 24 BP terms, 11 CC terms, and 6 MF terms. Further analysis showed that these genes were significantly enriched in cell division, DNA replication, mitotic nuclear division, and nucleoplasm (Figure 2A). In order to reveal the potential functions, we performed KEGG pathway enrichment analysis (Table 2).16 As shown in Figure 2B, the enriched pathways were cell cycle, DNA replication, and metabolic pathways.
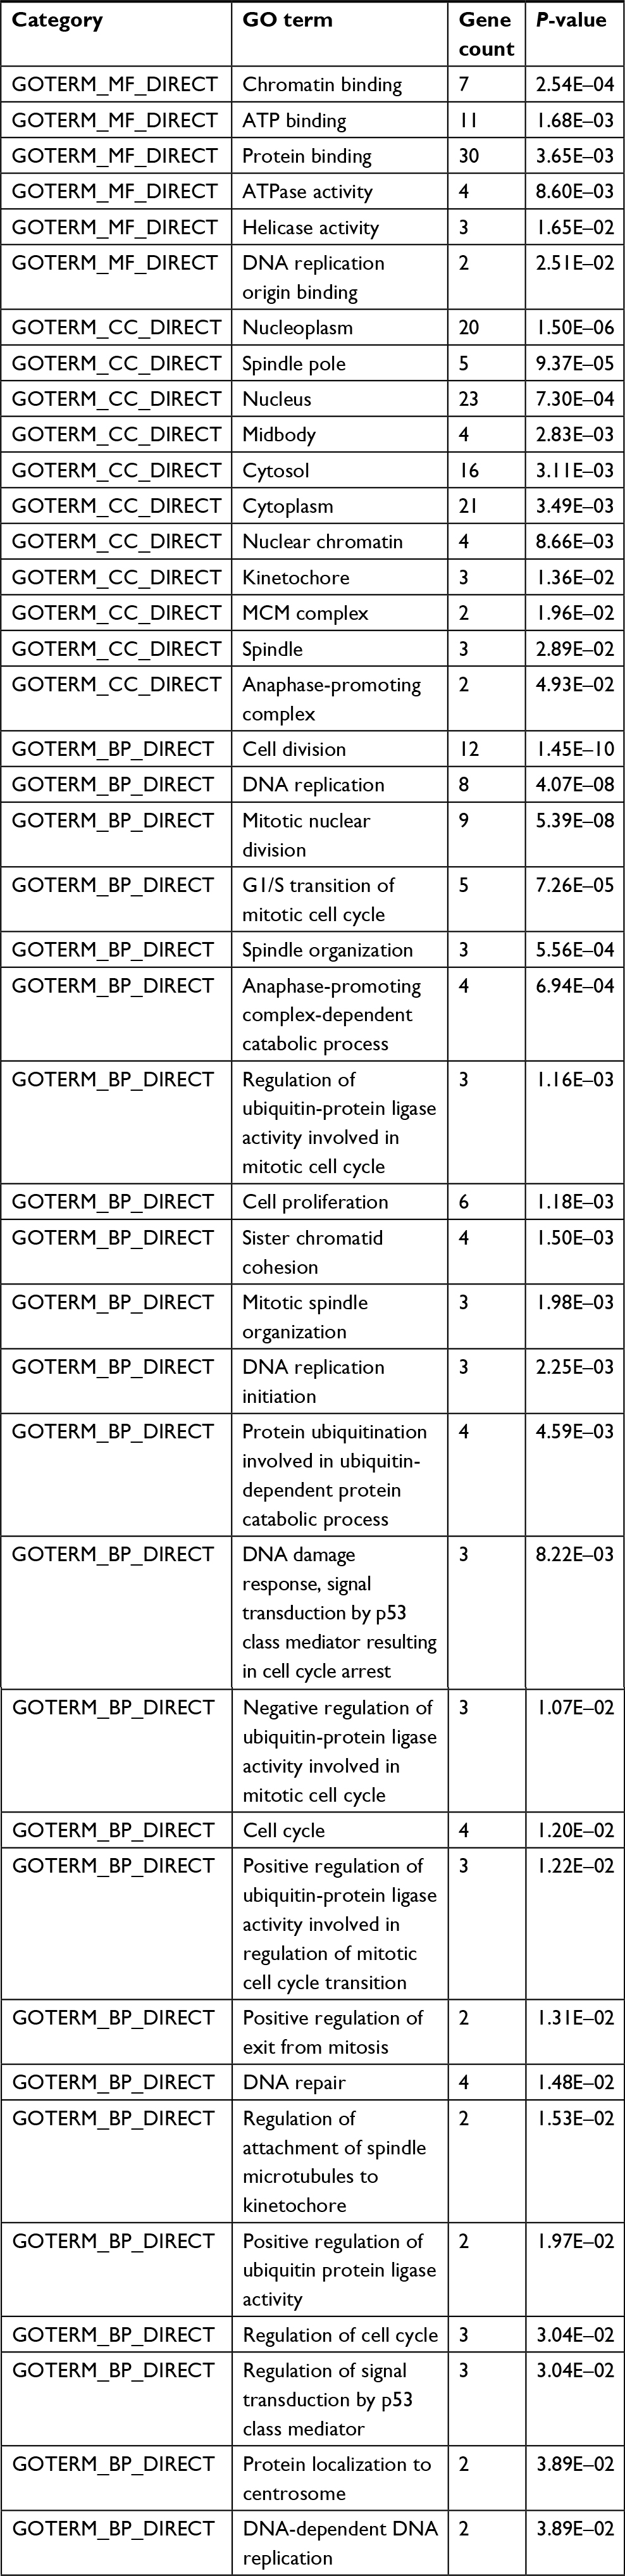 | Table 1 The significant enriched GO analysis of integrated upexpression genes in BC Abbreviations: BC, bladder cancer; BP, biological process; CC, cellular component; GO, gene ontology; MF, molecular function. |
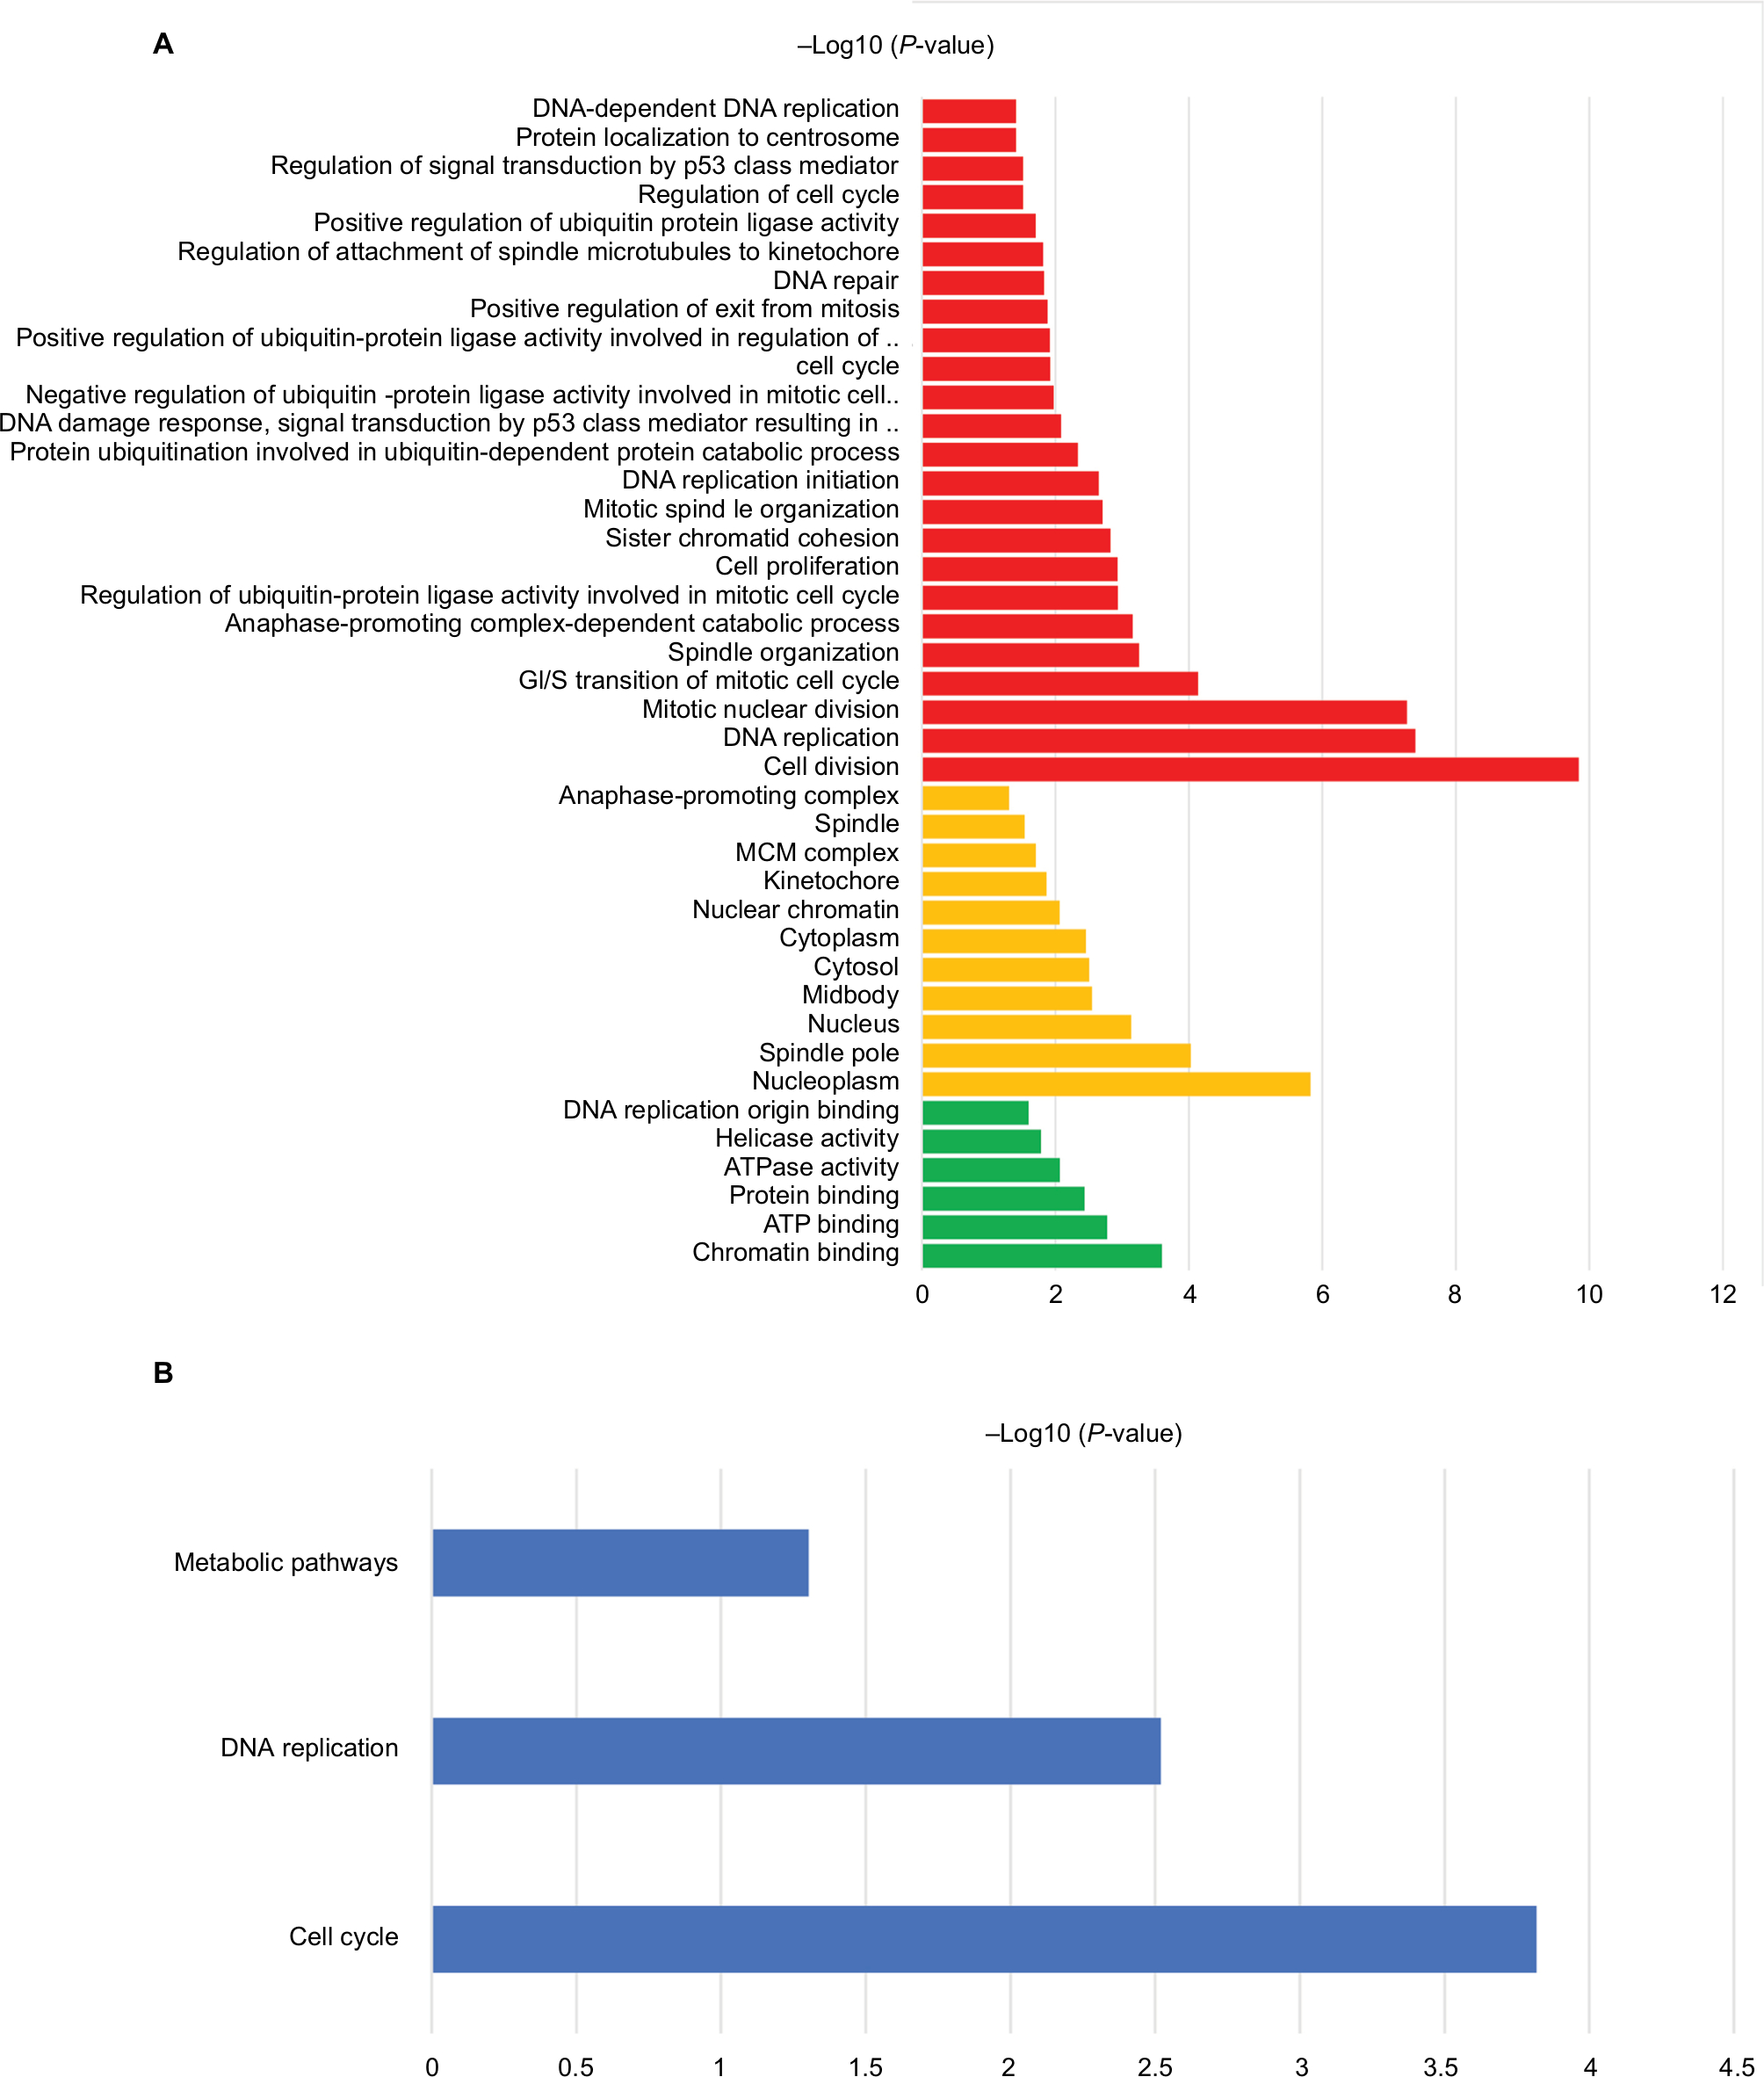 | Figure 2 The functional analysis of integrated upexpression genes. Notes: (A) GO analysis and significant enriched GO terms of upexpression genes in BC tissues. (B) Significantly enriched pathway terms of upexpression genes. Abbreviation: ATP, adensosine triphosphate; BC, bladder cancer; GO, gene ontology. |
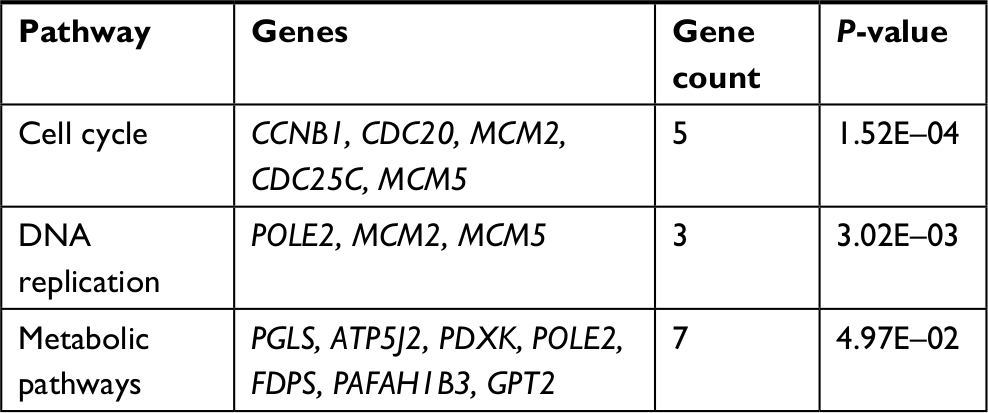 | Table 2 Signaling pathway analysis of integrated upexpression genes in BC Abbreviation: BC, bladder cancer. |
PPI networks construction and module analysis
In order to analyze the different gene interactions and find hub-genes, PPIs were constructed by using Cytoscape. According to the PPI networks (Figure 3), the top ten genes with highest interaction degrees were KIF15, ASPM, CCNB1, KIAA0101, AURKB, ZWINT, UBE2C, PTTG1, POLQ, and GINS2. Kinesin proteins play critical roles in the development of human cancers,12,13 and KIF15 is involved with the progression of many solid tumors,21 so we decided to study whether the abnormal expression of KIF15 was related to bladder carcinogenesis.
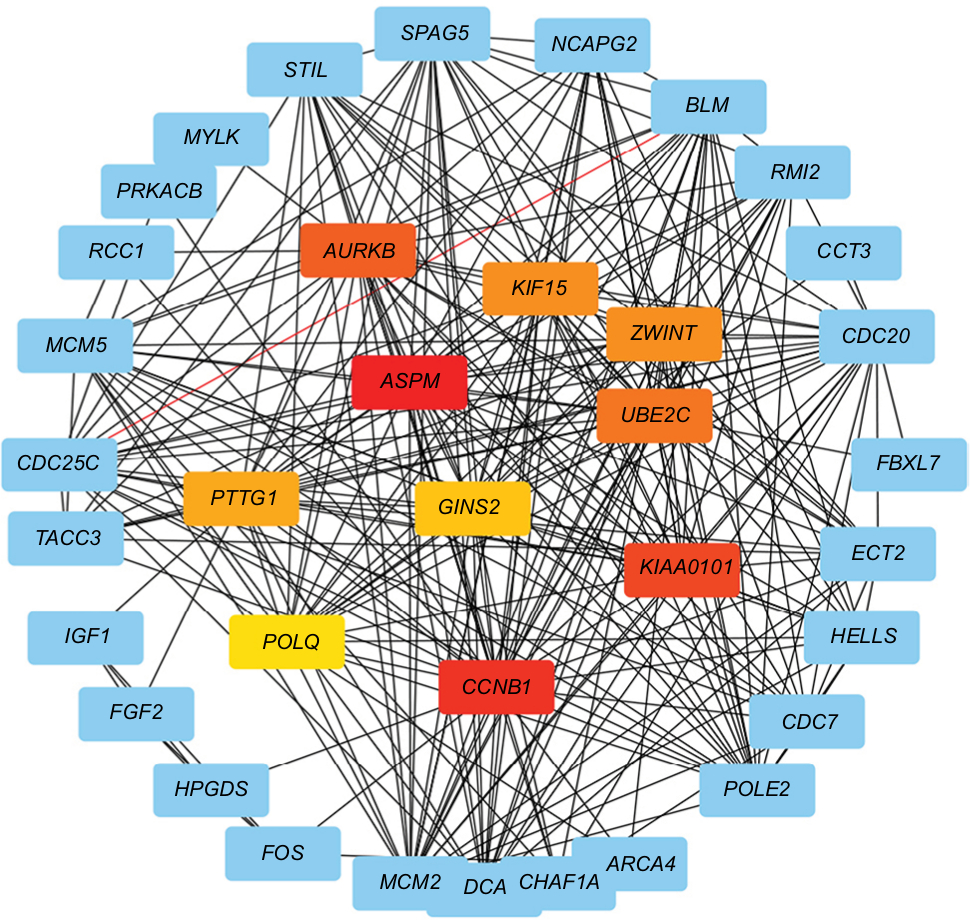 | Figure 3 Protein–protein interaction networks. Notes: Upexpression genes were analyzed and constructed a network. Red nodes: first-level hub genes; orange nodes: second-level hub genes; yellow nodes: third-level hub genes. |
Correlation of KIF15 expression with clinicopathological characteristics and prognosis of BC patients
We examined the expression pattern of KIF15 protein by IHC staining in a retrospective cohort of 106 specimens from patients with BC to explore the clinical significance of KIF15 in BC (Figure 4A). The clinicopathologic characteristics of the 106 patients are shown in Table 3. In detail, higher level KIF15 expression was detected in 58 (54.7%) tumor tissue specimens, whereas 48 (45.3%) specimens exhibited low/absent level. Regarding the correlation between KIF15 expression level and clinicopathological parameter in patients, patients with higher expression of KIF15 (with a cutoff at median) presented advanced TNM stage. Kaplan–Meier survival analysis revealed that patients with low KIF15 expression had more favorable overall survival compared with high KIF15 expression (P=0.01; Figure 4B).The results of univariate analysis and multivariate analysis by Cox proportional hazards models suggested that KIF15expression was an independent prognostic risk factor (P=0.012 and 0.003, respectively; Table 4).
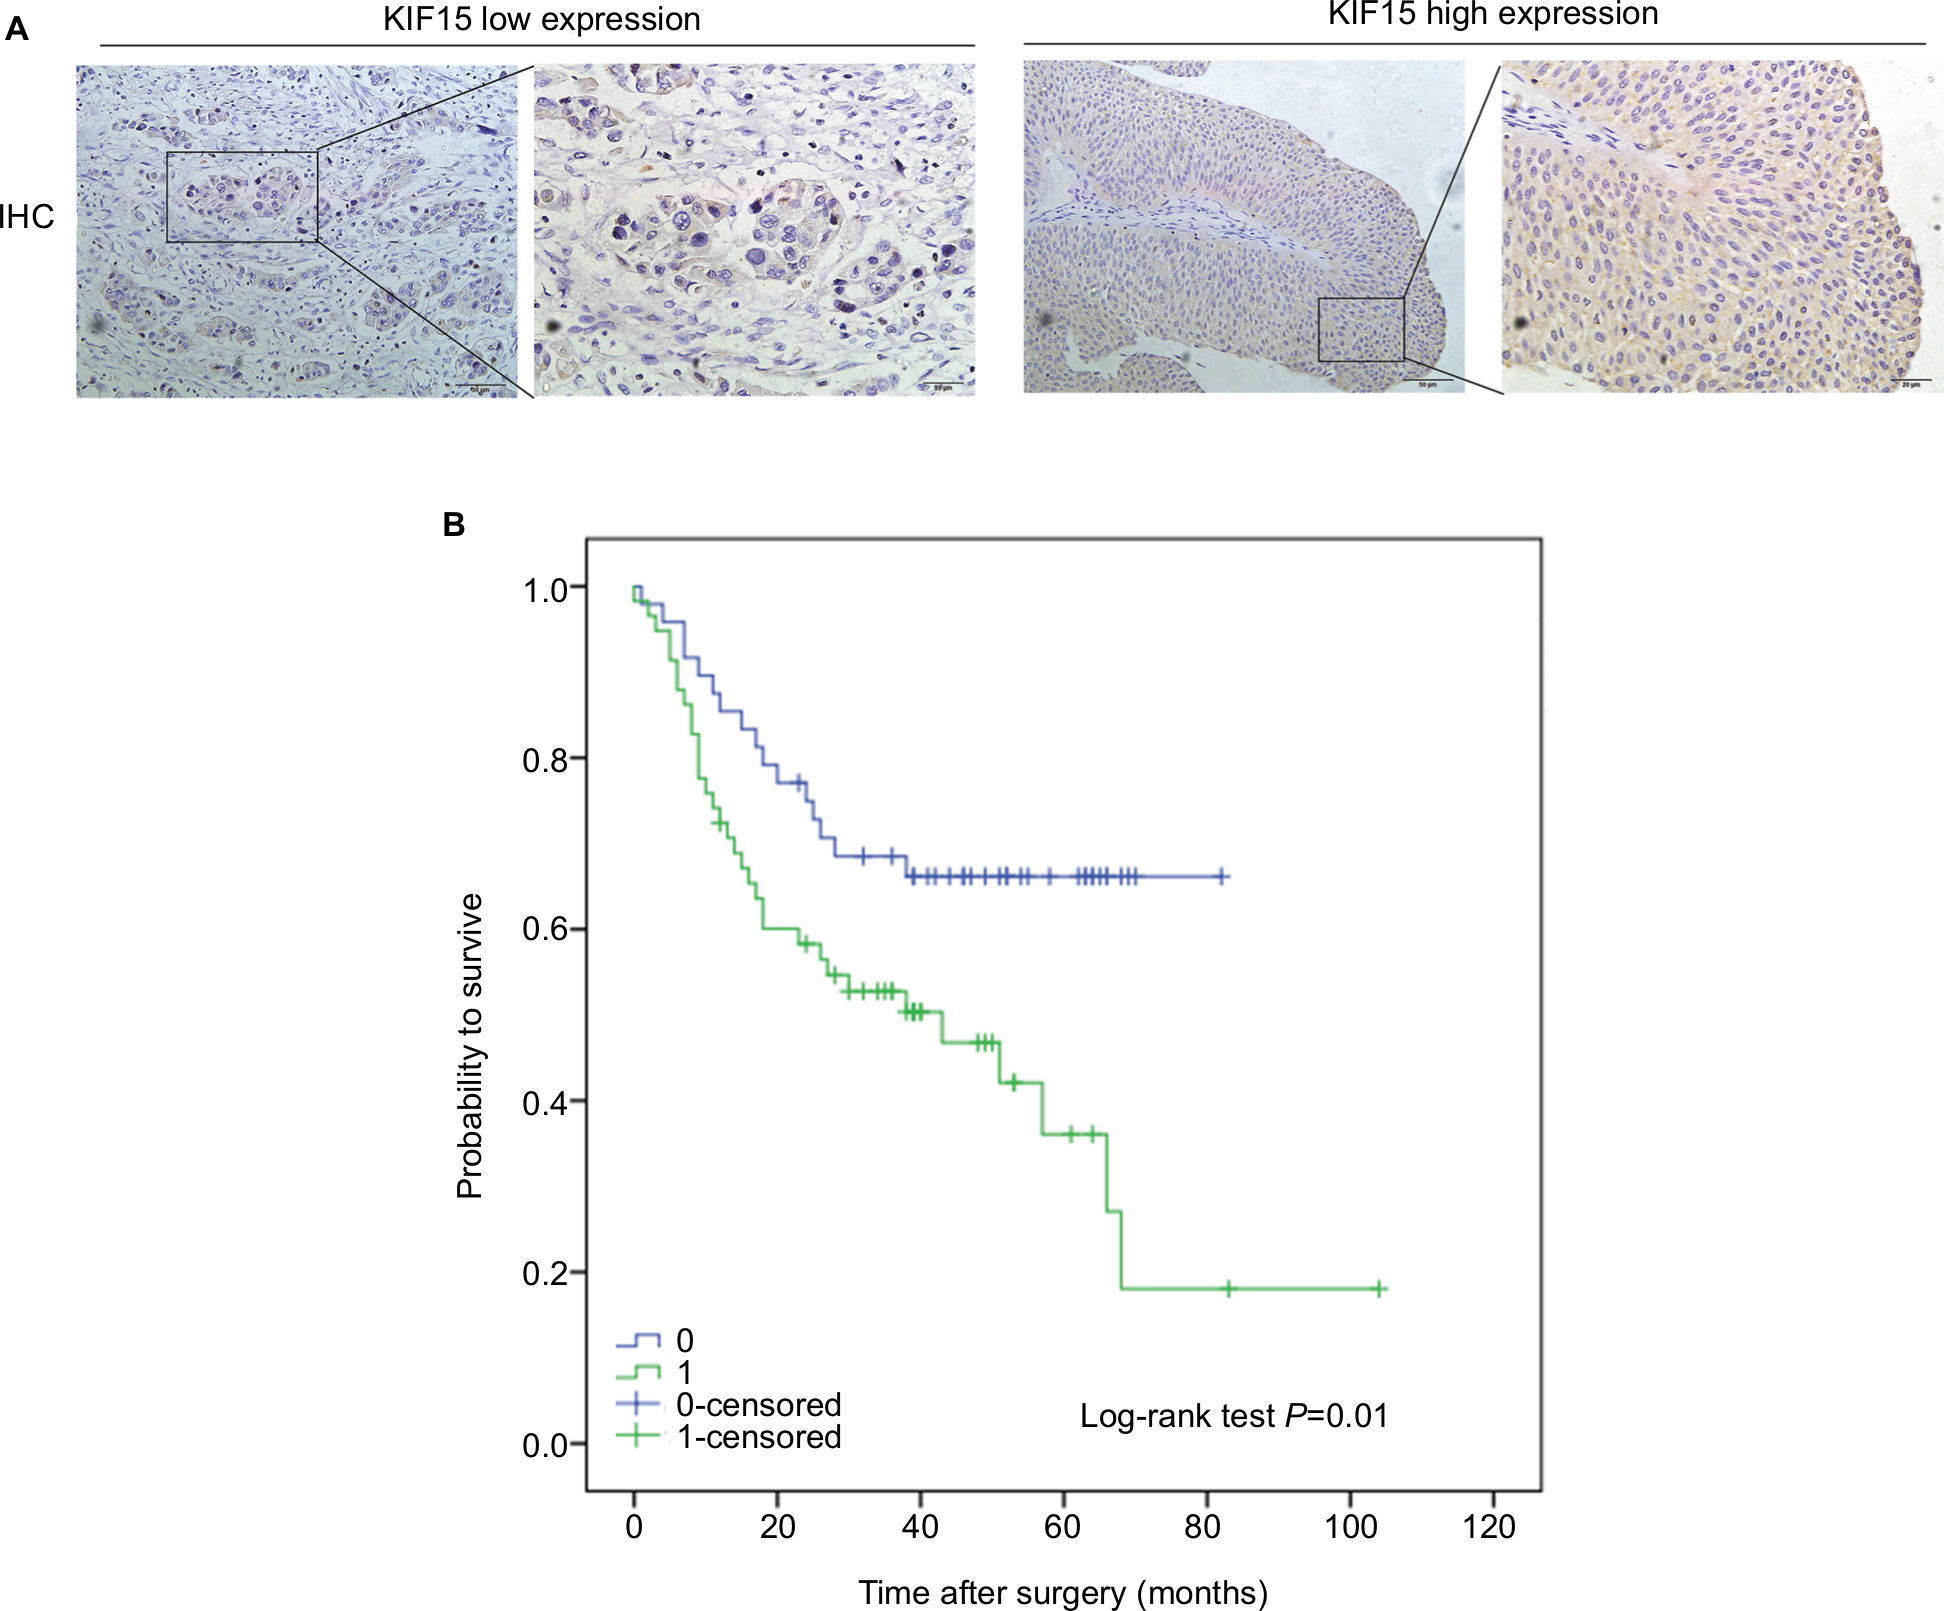 | Figure 4 Correlation of KIF15 expression with clinicopathological characteristics and prognosis of bladder cancer patients. Notes: (A) IHC staining of KIF15 proteins in bladder cancer samples. (B) BC patients with high expression of KIF15 presented have worse overall survival, and low expression was opposite (P=0.01). Abbreviations: BC, bladder cancer; IHC, immunohistochemistry. |
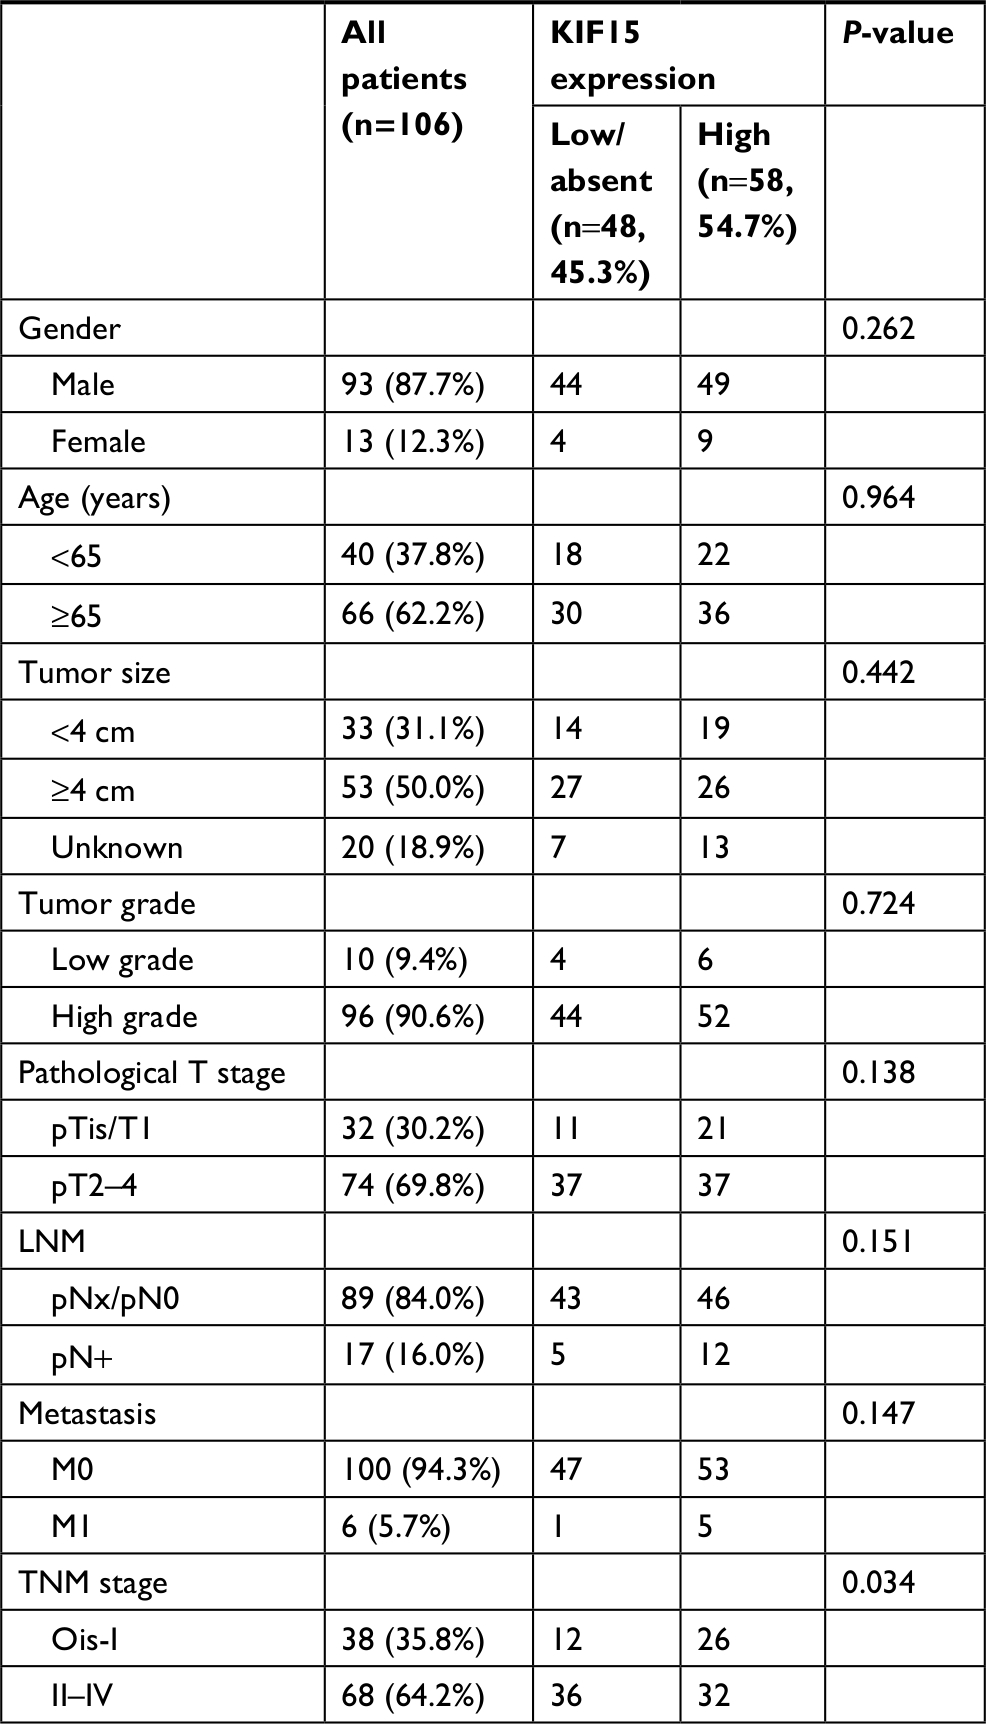 | Table 3 Association between KIF15 expression and clinicopathological features of 106 patients with bladder cancer Notes: pN+ = pN1, pN2, or pN3. Ois = TisN0 M0. |
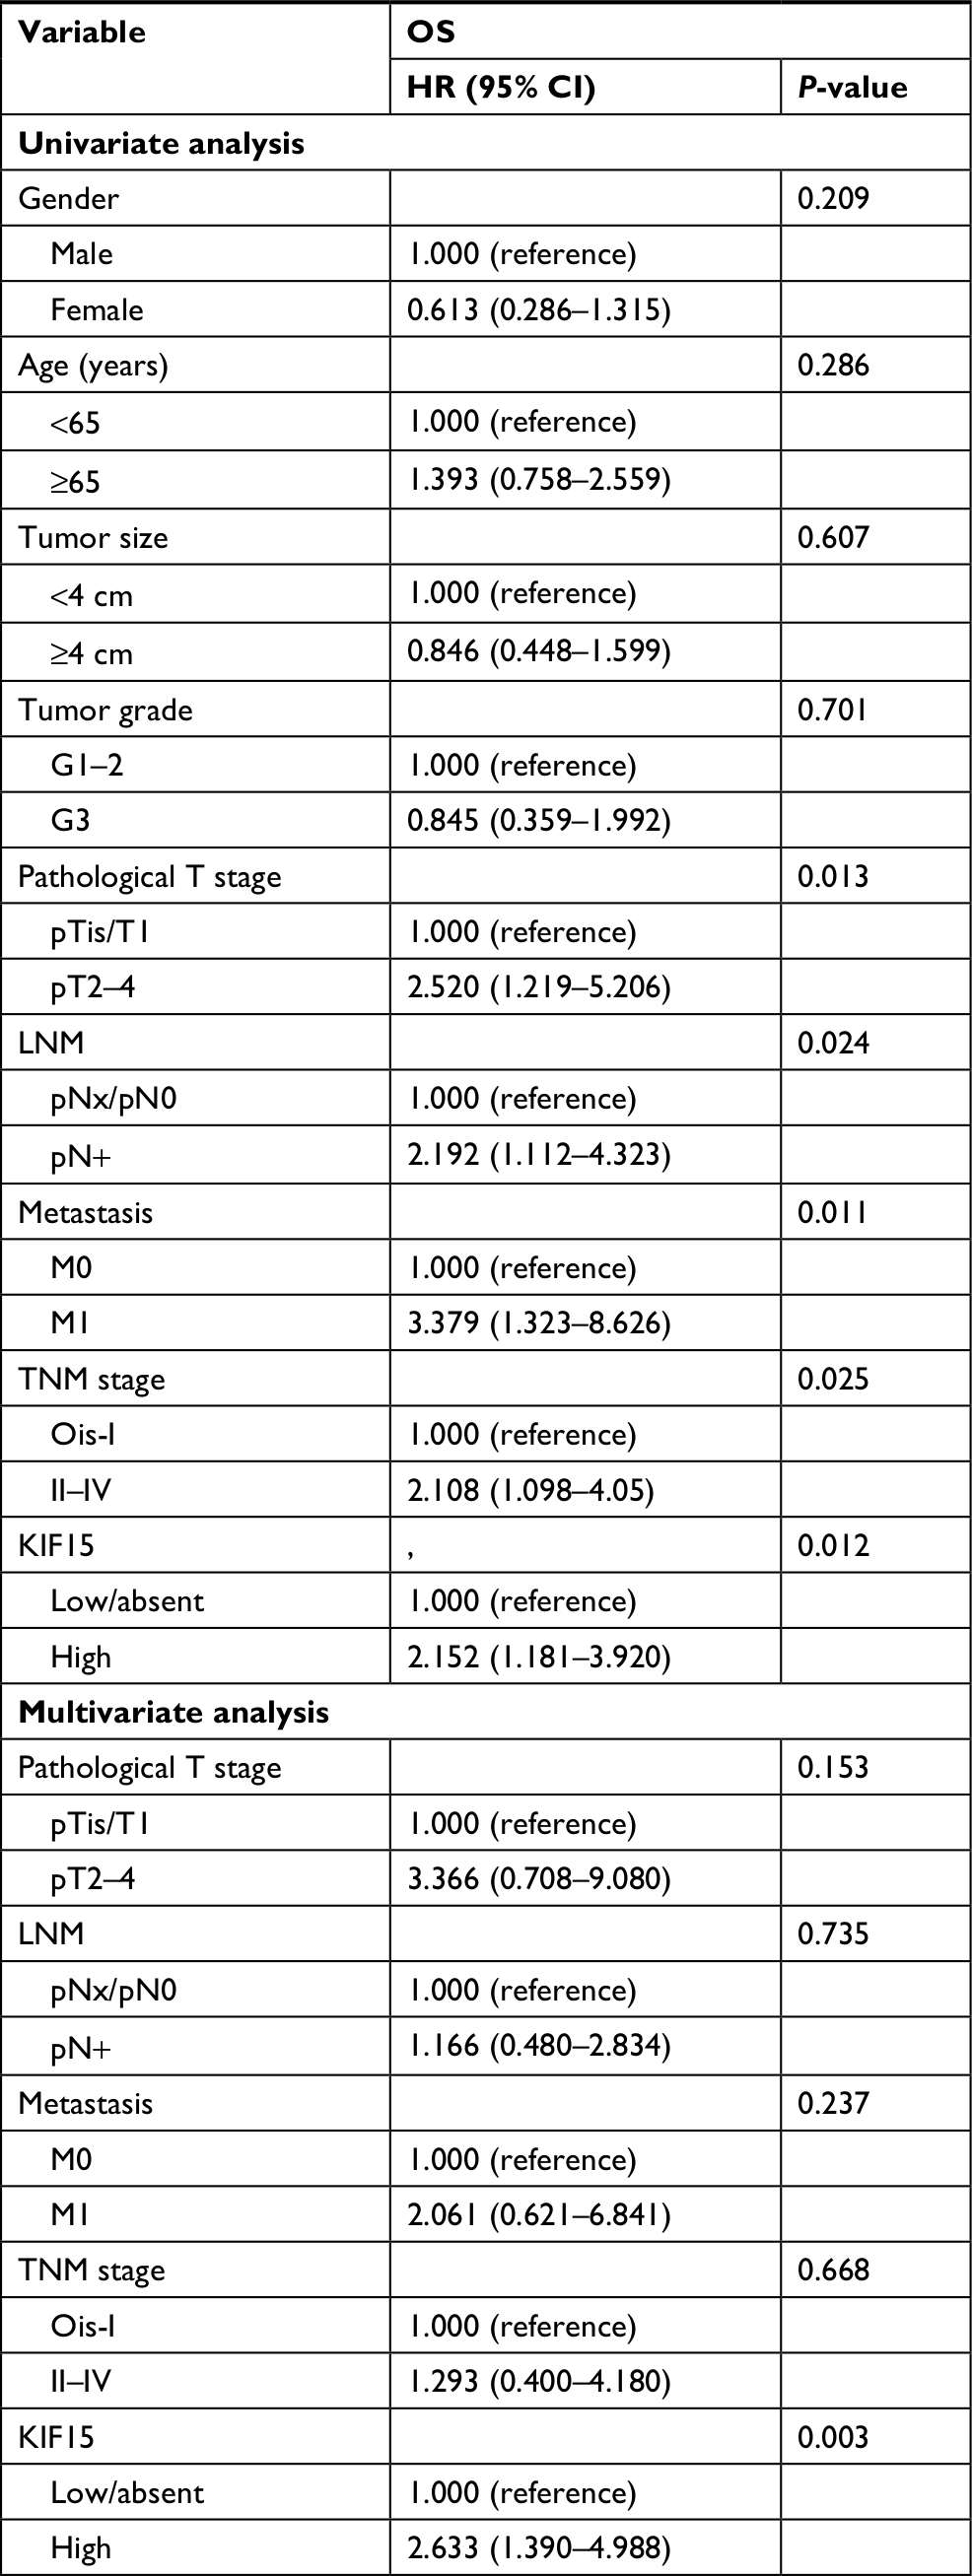 | Table 4 Cox proportional hazard model analysis of prognostic factors in patients with bladder cancer Notes: pN+ = pN1, pN2, or pN3. Ois = TisN0 M0. Abbreviation: OS, overall survival. |
KIF15 promotes BC cells proliferation
We interrupted the expression of KIF15 by using siRNA, and we confirmed downregulation of KIF15 protein in T24 and 253J BC cells (Figure 5A). Compared with the negative control (NC) group, KIF15 expression knockdown suppressed BC cell proliferation, as measured by the CCK-8 assay, Edu assay, and colony formation assay (Figure 5B–D).
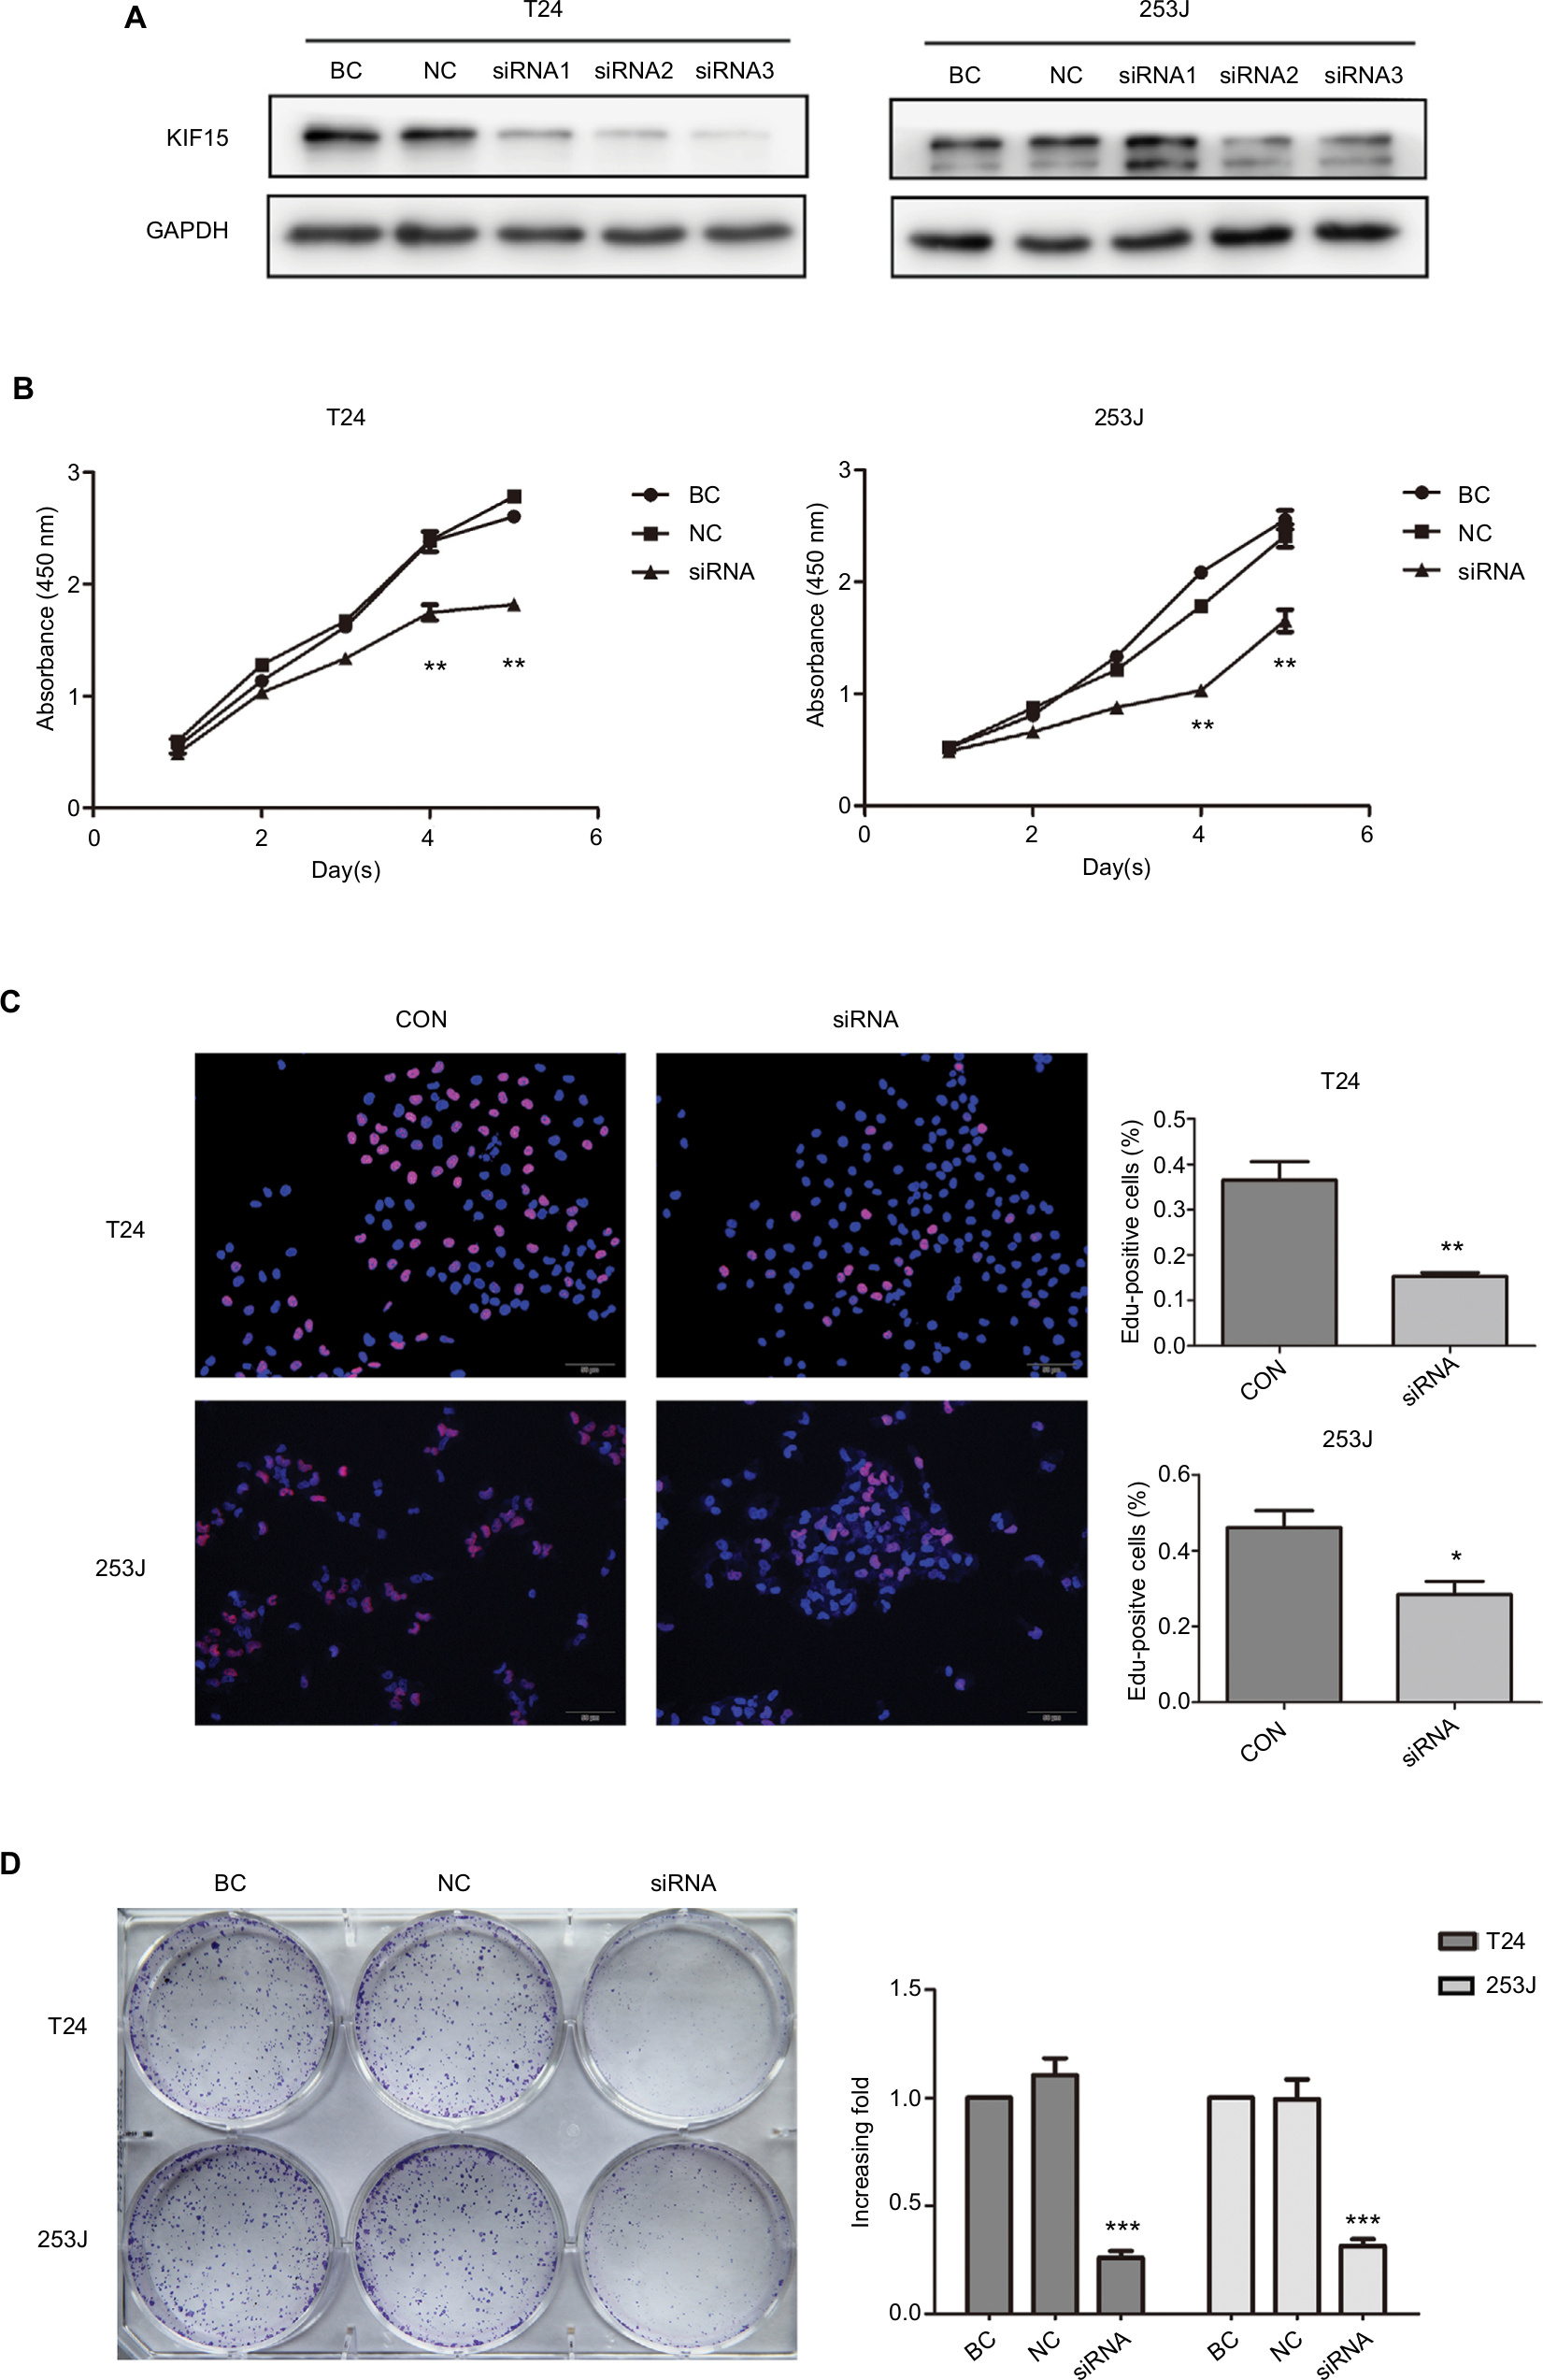 | Figure 5 KIF15 promotes BC cells proliferation. Notes: (A) T24 and 253 J cells transfected with siRNA, respectively, were subject to Western blotting. (B–D) CCK-8 assay, Edu assay, and colony formation assay comparing proliferation ability of KIF15 knockdown and NC group. Adjustments of brightness, contrast, and size are applied to the whole images of Western blot-based analyses without elimination of any information present in the original, including backgrounds. Data are presented as mean ± SD. All experiments are performed in triplicate, and mean values are shown. *P<0.05, **P<0.01, ***P<0.001. Abbreviations: BC, bladder cancer; CCK-8, cell counting kit-8; CON, control; Edu, ethynyl deoxyuridine; NC, negative control. |
KIF15 promotes BC cells proliferation via the MEK–ERK pathway
To further elucidate the mechanisms underlying KIF15 promotion of BC proliferation, we used KIF15 knockdown cells and NC cells. Previous studies showed that KIF15 is associated with the MEK–ERK signaling pathway.21 We therefore investigated whether changes in KIF15 expression could affect activation of the MEK–ERK signaling pathway in BC cells. Western blot analysis showed that KIF15 knockdown inhibited p-ERK expression in BC cells (Figure 6). Furthermore, KIF15 knockdown downregulated the expression of P-c-Raf, P-MEK, P-p90Rsk, CyclinD1, CyclinE2, CDK2, and CDK4, which promotes cell cycle progression in BC cells.
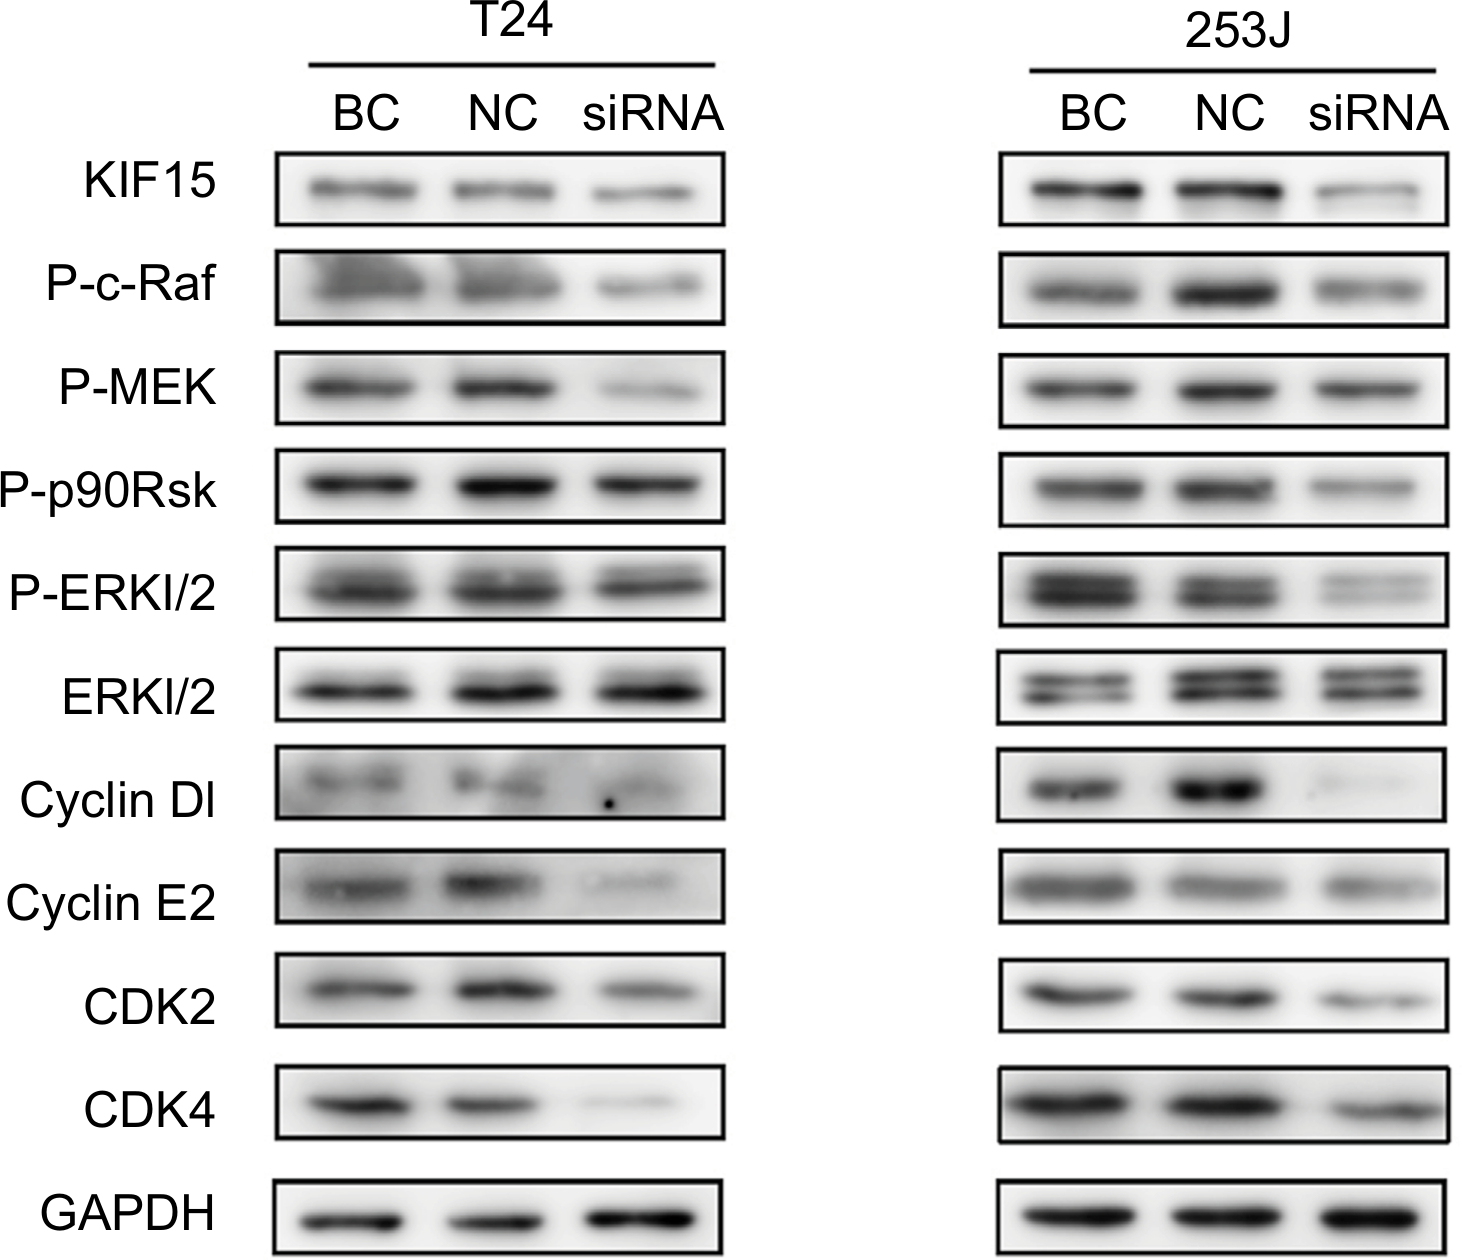 | Figure 6 KIF15 promotes BC cells proliferation via the MEK–ERK pathway. Notes: Western blot analysis showed that KIF15 knockdown inhibited p-ERK, P-c-Raf, P-MEK, P-p90Rsk, CyclinD1, CyclinE2, CDK2, and CDK4 expression in BC cells. Adjustments of brightness, contrast, and size are applied to the whole images of western blot-based analyses without elimination of any information present in the original, including backgrounds. Abbreviations: BC, bladder cancer; NC, negative control. |
Discussion
In the past decade, great efforts have been made to explore the molecular mechanism of proliferation and metastasis for cancer cells. Nevertheless, critical details regarding these mechanisms in BC remain incompletely understood. Hence, we undertook a detailed investigation using the GEO database and acquired microarray data regarding DEGs in tumor and normal tissues. A Venn diagram was constructed and 42 upexpression genes were found to be strongly related to the development of BC. Both KEGG and GO analysis were performed to illuminate the potential biological functions and pathways involved in bladder tumorigenesis.
GO analysis showed that these genes were mainly enriched in cell division, DNA replication, mitotic nuclear division, and nucleoplasm. As shown in previous studies, cell division and DNA replication played an important role in the proliferation of malignant BC cells.22 Furthermore, KEGG enrichment analysis revealed that upexpression genes were enriched in cell cycle, DNA replication, and metabolic pathways. According to our research, some hub genes, especially KIF15, have been classified by constructing the PPI network based on the degree, which may suggest a strategy for therapeutic interventions in BC.
Although KIF15 has been studied for 10 years, the role of KIF15 in regulating the behavior of cancer cells has not yet been elucidated. Klejnot et al reported that kinesins are a superfamily of proteins with important roles in eukaryotic intracellular trafficking and cell division.23 Some proteins participate in molecular intracellular transport, and others play an important role in the process of mitosis and cytokinesis.24
Drechsler et al showed that KIF15 is a second tetrameric spindle motor (in addition to kinesin-5, Eg5) and described the mechanisms by which KIF15 and its inhibitor hTpx2 modulate spindle microtubule architecture.9,25 The interaction of KIF15 with microtubules has also been described.23 Another study demonstrated that KIF15 drove centrosome separation during bipolar spindle assembly.26
Studies of KIF15 have shown that it is important for several tumors. For example, KIF15 is critical for K5I resistance in HeLa cells.27 KIF15 is considering as a prognostic marker and new therapeutic target for endocrine therapy-resistant breast cancer.28 KIF15 is also overexpressed in lung cancer and may be important in the cell cycle.29 Meanwhile, it has been found that inhibitors of Aurora A and KIF11 overcome KIF15-dependent drugresistance.30 In this study, we found that KIF15 promotes BC cell proliferation via the MEK–ERK pathway.
In the current study, a number of patients with higher expression of KIF15 were found to be more susceptible to BC progression, though no significant clinicopathological difference was observed. Cox proportional hazard model analysis showed that significant poor prognosis was associated with a higher level of KIF15 expression. This contradiction may be attributable to the patients in the study population, most of whom had muscle-invasive BC, as BC patients reportedly suffer poor survival despite receiving the standard therapy.31 Indeed, more BC patients should be included to validate this conclusion clinically.
The MEK–ERK pathway plays an important role in cell proliferation and participates in the genesis of many epithelial cancers. The MEK–ERK pathway participates in several cellular processes such as proliferation, differentiation, and motility and plays an important role in BC prognosis.32,33 This pathway is often upregulated in cancer tissues and plays an vital role in anticancer therapy.34 Currently, the efficacy of MEK inhibitors targeting the MEK–ERK pathway has been put in clinical trials for study,35 and according to the previous research, MEK–ERK pathway can regulate cyclinD1 transcription and influence the cell cycle process.36 Furthermore, from our studies, ERK also regulates the formation of the cyclinE/CDK2 complex. Thus, MEK–ERK pathway plays an important role in KIF15 regulation of BC cells proliferation.
However, clinical features were not distinctly different between patients with higher vs lower expression of KIF15, and detailed mechanisms are not yet understood. Larger sample studies and more extensive investigation of these mechanisms are needed in future investigations of KIF15 in BC.
Conclusion
This study used an online public database to find DEGs, identified a novel role for KIF15 in promoting BC cell proliferation, and demonstrated a potential link between KIF15 and the MEK–ERK signaling pathway. In conclusion, our study provided evidence supporting KIF15 as a key regulator and correlated KIF15 expression and the clinical prognosis of BC patients. Therefore, KIF15 may be a potential therapeutic target for BC treatment in the future.
Acknowledgments
This work was supported by the National Natural Science Foundation of China (Grant 81470987 and 81170702 to B Shi), the Tai Shan Scholar Foundation to B Shi, the Key Research and Development Plan of Shandong Province (Grant 2017GSF18105 to B Shi), the Science and Technology Development Project of Shandong Province (Grant 2014GSF118054 to B Shi), and Science Foundation of Qilu Hospital of Shandong University (Grant 2015QLMS28 to B Shi).
Disclosure
The authors report no conflicts of interest in this work.
References
Siegel RL, Miller KD, Jemal A. Cancer statistics, 2018. CA Cancer J Clin. 2018;68(1):7–30. | ||
Chen W, Zheng R, Baade PD, et al. Cancer statistics in China, 2015. CA Cancer J Clin. 2016;66(2):115–132. | ||
Black PC, Dinney CP. Bladder cancer angiogenesis and metastasis – translation from murine model to clinical trial. Cancer Metastasis Rev. 2007;26(3-4):623–634. | ||
Chen Y, Qi C, Xia L, Li G. Identification of novel genetic etiology and key molecular pathways for seminoma via network-based studies. Int J Oncol. 2017;51(4):1280–1290. | ||
Peng J, Wu Y, Tian X, et al. High-throughput sequencing and co-expression network analysis of lncRNAs and mRNAs in early brain injury following experimental subarachnoid haemorrhage. Sci Rep. 2017;7:46577. | ||
Mitchison TJ, Maddox P, Gaetz J, et al. Roles of polymerization dynamics, opposed motors, and a tensile element in governing the length of Xenopus extract meiotic spindles. Mol Biol Cell. 2005;16(6):3064–3076. | ||
Tanenbaum ME, Macůrek L, Galjart N, Medema RH. Dynein, LIS1 and CLIP-170 counteract Eg5-dependent centrosome separation during bipolar spindle assembly. Embo J. 2008;27(24):3235–3245. | ||
Vanneste D, Takagi M, Imamoto N, Vernos I. The role of Hklp2 in the stabilization and maintenance of spindle bipolarity. Curr Biol. 2009;19(20):1712–1717. | ||
Tanenbaum ME, Macůrek L, Janssen A, Geers EF, Alvarez-Fernández M, Medema RH. Kif15 cooperates with Eg5 to promote bipolar spindle assembly. Curr Biol. 2009;19(20):1703–1711. | ||
Florian S, Mayer TU. Modulated microtubule dynamics enable Hklp2/Kif15 to assemble bipolar spindles. Cell Cycle. 2011;10(20):3533–3544. | ||
Liu M, Nadar VC, Kozielski F, Kozlowska M, Yu W, Baas PW. Kinesin-12, a mitotic microtubule-associated motor protein, impacts axonal growth, navigation, and branching. J Neurosci. 2010;30(44):14896–14906. | ||
Yokota K, Sasaki H, Okuda K, et al. KIF5B/RET fusion gene in surgically-treated adenocarcinoma of the lung. Oncol Rep. 2012;28(4):1187–1192. | ||
Minakawa Y, Kasamatsu A, Koike H, et al. Kinesin family member 4A: a potential predictor for progression of human oral cancer. PLoS One. 2013;8(12):e85951. | ||
Buster DW, Baird DH, Yu W, et al. Expression of the mitotic kinesin Kif15 in postmitotic neurons: implications for neuronal migration and development. J Neurocytol. 2003;32(1):79–96. | ||
Gene Ontology Consortium. The gene ontology (Go) project in 2006. Nucleic Acids Res. 2006;34(Database issue):D322–D326. | ||
Ogata H, Goto S, Sato K, Fujibuchi W, Bono H, Kanehisa M. KEGG: Kyoto encyclopedia of genes and genomes. Nucleic Acids Res. 1999; 27(1):29–34. | ||
Sherman BT, Huang Daw, Tan Q, et al. DAVID knowledgebase: a gene-centered database integrating heterogeneous gene annotation resources to facilitate high-throughput gene functional analysis. BMC Bioinfo. 2007;8:426. | ||
Zhao J, Li P, Feng H, et al. Cadherin-12 contributes to tumorigenicity in colorectal cancer by promoting migration, invasion, adhersion and angiogenesis. J Transl Med. 2013;11(1):288. | ||
Huang Daw, Sherman BT, Lempicki RA. Systematic and integrative analysis of large gene lists using DAVID bioinformatics resources. Nat Protoc. 2009;4(1):44–57. | ||
Ashburner M, Ball CA, Blake JA, et al. Gene ontology: tool for the unification of biology. The gene ontology Consortium. Nat Genet. 2000;25(1):25–29. | ||
Wang J, Guo X, Xie C, Jiang J. Kif15 promotes pancreatic cancer proliferation via the MEK-ERK signalling pathway. Br J Cancer. 2017;117(2):245–255. | ||
Zhou N, Singh K, Mir MC, et al. The investigational Aurora kinase A inhibitor MLN8237 induces defects in cell viability and cell-cycle progression in malignant bladder cancer cells in vitro and in vivo. Clin Cancer Res. 2013;19(7):1717–1728. | ||
Klejnot M, Falnikar A, Ulaganathan V, Cross RA, Baas PW, Kozielski F. The crystal structure and biochemical characterization of Kif15: a bifunctional molecular motor involved in bipolar spindle formation and neuronal development. Acta Crystallogr D Biol Crystallogr. 2014;70(Pt 1):123–133. | ||
Messin LJ, Millar JB. Role and regulation of Kinesin-8 motors through the cell cycle. Syst Synth Biol. 2014;8(3):205–213. | ||
Drechsler H, McHugh T, Singleton MR, Carter NJ, McAinsh AD. The Kinesin-12 Kif15 is a processive track-switching tetramer. Elife. 2014;3:e01724. | ||
Eskova A, Knapp B, Matelska D, et al. An RNAi screen identifies Kif15 as a novel regulator of the endocytic trafficking of integrin. J Cell Sci. 2014;127(Pt 11):2433–2447. | ||
Sturgill EG, Norris SR, Guo Y, Ohi R. Kinesin-5 inhibitor resistance is driven by Kinesin-12. J Cell Biol. 2016;213(2):213–227. | ||
Zou JX, Duan Z, Wang J, et al. Kinesin family deregulation coordinated by bromodomain protein ANCCA and histone methyltransferase MLL for breast cancer cell growth, survival, and tamoxifen resistance. Mol Cancer Res. 2014;12(4):539–549. | ||
Bidkhori G, Narimani Z, Hosseini Ashtiani S, Moeini A, Nowzari-Dalini A, Masoudi-Nejad A. Reconstruction of an integrated genome-scale co-expression network reveals key modules involved in lung adenocarcinoma. PLoS One. 2013;8(7):e67552. | ||
Ma HT, Erdal S, Huang S, Poon RY. Synergism between inhibitors of Aurora A and KIF11 overcomes KIF15-dependent drug resistance. Mol Oncol. 2014;8(8):1404–1418. | ||
Grossman HB, Natale RB, Tangen CM, et al. Neoadjuvant chemotherapy plus cystectomy compared with cystectomy alone for locally advanced bladder cancer. N Engl J Med. 2003;349(9):859–866. | ||
Vajravelu BN, Hong KU, Al-Maqtari T, et al. C-kit promotes growth and migration of human cardiac progenitor cells via the PI3K-Akt and MEK-ERK pathways. PLoS One. 2015;10(10):e0140798. | ||
Ning X, Deng Y. Identification of key pathways and genes influencing prognosis in bladder urothelial carcinoma. Onco Targets Ther. 2017;10:1673–1686. | ||
Hayashido Y, Kitano H, Sakaue T, et al. Overexpression of integrin αv facilitates proliferation and invasion of oral squamous cell carcinoma cells via MEK/ERK signaling pathway that is activated by interaction of integrin αvβ8 with type Ⅰ collagen. Int J Oncol. 2014;45(5):1875–1882. | ||
Johnson GL, Stuhlmiller TJ, Angus SP, Zawistowski JS, Graves LM. Molecular pathways: adaptive kinome reprogramming in response to targeted inhibition of the BRAF-MEK-ERK pathway in cancer. Clin Cancer Res. 2014;20(10):2516–2522. | ||
Daksis JI, Lu RY, Facchini LM, Marhin WW, Penn LJ. Myc induces cyclin D1 expression in the absence of de novo protein synthesis and links mitogen-stimulated signal transduction to the cell cycle. Oncogene. 1994;9(12):3635–3645. |
 © 2019 The Author(s). This work is published and licensed by Dove Medical Press Limited. The full terms of this license are available at https://www.dovepress.com/terms.php and incorporate the Creative Commons Attribution - Non Commercial (unported, v3.0) License.
By accessing the work you hereby accept the Terms. Non-commercial uses of the work are permitted without any further permission from Dove Medical Press Limited, provided the work is properly attributed. For permission for commercial use of this work, please see paragraphs 4.2 and 5 of our Terms.
© 2019 The Author(s). This work is published and licensed by Dove Medical Press Limited. The full terms of this license are available at https://www.dovepress.com/terms.php and incorporate the Creative Commons Attribution - Non Commercial (unported, v3.0) License.
By accessing the work you hereby accept the Terms. Non-commercial uses of the work are permitted without any further permission from Dove Medical Press Limited, provided the work is properly attributed. For permission for commercial use of this work, please see paragraphs 4.2 and 5 of our Terms.