")
Back to Journals » OncoTargets and Therapy » Volume 12
Key Genes And Pathways Controlled By E2F1 In Human Castration-Resistant Prostate Cancer Cells
Authors Zhou Q, Wang C, Zhu Y, Wu Q, Jiang Y , Huang Y , Hu Y
Received 27 May 2019
Accepted for publication 18 September 2019
Published 31 October 2019 Volume 2019:12 Pages 8961—8976
DOI https://doi.org/10.2147/OTT.S217347
Checked for plagiarism Yes
Review by Single anonymous peer review
Peer reviewer comments 2
Editor who approved publication: Dr Leo Jen-Liang Su
Video abstract presented by Qingniao Zhou.
Views: 271
Qingniao Zhou,1,2 Chengbang Wang,1,2 Yuanyuan Zhu,3 Qunying Wu,1,2 Yonghua Jiang,3,4 Yuanjie Huang,3 Yanling Hu1–4
1Department of Biochemistry and Molecular Biology, School of Pre-Clinical Medicine, Guangxi Medical University, Nanning, Guangxi 530021, People’s Republic of China; 2Guangxi Colleges and Universities Key Laboratory of Biological Molecular Medicine Research, Guangxi Medical University, Nanning, Guangxi 530021, People’s Republic of China; 3Life Sciences Institute, Guangxi Medical University, Nanning, Guangxi 530021, People’s Republic of China; 4Center for Genomic and Personalized Medicine, Guangxi Medical University, Nanning, Guangxi 530021, People’s Republic of China
Correspondence: Yanling Hu
Life Sciences Institute of Guangxi Medical University, Nanning, Guangxi 530021, People’s Republic of China
Tel +86 771 533 4336
Email [email protected]
Background: Treatment of castration-resistant prostate cancer (CRPC) is an enormous challenge. As E2F transcription factor 1 (E2F1) is an essential factor in CRPC, this study investigated the genes and pathways controlled by E2F1 and their effects on cellular behavior in CRPC.
Methods: In vitro assays were used to evaluate cellular proliferation, apoptosis, and behavior. Cellular expression was quantified by RNA sequencing (RNA-seq). Gene co-expression was assessed using the GeneMANIA database, and correlations were analyzed with the GEPIA server. Altered pathways of differentially expressed genes (DEGs) were revealed by functional annotation. Module analysis was performed using the STRING database and hub genes were filtered with the Cytoscape software. Some DEGs were validated by real-time quantitative PCR (RT-qPCR).
Results: Knockdown of E2F1 significantly inhibited proliferation and accelerated apoptosis in PC3 cells but not in DU145 cells. Invasion and migration were reduced for both cell lines. A total of 1811 DEGs were identified in PC3 cells and 27 DEGs in DU145 cells exhibiting E2F1 knockdown. Ten overlapping DEGs, including TMOD2 and AIF1L, were identified in both knockdown cell lines and were significantly enriched for association with actin filament organization pathways. TMOD2 and KREMEN2 were genes co-expressed with E2F1; six overlapping DEGs were positively correlated with transcription factor E2F1. DEGs of the PC3 and DU145 groups were associated with multiple pathways. Five DEGs that overlapped between the two cell lines and three hub DEGs from PC3 cells were validated by RT-qPCR.
Conclusion: The results of this study suggest that E2F1 has a critical role in regulating actin filaments, as indicated by the change in expression level of several genes, including TMOD2 and AIF1L, in CRPC. This extends our understanding of the cellular responses affected by E2F1 in CRPC.
Keywords: CRPC, E2F1, transcriptome, RNA-seq
Introduction
Prostate cancer (PCa) has a high mortality rate and is one of the most common cancers in males worldwide.1 Although prostate cancer responds to therapy after diagnosis, it can also develop into a generally fatal form, castration-resistant PCa (CRPC).2 The androgen receptor (AR) in CRPC can function in an androgen-independent manner, signaling to other pro-survival and proliferative pathways and leading to cancer cell progression.3,4
Using a comprehensive CRPC regulatory network,5 we identified E2F transcription factor 1 (E2F1) as an essential target gene that could affect the AR. E2F1 can regulate the transcription of target genes and was the first member of the E2F family of transcription factors to be identified.6 It is a crucial factor in many cancers, including CRPC,7–9 and is involved in AR-independent CRPC development in vivo.10 Furthermore, all genes were negatively regulated by E2F1 in the CRPC regulatory network, which raised the question: are there genes that are negatively regulated by E2F1 in CRPC?
Although the cellular function of E2F1 in CRPC has been investigated,11–13 the underlying genetic mechanism of regulation remains unknown. Further study is needed to understand the regulation of genes by E2F1 at the transcriptome level, especially essential genes negatively regulated by E2F1. RNA sequencing (RNA-seq) provides an efficient method for transcriptome analyses of gene expression, enabling the detection of differentially expressed genes (DEGs) during biological progression.14,15 RNA-seq has been used to analyze copper exposure knockout cells with downregulation of ATP7B and identify 103 DEGs that regulate autophagy.16 Thus, RNA-seq was a suitable technique to test our hypothesis.
In the present study, we performed cellular experiments in PC3 and DU145 cell lines with knockdown of E2F1 expression, because this gene is overexpressed in CRPC cells.17 The effect of E2F1 on cellular behavior in CRPC was studied, and DEGs and pathways controlled by E2F1 were investigated. Subsequently, several DEGs were validated by real-time quantitative PCR (RT-qPCR), and protein expression in tissues and correlation analysis were assessed using various databases. We found E2F1-related signaling pathways and investigated significant DEGs in CRPC, thereby extending our understanding of CRPC cellular responses affected by E2F1.
Materials And Methods
Cell Culture And Infection
PC3 and DU145 cells were obtained from the Suzhou Institute of Biomedical Engineering and Technology, Chinese Academy of Sciences, and cultured at 37 °C in RPMI-1640 containing 10% fetal bovine serum (FBS; Gibco, Grand Island, NY, USA). A virus expressing a short hairpin RNA (shRNA) targeting E2F1 and a TMOD2 overexpression virus were obtained from GenePharma Co., Ltd. (Shanghai, China) and used for infection. The E2F1 targeted shRNA sequence was as follows: 5′-GCUAUGAGACCUCACUGAATT-3′.18 Stably infected cell lines were obtained by selective screening with puromycin (1 mg/mL; Solarbio, Beijing, China) for one week.
Determination Of Knockdown And Overexpression Efficiency
Total RNA was extracted from the control samples (PC3_vector and DU145_vector) as well as from the experimental samples (PC3_shE2F1 and DU145_shE2F1) using the AxyPrep TM Multisource Total RNA Miniprep Kit (Corning Incorporated; NY, USA). Total RNA was used to synthesize cDNA using the HiScript II 1st Strand cDNA Synthesis Kit (Vazyme, Nanjing, China). RT-qPCR was performed in triplicate using TB Green™ Premix Ex Taq™ II (Tli RNaseH Plus) (Takara Biomedical Technology Co., Ltd., Japan). The relative mRNA expression levels of PC3 and DU145 were normalized to that of GAPDH (glyceraldehyde-phosphate dehydrogenase) and compared with the control, and experimental groups were determined by the 2-∆∆CT method. The quantitative RT-PCR primers for human E2F1 are as Table S1.
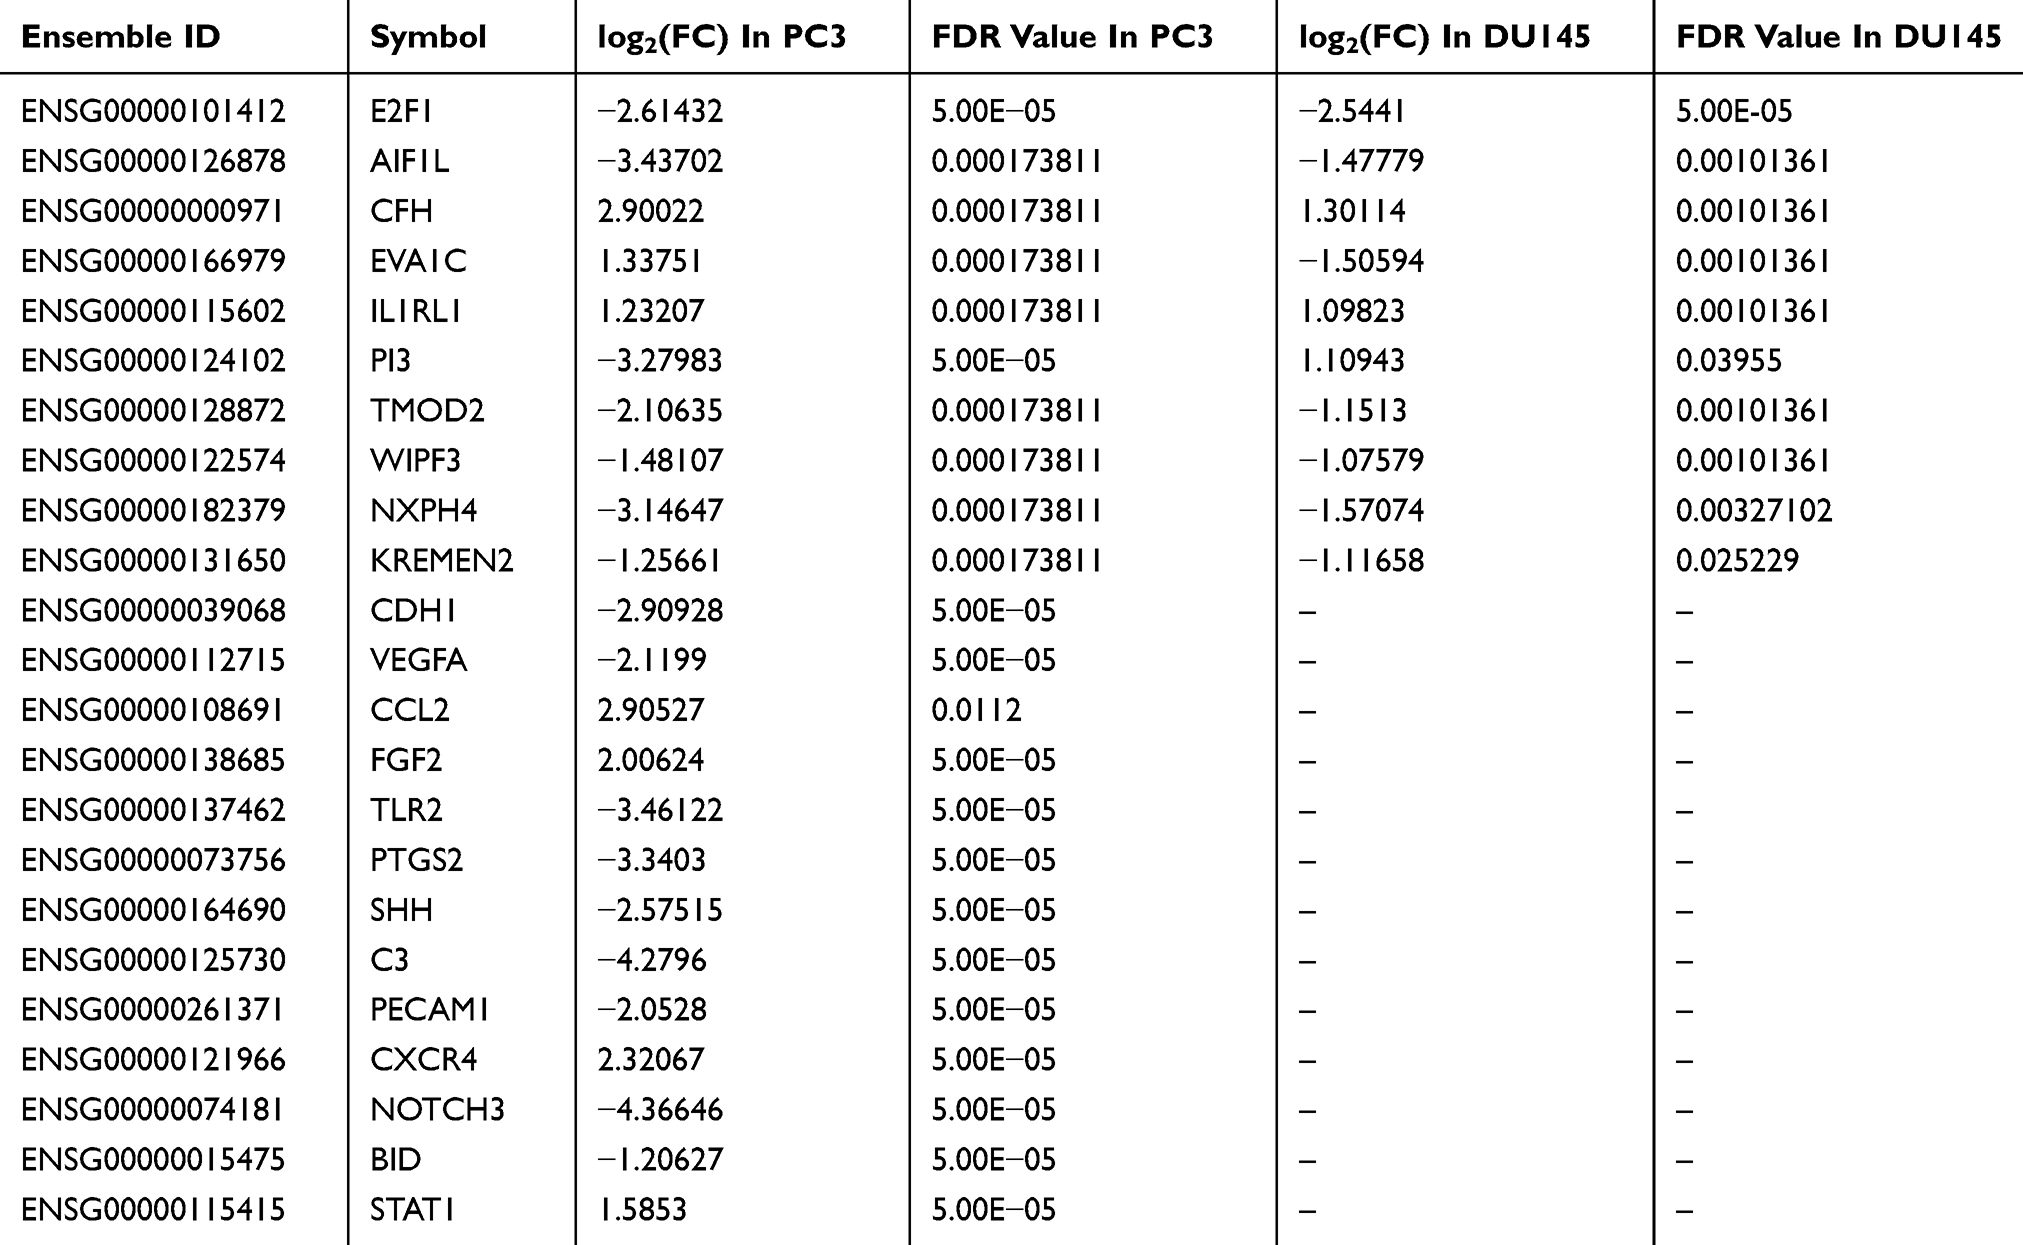 |
Table 1 Important DEGs Of PC3 And DU145 With Down-Regulation Of E2F1 |
For the Western blot analysis, post-transfection PC3 and DU145 cells that had been incubated for 48 hrs were collected for protein isolation. Each protein was separated on a 10% sodium dodecyl sulfate polyacrylamide gel and transferred to a polyvinylidene difluoride membrane (Millipore, MA, USA). These membranes were incubated with block buffer (Beyotime, Beijing, China) and probed with the primary antibody for E2F1 (cat. no., 3742; anti-rabbit; 1:2,000; Cell Signaling Technology Inc., Danvers, MA, USA) or TMOD2 (cat. no., ab124833; anti-rabbit; 1:2,000; Abcam Inc., Cambridge, MA, USA), GAPDH (cat. no., 10494-1-AP; anti-rabbit; 1:2,000; ProteinTech Group, Inc., Wuhan, China) at 4 °C overnight. Then, membranes were incubated with the corresponding second antibody (cat. no., SA00001-2; 1:10,000; ProteinTech Group, Inc., Wuhan, China) at 4 °C for 2 h before being scanned and photographed.
Cell Proliferation Assays
A total of 2.5×10³ cells were seeded in 96-well plates, and cell viability was determined at 24 h, 48 h, 72 h, and 96 h using a Cell Counting Kit-8 (CCK-8; Dojindo, Japan) according to the manufacturer’s protocol. The absorbance values of the 96-well plates were measured at 450 nm with a Quant Microplate Spectrophotometer (BioTek, Winooski, VT, USA).
Cell Invasion And Migration Assays
The chambers of 8-µM-pore transwell plates (Corning Incorporated; Corning, NY, USA) were coated with or without Matrigel (BD Biosciences, NJ, USA) at 37 °C for 1 h. Then, 700 µl medium containing 10% (v/v) FBS was added into the lower chamber, and 5×10⁴ hungry cells diluted in serum-free medium were seeded into the upper chamber. After incubation at 37 °C for 48 h, the upper chambers were fixed using 100% methanol and stained with 1% crystal violet at room temperature for 15 min. Cells in the upper chambers were then photographed at ×10 magnification using an inverted phase contrast microscope (DMi8; LEICA Corporation, Germany). The crystal violet in the upper chamber was washed with 33% acetic acid, and the wash solution was transferred to 96-well plates. The absorption value at 570 nm was measured with an ELISA reader (BioTek, Winooski, VT, USA).19
Cell Apoptosis Analysis
Apoptosis was detected in each group using an Annexin V-APC/7-AAD apoptosis kit (Multi Sciences, Hangzhou, China) according to the manufacturer’s protocol. The results were analyzed with CellQuest Pro 6.0.
RNA Sequencing
The sequencing was performed in triplicate. The cDNA of each sample was synthesized from 1 μg total RNA using SuperScript II Reverse Transcriptase (Thermo Fisher Scientific, Waltham, MA, USA), and the cDNA library was prepared according to the Illumina TruSeq Stranded Total RNA Reference Guide. We used RNA-seq (Illumina NextSeq 500) to obtain about 8 G reads per sample. The sequencing data were submitted to the Gene Expression Omnibus database (https://www.ncbi.nlm.nih.gov/geo/) with accession number GSE121258.
RNA-Seq Alignment Of Data
We used the Illumina BaseSpace platform (https://www.illumina.com/products/by-type/informatics-products/basespace-sequence-hub/apps.html) to analyze the RNA-seq data. The FastQC application was used to analyze the quality control of pre-processing data. For the RNA-seq alignment, we chose Homo sapiens (PAR-masked)/hg38 (RefSeq) as the reference sequence, with STAR as the aligner, and used Call Fusions and the Trim TruSeq Adapter. Principal component analysis (PCA) was used to analyze the clustering of samples, and the Pearson correlation was calculated.
DEG Analysis
In the Cufflinks Assembly & DE application, Homo sapiens (PAR-masked)/hg38 (RefSeq) was also used as a reference sequence, with the first strand selected as the strandedness parameter, and STAR as the aligner. After the Cufflinks treated reads, Cuffdiff 2 was used to analyze the DEGs. The false discovery rate value ≤ 0.05 and the |log2 fold change| > 1 were used as the DEG standards. Interactive networks of co-expressed DEGs of PC3 and DU145 cells were generated using GeneMANIA to establish gene interactions and predict gene co-expression.20 The GEPIA database was used to obtain expression patterns and for correlation analysis of DEGs.21
Functional Annotations Of The DEGs
Functional analysis was performed for DEGs between the PC3 group (including the PC3_vector group and the PC3_shE2F1 group) and DU145 group (DU145_vector group and DU145_shE2F1 group). The Metascape database was used for pathway enrichment analysis.22 The selection criterion for significant pathways was a P-value < 0.05.
Construction Of PPI Network And Screening Of Hub DEGs
The DEGs of the PC3 group were submitted to the STRING database23 to obtain a protein–protein interaction (PPI) network. Cytoscape (version 3.7.1)24 was used for the analysis of PPI networks, with a combined score > 0.9 as the cut-off criterion. Cytoscape plugin CytoHubba25 was used to select the top 10 hub genes, then molecular complex detection with MCODE was performed to obtain the module.
Validation For DEGs
RT-qPCR was performed to assess five overlapping DEGs of the PC3 and DU145 cell group, and three hub DEGs of the PC3 cell group, and the expression levels were compared with those of the vector group. The primers used in this experiment are listed in Table S1. The expression level of each example was normalized to GAPDH, and the 2−ΔΔCt method was used to analyze the results. Protein expression levels of DEGs in normal tissues and PCa tissues were determined using the Human Protein Atlas (www.proteinatlas.org). A box map was used to illustrate the expression levels of 492 tumor samples and 152 normal samples.
Patients And Samples
Five human PCa tissue samples and five normal prostate tissue samples were obtained from patients at the First Affiliated Hospital of Guangxi Medical University (Nanning, China). Final histological diagnosis of PCa samples was confirmed by two pathologists. The study was conducted with the approval of the Ethics Committee of Guangxi Medical University, and written informed consent was provided by all participants. RNA extraction and RT-qPCR were performed to assess expression levels of DEGs in these tissues.
Results
Proliferation, Apoptosis, And Behavior Of CRPC Cells With Knockdown Of E2F1
PC3 and DU145 cell lines were constructed with the depletion of E2F1. Whereas PC3 was phenotypically different, the DU145 cell line was similar to the control (Figure 1A and B). Protein expression of E2F1 was suppressed by shE2F1 in both cell lines (P < 0.001; Figure 1C and D).
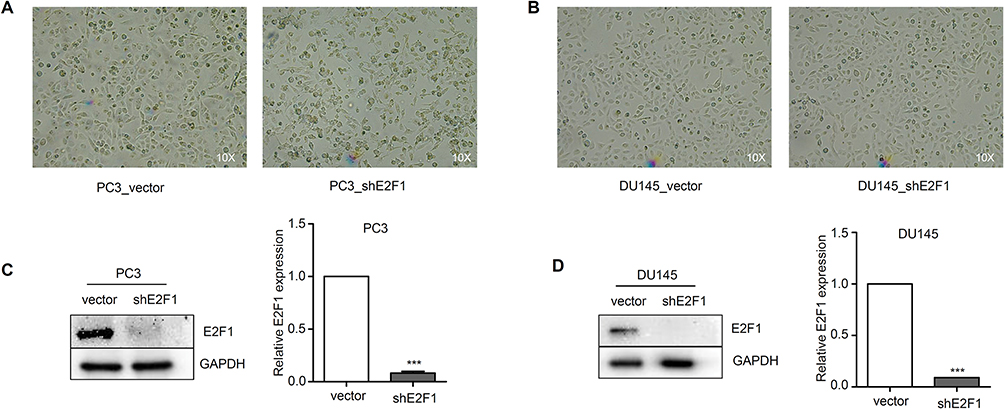 |
Figure 1 Construction of PC3 and DU145 cells with depletion of E2F1.Notes: Phenotypic characterization of PC3 (A) and DU145 (B) groups; “vector”, empty vector as negative control; ‘shE2F1ʹ, shRNA for E2F1. Expression of E2F1 was suppressed by shE2F1 in PC3 (C) and DU145 (D). Statistical significance was calculated using an independent-samples t-test, ***P<0.001. |
To investigate the impact of E2F1 depletion on the CRPC cell lines, we assessed apoptosis, proliferation, migration, and invasion of DU145 and PC3 cells after knockdown of E2F1. As shown in Figure 2A, compared with PC3 cells transfected with the vector alone (PC3_vector), cells transfected with shE2F1 (PC3_shE2F1) showed an increase in early apoptosis from 1.4% to 22.3%, and in late-stage apoptosis from 0.5% to 4.6%, with the most significant change occurring during the early apoptosis stage (P < 0.001). By contrast, in DU145 cells, E2F1 depletion did not cause any change compared with controls (P > 0.05). In the CCK-8 experiment, knockdown of E2F1 significantly reduced cell growth in PC3 cells (Figure 2B) but did not repress the proliferation ability of DU145 cells (Figure 2C). In addition, the invasion and migration activities of both cell types were suppressed by downregulation of E2F1. After incubation, migration and invasion rates were reduced by almost 50% in PC3 cells with the downregulation of E2F1, compared with PC3 cells transfected with the vector control (migration, P < 0.01; invasion, P < 0.01; Figure 2D and E). Cell numbers of DU145 cells with E2F1 knockdown were also decreased compared with controls (migration and invasion, P < 0.01; Figure 2F and G).
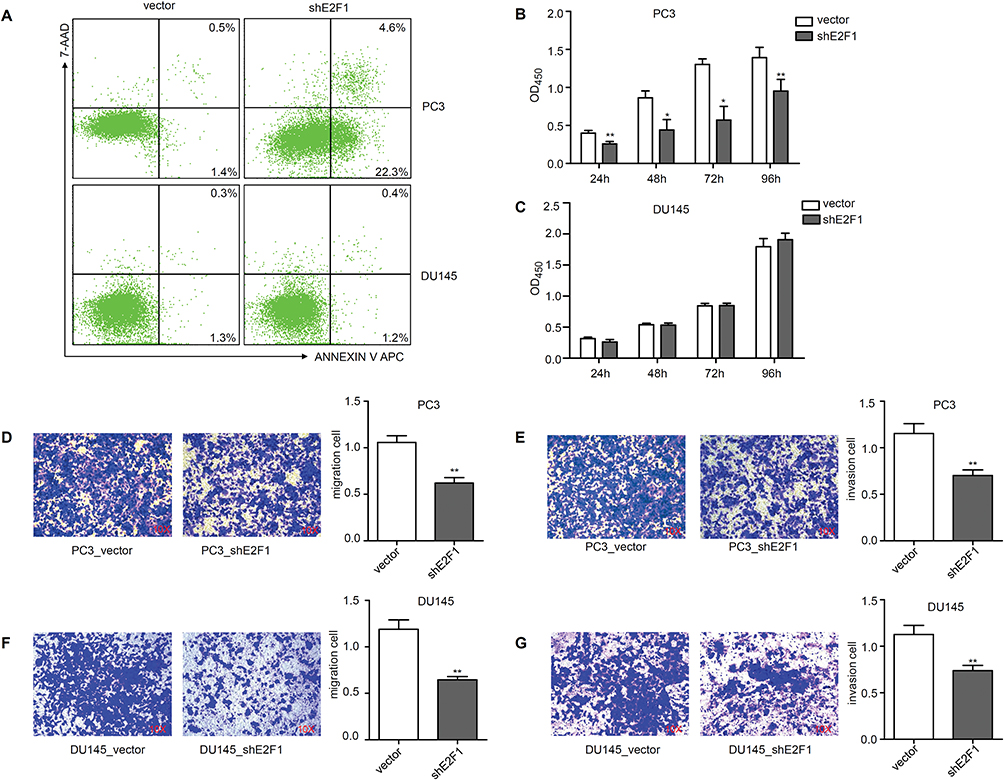 |
Figure 2 Cellular experiments for PC3 and DU145 after knockdown of E2F1. Notes: Apoptosis level of PC3 and DU145 groups (A). Proliferation level of PC3 (B) and DU145 (C). PC3 cell migration (D) and invasion (E) and DU145 cell migration (F) and invasion (G) were detected. Statistical significance was calculated using an independent-samples t-test; *P<0.05, **P<0.01. |
Overview Of RNA Sequencing Data From CRPC Cells With E2F1 Knockdown
To study the molecular mechanisms of E2F1 regulation in CRPC, and to determine why downregulation of E2F1 affected PC3 and DU145 cells differently, RNA-seq was used for transcript profiling. Using vector cells and E2F1 knockdown in PC3 and DU145 cells, 12 sequencing samples were prepared, with each of the four experimental groups having three replicates. There was good internal consistency of replicate samples in each of the groups, PC3_vector, DU145_vector, PC3_shE2F1, and DU145_shE2F1 (Figure 3).
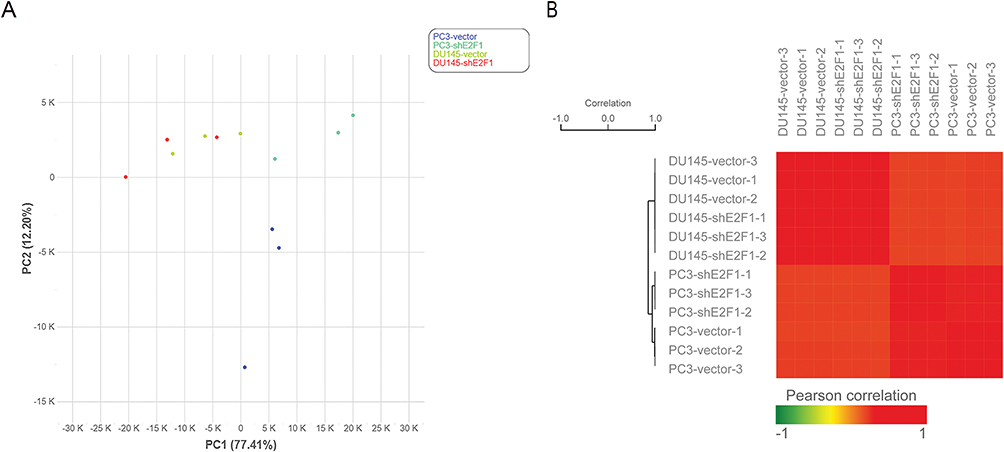 |
Figure 3 Data quality of RNA-seq. Notes: Replicate samples were clustered in the same groups, including the PC3_vector, PC3_shE2F1, DU145_vector, and PC3_shE2F1 groups (A). The correlation analysis results were consistent with the PCA results (B). |
Identification Of DEGs Associated With Downregulation Of E2F1
In total, the RNA-seq included 26,354 annotated transcripts for each type of cell. For PC3_shE2F1 cells, compared with PC3_vector cells, 1811 DEGs were identified, including 800 upregulated and 1011 downregulated genes (Figure 4A). DEG expression patterns for PC3 cells are shown in Figure 4B. Surprisingly, we only identified 27 DEGs in DU145_shE2F1 cells compared with DU145_vector cells, including six upregulated and 21 downregulated genes (Figure 4A). A Venn diagram (Figure 4C) was used to identify overlapping DEGs in the knockdown cell lines of PC3 and DU145; these included CFH (complement factor H), IL1RL1 (interleukin 1 receptor-like 1), EVA1C (Eva-1 homolog C), TMOD2 (tropomodulin 2), AIF1L (allograft inflammatory factor 1 like), WIPF3 (WAS/WASL-interacting protein family member 3), NXPH4 (neurexophilin-4), KREMEN2 (kremen protein 1), PI3 (peptidase inhibitor 3), and E2F1. Details of these 10 overlapping DEGs are given in Table 1.
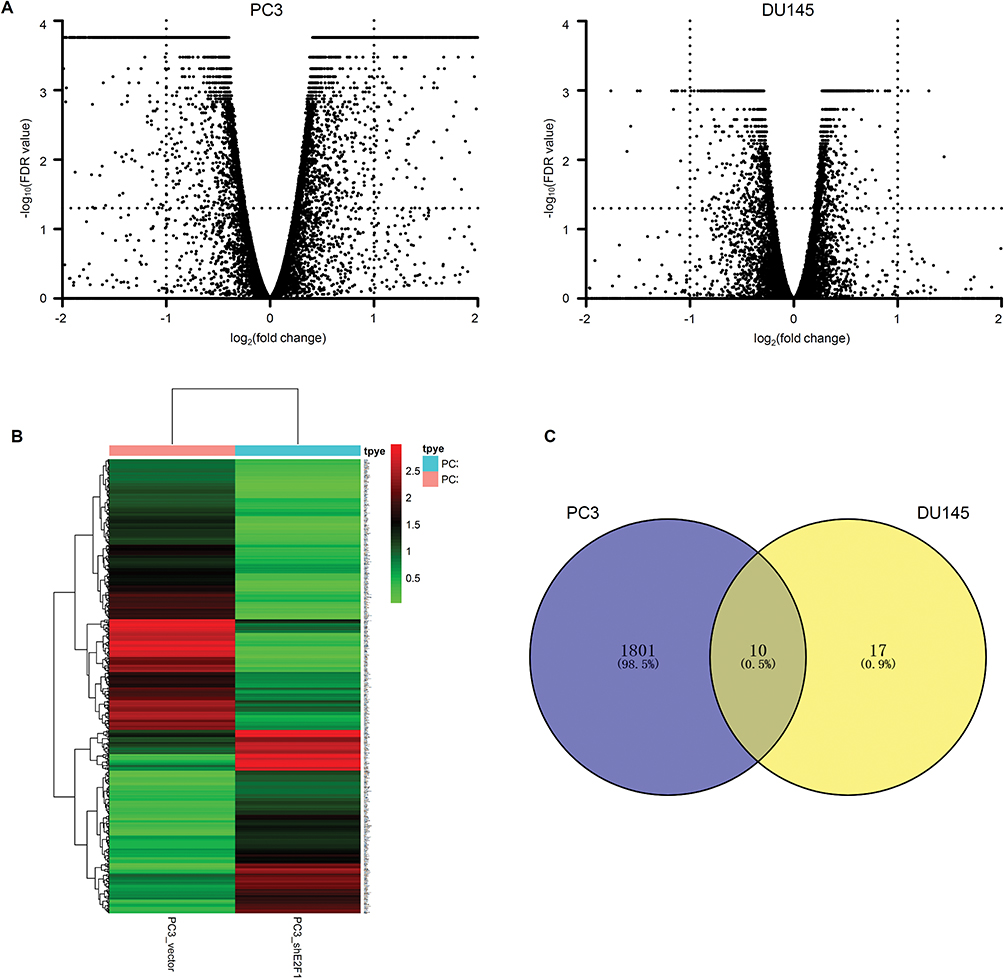 |
Figure 4 Comparison of DEGs between vector cells and shE2F1 cells. Notes: The volcano plot shows all the DEGs compared with vector cells of the PC3 and DU145 groups (A). The heatmap displays expression patterns of DEGs of the PC3 groups (B). Venn analysis of the overlapping DEGs of PC3 and DU145 with depletion of E2F1 (C). |
Gene Co-Expression Network And Correlation Analysis Of Overlapping DEGs With Depletion Of E2F1
To clarify the relationship of the 10 overlapping DEGs found in the two cell lines with E2F1 knockdown, analysis with the GeneMANIA database was used to establish gene interactive networks and to identify potential co-expressed genes in CRPC cells. Surprisingly, there were no direct inactive relationships for these 10 DEGs, and only a few overlapping DEGs showed potential co-expression with other genes (Figure 5A). The gene co-expression network was divided into two modules, KREMEN2 and TMOD2, co-expressed with E2F1, which were isolated from the other overlapping DEGs. However, CFH, EVA1C, AIF1L, and WIPF3 were not co-expressed with any DEGs according to our predictions.
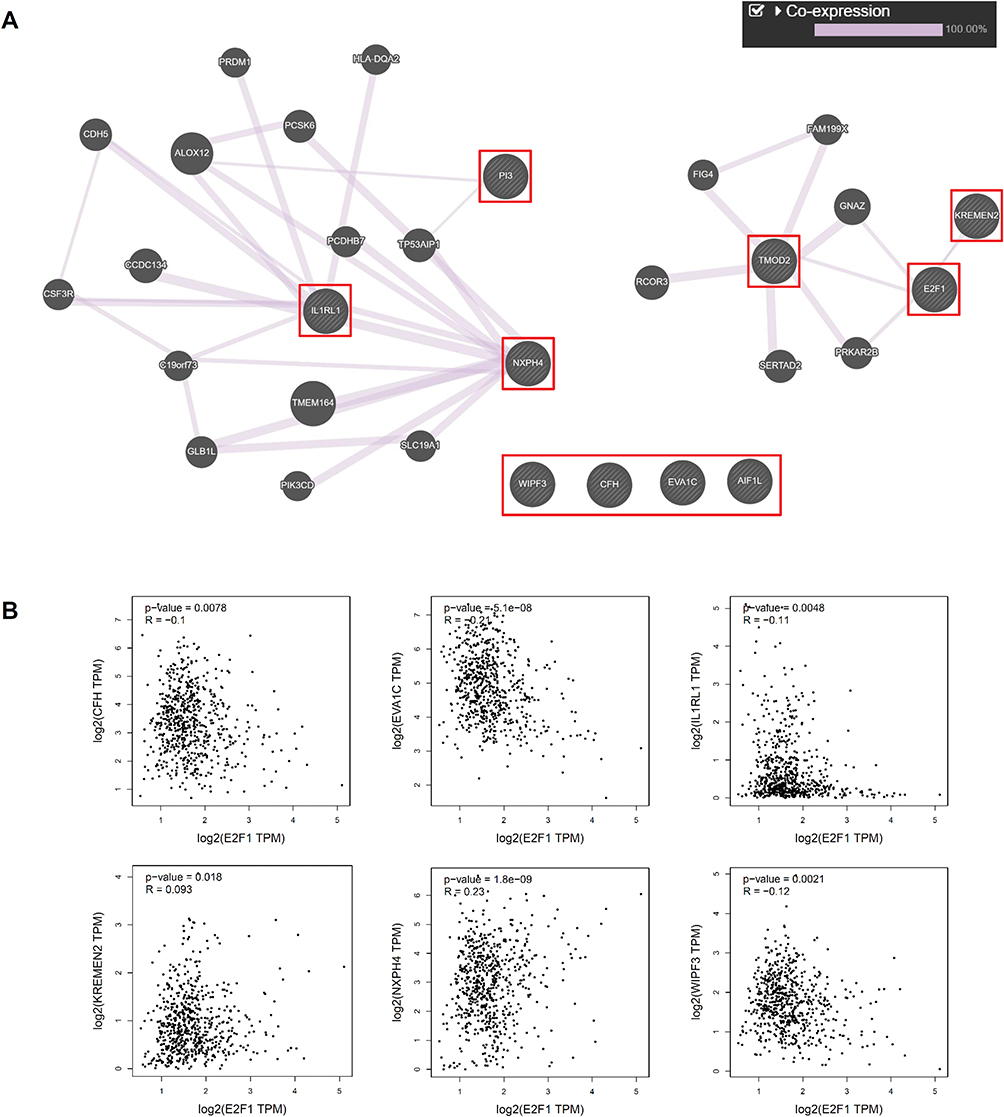 |
Figure 5 Gene co-expression network analysis and correlation analysis of overlapping DEGs with the depletion of E2F1. Notes: Gene co-expression network analysis of 10 overlapping DEGs (A). Correlation analysis of six overlapping DEGs and E2F1 (B). |
To investigate which DEGs were potentially regulated by E2F1, we analyzed that CFH, IL1RL1, EVA1C, WIPF3, NXPH4, and KREMEN2 expression levels were positively correlated with those of transcription factor E2F1 (Figure 5B). However, to determine whether E2F1 interacted directly with these factors would require further experimentation.
Functional Enrichment In Response To E2F1 Downregulation
To determine which pathways were changed after downregulation of E2F1, we searched the Metascape database for functional enrichment. The overlapping DEGs of the PC3 and DU145 groups were enriched in only one pathway, actin filament organization (Figure 6A). The 800 upregulated genes from the PC3 group were mainly associated with various signal pathways, such as defense responses to virus, cytokine signaling in the immune system, and responses to interferon-gamma, whereas the 1011 downregulated genes were mainly enriched in regulation of cell adhesion, epidermis development, and chemotaxis (Figure 6B and C). By contrast, the 27 DEGs of the DU145 group were enriched in two pathways: NABA ECM regulators and actin filament organization (Figure 6D).
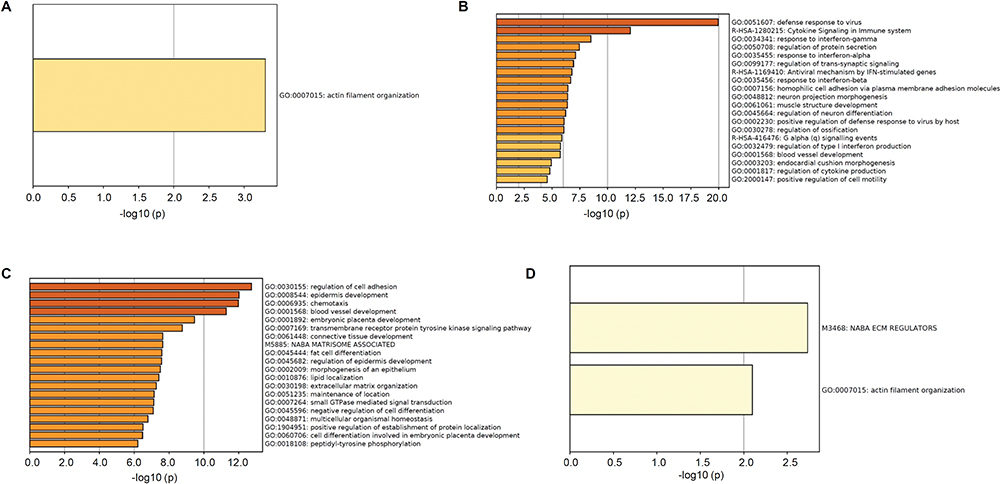 |
Figure 6 Functional enrichment analysis by Metascape. Notes: Significantly enriched pathways of overlapping DEGs (A), upregulated DEGs in PC3 group (B), and downregulated DEGs in PC3 group (C) and DU145 group (D). |
Module Analysis And Identification Of Hub DEGs For The PC3 Group
To assess whether the increased number of DEGs for the PC3 group were reflected in changes in several pathways and differences in cellular proliferation, apoptosis, and behavior, module analysis was carried out to identify relevant pathways and hub DEGs. Initially, we obtained modules with 153 nodes and 624 edges in total. From these, we selected the top four modules to be analyzed in terms of enriched pathways (Figure 7A–H). The DEGs in the top four modules were related to several significant signaling pathways. For example, DEGs in module 1 were significantly enriched for the interferon alpha/beta signaling pathway and responses to the interferon gamma pathway. DEGs in module 2 were significantly enriched for the G alpha signaling events pathway and neuropeptide signaling pathway. These top four modules were also associated with cellular behavior pathways. For example, DEGs in module 3 were significantly enriched for morphogenesis of epithelium. In module 4, the associations were with the epithelial cell morphogenesis pathway, epithelium migration pathway, and cell junction assembly pathway. For the DU145 groups, no interactions were found for the 27 DEGs using the STRING database; therefore, module analysis was not performed for DU145 with downregulation of E2F1.
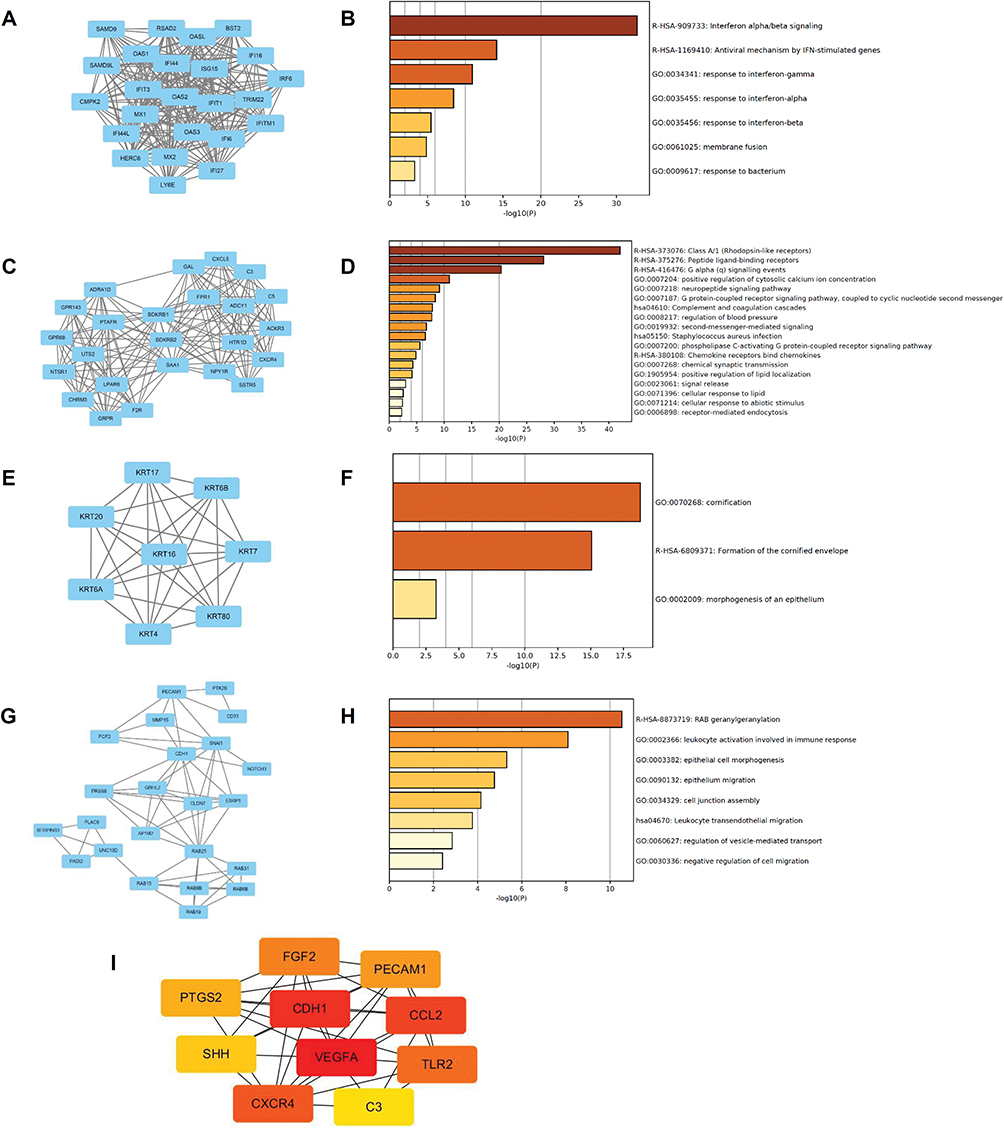 |
Figure 7 Module analysis and identification of DEGs in PC3 group. Notes: Module 1 (A) and its enriched pathways (B), module 2 (C) and its enriched pathways (D), module 3 (E) and its enriched pathways (F), module 4 (G) and its enriched pathways (H). Top 10 hub DEGs of the PC3 cell group with the depletion of E2F1 (I). |
The top 10 hub DEGs of the PC3 cell group with depletion of E2F1 were identified using the plug-in CytoHubba, which revealed interactions among these genes (Figure 7I). The top 10 hub DEGs included CCL2 (C-C motif chemokine ligand 2), FGF2 (fibroblast growth factor 2), TLR2 (toll-like receptor 2), CDH1 (cadherin 1), PTGS2 (prostaglandin-endoperoxide synthase 2), SHH (sonic hedgehog signaling molecule), C3 (complement C3), VEGFA (vascular endothelial growth factor A), PECAM1 (platelet and endothelial cell adhesion molecule 1), and CXCR4 (C-X-C motif chemokine receptor 4). Some other important DEGs of PC3, including NOTCH3 (notch receptor 3), BID (BH3 interacting domain death agonist), and STAT1 (signal transducer and activator of transcription 1) were also analyzed. Details of the 10 hub DEGs and three additional important DEGs are shown in Table 1.
Validation Of DEGs With Depletion Of E2F1
To confirm the DEGs of CRPC cells determined by RNA-seq, we examined expression levels of five overlapping genes and three hub DEGs of the PC3 group by RT-qPCR. The expression levels of CFH and IL1RL1 were higher in the two cell lines with knockdown of E2F1. By contrast, the levels of AIF1L and TMOD2 expression in PC3 and DU145 cells with knockdown of E2F1 were lower than those in cells transfected with the vector control. Notably, EVA1C expression was higher for PC3 cells and lower for DU145 cells with knockdown of E2F1 (Figure 8A). Levels of CDH1 and VEGFA expression in PC3 cells with knockdown of E2F1 were lower than those in cells transfected with the vector control, whereas CCL2 expression levels were higher than in control cells (Figure 8B). To assess whether TMOD2 affected the invasion and migration ability of CRPC cells, we constructed PC3 cells with overexpression of TMOD2 (Figure 8C). The invasion and migration activities of PC3 were enhanced by overexpression of TMOD2 (migration and invasion, P < 0.05; Figure 8D and E).
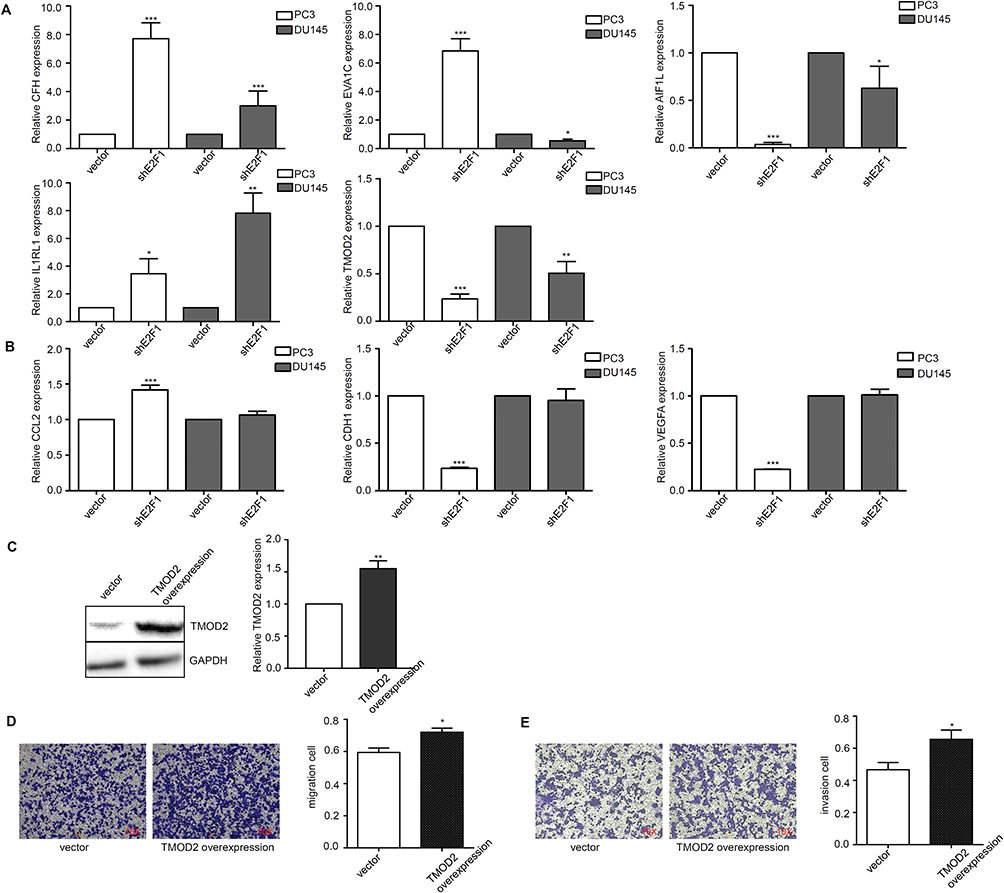 |
Figure 8 Validation of the expression levels and function of DEGs with the depletion of E2F1. Notes: The expression levels of DEGs with the depletion of E2F1 by RT-qPCR (A, B). Alteration of invasion and migration ability by over-expression of TMOD2 in PC3 cells (C–E). Statistical significance was calculated using an independent-samples t-test; *P<0.05, **P<0.01, ***P<0.001. |
To determine whether the DEGs were clinically relevant in PCa, we also analyzed their expression levels in clinical specimens. Expression levels of three overlapping DEGs, CFH, EVA1C, and IL1RL1, were lower in PCa tissue than in normal prostate tissue (Figure 9A, C and E). Consistently, CFH, EVA1C, and IL1RL1 mRNA levels were higher in normal prostate tissue than in PCa tissue (P < 0.05) according to the GEPIA database (Figure 9B, D and F). The expression levels of two DEGs of the PC3 group, CDH1 and PTGS2, were higher and lower, respectively, in PCa tissue compared with normal prostate tissue (Figure 9G and I). Similarly, CDH1 was overexpressed (P < 0.05) and PTGS2 was downregulated (P < 0.05) in PCa compared with normal tissue (Figure 9H and J). Expression levels of CFH, EVA1C, IL1RL1, and CDH1 were validated in five human PCa tissue samples and five noncancerous tissue samples collected from patients (Figure 9K–N).
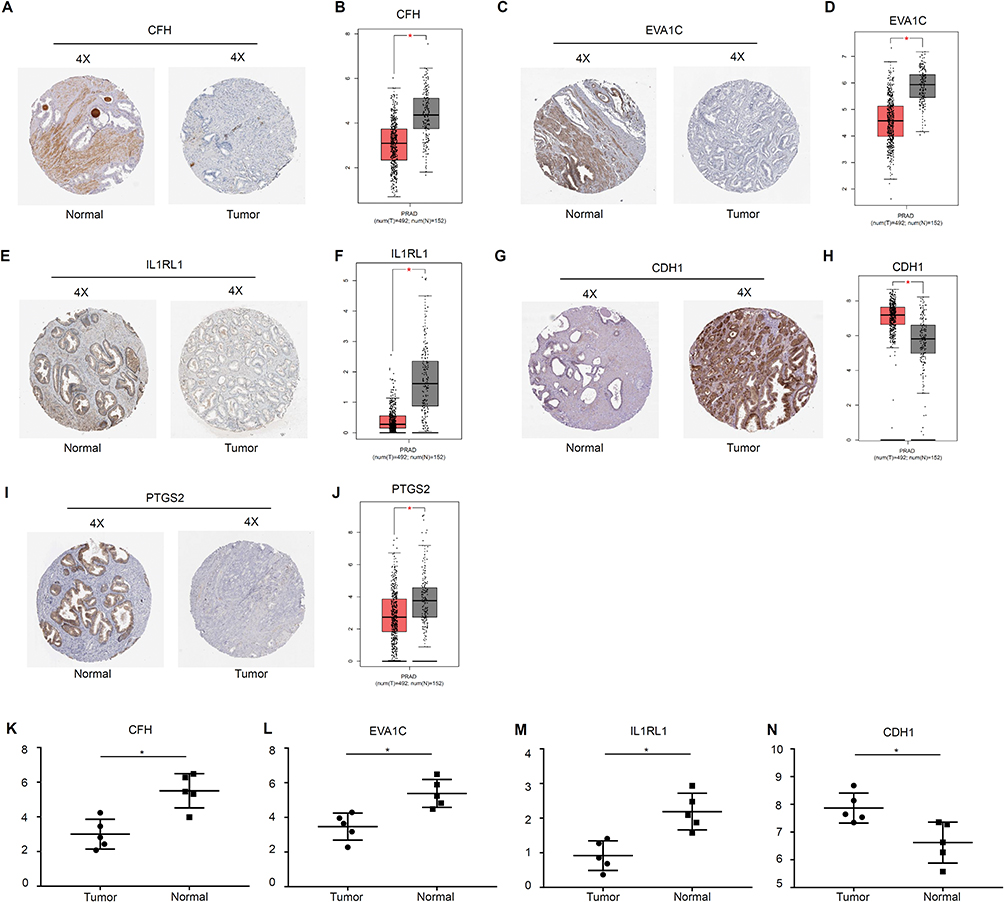 |
Figure 9 Validation of the expression levels of DEGs with the depletion of E2F1 using the Human Protein Atlas, GEPIA database, and patient tissues. Note: Validation by the Human Protein Atlas (A, C, E, G, and I), GEPIA database (B, D, F, H, and J), and patient tissues (K-N). Statistical significance was calculated using an independent-samples t-test, *P<0.05. |
Discussion
In this study, we constructed CRPC cells with depletion of E2F1 and found that knockdown of E2F1 had an impact on PC3 cells and DU145 cells in terms of cell proliferation, apoptosis, and behavior. We identified DEGs and associated pathways of CRPC cells by RNA-seq. Furthermore, using a series of bioinformatics tools, we identified several pathways and genes that were controlled by E2F1 and were potentially meaningful in CRPC or PCa. In addition, some DEGs were validated by RT-qPCR in cell lines and clinical tissues.
Our main concern was to identify pathways and DEGs linked to invasive migratory or metastatic abilities of CRPC cells with depletion of E2F1. Based on RNA-seq and Venn analysis, 10 overlapping DEGs were identified, TMOD2, CFH, IL1RL1, EVA1C, AIF1L, WIPF3, NXPH4, PI3, KREMEN2, and E2F1. These 10 overlapping DEGs were all enriched in one pathway, actin filament organization. Accumulating evidence suggests that the actin filament, which forms the cytoskeleton, is correlated with actin-driven processes such as invasion, migration, and metastasis of various cancer cells.26,27 Data indicate that reorganization of actin filaments is a crucial component of the invasive characteristics acquired by cancer cells. Collapsing response mediator protein-1, which is involved in actin organization, is a potential target for restricting metastasis in PCa.28 Notably, alendronate has been shown to stimulate destruction of the actin cytoskeleton and to reduce the migratory and invasive power of CRPC cells.29 Although multiple actin filament pointed-end capping proteins are crucial regulators of the cytoskeleton, TMOD is the only protein family that has been shown to cap the slowly growing pointed end.30 Based on our analysis, TMOD2, a member of the TMOD family,31 was co-expressed with E2F1, as determined by GeneMANIA, and its differential expression level in the PC3 and DU145 groups was also validated by RT-qPCR. A previous study indicated that TMOD2 increases the level of dendritic branching and number of mature dendritic spines;32 however, most functional studies of TMOD2 have been concerned with neuron development.31 There has been no report on how TMOD2 affects the migratory and invasive power of CRPC cells. In the present study, we confirmed that overexpression of TMOD2 enhances the invasion and migration ability of PC3 cells. A previous study showed that the actin-bundling protein AIF1L stabilized actomyosin contractility by regulation of podocytes’ filopodial extension.33 However, besides these results for TMOD2 and AIF1L, there has been a lack of research relating to the other eight overlapping DEGs in terms of actin filaments. In the current study, the invasion and migration of the two cell lines were changed by downregulation of E2F1. Thus, alterations in the actin organization pathway could alter CRPC cell migration and invasion, which could affect CRPC metastasis and progression. Our study was the first to examine the impact of E2F1 on CRPC cellular migration and invasion through regulation of the actin filament organization pathway, via the expression of TMOD2. It is possible that some of the other overlapping DEGs are also involved in actin filament organization, as their functions were not clearly defined.
Subsequently, we obtained a gene co-expression network for the 10 overlapping DEGs using GeneMANIA. A previous study showed that the gene KREMEN2, which is co-expressed with E2F1, is an effective inhibitor of cell death, which is triggered by Kremen1 in a variety of cancers.34 Moreover, the expression of KREMEN2 could serve as one of the combined predictive markers of PCa bone metastasis.35 Another study showed that most of the downregulated genes related to CFH were associated with immunity and inflammation in PCa tissue;36 inflammation can change the osmotic pressure and behavior of cells. Thus, KREMEN2 and CFH were identified as essential regulatory factors in PCa and CRPC. With regard to CRPC and PCa, there have been no previous reports for the seven other overlapping DEGs, TMOD2, EVA1C, IL1RL1, AIF1L, PI3, WIPF3, and NXPH4. Our gene co-expression network could be divided into two parts: KREMEN2 and TMOD2 were co-expressed with E2F1, which was isolated from other overlapping DEGs. However, analysis showed that CFH, IL1RL1, EVA1C, WIPF3, NXPH4, and KREMEN2 expression levels were positively correlated with those of transcription factor E2F1. For the other four independent DEGs, CFH, EVA1C, AIF1L, and WIPF3, it is possible that one or two of them might react or be co-expressed with E2F1 and IL1RL1, bridging the connection between the two parts of the co-expressed gene network. However, testing of such a hypothesis would require further experimentation. Currently, there are insufficient data to support an interactive relationship of the 10 overlapping DEGs in CRPC or PCa; however, the results of the current study suggest that future work on evaluating the interaction and co-expression of these genes would be valuable.
Next, we focused on why CRPC cell lines performed differently upon downregulation of E2F1. The PC3 group had more DEGs and, consequently, more pathways associated with downregulation of E2F1. The top 10 hub DEGs of PC3 cells with downregulation of E2F1 were CDH1, VEGFA, CCL2, FGF2, TLR2, PTGS2, SHH, C3, PECAM1, and CXCR4. Previous studies have suggested that CDH1 is closely associated with metastasis in patients with CRPC,37 and also associated with PCa.38 Several studies have indicated that VEGFA plays an essential part in angiogenesis by inducing cell proliferation and migration.39,40 Accumulating evidence indicates that higher expression levels of CCL2 regulate CRPC through cell migration,41,42 and studies have identified FGF2 as a driving force for chromosomal instability via regulating epithelial-to-mesenchymal transition (EMT) in PCa.43,44 Notably, PTGS2, also known as COX2, was reported to trigger the inhibition of motility and metastasis in PCa cells.45 A study also revealed that TLR4 regulates PCa cell proliferation, migration, and invasion,46 whereas SHH has been shown to promote metastasis of PCa by affecting tumor-stromal cell interactions.47 Another study showed that enhancing the expression of CXCR4 promoted migration and stimulated metastasis through EMT of PCa cells.48 Thus, the hub DEGs identified in PC3 cells with downregulation of E2F1 have been shown to participate in cellular proliferation, apoptosis, and behavior changes of CRPC cells.
Besides the hub DEGs, other important DEGs such as NOTCH3, BID, and STAT1 also have essential roles in growth and apoptosis in cells. The Notch pathway has been shown to be involved with the growth and invasion of T2E-positive PCa cells.49 NOTCH3 is a member of the Notch signaling pathway, which promotes cell growth in various diseases,50,51 and participates in androgen deprivation in PCa.52 Moreover, BID is a well-known factor associated with cell death.53 Expression levels of Bid are increasingly used to measure apoptosis of PCa cells.54,55 Multiple studies have reported that STAT1 participates in pathways that induce apoptosis in various cancers.56–58 It may also promote recurrence in patients with AR-independent PCa by increasing cell apoptosis.59 As well as the DEGs, another difference between the PC3 and DU145 cell lines is that PC3 is a PTEN mutant, whereas DU145 is a wild-type CRPC cell line.60,61 This might be significant as stimulation of the PTEN-PI3K pathway sustains growth, proliferation, invasion, and apoptosis of cancer cells.62,63 Previous evidence indicated that PTEN loss cooperates with a PIK3CA mutation to accelerate progression of CRPC growth,64 and further research has linked the expression of PTEN with proliferation and apoptosis of PCa cells.65 Consistent with these results, we observed that knockdown of E2F1 inhibited proliferation and accelerated apoptosis in PC3 cells but not in DU145 cells. Hence, these DEGs might not only alter cellular migration and invasion but also participate in proliferation and apoptosis of PC3 cells. We also observed that PC3 with knockdown of E2F1 was quite different from the control in terms of phenotypic characterization, whereas DU145 with depletion of E2F1 was similar to the control. Therefore, more diversified pathways and DEGs might affect the cellular behavior and appearance of PC3 cells compared with DU145 cells, with a potential impact on the development of CRPC and PCa.
In our validation analysis, five DEGs in the the Human Protein Atlas and GEPIA database, CFH, EVA1C, IL1RL1, CDH1, and PTGS2, were differently expressed in PCa samples compared with normal tissues, suggesting that these DEGs might have essential roles in PCa. The different expression levels of CFH, EVA1C, IL1RL1, and CDH1 were validated in the PCa and normal tissue samples we collected. Although CFH and CDH1 have been previously reported,66,67 EVA1C and IL1RL1 are presented here for the first time as candidate diagnostic biomarkers of PCa.
Conclusion
This study found that downregulation of E2F1 suppressed migration and invasion of CRPC cells by regulating a large number of important genes, including TMOD2 and AIF1L, which are associated with the actin filament organization pathway. However, the molecular mechanisms and interactive relationships of these genes are still unknown. Therefore, further experiments are required to study the mechanisms of these genes and of E2F1 regulation of actin filaments.
Acknowledgments
This work was supported by the National Natural Science Foundation of China (No. 81472414, 81560608 and 81460388), Guangxi Natural Science Foundation (No. 2015GXNSFBB139008), Guangxi Medical University Training Program for Distinguished Young Scholar and the Guangxi Colleges and Universities Key Laboratory of Biological Molecular Medicine Research Foundation (No. GXBMR201603).
Disclosure
The authors report no conflicts of interest in this work.
References
1. Siegel RL, Miller KD, Jemal A. Cancer statistics, 2018. CA Cancer J Clin. 2018;68(1):7–30. doi:10.3322/caac.21442
2. Watson PA, Arora VK, Sawyers CL. Emerging mechanisms of resistance to androgen receptor inhibitors in prostate cancer. Nat Rev Cancer. 2015;15(12):701–711. doi:10.1038/nrc4016
3. Han W, Gao S, Barrett D, et al. Reactivation of androgen receptor-regulated lipid biosynthesis drives the progression of castration-resistant prostate cancer. Oncogene. 2018;37(6):710–721. doi:10.1038/onc.2017.385
4. Wang J, Zou JX, Xue X, et al. ROR-gamma drives androgen receptor expression and represents a therapeutic target in castration-resistant prostate cancer. Nat Med. 2016;22(5):488–496.
5. Hu Y, Gu Y, Wang H, et al. Integrated network model provides new insights into castration-resistant prostate cancer. Sci Rep. 2015;5:17280.
6. Putzer BM, Engelmann D. E2F1 apoptosis counterattacked: evil strikes back. Trends Mol Med. 2013;19(2):89–98.
7. Ramos-Montoya A, Lamb AD, Russell R, et al. HES6 drives a critical AR transcriptional programme to induce castration-resistant prostate cancer through activation of an E2F1-mediated cell cycle network. EMBO Mol Med. 2014;6(5):651–661.
8. Rouaud F, Hamouda-Tekaya N, Cerezo M, et al. E2F1 inhibition mediates cell death of metastatic melanoma. Cell Death Dis. 2018;9(5):527.
9. Wang B, Ma A, Zhang L, et al. POH1 deubiquitylates and stabilizes E2F1 to promote tumour formation. Nat Commun. 2015;6:8704.
10. Valdez CD, Kunju L, Daignault S, Wojno KJ, Day ML. The E2F1/DNMT1 axis is associated with the development of AR negative castration resistant prostate cancer. Prostate. 2013;73(16):1776–1785. doi:10.1002/pros.22715
11. Liang YX, Lu JM, Mo RJ, et al. E2F1 promotes tumor cell invasion and migration through regulating CD147 in prostate cancer. Int J Oncol. 2016;48(4):1650–1658. doi:10.3892/ijo.2016.3364
12. Nguyen KH, Hachem P, Khor LY, et al. Adenoviral-E2F-1 radiosensitizes p53wild-type and p53null human prostate cancer cells. Int J Radiat Oncol Biol Phys. 2005;63(1):238–246. doi:10.1016/j.ijrobp.2005.04.033
13. Chen JH, Liang YX, He HC, et al. Overexpression of PDZ-binding kinase confers malignant phenotype in prostate cancer via the regulation of E2F1. Int J Biol Macromol. 2015;81:615–623. doi:10.1016/j.ijbiomac.2015.08.048
14. Atkinson EG, Audesse AJ, Palacios JA, et al. No evidence for recent selection at FOXP2 among diverse human populations. Cell. 2018;174(6):1424–1435 e1415. doi:10.1016/j.cell.2018.06.048
15. Gracz AD, Samsa LA, Fordham MJ, et al. Sox4 promotes atoh1-independent intestinal secretory differentiation toward tuft and enteroendocrine fates. Gastroenterology. 2018;155(5):1508–1523 e1510. doi:10.1053/j.gastro.2018.07.023
16. Polishchuk EV, Merolla A, Lichtmannegger J, et al. Activation of autophagy, observed in liver tissues from patients with Wilson disease and from Atp7b-deficient animals, protects hepatocytes from copper-induced apoptosis. Gastroenterology. 2018, S0016-5085(18)35280-6 [pii]. doi:10.1053/j.gastro.2018.11.032
17. Xu H, Xu K, He HH, et al. Integrative analysis reveals the transcriptional collaboration between EZH2 and E2F1 in the regulation of cancer-related gene expression. Mol Cancer Res. 2016;14(2):163–172. doi:10.1158/1541-7786.MCR-15-0313
18. Liu JL, Zeng GZ, Liu XL, et al. Small compound bigelovin exerts inhibitory effects and triggers proteolysis of E2F1 in multiple myeloma cells. Cancer Sci. 2013;104(12):1697–1704. doi:10.1111/cas.12295
19. Lin HH, Liao CJ, Lee YC, et al. Lipocalin-2-induced cytokine production enhances endometrial carcinoma cell survival and migration. Int J Biol Sci. 2011;7(1):74–86. doi:10.7150/ijbs.7.74
20. Warde-Farley D, Donaldson SL, Comes O, et al. The GeneMANIA prediction server: biological network integration for gene prioritization and predicting gene function. Nucleic Acids Res. 2010;38(Web Server issue):W214–W220. doi:10.1093/nar/gkq537
21. Tang Z, Li C, Kang B, et al. GEPIA: a web server for cancer and normal gene expression profiling and interactive analyses. Nucleic Acids Res. 2017;45(W1):W98–W102. doi:10.1093/nar/gkx247
22. Zhou Y, Zhou B, Pache L, et al. Metascape provides a biologist-oriented resource for the analysis of systems-level datasets. Nat Commun. 2019;10(1):1523. doi:10.1038/s41467-019-09234-6
23. Szklarczyk D, Franceschini A, Kuhn M, et al. The STRING database in 2011: functional interaction networks of proteins, globally integrated and scored. Nucleic Acids Res. 2011;39(Databaseissue):D561–D568. doi:10.1093/nar/gkq973
24. Smoot ME, Ono K, Ruscheinski J, Wang P-L, Ideker T. Cytoscape 2.8: new features for data integration and network visualization. Bioinformatics. 2011;27(3):431–432. doi:10.1093/bioinformatics/btq675
25. Chin CH, Chen SH, Wu HH, et al. cytoHubba: identifying hub objects and sub-networks from complex interactome. BMC Syst Biol. 2014;8 Suppl 4:S11. doi:10.1186/1752-0509-8-S4-S11
26. Liu P, Li W, Hu Y, Jiang Y. Absence of AIF1L contributes to cell migration and a poor prognosis of breast cancer. Onco Targets Ther. 2018;11:5485–5498. doi:10.2147/OTT.S165874
27. Yamaguchi H, Condeelis J. Regulation of the actin cytoskeleton in cancer cell migration and invasion. Biochim Biophys Acta. 2007;1773(5):642–652. doi:10.1016/j.bbamcr.2006.07.001
28. Cai G, Wu D, Wang Z, et al. Collapsin response mediator protein-1 (CRMP1) acts as an invasion and metastasis suppressor of prostate cancer via its suppression of epithelial-mesenchymal transition and remodeling of actin cytoskeleton organization. Oncogene. 2017;36(4):546–558. doi:10.1038/onc.2016.227
29. Galanty A, Koczurkiewicz P, Wnuk D, et al. Usnic acid and atranorin exert selective cytostatic and anti-invasive effects on human prostate and melanoma cancer cells. Toxicol In Vitro. 2017;40:161–169. doi:10.1016/j.tiv.2017.01.008
30. Rao JN, Madasu Y, Dominguez R. Mechanism of actin filament pointed-end capping by tropomodulin. Science. 2014;345(6195):463–467. doi:10.1126/science.1256159
31. Omotade OF, Rui Y, Lei W, et al. Tropomodulin isoform-specific regulation of dendrite development and synapse formation. J Neurosci. 2018;38(48):10271–10285. doi:10.1523/JNEUROSCI.3325-17.2018
32. Gray KT, Suchowerska AK, Bland T, et al. Tropomodulin isoforms utilize specific binding functions to modulate dendrite development. Cytoskeleton (Hoboken). 2016;73(6):316–328. doi:10.1002/cm.21304
33. Yasuda-Yamahara M, Rogg M, Yamahara K, et al. AIF1L regulates actomyosin contractility and filopodial extensions in human podocytes. PLoS One. 2018;13(7):e0200487.
34. Sumia I, Pierani A, Causeret F. Kremen1-induced cell death is regulated by homo- and heterodimerization. Cell Death Discov. 2019;5:91.
35. Clines KL, Clines GA. DKK1 and kremen expression predicts the osteoblastic response to bone metastasis. Transl Oncol. 2018;11(4):873–882.
36. Ribeiro R, Monteiro C, Catalan V, et al. Obesity and prostate cancer: gene expression signature of human periprostatic adipose tissue. BMC Med. 2012;10:108.
37. Sowalsky AG, Xia Z, Wang L, et al. Whole transcriptome sequencing reveals extensive unspliced mRNA in metastatic castration-resistant prostate cancer. Mol Cancer Res. 2015;13(1):98–106.
38. Bonilla C, Mason T, Long L, et al. E-cadherin polymorphisms and haplotypes influence risk for prostate cancer. Prostate. 2006;66(5):546–556.
39. Wang R, Chadalavada K, Wilshire J, et al. Glioblastoma stem-like cells give rise to tumour endothelium. Nature. 2010;468(7325):829–833.
40. Bousseau S, Vergori L, Soleti R, et al. Glycosylation as new pharmacological strategies for diseases associated with excessive angiogenesis. Pharmacol Ther. 2018;191:92–122.
41. Lee GT, Kwon SJ, Kim J, et al. WNT5A induces castration-resistant prostate cancer via CCL2 and tumour-infiltrating macrophages. Br J Cancer. 2018;118(5):670–678.
42. Cioni B, Nevedomskaya E, Melis MHM, et al. Loss of androgen receptor signaling in prostate cancer-associated fibroblasts (CAFs) promotes CCL2- and CXCL8-mediated cancer cell migration. Mol Oncol. 2018;12(8):1308–1323.
43. Pecqueux C, Arslan A, Heller M, et al. FGF-2 is a driving force for chromosomal instability and a stromal factor associated with adverse clinico-pathological features in prostate cancer. Urol Oncol. 2018;36(8):365 e315–365 e326.
44. Liu C, Guan H, Wang Y, et al. miR-195 inhibits EMT by targeting FGF2 in prostate cancer cells. PLoS One. 2015;10(12):e0144073.
45. Ko CJ, Lan SW, Lu YC, et al. Inhibition of cyclooxygenase-2-mediated matriptase activation contributes to the suppression of prostate cancer cell motility and metastasis. Oncogene. 2017;36(32):4597–4609.
46. Wang W, Wang J. Toll-like receptor 4 (TLR4)/cyclooxygenase-2 (COX-2) regulates prostate cancer cell proliferation, migration, and invasion by NF-kappaB activation. Med Sci Monit. 2018;24:5588–5597.
47. Wu JB, Yin L, Shi C, et al. MAOA-dependent activation of Shh-IL6-RANKL signaling network promotes prostate cancer metastasis by engaging tumor-stromal cell interactions. Cancer Cell. 2017;31(3):368–382.
48. Hao M, Li Y, Wang J, et al. HIC1 loss promotes prostate cancer metastasis by triggering epithelial-mesenchymal transition. J Pathol. 2017;242(4):409–420.
49. Kron KJ, Murison A, Zhou S, et al. TMPRSS2-ERG fusion co-opts master transcription factors and activates NOTCH signaling in primary prostate cancer. Nat Genet. 2017;49(9):1336–1345.
50. Choy L, Hagenbeek TJ, Solon M, et al. Constitutive NOTCH3 signaling promotes the growth of basal breast cancers. Cancer Res. 2017;77(6):1439–1452.
51. Idowu J, Home T, Patel N, et al. Aberrant regulation of Notch3 signaling pathway in polycystic kidney disease. Sci Rep. 2018;8(1):3340.
52. Cui J, Wang Y, Dong B, et al. Pharmacological inhibition of the Notch pathway enhances the efficacy of androgen deprivation therapy for prostate cancer. Int J Cancer. 2018;143(3):645–656.
53. Talukdar R, Sareen A, Zhu H, et al. Release of cathepsin B in cytosol causes cell death in acute pancreatitis. Gastroenterology. 2016;151(4):747–758 e745.
54. Lu Z, Wang H, Zhu M, et al. Ophiopogonin D’, a natural product from radix ophiopogonis, induces in vitro and in vivo RIPK1-dependent and caspase-independent apoptotic death in androgen-independent human prostate cancer cells. Front Pharmacol. 2018;9:432.
55. Singh SK, Banerjee S, Acosta EP, et al. Resveratrol induces cell cycle arrest and apoptosis with docetaxel in prostate cancer cells via a p53/p21WAF1/CIP1 and p27KIP1 pathway. Oncotarget. 2017;8(10):17216–17228.
56. Song M, Ping Y, Zhang K, et al. Low-dose IFN-gamma induces tumor cell stemness in the tumor microenvironment of non-small cell lung cancer. Cancer Res. 2019. doi:10.1158/0008-5472.CAN-19-0596
57. Santoro V, Jia R, Thompson H, et al. Role of reactive oxygen species in the abrogation of oxaliplatin activity by cetuximab in colorectal cancer. J Natl Cancer Inst. 2016;108(6):djv394.
58. Palchetti S, Starace D, De Cesaris P, et al. Transfected poly(I:C) activates different dsRNA receptors, leading to apoptosis or immunoadjuvant response in androgen-independent prostate cancer cells. J Biol Chem. 2015;290(9):5470–5483.
59. Hatziieremia S, Mohammed Z, McCall P, et al. Loss of signal transducer and activator of transcription 1 is associated with prostate cancer recurrence. Mol Carcinog. 2016;55(11):1667–1677.
60. Calastretti A, Gatti G, Quaresmini C, et al. Down-modulation of Bcl-2 sensitizes PTEN-mutated prostate cancer cells to starvation and taxanes. Prostate. 2014;74(14):1411–1422.
61. Potiron VA, Abderrahmani R, Giang E, et al. Radiosensitization of prostate cancer cells by the dual PI3K/mTOR inhibitor BEZ235 under normoxic and hypoxic conditions. Radiother Oncol. 2013;106(1):138–146.
62. Zabala-Letona A, Arruabarrena-Aristorena A, Martin-Martin N, et al. mTORC1-dependent AMD1 regulation sustains polyamine metabolism in prostate cancer. Nature. 2017;547(7661):109–113.
63. Valeri N, Braconi C, Gasparini P, et al. MicroRNA-135b promotes cancer progression by acting as a downstream effector of oncogenic pathways in colon cancer. Cancer Cell. 2014;25(4):469–483.
64. Pearson HB, Li J, Meniel VS, et al. Identification of Pik3ca mutation as a genetic driver of prostate cancer that cooperates with pten loss to accelerate progression and castration-resistant growth. Cancer Discov. 2018;8(6):764–779.
65. Singh S, Asal R, Bhagat S. Multifunctional antioxidant nanoliposome-mediated delivery of PTEN plasmids restore the expression of tumor suppressor protein and induce apoptosis in prostate cancer cells. J Biomed Mater Res A. 2018;106(12):3152–3164.
66. Orr B, Riddick AC, Stewart GD, et al. Identification of stromally expressed molecules in the prostate by tag-profiling of cancer-associated fibroblasts, normal fibroblasts and fetal prostate. Oncogene. 2012;31(9):1130–1142.
67. Markou A, Lazaridou M, Paraskevopoulos P, et al. Multiplex gene expression profiling of in vivo isolated circulating tumor cells in high-risk prostate cancer patients. Clin Chem. 2018;64(2):297–306.
 © 2019 The Author(s). This work is published and licensed by Dove Medical Press Limited. The full terms of this license are available at https://www.dovepress.com/terms.php and incorporate the Creative Commons Attribution - Non Commercial (unported, v3.0) License.
By accessing the work you hereby accept the Terms. Non-commercial uses of the work are permitted without any further permission from Dove Medical Press Limited, provided the work is properly attributed. For permission for commercial use of this work, please see paragraphs 4.2 and 5 of our Terms.
© 2019 The Author(s). This work is published and licensed by Dove Medical Press Limited. The full terms of this license are available at https://www.dovepress.com/terms.php and incorporate the Creative Commons Attribution - Non Commercial (unported, v3.0) License.
By accessing the work you hereby accept the Terms. Non-commercial uses of the work are permitted without any further permission from Dove Medical Press Limited, provided the work is properly attributed. For permission for commercial use of this work, please see paragraphs 4.2 and 5 of our Terms.