Back to Journals » Diabetes, Metabolic Syndrome and Obesity » Volume 16
Jiangtang Decoction Ameliorates Diabetic Kidney Disease Through the Modulation of the Gut Microbiota
Authors Hong J ![]() , Fu T, Liu W, Du Y, Bu J, Wei G, Yu M, Lin Y, Min C, Lin D
, Fu T, Liu W, Du Y, Bu J, Wei G, Yu M, Lin Y, Min C, Lin D
Received 21 September 2023
Accepted for publication 7 November 2023
Published 20 November 2023 Volume 2023:16 Pages 3707—3725
DOI https://doi.org/10.2147/DMSO.S441457
Checked for plagiarism Yes
Review by Single anonymous peer review
Peer reviewer comments 2
Editor who approved publication: Prof. Dr. Juei-Tang Cheng
Jinni Hong,1,2 Tingting Fu,1,2 Weizhen Liu,1,2 Yu Du,1,2 Junmin Bu,1,2 Guojian Wei,1,2 Miao Yu,1,2 Yanshan Lin,1,2 Cunyun Min,1,2 Datao Lin3
1Department of Traditional Chinese Medicine, Guangdong Provincial People’s Hospital (Guangdong Academy of Medical Sciences), Southern Medical University, Guangzhou, Guangdong, 510080, People’s Republic of China; 2Guangdong Provincial Institute of Geriatric, Guangzhou, Guangdong, 510080, People’s Republic of China; 3Department of Parasitology, Zhongshan School of Medicine, Sun Yat-sen University, Guangzhou, Guangdong, 510080, People’s Republic of China
Correspondence: Jinni Hong
Department of Traditional Chinese Medicine, Guangdong Provincial People’s Hospital (Guangdong Academy of Medical Sciences), Southern Medical University, Guangzhou, Guangdong, 510080, People’s Republic of China
, Tel +86 2083827812
, Fax +86 2083827812
, Email [email protected]
Datao Lin
Department of Parasitology, Zhongshan School of Medicine, Sun Yat-sen University, Guangzhou, Guangdong, 510080, People’s Republic of China
, Tel +86 2087330118
, Fax +86 2087330118
, Email [email protected]
Purpose: This study aimed to elucidate the impact of Jiangtang decoction (JTD) on diabetic kidney disease (DKD) and its association with alterations in the gut microbiota.
Methods: Using a diabetic mouse model (KK-Ay mice), daily administration of JTD for eight weeks was undertaken. Weekly measurements of body weight and blood glucose were performed, while kidney function, uremic toxins, inflammation factors, and fecal microbiota composition were assessed upon sacrifice. Ultra-structural analysis of kidney tissue was conducted to observe the pathological changes.
Results: The study findings demonstrated that JTD improve metabolism, kidney function, uremic toxins and inflammation, while also exerting a modulatory effect on the gut microbiota. Specifically, the genera Rikenella, Lachnoclostridium, and unclassified_c_Bacilli exhibited significantly increased abundance following JTD treatment, accompanied by reduced abundance of norank_f_Lachnospiraceae compared to the model group. Importantly, Rikenella and unclassified_c_Bacilli demonstrated negative correlations with urine protein levels. Lachnoclostridium and norank_f_Lachnospiraceae were positively associated with creatinine (Cr), indoxyl sulfate (IS) and interleukin (IL)-6. Moreover, norank_f_Lachnospiraceae exhibited positive associations with various indicators of DKD severity, including weight, blood glucose, urea nitrogen (UN), kidney injury molecule-1 (KIM-1) levels, trimethylamine-N-oxide (TMAO), p-cresyl sulfate (pCS), nucleotide-binding oligomerization domain (Nod)-like receptor family pyrin domain-containing 3 (NLRP3) and IL-17A production.
Conclusion: These findings suggested that JTD possess the ability to modulate the abundance of Rikenella, Lachnoclostridium, unclassified_c_Bacilli and norank_f_Lachnospiraceae within the gut microbiota. This modulation, in turn, influenced metabolic processes, kidney function, uremic toxin accumulation, and inflammation, ultimately contributing to the amelioration of DKD.
Keywords: Chinese herbal medicine, gut microbiota, diabetic kidney disease, inflammation, uremic toxins
Graphical Abstract:

Introduction
Diabetic kidney disease (DKD) is among the most frequent and severe complications of diabetes mellitus (DM), and is linked to elevated morbidity and mortality rates in DM patients.1 DKD afflicts approximately 21.8% to 40% of patients with sub-optimal glycemic control.2 Notably, China has witnessed a remarkable surge in the incidence and prevalence of DKD over the past decade, with an estimated DKD population of 24.3 million.3 The prevailing projection suggests that DKD’s prevalence will continue to escalate unless immediate enhancements are made in the clinical strategies employed for its prevention.4,5
Despite the conventional therapeutic approach centers on meticulous glucose and blood pressure regulation, DKD’s inexorable progression towards end-stage renal disease (ESRD) and associated mortality remains unabated.6,7 This phenomenon can be attributed not solely to perturbed glucose metabolism and reactive oxygen species (ROS) generation, but also to the underlying state of chronic low-grade inflammation.8,9 Modulating the inflammatory cascade, comprising the suppression of adhesion molecules, chemokines, cytokines, immune cells, and intracellular signaling pathways, assumes pivotal significance.10–12 A series of seminal studies have lately established the involvement of nucleotide-binding oligomerization domain (Nod)-like receptor family pyrin domain-containing 3 (NLRP3) inflammasome, interleukin (IL)-6, and IL-17A in diverse metabolic disorders, including DM and DKD.13–15 In 2013, an intriguing connection between the gastrointestinal tract and kidneys was proposed, proposing a plausible role of gut microbiota dysbiosis in the pathogenesis of chronic kidney disease (CKD).16 Perturbations in the gut microbiota composition, such as diminished Prevotella, Ruminococcaceae, Roseburia, and Faecalibacterium levels alongside augmented Parabacteroides, Enterococcus, Enterobacteriaceae,17 and Klebsiella proportions, have been observed in patients with CKD.18,19 Increased Bacteroidaceae and Clostridiaceae abundance have been associated with systemic inflammation in this patient cohort.20 Imbalances in the gut microbiota have also been discerned in DKD patients, typified by elevated levels of Proteobacteria, Verrucomicrobia, and Fusobacteria.21 Furthermore, specific metabolites and toxins produced by the gut microbiota, such as trimethylamine-N-oxide (TMAO), p-cresyl sulfate (pCS) and indoxyl sulfate (IS), have been implicated in the pathological processes underlying DKD.22,23
Jiangtang decoction (JTD), a patented Chinese herbal remedy (Patent Number: 20141002188.3), has gained widespread recognition in clinical practice for its utility in managing DKD.24,25 The formulation comprises Euphorbia humifusa Willd, Salvia miltiorrhiza Bunge, Astragalus mongholicus Bunge, Asphodelus asphodeloides Bunge, and Cistanche chinensis Franch. Earlier investigations from our laboratory have convincingly demonstrated JTD’s ability to mitigate inflammation in DKD via the phosphatidylinositol-3-kinase (PI3K) /protein kinase B (Akt) and nuclear factor-k-gene binding (NF-κB) signaling pathways.24 The efficacy of Berberine, a principal constituent of Cistanche chinensis Franch, in modulating gut microbiota has been established.26 Similarly, Astragaloside IV (AS-IV), an active moiety derived from Asphodelus asphodeloides Bunge, has exhibited regulatory effects on gut microbiota in the context of DM.27 These findings collectively endorse the gut microbiota-modulatory potential of JTD.
In this study, our objective centers on investigating the oral administration of JTD in a murine model of DKD, meticulously scrutinizing its effects on inflammation and mechanisms associated with uremic toxins. By unveiling the intricate facets of JTD’s modulatory actions and delineating its therapeutic implications for DKD, our research endeavors aspire to render an improved therapeutic option for this debilitating condition.
Materials and Methods
Grouping and Treatment of Animals
All animal experiments strictly adhered to the guidelines set by the National Institutes of Health (NIH) for the care and use of laboratory animals. The study received approval from the Institutional Animal Care and Use Committee of Guangdong Provincial People’s Hospital (Approval Number: KY2023-018-01). 15 male KK-Ay mice, aged between eight to nine weeks, and five C57BL/6J mice were obtained from Beijing Huafukang Bioscience Co., Ltd. The supplier’s license number for sourcing the mice is SCXK (Jing) 2019–0008. KK-Ay mice were subjected to a high-fat diet to induce the DKD model, while C57BL/6J mice were fed a regular diet. All mice were housed in a specific pathogen-free (SPF) environment maintained at a temperature of 22±1°C with a 12-hour light-dark cycle.
Following a one-week acclimation period, the mice were randomly assigned to one of four groups as follows: (1) C57 or control group (C57BL/6J mice treated with drinking water), (2) KK or model group (KK-Ay mice treated with drinking water), (3) Chinese medicine (CM) group (KK-Ay mice administered 4g/kg weight of Chinese medicine JTD decoction, the concentration was made basing on previous research24), (4) Western medicine (WM) group (KK-Ay mice administered 30mg/kg weight of western medicine Irbesartan). Oral administration of the respective interventions continued for eight weeks until the study endpoint. The selection of the eight-week time point in this study was based on previous investigations,24 which has demonstrated that JTD therapy for a duration of 12 weeks exhibited notable efficacy in ameliorating DKD. Furthermore, our observation of biochemical parameters following JTD therapy for durations of four, eight, and 12 weeks had revealed significant improvements in DKD-related indicators not only at week 12 but also at week eight. Hence, the current investigation focused on assessing alterations after an eight-week treatment period.
Analysis of Fecal Microbiota
Sample Collection, DNA Extraction and PCR Amplification
Fecal samples were acquired from mice eight weeks after treatment. The mice were housed in metabolic cages for a duration of 24 hours to facilitate the collection of fecal samples. Genomic DNA was extracted using the PF Mag-Bind Stool DNA Kit and its quality assessed. The hyper-variable region V3-V4 of the bacterial 16S rRNA gene was amplified using specific primers.28 The amplification was conducted using an ABI GeneAmp® 9700 PCR thermocycler (ABI, CA, USA). The PCR products were purified and quantified using a Quantus™ Fluorometer (Promega, USA).
Sequencing and Analysis on the Illumina Novaseq6000
The purified amplicons were pooled and subjected to paired-end sequencing on the Illumina PE250 platform (Illumina, San Diego, USA). This allowed for the high-throughput sequencing of microbial DNA. Following demultiplexing, the resulting sequences underwent quality filtering using fastp (version 0.19.6),29 and subsequently merged using FLASH (version 1.2.7).30 After quality filtering and merging of the sequences, high-quality data was obtained. Amplicon sequence variants (ASVs) were generated using the DADA2 plugin31 in the Qiime2 pipeline (version 2022.2).32 The number of sequences per sample was standardized to 4115.
Bioinformatic Analysis
ASVs were analyzed using Mothur (version 1.30.2)33 on the Majorbio Cloud platform. Rarefaction curves and alpha diversity indices such as observed ASVs, Chao richness, Shannon index, and Good’s coverage were calculated. Various visualization methods including Venn plot, bar plots, Circos plots, LDA, and heatmaps were employed to analyze the diversity of the microbial communities. To assess the correlation, two-way correlated networks and Spearman Correlation Heatmaps were utilized. These methods were employed to compare and analyze the relationships between variables. Statistical tests, including the Wilcoxon rank-sum test and Kruskal–Wallis H-test, were performed to assess differences in microbiota composition between two or more groups.
Preparation and Quality Control of JTD
Euphorbia humifusa Willd, Salvia miltiorrhiza Bunge, Astragalus mongholicus Bunge, Asphodelus asphodeloides Bunge, and Cistanche chinensis Franch were obtained from the Chinese Medicine Pharmacy at Guangdong Provincial People’s Hospital. The composition of JTD can be found in Supplementary Table 1. To prepare JTD, these medicine were soaked in three volumes of drinking water for 30 minutes and then boiled for one hour. The components of JTD were analyzed using high-performance liquid chromatography (HPLC; Agilent 1100, USA) following a previously established protocol.23,24
Blood Glucose and Weight Measurement
Blood samples were collected from the mice’s caudal veins every week during the treatment period. Random blood glucose levels were measured using the OneTouch Ultra2 blood glucose meter (LifeScan Europe, Switzerland) at the same time each week. Additionally, the mice’s weight was measured concurrently.
Kidney Function, Inflammatory Factors and Uremic Toxins Measurement
After an eight-week treatment period, urine and serum samples were collected. The levels of urine protein were analyzed using a commercially available kit from Nanjingjiancheng Inc. (Jiangsu, China). Furthermore, the concentrations of urinary nitrogen (UN) and creatinine (Cr) in serum were also measured using the chemical kit from Nanjingjiancheng Inc. (Jiangsu, China). The concentrations of Kidney Injury Molecule-1 (KIM-1), NLRP3, IL-6, IL-17A, TMAO, pCS, and IS in the serum were determined. For this analysis, ELISA kits provided by either ELK biotechnology (Hubei, China) or mmbio Inc. (Jiangsu, China) were used. The analysis followed the recommended protocol provided by the respective manufacturers.
Ultra-Structural Analysis
Following the conclusion of the eight-week treatment period, the mice’s renal cortexes were surgically extracted and immediately fixed in 2.5% glutaraldehyde at 4°C. The tissue samples were then embedded in epoxy resin for preservation. Thin sections with a thickness of 70–90nm were prepared using an ultramicrotome. These sections were double-stained with 3% uranyl acetate and lead citrate for better contrast. Finally, the samples were observed and analyzed using a JEM-1400 electron microscope (JEOL Ltd., Tokyo, Japan) to examine their detailed ultra-structural features.
Statistical Analysis
All data were expressed as mean ± standard deviation (SD). Statistical analysis was performed using SPSS 18.0 (IBM, Armonk, NY, USA). Differences between two groups were evaluated using the Student’s t-test. For comparisons among multiple groups, one-way analysis of variance (ANOVA) followed by post hoc tests such as the least significant difference (LSD) test or Tukey’s test were conducted. Statistical significance was considered achieved if the p-value was less than 0.05 (P<0.05).
Results
Composition of the JTD
After performing repeated HPLC analysis on the JTD, the fingerprinting results revealed six primary constituents. These components, as shown in Supplementary Figure 1, include calycosin-7-O-β-D-glucoside, which is the principal compound found in Astragalus mongholicus Bunge; salvianolic acid B, the primary component of Salvia miltiorrhiza Bunge; coptisine, palmatine and berberine, which are three main components of Cistanche chinensis Franch; and Timosaponin BII, the principal compound of Asphodelus asphodeloides Bunge. The quantitative analysis results of JTD can be found in Supplementary Table 2.
Improvement of Kidney Function by JTD
As illustrated in Figure 1A, blood glucose levels showed a significant increase over time in the DKD model group, compared to the control group. However, treatment with WM demonstrated a mitigating effect on the elevation of blood glucose after three, four, five, and six weeks of treatment. Additionally, CM treatment resulted in the reduction of blood glucose levels after eight weeks of treatment. Moreover, and after four to eight weeks of WM treatment, a notable decrease in body weight was observed compared to the model group (Figure 1B). Similarly, CM treatment showed a significant decrease in body weight after seven and eight weeks of treatment.
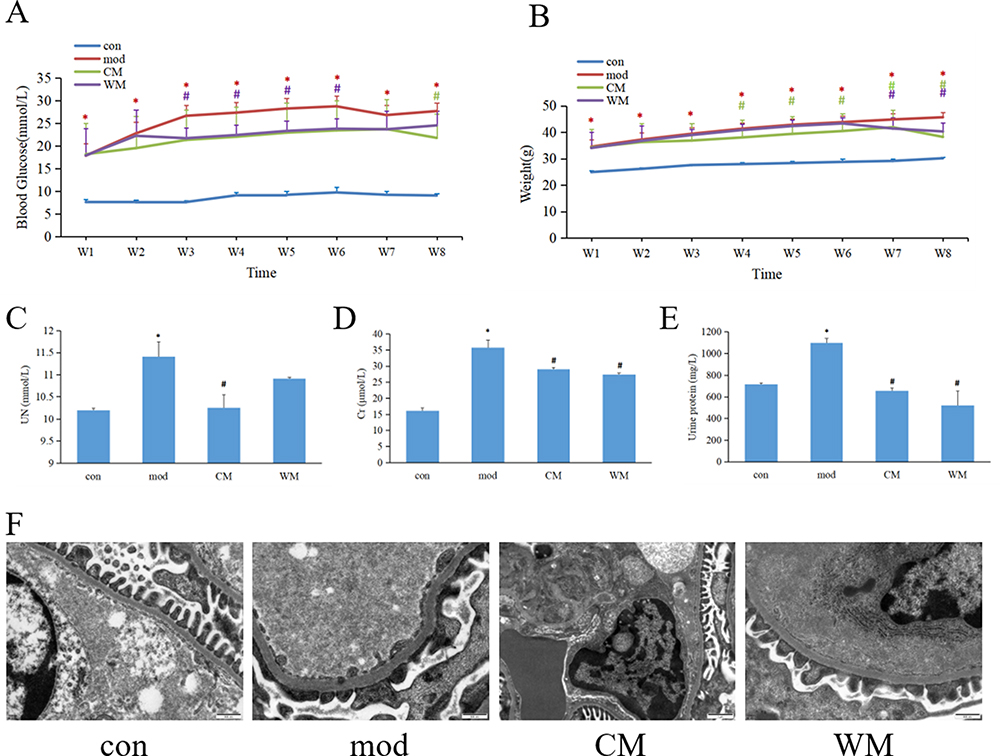 |
Figure 1 The effects of JTD on blood glucose levels, weight, and kidney function. (A) Blood glucose levels were measured to assess the impact of JTD on glycemic control; (B) Changes in weight were monitored to evaluate the potential effect of JTD on body weight; (C) Alterations in serum UN levels were examined to understand the impact of JTD on kidney function; (D) Changes in serum Cr levels were analyzed as an indicator of kidney function after JTD administration; (E) Fluctuations in urine protein concentrations were measured to assess the potential influence of JTD on kidney health; (F) Electron microscopy analysis of the renal cortex was conducted. con, control group; mod, model group; N≥3; *P< 0.05 vs control group; #P<0.05 vs model group. |
UN, Cr and urine protein are established markers utilized for evaluating kidney function. In Figure 1C–E, notably elevated levels of UN, Cr, and urine protein were observed in the model group compared to the control group. However, CM treatment exhibited significant down-regulation of these markers, indicating an improvement in kidney function. Furthermore, WM treatment demonstrated a reduction in the levels of Cr and urine protein.
Analysis of the ultra-structure of the renal cortex using electron microscopy revealed mesangial expansion, deposition of mesangial matrix, fusion of podocytes and thickening of the glomerular basement membrane in the model group. However, these alterations were significantly attenuated in both the CM and WM treatment groups (Figure 1F).
The Expression of Uremic Toxins and Inflammation Was Down-Regulated by JTD
The concentration of uremic toxins in serum were examined. In Figure 2A–C, it was evident that the model group exhibited significantly higher levels of serum TMAO, pCS, and IS compared to the control group. However, after eight weeks of treatment, a significant decrease was observed in both the CM and WM groups.
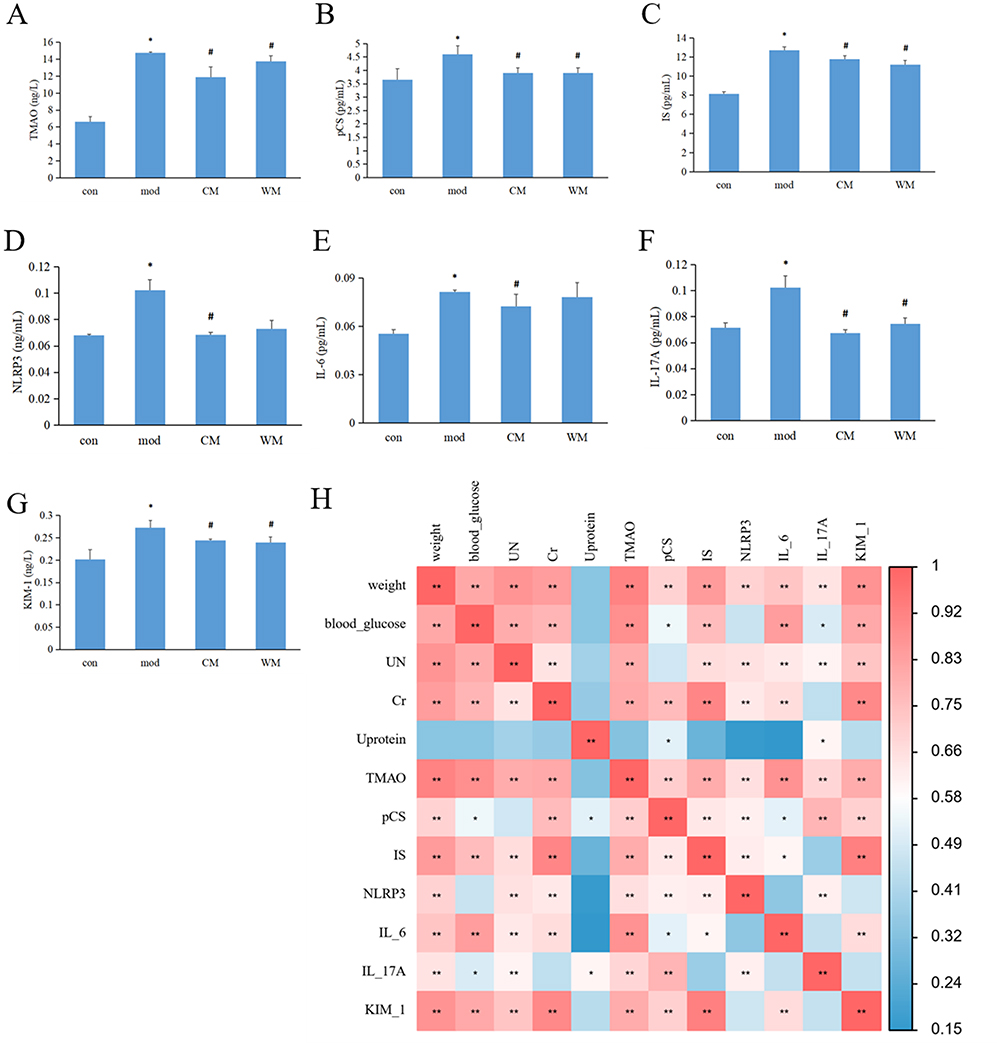 |
Figure 2 The impact of JTD on uremic toxins and inflammation. (A) Serum levels of TMAO were measured to assess its alteration after JTD administration; (B) The concentration of pCS in the serum was examined to understand any changes associated with JTD treatment; (C) The levels of IS in the serum were analyzed to evaluate its alterations following JTD treatment; (D) NLRP3 levels in the serum were investigated to determine any changes related to inflammation after administering JTD; (E) Serum IL-6 levels were monitored to assess alterations in its concentration as an indicator of inflammation; (F) Fluctuations in serum IL-17A levels were examined to observe any changes associated with JTD treatment; (G) The modulation of serum KIM-1 (kidney injury molecule-1) levels was assessed to evaluate the impact of JTD on kidney health; (H) A correlation heat map of influencing factors was created to identify potential relationships between different variables and their impact on uremic toxins and inflammation. N≥3; In (A–G), *P< 0.05 vs control group; #P<0.05 vs model group. In Figure H, *P< 0.05; **P<0.01. Abbreviations: C57, control group; KK, model group; CM, Chinese medicine group; WM, western medicine group. |
After the completion of the eight-week treatment, serum samples were analyzed for inflammation markers. Figure 2D and E clearly demonstrated an up-regulation of serum NLRP3 and IL-6 levels in the model group when compared to the control group, with a significant difference. However, treatment with CM resulted in significantly lower serum NLRP3 and IL-6 levels relative to the model group. Moreover, Figure 2F showed a noteworthy decrease in serum IL-17A levels following both CM and WM administration compared to the model group. Additionally, as shown in Figure 2G, serum KIM-1 levels demonstrated a significant increase in the model group compared to the control group and significantly lower concentrations in the CM and WM treatment groups relative to the model group.
The potential correlations between influencing factors including weight, blood glucose, kidney function, uremic toxins and inflammation markers were investigated using Spearman’s rank correlation coefficient analysis (Figure 2H). The results revealed several associations: weight and TMAO were positively associated with blood glucose, UN, Cr, pCS, IS, NLRP3, IL-6, IL-17A and KIM-1; Blood glucose was positively associated with weight, UN, Cr, pCS, IS, IL-6 and KIM-1, while significantly negatively correlated with IL-17A; UN was positively associated with weight, Cr, pCS, IS, IL-6 and KIM-1, but significantly negatively correlated with IL-17A; Cr and IS were positively associated with weight, blood glucose, UN, pCS, IS, IL-6 and KIM-1; Urine protein was positively associated with IL-17A, but negatively correlated with pCS. Serum pCS was positively associated with weight, Cr, TMAO, pCS, IS, NLRP3, IL-17A and KIM-1, while significantly negatively correlated with blood glucose, urine protein and IL-6; NLRP3 was positively associated with weight, UN, Cr, TMAO, pCS, IS and IL-17A; IL-6 was positively associated with weight, blood glucose, UN, Cr, TMAO, pCS, IS and KIM-1; Serum IL-17A was positively associated with weight, UN, urine protein, TMAO, pCS, NLRP3 and IL-17A, but significantly negatively correlated with blood glucose; KIM-1 was positively associated with weight, blood glucose, UN, Cr, TMAO, pCS, IS, IL-6 and KIM-1.
An in-Depth Analysis of the Alpha and Beta Diversity of the Gut Microbiota
Figure 3A showed that the coverage increased in the CM group compared to the control group, while remaining relatively consistent across all four groups. The fecal alpha-microbial richness, as measured by ACE, was similar across all four groups (Figure 3B). However, measures of Chao and Sobs were decreased in the CM group compared to the control group (Figure 3C and D). The diversity of the gut microbiome, as indicated by the community diversity calculated using the Simpson and Shannon index, significantly increased in both the model and CM groups compared to the control group (Figure 3E and F). The rarefaction curves of Sobs and Shannon index were depicted in Figure 3G and H.
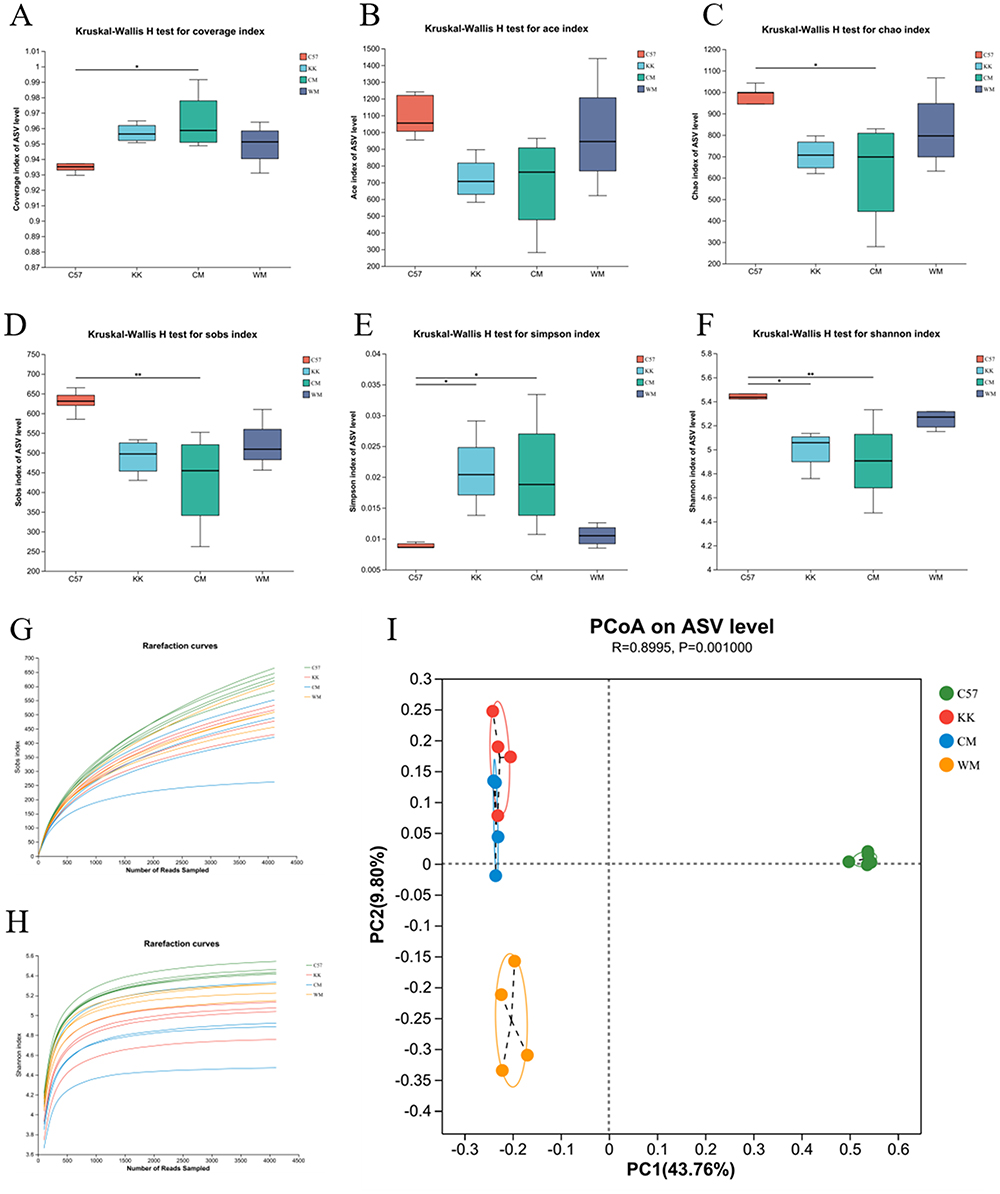 |
Figure 3 An in-depth analysis of the alpha and beta diversity of the gut microbiota. (A) The Coverage metric was utilized to assess community diversity; (B) The ACE index was employed to calculate the richness of microbial taxa present in the samples; (C) The Chao index was used to quantify the richness of microbial taxa; (D) The Sobs metric was utilized to estimate the number of observed species; (E) The Simpson index was employed to measure overall microbial diversity; (F) The Shannon index was used to quantify community diversity by assessing the dominance or concentration of microbial taxa within the community; (G) Rarefaction curves based on the Sobs index were constructed to examine the relationship between sequencing effort and species richness; (H) Rarefaction curves based on the Shannon index were generated to evaluate the relationship between sequencing effort and overall microbial diversity; (I) Beta diversity was compared through Principal Coordinates Analysis (PCoA) at the Amplicon Sequence Variant (ASV) level. N≥3; *P< 0.05 vs control group; **P<0.01 vs control group. Abbreviations: C57, control group; KK, model group; CM, Chinese medicine group; WM, western medicine group. |
Moreover, beta diversity analysis was conducted using principal coordinates analysis (PCoA) based on Bray-Curtis distance. The results (Figure 3I) revealed marked differences in the bacterial communities among the fecal samples from the four groups (p=0.001).
The Alternation of Gut Microbial Composition, Ranging from Phylum to Class Level
The study investigated the alterations in gut microbial composition at various taxonomic levels, ranging from phylum to class. To examine these changes, 16S rRNA gene sequencing was performed to compare fecal microbial differences among the four groups. At the phylum level, the Venn diagram presented in Figure 4A illustrated the presence of nine common gut microbiota across all four groups. These included Firmicutes, Patescibacteria, Actinobacteriota, Cyanobacteria, Bacteroidota, Deferribacterota, Proteobacteria, Desulfobacterota, and unclassified_k_norank_d_Bacteria. The CM, model, and WM groups shared one unique phylum (Campilobacterota), while the control and WM groups shared another unique phylum (Verrucomicrobiota). The bar plot analysis in Figure 4B indicated that the proportion of Firmicutes increased in the model group but can be reduced after CM treatment. Conversely, Bacteroidota showed a decrease in the model group compared to the control group, which can be increased in the CM group but decreased in the WM group. Furthermore, the Kruskal–Wallis H-test bar plot in Figure 4C demonstrated significant differences at the phylum level. The model group exhibited elevated levels of Firmicutes, Desulfobacterota and Campilobacterales, as well as decreased levels of Bacteroidota, Cyanobacteria, Actinobacteria and Verrucomicrobiota compared to the control group. CM treatment effectively restored the abundance of Firmicutes, Bacteroidota, Desulfobacterota and Campilobacterales, with a statistically significant difference.
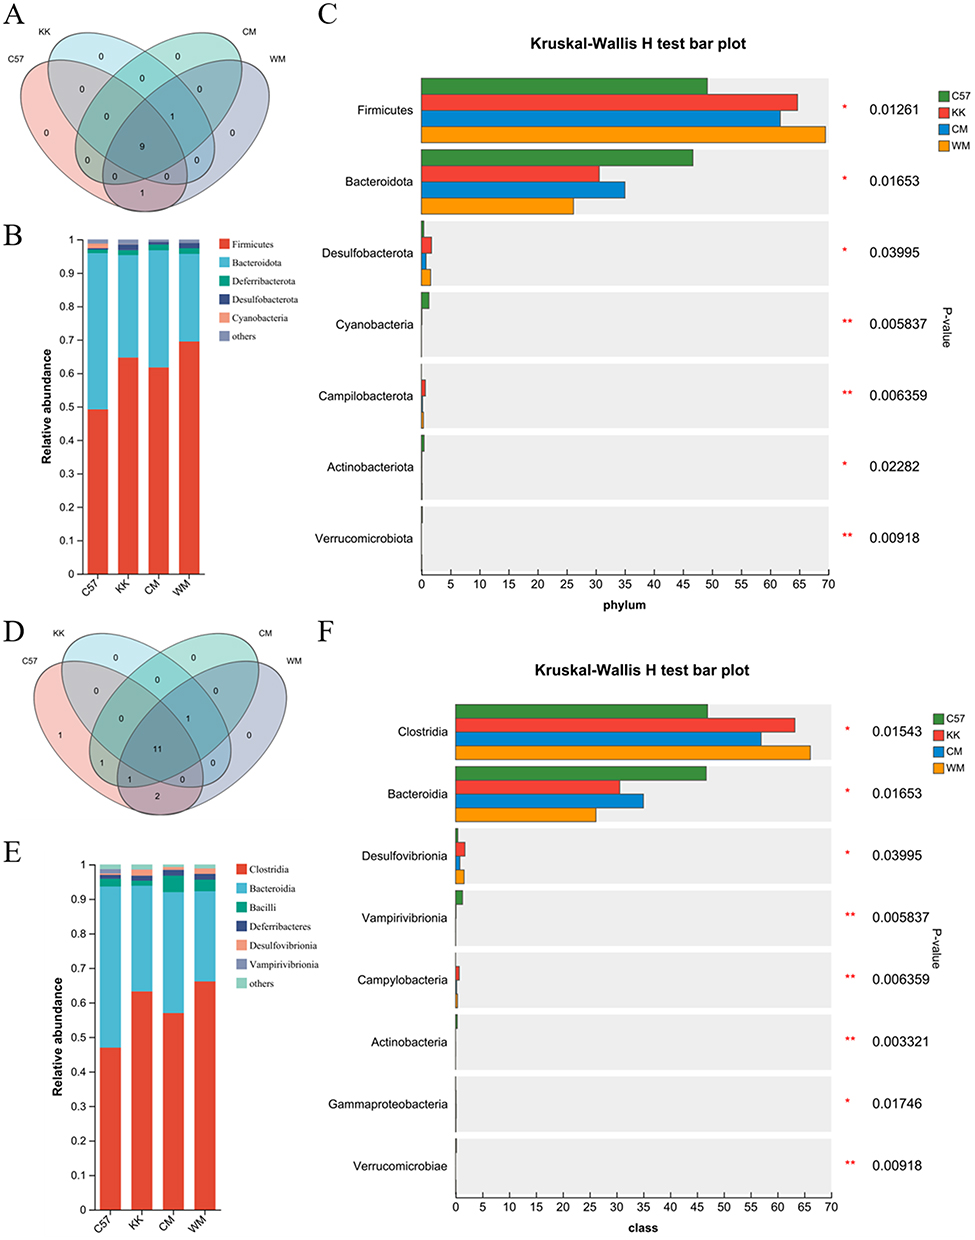 |
Figure 4 A comprehensive analysis of gut microbiota compositions, specifically examining the phylum and class levels. (A) A Venn map was created to illustrate the intergroup divergence of microbiota at the phylum level; (B) Community bar plot analysis was conducted to illuminate the distribution of microbial phyla within the gut microbiota; (C) Kruskal–Wallis H-test bar plot was generated to identify statistically significant variations in gut microbiota composition at the phylum level; (D) A Venn map was constructed to focus on the class-level distinctions in microbiota composition among the groups; (E) Community bar plot analysis was conducted to illuminate the distribution of microbial classes within the gut microbiota; (F) Kruskal–Wallis H-test bar plot was used to emphasize notable dissimilarities in gut microbiota composition at the class level. N≥3; *P< 0.05; **P< 0.01. Abbreviations: C57, control group; KK, model group; CM, Chinese medicine group; WM, western medicine group. |
At the class level, the Venn map in Figure 4D indicated that there were 11 common microbiota identified at the class level among the four groups. The model, CM, and WM groups shared Campylobacteria, CM and WM groups shared Alphaproteobacteria, the control and CM groups shared Actinobacteria, and the control and WM groups shared Negativicutes and Verrucomicrobiae. The control group exclusively had Cyanobacteria. The bar plot in Figure 4E demonstrated changes in the abundance of Clostridia, Bacteroidia, Bacilli, Deferribacteres, Desulfovibrionia and Vampirivibrionia among the four groups, which were further analyzed using the Kruskal–Wallis H-test in Figure 4F. The model group exhibited higher abundance of Clostridia, Desulfovibrionia, Campylobacteria and Gammaproteobacteria, as well as lower richness of Bacteroidia, Vampirivibrionia, Actinobacteria, Verrucomicrobiae and Alphaproteobacteria compared to the control group. CM treatment was found to regulate the abundance of Clostridia, Bacteroidia, Desulfovibrionia and Campylobacteria, while WM treatment regulated the abundance of Campylobacteria, Actinobacteria and Verrucomicrobiae.
The Alternation of Gut Microbial Composition, Ranging from Order to Family Level
The Venn diagram presented in Figure 5A illustrated the presence of 25 shared gut microbiota at the order level across the four groups. The control group possessed four unique gut microbiota at the order level, while the CM and WM groups had one and three unique gut microbiota, respectively. Campylobacterales was found to be common among the model, CM, and WM groups. The bar plot analysis in Figure 5B revealed that the model group exhibited increased proportions of Lachnospirales, Oscillospirales, Deferribacterales and Desulfovibrionales, as well as decreased proportions of Bacteroidales, Clostridia_UCG-014, Erysipelotrichales, Clostridia_vadinBB60_group and Gastranaerophilales compared to the control group. The Kruskal–Wallis H-test in Figure 5C calculated the significant differences, indicating that CM treatment reversed the abundance of Bacteroidales, Oscillospirales, Desulfovibrionales, Campylobacterales, RF39 and Clostridiales.
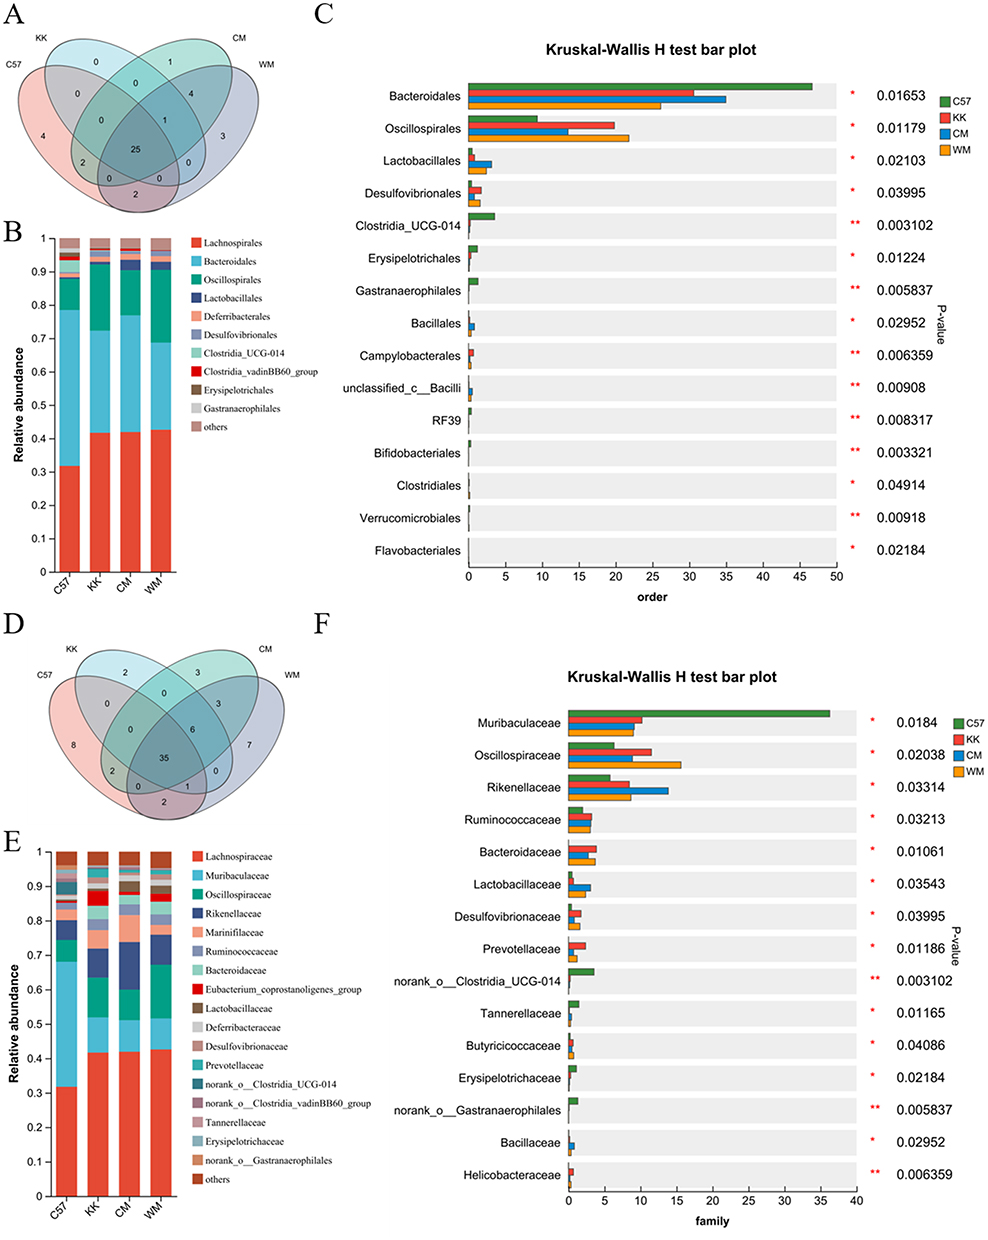 |
Figure 5 The analysis of gut microbiota compositions ranging from order to family level. (A) A Venn map was utilized to visualize the number of distinct microbiota at the order level among the different groups; (B) Community bar plot analysis was performed to depict the distribution patterns of microbial orders within the gut microbiota; (C) Kruskal–Wallis H-test bar plot was used to identify significant differences in gut microbiota composition at the order level; (D) An Venn map was constructed to represent the differences in microbiota at the family level among the groups.; (E) Community bar plot analysis was conducted to illustrate the distribution of microbial families within the gut microbiota; (F) Kruskal–Wallis H-test bar plot was generated to highlight statistically significant differences in gut microbiota composition at the family level. N≥3; *P< 0.05; **P< 0.01. Abbreviations: C57, control group; KK, model group; CM, Chinese medicine group; WM, western medicine group. |
At the family level, the Venn diagram in Figure 5D showed the presence of 35 shared microbiota among the four groups. The model group uniquely possessed Leuconostocaceae and unclassified_o_Lactobacillales. The bar plot analysis in Figure 5E depicted the changes in abundance of Lachnospiraceae, Muribaculaceae, Oscillospiraceae, Rikenellaceae, Marinifilaceae, Ruminococcaceae, Bacteroidaceae, Eubacterium_coprostanoligenes_group, Lactobacillaccae, Deferribacteraceae, Desulfovibrionaceae, Prevotellaceae, Tannerellaceae and Erysipelotrichaceae among the groups. The Kruskal–Wallis H-test bar plot in Figure 5F further demonstrated significant changes in some microbiota.
The Alternation of Gut Microbial Composition at the Genus Level
Finally, we conducted a comparison of the changes in gut microbial composition at the genus level. The Venn diagram presented in Figure 6A showed that there were 71 shared microbiota among the four groups. The bar plot in Figure 6B and the Kruskal–Wallis H-test in Figures 6C illustrated the significant changes observed in norank_f_Muribaculaceae, Alistipes, norank_f_Oscillospiraceae, Roseburia, Bacteroides, Rikenella, Lactobacillus, Oscillibacter, norank_f_Lachnospiraceae, norank_f_Ruminococcaceeae, norank_o_Clostridia_UCG-014, Lachnoclostridium, Alloprevotella, Anaerotruncus and Parabacteroides.
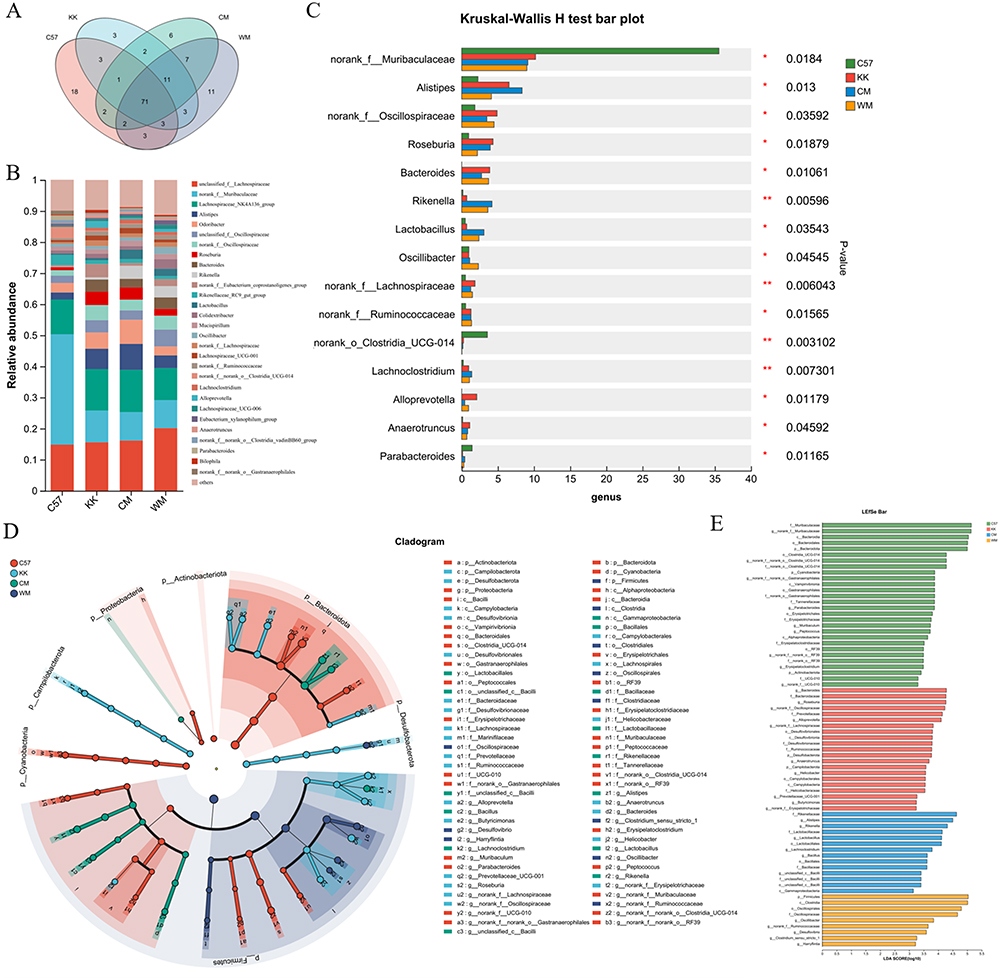 |
Figure 6 The analysis of gut microbiota compositions at the genus level. (A) An Venn map was generated to illustrate the number of distinct microbiota at the genus level among different groups; (B) Community bar plot analysis was performed to depict the distribution patterns of microbial genera within the gut microbiota; (C) Kruskal–Wallis H-test bar plot was used to highlight statistically significant differences in gut microbiota composition at the genus level; (D) The LEfSe was employed, represented by a radiating circle from phylum to genus; (E) The histogram of the LDA score was generated. N≥3; *P< 0.05; **P< 0.01. Abbreviations: C57, control group; KK, model group; CM, Chinese medicine group; WM, western medicine group. |
Furthermore, the Linear discriminant analysis Effect Size (LEfSe) analysis in Figure 6D demonstrated the hierarchical classification, starting from the phylum level down to the genus level. The radiating pattern of the LEfSe plot signified the differentiation of specific taxa. Additionally, the histogram of the Linear Discriminant Analysis (LDA) score in Figure 6E identified high-dimensional biomarkers associated with the intestinal microflora, providing valuable insights into the microbial changes observed.
To further elucidate the specific microbiota involved in CM treatment, a Wilcoxon rank-sum test was conducted to compare the alterations of microbiota from the phylum to genus level. Interestingly, Rikenella, Lachnoclostridium and unclassified_c_Bacilli were found to be significantly more abundant after CM treatment, accompanied by a lower abundance of norank_f_Lachnospiraceae when compared to the model group, as shown in Figure 7A.
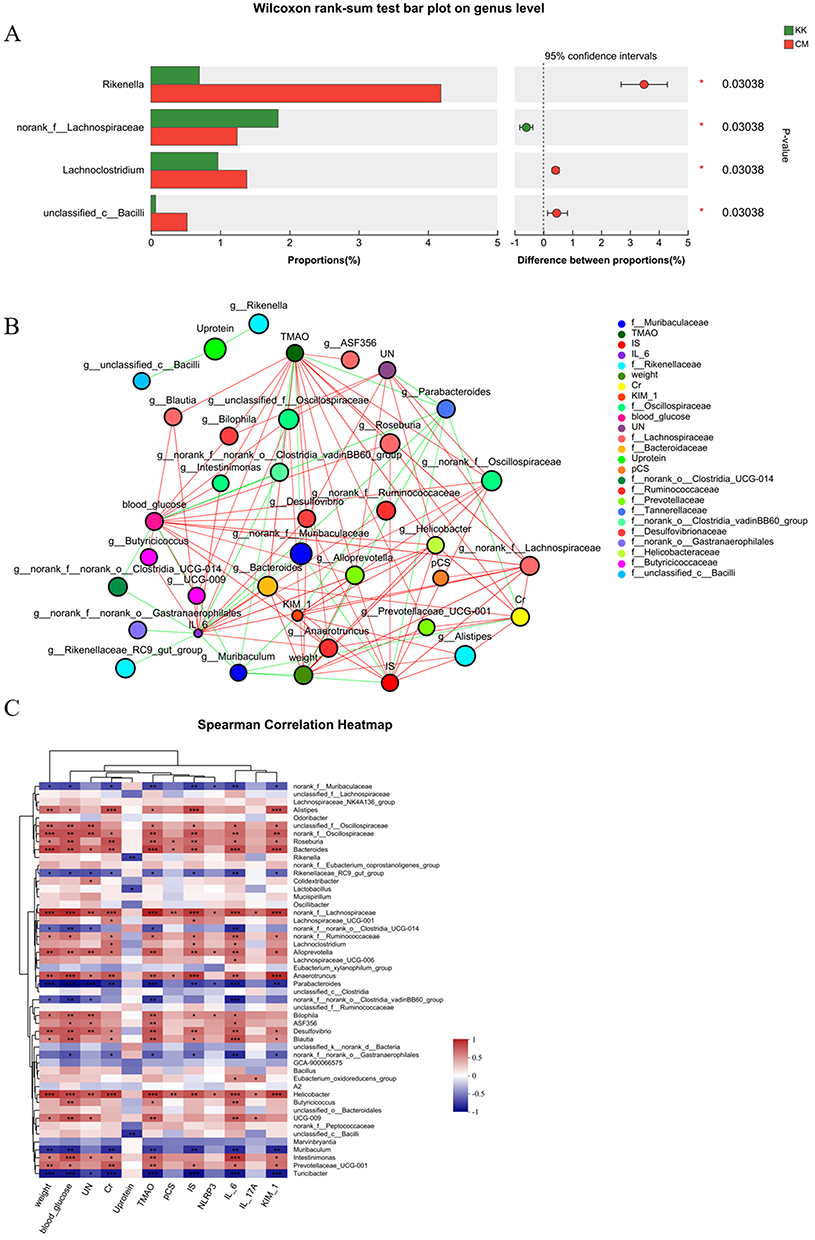 |
Figure 7 The gut microbiota compositions at the genus level in the model and CM groups. (A) A Wilcoxon rank-sum test bar plot demonstrated significant differences in gut microbiota composition; (B) A two-way correlated network was constructed to delineate the intricate relationships between influencing factors and microbiota; (C) A Spearman Correlation Heatmap was employed to visually represent the strength and directionality of the relationships between influencing factors and microbiota. N≥3; *P< 0.05; **P< 0.01; ***P< 0.001. Abbreviations: KK, model group; CM, Chinese medicine group. |
To identify the relationship between influencing factors and microbiota, a two-way correlated network analysis and Spearman Correlation Heatmap were performed, as depicted in Figures 7B and C. Notably, Rikenella and unclassified_c_Bacilli were negatively correlated with urine protein. Lachnoclostridium and norank_f_Lachnospiraceae were found to be positively related to Cr, IS and IL6, while norank_f_Lachnospiraceae was also positively related to weight, blood glucose, UN, KIM-1, TMAO, pCS, NLRP3 and IL-17A. The complex relationships between microbiota and influencing factors were clearly illustrated in Figure 8.
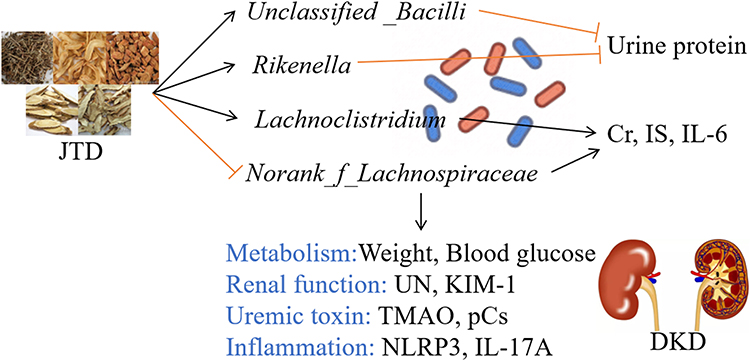 |
Figure 8 JTD ameliorated DKD through the regulation of gut microbiota. |
Discussion
The present study aimed to investigate the influence of JTD on DKD and its association with alterations in the gut microbiota. To mimic the early stages of DKD in humans, KK-Ay mice, which exhibit early signs of kidney damage including glomerular hypertrophy, thickened basement membrane, mesangial matrix proliferation and sclerotic nodules, were utilized. The administration of JTD displayed several notable effects. Firstly, it effectively regulated blood glucose and body weight, ameliorated pathological changes associated with DKD, and significantly down-regulated kidney function markers such as KIM-1, UN, Cr and urine protein levels. Moreover, JTD led to a reduction in uremic toxins including TMAO, pCS and IS, and exhibited a mitigating impact on inflammation factors such as NLRP3, IL-6 and IL-17A. Finally, JTD treatment exerted a modulatory influence on the composition of the gut microbiota. Specifically, the genera Rikenella, Lachnoclostridium and unclassified_c_Bacilli demonstrated a notable increase in abundance following JTD administration, while the abundance of norank_f_Lachnospiraceae decreased compared to the model group. Importantly, Rikenella and unclassified_c_Bacilli exhibited negative correlations with urine protein levels. On the other hand, Lachnoclostridium and norank_f_Lachnospiraceae showed positive associations with Cr, IS and IL-6. Furthermore, norank_f_Lachnospiraceae displayed positive associations with various indicators of DKD severity, including body weight, blood glucose, UN, KIM-1 levels, TMAO, pCS, NLRP3 and IL-17A production. These findings emphasized the potential role of gut microbiota-mediated uremic toxins and inflammation in the pathogenesis of DKD, which can be modulated by JTD treatment.
DKD pathogenesis involves excessive deposition of ROS due to high glucose levels, leading to oxidative stress, fibrosis and inflammation in the kidney.34 Transforming growth factor-beta (TGF-β) is a key factor in DKD-related fibrosis, overproduced by mesangial cells under hyperglycemia,35 which contributes to extracellular matrix (ECM) accumulation and eventual glomerulosclerosis.36 Furthermore, increased pro-inflammatory factors played a crucial role in the progression of kidney dysfunction in DKD.37 Experimental studies have shown that inhibiting the recruitment of inflammatory cells into the kidneys can provide protection against DKD.38 Notably, NLRP3 deficiency has been demonstrated to improve kidney inflammation and fibrosis in diabetic mice.39 Additionally, the inflammatory response and tissue remodeling associated with injury and glomerular sclerosis in DKD were synergistically mediated by IL-17 and CD40L.40 Blocking IL-17A has been shown to ameliorate kidney dysfunction and slow down disease progression in ob/ob mice, indicating that IL-17A is involved in diabetes-induced kidney damage and could be a promising therapeutic target for improving DKD. In this study, we observed an up-regulation in the levels of NLRP3, IL-6 and IL-17A in the DKD model compared to the control group. However, treatment with JTD resulted in the down-regulation of these inflammatory factors. These findings were consistent with previous reports, which demonstrated that JTD improved DKD in KK-Ay mice through the regulation of the PI3K/Akt-mediated NF-κB pathways.24 In summary, the inhibition of inflammatory cell recruitment and the down-regulation of pro-inflammatory factors like NLRP3, IL-6, and IL-17A were key mechanisms through which JTD exerted its protective effects on DKD. These results support the potential of JTD as a therapeutic intervention for DKD by targeting inflammation-related pathways.
Metabolic abnormalities in patients with DKD impaired the digestion and absorption of proteins, leading to the production of protein end-products such as p-cresol, indole, phenol, and trimethylamine (TMA) by dysfunctional gut microbiota.41–45 These end-products then increased the hepatic production of pCS, IS, and TMAO, which were all considered typical uremic toxins.41–45 TMAO could be eliminated through glomerular filtration, making hemodialysis an effective method to remove TMAO from the systemic circulation.46 Elevated TMAO levels were associated with a higher risk of death in CKD patients.47 In a mouse model of diet-induced obesity, increased TMAO levels were found to be related to higher expression levels inflammatory cytokines compared to the control group. However, supplementation with a TMA formation inhibitor improved kidney fibrosis and reduced the expression of KIM-1 and proinflammatory cytokines in high fat diet -induced mice.48 A significant increase in plasma TMAO levels was found in CKD patients, and this rise in plasma TMAO could be transferred to normal mice by transplanting fecal microorganisms from these patients.19 High levels of pCS and IS could lead to insulin resistance and kidney tubulointerstitial fibrosis.49,50 Furthermore, due to the protein-binding properties of pCS and IS, these toxins easily band to albumin and can not be adequately removed by traditional hemodialysis. This leads to the accumulation of these solutes in patients with ESRD and a potential increase in their toxicity.51 In our study, we observed an up-regulation of uremic toxins in the DKD model, which were reduced by JTD treatment. Additionally, we found that the presence of Lachnoclostridium and norank_f_Lachnospiraceae in the gut microbiota positively correlated with uremic toxins, suggesting that microbiota-mediated uremic toxins may be a crucial mechanism in DKD. Overall, these findings suggested that metabolic abnormalities in DKD patients contribute to the production of uremic toxins by disrupted gut microbiota, which in turn can lead to various complications and disease progression. JTD treatment showed promise in reducing these uremic toxins, highlighting its potential as a therapeutic intervention for DKD. The association between specific bacteria and uremic toxins also suggested the involvement of microbiota-mediated mechanisms in the development of DKD.
In recent years, there has been growing recognition of the gut-kidney axis and its implication in the development of DKD.52 Studies involving the manipulation of gut microbiota in animals and observational researches on patients with CKD have shed light on the role of dysbiosis, intestinal barrier dysfunction and chronic inflammation in kidney dysfunction associated with DKD.53 Among the bacteria identified, Rikenella was known for its ability to ferment complex carbohydrates and produce short-chain fatty acids, such as propionate, butyrate and acetate.54 Interestingly, lower abundance of Rikenella has been observed in db/db mice, which aligns with the findings of our study.37 The decrease in Rikenella abundance may contribute to the improvement of kidney function, particularly in terms of regulating urine protein. However, a comprehensive understanding of the specific mechanisms underlying the effects of Rikenella and its potential role in ameliorating DKD required further investigation. Another significant finding was the higher prevalence of Lachnospiraceae in DKD mice, which was aligned with their higher basal metabolism and increased energy requirements.55 The genus norank_f_Lachnospiraceae, which represented bacteria not currently classified at the genus level within the Lachnospiraceae family, was found to be the dominant species in DKD mice.55 Its presence exhibited positive associations with various indicators of DKD severity, including weight, blood glucose, UN, Cr, KIM-1, TMAO, pCS, IS, NLRP3, IL-6 and IL-17A levels. Additionally, Lachnoclostridium, a genus positively correlated with serum cholesterol and triglyceride levels, may play a detrimental role in the development and progression of DKD.56 In our study, Lachnoclostridium exhibited positive associations with serum Cr, IS and IL-6 levels, further supporting its potential involvement in DKD pathology. In contrast, limited research has explored the relationship between the genus unclassified_c_Bacilli and DKD. Nonetheless, our study found a negative association between unclassified_c_Bacilli and urine protein, suggesting a potential beneficial effect. Overall, these findings underscored the significance of gut microbiota composition in the complex pathogenesis of DKD. Elucidating the functional roles of these specific bacterial groups and their potential as therapeutic targets necessitated further investigation.
In traditional Chinese Medicine, diabetes is classified as a “wasting-thirst” disorder, and its pathogenesis is primarily attributed to yin deficiency, fire prosperity, and lung and kidney yin deficiency. JTD comprises five herbs, including Euphorbia humifusa Willd, Salvia miltiorrhiza Bunge, Astragalus mongholicus Bunge, Asphodelus asphodeloides Bunge, and Cistanche chinensis ranch, and HPLC analysis has identified its principal components, namely calycosin-7-O-β-D-glucoside, salvianolic acid B, coptisine, palmatine, berberine and timosaponin BII. Notably, calycosin-7-O-β-D-glucoside exerted significant intestinal effects by modulating the microbial population.57 Its incubation with the gut microbiota from normal and colitic rats stimulated growth of probiotic bacteria like Lactobacillus and Bifidobacterium, indicating that calycosin-7-O-β-D-glucoside reciprocally interacts with gut microbiota after oral administration, thereby functioning as an angiogenic prodrug and gut microbiota modulator.58 Furthermore, salvianolic acid B has been found to prevent weight gain and regulate gut microbiota in high-fat diet-induced obese mice,59,60 while coptisine, palmatine, and berberine have been shown to lower blood glucose levels through gut microbiota modulation in db/db mice.61 The metabolic characteristics of gut microbiota may serve as a crucial indicator of the pharmacological activity of timosaponin BII.62 This study demonstrated that JTD modulate gut microbiota and impacts metabolic processes, kidney function, uremic toxin accumulation and inflammation in DKD. Although significant associations have been revealed between microbiota and influencing factors, the underlying mechanism still required further exploration. Future research on the gut microbiota-mediated uremic toxins and inflammation will help elucidate the mechanism of DKD and provide novel targets for the prevention and treatment of DKD.
JTD has been reported to possess potential benefits for the treatment of DKD. However, due to the intricate and multifactorial composition of traditional Chinese medicine (TCM) formulations, along with limitations in research, it is crucial to exercise caution regarding potential adverse effects. According to the 2020 edition of the Pharmacopoeia of the People’s Republic of China,63 large doses of Euphorbia humifusa Willd may cause hepatotoxicity, nephrotoxicity, and gastrointestinal side effects such as diarrhea and vomiting. Salvia miltiorrhiza Bunge has demonstrated a capacity to negatively impact blood coagulation and platelet function, and may also induce gastrointestinal side effects such as nausea and abdominal pain. Although Astragalus mongholicus Bunge and Asphodelus asphodeloides Bunge may produce mild gastrointestinal side effects, such as diarrhea, they are generally deemed safe for use in TCM formulations. Conversely, Codonopsis chinensis Franch has exhibited low toxicity and has not been shown to elicit significant adverse effects in animal studies. In summary, like any other medication, TCM formulations necessitate the careful and guided use of professionals. TCM theory emphasizes the significance of personalized diagnosis and treatment plans, wherein TCM herbal medicine should be administered in accordance with this theoretical framework to enhance therapeutic efficacy and mitigate potential side effects.
Conclusion
JTD possessed the ability to modulate the abundance of Rikenella, Lachnoclostridium, unclassified_c_Bacilli and norank_f_Lachnospiraceae within the gut microbiota. This modulation subsequently exerted an impact on metabolic processes, kidney function, uremic toxin accumulation and inflammation. As a result, these multifaceted effects collectively contributed to the amelioration of DKD.
Abbreviations
JTD, Jiangtang decoction; DKD, diabetic kidney disease; IS, indoxyl sulfate; IL, interleukin; UN, urea nitrogen; KIM-1, kidney injury molecule-1; TMAO, trimethylamine-N-oxide; pCS, p-cresyl sulfate; PI3K, phosphatidylinositol-3-kinase; Akt, protein kinase B; NF-κB, nuclear factor-k-gene binding; CM, Chinese medicine; WM, western medicine; NLRP3, nucleotide-binding oligomerization domain (Nod)-like receptor family pyrin domain-containing 3; DM, diabetes mellitus; ESRD, end-stage renal disease; ROS, reactive oxygen species; CKD, chronic kidney disease; AS-IV, Astragaloside IV; SPF, specific pathogen-free; PCoA, principal coordinates analysis; ASV, Amplicon Sequence Variant; TMA, trimethylamine; TGF-β, transforming growth factor-beta; TCM, traditional Chinese medicine; Cr, creatinine; SD, standard deviation; ANOVA, one-way analysis of variance; LSD, least significant difference; LDA, linear discriminant analysis; ECM, extracellular matrix; HPLC, high-performance liquid chromatography; NIH, National Institutes of Health; LEfSe, Linear discriminant analysis Effect Size.
Data Sharing Statement
Data available on request from the first authors. All sequencing data were deposited in the the NCBI SRA under accession number PRJNA1014710.
Ethics Approval and Informed Consent
The protocol was approved by the Institutional Animal Care and Use Committee of Guangdong Provincial People’s Hospital (Approval Number: KY2023-018-01).
Consent for Publication
The details of data can be published.
Acknowledgments
The authors acknowledged Guangdong Provincial People’s Hospital and Professor Zhongdao Wu’s Lab in Sun Yat-sen University for the academic supports.
Author Contributions
All authors made a significant contribution to the work reported, whether that is in the conception, study design, execution, acquisition of data, analysis and interpretation, or in all these areas; took part in drafting, revising or critically reviewing the article; gave final approval of the version to be published; have agreed on the journal to which the article has been submitted; and agree to be accountable for all aspects of the work.
Funding
This study was funded by the National Natural Science Foundation of China (No. 82202560), the Guangdong Basic and Applied Basic Research Foundation (No.2022A1515110655), the Traditional Chinese Medicine Bureau of Guangdong Province (Nos. 20231003 and 20223001), the Natural Science Foundation of Guangdong Province (Nos. 2023A1515011458 and 2021A1515220050), and the Science and Technology Program of Guangzhou (No. SL2022A04J00042).
Disclosure
The authors report no conflicts of interest in this work.
References
1. Valencia WM, Florez H. How to prevent the microvascular complications of type 2 diabetes beyond glucose control. BMJ. 2017;356:i6505. doi:10.1136/bmj.i6505
2. Roth GA, Abate D, Abate KH, et al. Global, regional, and national age-sex-specific mortality for 282 causes of death in 195 countries and territories, 1980–2017: a systematic analysis for the Global Burden of Disease Study 2017. Lancet. 2018;392(10159):1736–1788. doi:10.1016/S0140-6736(18)32203-7
3. Zhang L, Long J, Jiang W, et al. Trends in Chronic Kidney Disease in China. N Engl J Med. 2016;375(9):905–906. doi:10.1056/NEJMc1602469
4. Gheith O, Farouk N, Nampoory N, Halim MA, Al-Otaibi T. Diabetic kidney disease: world wide difference of prevalence and risk factors. J Nephropharmacol. 2016;5(1):49–56.
5. Stenvinkel P. Chronic kidney disease: a public health priority and harbinger of premature cardiovascular disease. J Intern Med. 2010;268(5):456–467. doi:10.1111/j.1365-2796.2010.02269.x
6. Kopel J, Pena-Hernandez C, Nugent K. Evolving spectrum of diabetic nephropathy. World J Diabetes. 2019;10(5):269–279. doi:10.4239/wjd.v10.i5.269
7. Arora MK, Singh UK. Molecular mechanisms in the pathogenesis of diabetic nephropathy: an update. Vascul Pharmacol. 2013;58(4):259–271. doi:10.1016/j.vph.2013.01.001
8. Rayego-Mateos S, Morgado-Pascual JL, Opazo-Rios L, et al. Pathogenic pathways and therapeutic approaches targeting inflammation in diabetic nephropathy. Int J Mol Sci. 2020;21(11):3798. doi:10.3390/ijms21113798
9. Maiti AK. Development of biomarkers and molecular therapy based on inflammatory genes in diabetic nephropathy. Int J Mol Sci. 2021;22(18):9985. doi:10.3390/ijms22189985
10. Wada J, Makino H. Innate immunity in diabetes and diabetic nephropathy. Nat Rev Nephrol. 2016;12(1):13–26. doi:10.1038/nrneph.2015.175
11. Schena FP, Gesualdo L. Pathogenetic mechanisms of diabetic nephropathy. J Am Soc Nephrol. 2005;16(Suppl 1):S30–S33. doi:10.1681/ASN.2004110970
12. Niewczas MA, Pavkov ME, Skupien J, et al. A signature of circulating inflammatory proteins and development of end-stage renal disease in diabetes. Nat Med. 2019;25(5):805–813. doi:10.1038/s41591-019-0415-5
13. Lavoz C, Rayego-Mateos S, Orejudo M, et al. Could IL-17A be a novel therapeutic target in diabetic nephropathy? J Clin Med. 2020;9(1):272. doi:10.3390/jcm9010272
14. Fathy SA, Mohamed MR, Ali M, El-Helaly AE, Alattar AT. Influence of IL-6, IL-10, IFN-gamma and TNF-alpha genetic variants on susceptibility to diabetic kidney disease in type 2 diabetes mellitus patients. Biomarkers. 2019;24(1):43–55. doi:10.1080/1354750X.2018.1501761
15. Dixit VD. Nlrp3 inflammasome activation in type 2 diabetes: is it clinically relevant? Diabetes. 2013;62(1):22–24. doi:10.2337/db12-1115
16. Anders HJ, Andersen K, Stecher B. The intestinal microbiota, a leaky gut, and abnormal immunity in kidney disease. Kidney Int. 2013;83(6):1010–1016. doi:10.1038/ki.2012.440
17. Vaziri ND, Yuan J, Nazertehrani S, Ni Z, Liu S. Chronic kidney disease causes disruption of gastric and small intestinal epithelial tight junction. Am J Nephrol. 2013;38(2):99–103. doi:10.1159/000353764
18. Jiang S, Xie S, Lv D, et al. Alteration of the gut microbiota in Chinese population with chronic kidney disease. Sci Rep. 2017;7(1):2870. doi:10.1038/s41598-017-02989-2
19. Xu KY, Xia GH, Lu JQ, et al. Impaired renal function and dysbiosis of gut microbiota contribute to increased trimethylamine-N-oxide in chronic kidney disease patients. Sci Rep. 2017;7(1):1445. doi:10.1038/s41598-017-01387-y
20. Kanbay M, Onal EM, Afsar B, et al. The crosstalk of gut microbiota and chronic kidney disease: role of inflammation, proteinuria, hypertension, and diabetes mellitus. Int Urol Nephrol. 2018;50(8):1453–1466. doi:10.1007/s11255-018-1873-2
21. Salguero MV, Al-Obaide M, Singh R, Siepmann T, Vasylyeva TL. Dysbiosis of Gram-negative gut microbiota and the associated serum lipopolysaccharide exacerbates inflammation in type 2 diabetic patients with chronic kidney disease. Exp Ther Med. 2019;18(5):3461–3469. doi:10.3892/etm.2019.7943
22. Ramezani A, Raj DS. The gut microbiome, kidney disease, and targeted interventions. J Am Soc Nephrol. 2014;25(4):657–670. doi:10.1681/ASN.2013080905
23. Tang WH, Wang Z, Kennedy DJ, et al. Gut microbiota-dependent trimethylamine N-oxide (TMAO) pathway contributes to both development of renal insufficiency and mortality risk in chronic kidney disease. Circ Res. 2015;116(3):448–455. doi:10.1161/CIRCRESAHA.116.305360
24. Hong JN, Li WW, Wang LL, et al. Jiangtang decoction ameliorate diabetic nephropathy through the regulation of PI3K/Akt-mediated NF-kappaB pathways in KK-Ay mice. Chin Med. 2017;12(1):13. doi:10.1186/s13020-017-0134-0
25. Hong JN, Li WW, Fu H, Wang XM. 中药降糖复方水提取物对KK-Ay糖尿病小鼠糖基化终末端产物及氧化应激的影响 [Study on effect of Jiangtang decoction on AGEs-RAGE and oxidative stress in KK-Ay mice]. Zhongguo Zhong Yao Za Zhi. 2017;42(14):2754–2759. Chinese. doi:10.19540/j.cnki.cjcmm.20170609.007
26. Sun H, Liu Q, Hu H, et al. Berberine ameliorates blockade of autophagic flux in the liver by regulating cholesterol metabolism and inhibiting COX2-prostaglandin synthesis. Cell Death Dis. 2018;9(8):824. doi:10.1038/s41419-018-0890-5
27. Gong P, Xiao X, Wang S, et al. Hypoglycemic effect of astragaloside IV via modulating gut microbiota and regulating AMPK/SIRT1 and PI3K/AKT pathway. J Ethnopharmacol. 2021;281:114558. doi:10.1016/j.jep.2021.114558
28. Liu C, Zhao D, Ma W, et al. Denitrifying sulfide removal process on high-salinity wastewaters in the presence of Halomonas sp. Appl Microbiol Biotechnol. 2016;100(3):1421–1426. doi:10.1007/s00253-015-7039-6
29. Chen S, Zhou Y, Chen Y, Gu J. FASTP: an ultra-fast all-in-one FASTQ preprocessor. Bioinformatics. 2018;34(17):i884–i890. doi:10.1093/bioinformatics/bty560
30. Magoc T, Salzberg SL. FLASH: fast length adjustment of short reads to improve genome assemblies. Bioinformatics. 2011;27(21):2957–2963. doi:10.1093/bioinformatics/btr507
31. Callahan BJ, McMurdie PJ, Rosen MJ, Han AW, Johnson AJ, Holmes SP. DADA2: high-resolution sample inference from Illumina amplicon data. Nat Methods. 2016;13(7):581–583. doi:10.1038/nmeth.3869
32. Bolyen E, Rideout JRDillon MR, et al. Reproducible, interactive, scalable and extensible microbiome data science using QIIME 2. Nature Biotechnology. 2019;37(2):852–857. doi:10.1038/s41587-019-0209-9
33. Schloss P D, Westcott S LRyabin T, et al. Introducing mothur: Open-Source, Platform-Independent, Community-Supported Software for Describing and Comparing Microbial Communities. Appl Environ Microbiol. 2009;75(2):7537 doi:10.1128/AEM.01541-09
34. Jung CY, Yoo TH. Pathophysiologic mechanisms and potential biomarkers in diabetic kidney disease. Diabetes Metab J. 2022;46(2):181–197. doi:10.4093/dmj.2021.0329
35. Cao T, Xu R, Xu Y, Liu Y, Qi D, Wan Q. The protective effect of Cordycepin on diabetic nephropathy through autophagy induction in vivo and in vitro. Int Urol Nephrol. 2019;51(10):1883–1892. doi:10.1007/s11255-019-02241-y
36. Hathaway CK, Gasim AM, Grant R, et al. Low TGFbeta1 expression prevents and high expression exacerbates diabetic nephropathy in mice. Proc Natl Acad Sci U S A. 2015;112(18):5815–5820. doi:10.1073/pnas.1504777112
37. Cai TT, Ye XL, Li RR, et al. Resveratrol modulates the gut microbiota and inflammation to protect against diabetic nephropathy in mice. Front Pharmacol. 2020;11:1249. doi:10.3389/fphar.2020.01249
38. Lim AK, Ma FY, Nikolic-Paterson DJ, Thomas MC, Hurst LA, Tesch GH. Antibody blockade of c-fms suppresses the progression of inflammation and injury in early diabetic nephropathy in obese db/db mice. Diabetologia. 2009;52(8):1669–1679. doi:10.1007/s00125-009-1399-3
39. Wu M, Han W, Song S, et al. NLRP3 deficiency ameliorates renal inflammation and fibrosis in diabetic mice. Mol Cell Endocrinol. 2018;478:115–125. doi:10.1016/j.mce.2018.08.002
40. Kuo HL, Huang CC, Lin TY, Lin CY. IL-17 and CD40 ligand synergistically stimulate the chronicity of diabetic nephropathy. Nephrol Dial Transplant. 2018;33(2):248–256. doi:10.1093/ndt/gfw397
41. Kikuchi K, Saigusa D, Kanemitsu Y, et al. Gut microbiome-derived phenyl sulfate contributes to albuminuria in diabetic kidney disease. Nat Commun. 2019;10(1):1835. doi:10.1038/s41467-019-09735-4
42. Mosterd CM, Kanbay M, van den Born B, van Raalte DH, Rampanelli E. Intestinal microbiota and diabetic kidney diseases: the Role of microbiota and derived metabolites inmodulation of renal inflammation and disease progression. Best Pract Res Clin Endocrinol Metab. 2021;35(3):101484. doi:10.1016/j.beem.2021.101484
43. Gryp T, Huys G, Joossens M, Van Biesen W, Glorieux G, Vaneechoutte M. Isolation and quantification of uremic toxin precursor-generating gut bacteria in chronic kidney disease patients. Int J Mol Sci. 2020;21(6):1986. doi:10.3390/ijms21061986
44. Chen L, Shi J, Ma X, Shi D, Qu H. Effects of microbiota-driven therapy on circulating indoxyl sulfate and P-cresyl sulfate in patients with chronic kidney disease: a systematic review and meta-analysis of randomized controlled trials. Adv Nutr. 2022;13(4):1267–1278. doi:10.1093/advances/nmab149
45. Zhu W, Romano KA, Li L, et al. Gut microbes impact stroke severity via the trimethylamine N-oxide pathway. Cell Host Microbe. 2021;29(7):1199–1208. doi:10.1016/j.chom.2021.05.002
46. Pelletier CC, Croyal M, Ene L, et al. Elevation of trimethylamine-N-Oxide in chronic kidney disease: contribution of decreased glomerular filtration rate. Toxins. 2019;11(11):635. doi:10.3390/toxins11110635
47. Gruppen EG, Garcia E, Connelly MA, et al. TMAO is associated with mortality: impact of modestly impaired renal function. Sci Rep. 2017;7(1):13781. doi:10.1038/s41598-017-13739-9
48. Sun G, Yin Z, Liu N, et al. Gut microbial metabolite TMAO contributes to renal dysfunction in a mouse model of diet-induced obesity. Biochem Biophys Res Commun. 2017;493(2):964–970. doi:10.1016/j.bbrc.2017.09.108
49. Chang JF, Hsieh CY, Lu KC, et al. Therapeutic targeting of aristolochic acid induced uremic toxin retention, SMAD 2/3 and JNK/ERK pathways in tubulointerstitial fibrosis: nephroprotective role of propolis in chronic kidney disease. Toxins. 2020;12(6):364. doi:10.3390/toxins12060364
50. Koppe L, Pillon NJ, Vella RE, et al. p-Cresyl sulfate promotes insulin resistance associated with CKD. J Am Soc Nephrol. 2013;24(1):88–99. doi:10.1681/ASN.2012050503
51. Deltombe O, Van Biesen W, Glorieux G, Massy Z, Dhondt A, Eloot S. Exploring protein binding of uremic toxins in patients with different stages of chronic kidney disease and during hemodialysis. Toxins. 2015;7(10):3933–3946. doi:10.3390/toxins7103933
52. Yang T, Richards EM, Pepine CJ, Raizada MK. The gut microbiota and the brain-gut-kidney axis in hypertension and chronic kidney disease. Nat Rev Nephrol. 2018;14(7):442–456. doi:10.1038/s41581-018-0018-2
53. Andersen K, Kesper MS, Marschner JA, et al. Intestinal dysbiosis, barrier dysfunction, and bacterial translocation account for CKD-related systemic inflammation. J Am Soc Nephrol. 2017;28(1):76–83. doi:10.1681/ASN.2015111285
54. Meehan CJ, Beiko RG. A phylogenomic view of ecological specialization in the Lachnospiraceae, a family of digestive tract-associated bacteria. Genome Biol Evol. 2014;6(3):703–713. doi:10.1093/gbe/evu050
55. Zhou Q, Yang F, Li Z, et al. Paecilomyces cicadae-fermented Radix astragali ameliorate diabetic nephropathy in mice by modulating the gut microbiota. J Med Microbiol. 2022;71(5). doi:10.1099/jmm.0.001535
56. Chen W, Zhang M, Guo Y, et al. The profile and function of gut microbiota in diabetic nephropathy. Diabetes Metab Syndr Obes. 2021;14:4283–4296. doi:10.2147/DMSO.S320169
57. Zhang W, Jiang S, Qian D, Shang EX, Duan JA. Analysis of interaction property of calycosin-7-O-beta-D-glucoside with human gut microbiota. J Chromatogr B Analyt Technol Biomed Life Sci. 2014;963:16–23. doi:10.1016/j.jchromb.2014.05.015
58. Ruan JQ, Li S, Li YP, Wu WJ, Lee SM, Yan R. The presystemic interplay between gut microbiota and orally administered Calycosin-7-O-beta-D-Glucoside. Drug Metab Dispos. 2015;43(10):1601–1611. doi:10.1124/dmd.115.065094
59. Li L, Li R, Zhu R, et al. Salvianolic acid B prevents body weight gain and regulates gut microbiota and LPS/TLR4 signaling pathway in high-fat diet-induced obese mice. Food Funct. 2020;11(10):8743–8756. doi:10.1039/D0FO01116A
60. Bai Y, Bao X, Mu Q, et al. Ginsenoside Rb1, salvianolic acid B and their combination modulate gut microbiota and improve glucolipid metabolism in high-fat diet induced obese mice. Peerj. 2021;9:e10598. doi:10.7717/peerj.10598
61. Lyu Y, Lin L, Xie Y, et al. Blood-glucose-lowering effect of coptidis rhizoma extracts from different origins via gut microbiota modulation in db/db mice. Front Pharmacol. 2021;12:684358. doi:10.3389/fphar.2021.684358
62. Dong GM, Yu H, Pan LB, et al. Biotransformation of timosaponin BII into seven characteristic metabolites by the gut microbiota. Molecules. 2021;26(13):3861. doi:10.3390/molecules26133861
63. China TSPC. Pharmacopoeia of the People’s Republic of China.
 © 2023 The Author(s). This work is published and licensed by Dove Medical Press Limited. The
full terms of this license are available at https://www.dovepress.com/terms
and incorporate the Creative Commons Attribution
- Non Commercial (unported, 3.0) License.
By accessing the work you hereby accept the Terms. Non-commercial uses of the work are permitted
without any further permission from Dove Medical Press Limited, provided the work is properly
attributed. For permission for commercial use of this work, please see paragraphs 4.2 and 5 of our Terms.
© 2023 The Author(s). This work is published and licensed by Dove Medical Press Limited. The
full terms of this license are available at https://www.dovepress.com/terms
and incorporate the Creative Commons Attribution
- Non Commercial (unported, 3.0) License.
By accessing the work you hereby accept the Terms. Non-commercial uses of the work are permitted
without any further permission from Dove Medical Press Limited, provided the work is properly
attributed. For permission for commercial use of this work, please see paragraphs 4.2 and 5 of our Terms.