")
Back to Journals » Cancer Management and Research » Volume 11
iTRAQ-based quantitative protein expression profiling of biomarkers in childhood B-cell and T-cell acute lymphoblastic leukemia
Authors Yu R, Zhang J, Zang Y, Zeng L, Zuo W , Bai Y, Liu Y, Sun K , Liu Y
Received 26 March 2019
Accepted for publication 18 June 2019
Published 25 July 2019 Volume 2019:11 Pages 7047—7063
DOI https://doi.org/10.2147/CMAR.S210093
Checked for plagiarism Yes
Review by Single anonymous peer review
Peer reviewer comments 2
Editor who approved publication: Professor Yong Teng
Runhong Yu,1 Jingyu Zhang,2 Yuzhu Zang,1 Li Zeng,2 Wenli Zuo,3 Yanliang Bai,1 Yanhui Liu,1 Kai Sun,1 Yufeng Liu4
1Department of Hematology, People’s Hospital of Zhengzhou University/Henan Provincial People’s Hospital, Zhengzhou 450003, Henan, People’s Republic of China; 2Department of Clinical Laboratory, The First Affiliated Hospital of Zhengzhou University, Zhengzhou 450052, Henan, People’s Republic of China; 3Department of Hematology, Affiliated Cancer Hospital of Zhengzhou University/Henan Cancer Hospital, Zhengzhou 450008, Henan, People’s Republic of China; 4Department of Pediatrics, The First Affiliated Hospital of Zhengzhou University, Zhengzhou 450052, Henan, People’s Republic of China
Purpose: This study screened serum proteins to identify potential biomarkers for childhood B-cell and T-cell acute lymphoblastic leukemia (ALL).
Patients and methods: Serum collected from 20 newly diagnosed B-cell ALL, 20 T-cell ALL and 20 healthy children. The peptides from these samples were subjected to iTRAQ. Differentially expressed proteins (DEPs) were further validated by ELISA in 24 B-ALL, 24 T-ALL, and 24 healthy children.
Results: Bioinformatics analysis revealed several pathways, including atherosclerosis signaling, interleukin signaling and production in macrophages and clathrin-mediated endocytosis signaling, that were closely related to childhood T-cell ALL. Furthermore, four selected proteins, namely LRG1, S100A8, SPARC and sL-selectin, were verified by ELISA. These results were consistent with the results of the proteomics analysis.
Conclusion: Serum S100A8 may serve as new diagnostic biomarkers in childhood B-cell ALL and T-cell ALL.
Keywords: B-cell ALL, T-cell ALL, proteomics, acute lymphoblastic leukemia, children, serum, isobaric tags for relative and absolute quantitation, ingenuity pathways analysis
Introduction
Acute lymphoblastic leukemia (ALL), the most common malignancy of childhood, may be of B or T-cell lineage (B-ALL or T-ALL).1,2 Although the survival rate is currently approaching 90%, ALL remains one of the leading causes of cancer deaths in children.3 At onset, ALL is often difficult to discover because of its nonspecific symptoms, especially when blast cells are not detected in the peripheral blood. Currently, the bone marrow aspiration-based morphology, immunophenotype, cytogenetics, and molecular biology (MICM) method is used for the diagnosis and classification of leukemia at the time of onset and transformation. However, most children show different degrees of mental stress regarding this examination. Noninvasive and specific biomarkers for the early diagnosis of pediatric ALL are urgently needed. As early as 1988, it was reported that serum levels of interleukin (IL)-2 receptor in children with newly diagnosed ALL were significantly higher than those in unaffected children and that IL-2 receptor and CD8 had independent prognostic value in childhood ALL.4,5 However, previous studies only detected a single marker for ALL and were not able to screen and identify new biomarkers by holistic expression analysis of human proteins.
Compared to B-ALL, T-ALL has considerable phenotypic and biological heterogeneity; is more common in boys; and is associated with higher white blood cell counts, higher chemotherapy-related deaths, higher relapse rates, earlier central nervous system leukemia, and an overall worse prognosis.6 These biological behaviors and clinical characteristics of T-ALL may be related to the molecular genetics of leukemia cells, such as chromosome aberrations and fusion genes, but the analysis of molecular genetics is not equivalent to revealing the genome-encoded protein.7 The correlation between mRNA/DNA and protein levels is insufficient to predict protein expression levels. Gene expression can only be manifested by proteins. Therefore, it is important to screen and identify proteins expressed in T-ALL that can be used either as biomarkers for early diagnosis or prognosis of the disease or as potential drug targets.
Proteomics is a powerful tool for identifying novel molecule biomarkers.8 Of these, isobaric tags for relative and absolute quantification (iTRAQ), with the ability to multiplex up to eight distinct samples in a single experiment and with relatively higher sensitivity, has gained significant interest in the field of quantitative proteomics as a high-throughput quantification method.9
In this study, we used iTRAQ-based quantitative proteomic technology to analyze and compare differentially-expressed proteins in serum among three comparative groups (B-ALL: control, T-ALL: control, and T-ALL: B-ALL). Protein expression was confirmed by ELISA. In addition, a bioinformatics Ingenuity Pathway Analysis (IPA, http://www.ingenuity.com), including functional annotation, pathway analysis, and protein-protein interaction networks of differential proteins, was also performed. Our findings will contribute to the identification of serum-specific biomarkers in childhood B-ALL and T-ALL and have implications for understanding pediatric ALL.
Materials and methods
Reagents and equipment
iTRAQ™ 8-plex reagent kits were purchased from Applied ABI (USA). Trypsin, acetonitrile, isopropanol, acetone, formic acid, tris(hydroxymethyl)aminomethane (tris), ethylenediaminetetraacetic acid (EDTA), tetramethylethylenediamine (TEMED), Triton X-100, sodium dodecyl sulfate (SDS), and sodium citrate buffer were purchased from Sigma-Aldrich (USA). sL-Selectin/CD62L, S100A8, LRG1, and SPARC ELISA kits were obtained from Uscn (China). Sep-Pak Vac C18 cartridges were purchased from Waters (USA), Human 14 Multiple Affinity Removal System (MARS) from Agilent (USA), concentrator plus from Eppendorf (Germany), electrospray ionization and quadrupole time-of-flight liquid chromatography-mass spectrometry (ESI-Q-TOF LC-MS) system (Triple TOF4600) from AB SCIEX (USA), a reverse phase BEH C18 column (50×2.1 mm, 1.7 µm, 130 Å) from Waters (USA), and reverse C18 column (150 mm×75 µm, 3 µm, 300 Å) and a nano-high-performance liquid chromatography-mass spectrometry (HPLC-MS) system from Eksigent (USA).
Participants
Participants were recruited from the Pediatrics Unit of the First Affiliated Hospital of Zhengzhou University between March 2013 and March 2014. The study complied with the Declaration of Helsinki and followed the ethical principles of the First Affiliated Hospital of Zhengzhou University. The study was reviewed and approved by the Institutional Ethics Committee of the Department of Medicine of the First Affiliated Hospital of Zhengzhou University. Written informed consent was obtained from the parents or guardians before the commencement of this study. The primary ALL diagnosis was based on morphology, immunophenotypic analysis, cytochemical staining, and molecular analysis. The clinicopathological analysis was based on French-American-British classification and international prognostic scoring system.10 The patients were divided into the T-ALL or B-ALL groups based on the results of flow cytometry of cell surface markers. Age-matched healthy controls with normal physical examination findings were recruited from hospital outpatient departments; the controls had no manifestations of any hematological malignancy and no family medical history of allergies and other systemic diseases. All participants were <14 years of age. The characteristics of the study population are described in Table 1.
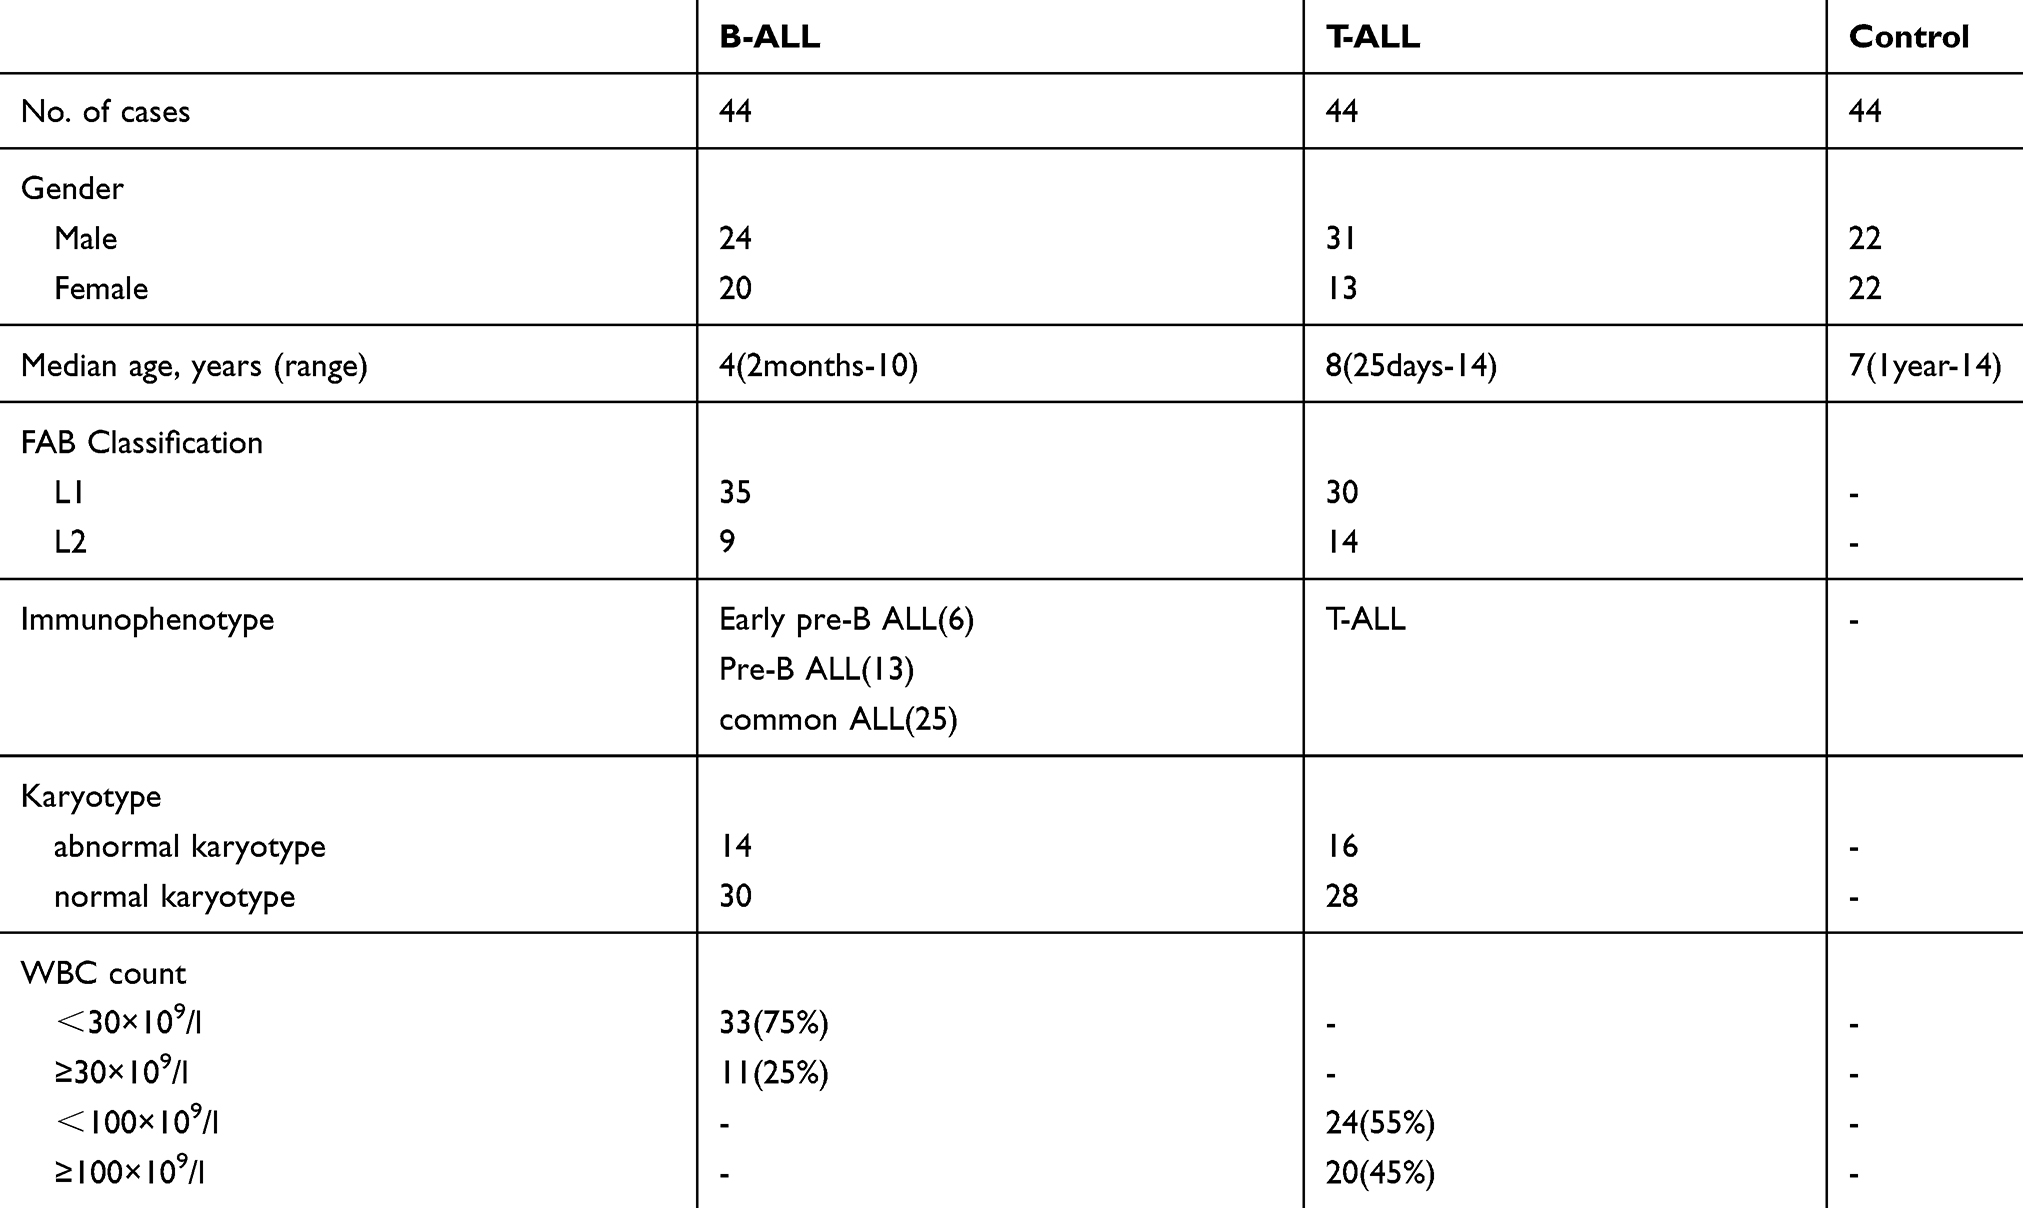 |
Table 1 Basic clinical characteristics of the study population |
Sample collection
For iTRAQ proteomics analysis, we obtained blood samples from 20 B-ALL patients, 20 T-ALL patients, and 20 healthy controls. For ELISA analysis, an additional 24 B-ALL patients, 24T-ALL patients, and 24 healthy controls were enrolled. Blood samples were collected before the initiation of cytotoxic therapy and 3 ml peripheral blood sample was collected from all participants. The blood samples were incubated at room temperature for 1 h in a vacutainer blood handling tube and centrifuged at 3,000 rpm for 15 min at 4 °C. The serum layer was aspirated and transferred to a clean polypropylene tube and stored at −80 °C until analysis.
Sample preparation
Pooled serum samples were generated by combining equal volumes of the 20 individual serum samples from each group (n=20). Serum samples (100 μL) from each group were thawed on ice and centrifuged at 10,000 rpm for 5 min at 4 °C. The high-abundance proteins of each serum pool were depleted using a Human 14 MARS according to the manufacturer’s instructions. The low-abundance components from the depletion column were concentrated and desalted using an Amicon® Ultra-0.5 mL. The protein concentration in each sample was quantified using a Bradford Protein Assay Kit (Bio-Rad, Richmond, CA). The protein normalization was confirmed by 12% SDS-polyacrylamide gel electrophoresis (SDS-PAGE).
iTRAQ labeling
A total of 100 μg of each protein sample was denatured, reduced, blocked on cysteine, alkylated, and subsequently digested with trypsin overnight at 37 °C. According to the iTRAQ reagent-8 plex Kit protocol from the manufacturer, the tryptic peptide solution of each sample was labeled with iTRAQ reagents as follows: control group with iTRAQ reagent 113; B-ALL group with iTRAQ reagent 114; and T-ALL group with iTRAQ reagent 115. Subsequently, the iTRAQ-labeled peptides were mixed and desalted using a Sep-Pak Vac C18 cartridge and vacuum-dried.
Two-dimensional LC-MS/MS
The mixed peptides were fractionated by strong cation exchange (SCX) chromatography on an ultra-performance liquid chromatography (UPLC) system with a reverse phase BEH C18 column (50×2.1 mm, 1.7 µm, 300 Å). A linear gradient was applied at a flow rate of 200 μl/min using two mobile phases (solvent A: 10 mM ammonium formate, 99.9% (v/v) ddH2O, pH 10; solvent B: 10 mM ammonium formate, 99.9% (v/v) acetonitrile, pH 10) beginning with 5% solvent B and increasing to 30% over a 30-min period). The absorbance was detected at 214 nm and fractions were collected every 0.5 min. Finally, these samples were combined into 24 fractions based on the quantity of peptide and then desalted on C18 cartridges. Each fraction was dried in a vacuum centrifuge and reconstituted with buffer A (5% acetonitrile, 0.1% formic acid, pH 2.7). The fractions were separated by nano-HPLC on a secondary reversed-phase analytical column (C18 column, 150 mm ×75 µm, 3 µm, 300 Å). The peptides were subsequently eluted in a gradient of buffer B (99.9% acetonitrile with 0.1% formic acid, pH 2.7) increasing from 5% to 35% at a total flow rate of 300 nL/min over 100 min. The components were further subjected to MS and MS/MS analysis twice. MS analysis of the iTRAQ-labeled samples was performed by ESI-Q-TOF MS. The TOF-MS scan range was 350–1250 m/z and the 20 most intense, multiply-charged ions were selected for subsequent MS/MS analysis with a mass range of 100–1250 m/z. Precursor ions were excluded from reselection for 30 s. The analysis was carried out with three technical replications.
Data analysis
Protein identification and quantification were performed using Mascot 2.3.02 (Matrix Science, London, UK) and Scaffold (Proteome Software, Portland, OR, USA) software for iTRAQ quantification. All data were searched against the international Swiss-Prot human database (20111015, human). The parameters for the searches were as follows: quantification: iTRAQ 8plex (Applied Biosystems iTRQA™ 8-plex); enzyme: trypsin; fixed modification: Methylthio (C), iTRAQ8plex (K) and iTRAQ8plex (N-term); variable modifications: oxidation (M) and iTRAQ8plex (Y); peptide tolerance: 25 ppm; fragment tolerance: 0.1 Da; MS/MS tolerance: 0.05 Da; max missed cleavages: 2. In this study, a false discovery rate (FDR) below 1% was used to control protein level identification based on the target-decoy strategy. Proteins with at least one unique peptide with a confidence level above 95% were used for quantitation. Student’s t-tests were used to compare protein expression levels between the B-ALL and control groups, T-ALL and control groups, and T-ALL and B-ALL groups. The mean value of the ratio of each group was used to calculate the fold-change. The relative protein levels were determined based on the ratio of the reporter ions of the peptides as previously described.11 Proteins with a fold-change above 1.2 or below 0.8 with Student’s t-test P-values<0.05 were selected as differently-expressed proteins (DEPs).12 After identification and quantification, the data were exported into an Excel file format for further screening analysis.
Bioinformatics analyses of DEPs
The significant DEPs that differentiated the two groups of samples were further assessed using Ingenuity Pathway Analysis software (IPA) (version 7.1, Ingenuity System Inc., Redwood City, CA, USA; www.ingenuity.com) to statistically determine the biological functions, predominant canonical pathways, and interaction networks associated with these proteins. Significance levels were assessed by Fisher’s exact tests (P<0.05).
ELISA validation
Of these DEPs among healthy control, B-ALL, and T-ALL groups, S100A8, LRG1, SPARC and sL-selectin were chosen for verification of differential expression using ELISA. These proteins were selected on the basis of their significant roles in development, tumorigenesis and cancer progression per published reports.13–16 The DEPs were quantified in the healthy controls (N=24), newly diagnosed B-ALL (N=24) patient, and T-ALL patient (N=24) samples. Human ELISA kits for leucine-rich alpha-2-glycoprotein-1 (LRG1), protein S100-A8 (S100A8), secreted protein acidic and rich in cysteine (SPARC), and serum-soluble L-selectin (sL-selectin) were used. ELISA assays were performed according to the manufacturer’s protocols and samples were run in duplicate. The absorbance of the standards and samples were determined by spectrophotometry at 450 nm using a microplate reader. The results were plotted against the linear portion of a standard curve.
Statistical analysis
The data are presented as means ± standard deviation. Statistical comparisons among the three experimental groups were performed using one-way analysis of variance (ANOVA) and unpaired Student’s t-tests. Statistical analyses were performed using IBM SPSS Statistics for Windows, version 20.0 (Armonk, NY, USA) and two-tailed P-values<0.05 were considered statistically significant.
Results
iTRAQ quantitation of DEPs
In order to explore the potential serum biomarkers of pediatric T-ALL, an iTRAQ-based proteomic method was performed to detect DEPs among three comparative groups (B-ALL: control, T-ALL: control, and T-ALL: B-ALL). After merging data from the three replicates, a total of 534 nonredundant proteins containing at least one peptide were identified. Proteins with relative abundances with greater than 1.2-fold change were defined as significantly changed. Moreover, a total of 534, 534, and 468 proteins were quantified in the B-ALL: control, T-ALL: control, and T-ALL: B-ALL comparisons, respectively. Further analysis identified 81 (up-regulated: 20, down-regulated: 61), 85 (up-regulated: 43, down-regulated: 42), and 38 (up-regulated: 31, down-regulated: 7) DEPs in the B-ALL: control, T-ALL: control, and T-ALL: B-ALL comparisons, respectively (Table 2). Venn diagrams were produced to summarize the distributions and numbers of DEPs (Figure 1 ). Additionally, the details of all DEPs (changes >1.2-fold, <0.8, and P<0.05) among the three different groups are shown in Table 3. That the number of down-regulated proteins was significantly higher than that of up-regulated proteins in the B-ALL: control comparison. In T-ALL: control, the numbers of up-regulated and down-regulated proteins were similar. Among DEPs, B-ALL and T-ALL shared 11 up-regulated and 30 down-regulated proteins. In addition, one protein, apolipoprotein C-II, was up-regulated in B-ALL but was down-regulated in T-ALL, while the expressions of three proteins (hemoglobin subunit beta, ubiquitin-conjugating enzyme E2 variant 2, and calmodulin) were up-regulated in T-ALL but were down-regulated in B-ALL (Table 3). Moreover, 36 and 40 DEPs were specifically involved in B-ALL and T-ALL, respectively. Compared to B-ALL, the most drastically up-regulated proteins in T-ALL were heterogeneous nuclear ribonucleoprotein K (HNRNPK) and sL-selectin, with ratios of 4.45 and 3.81, respectively.
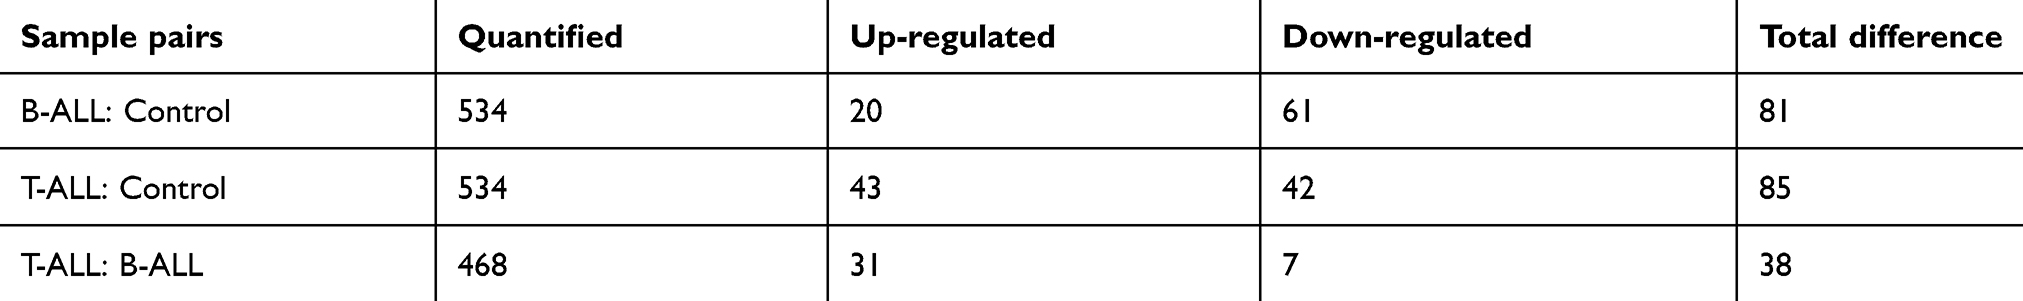 |
Table 2 The quantity of differentially expressed proteins identified in experiments |
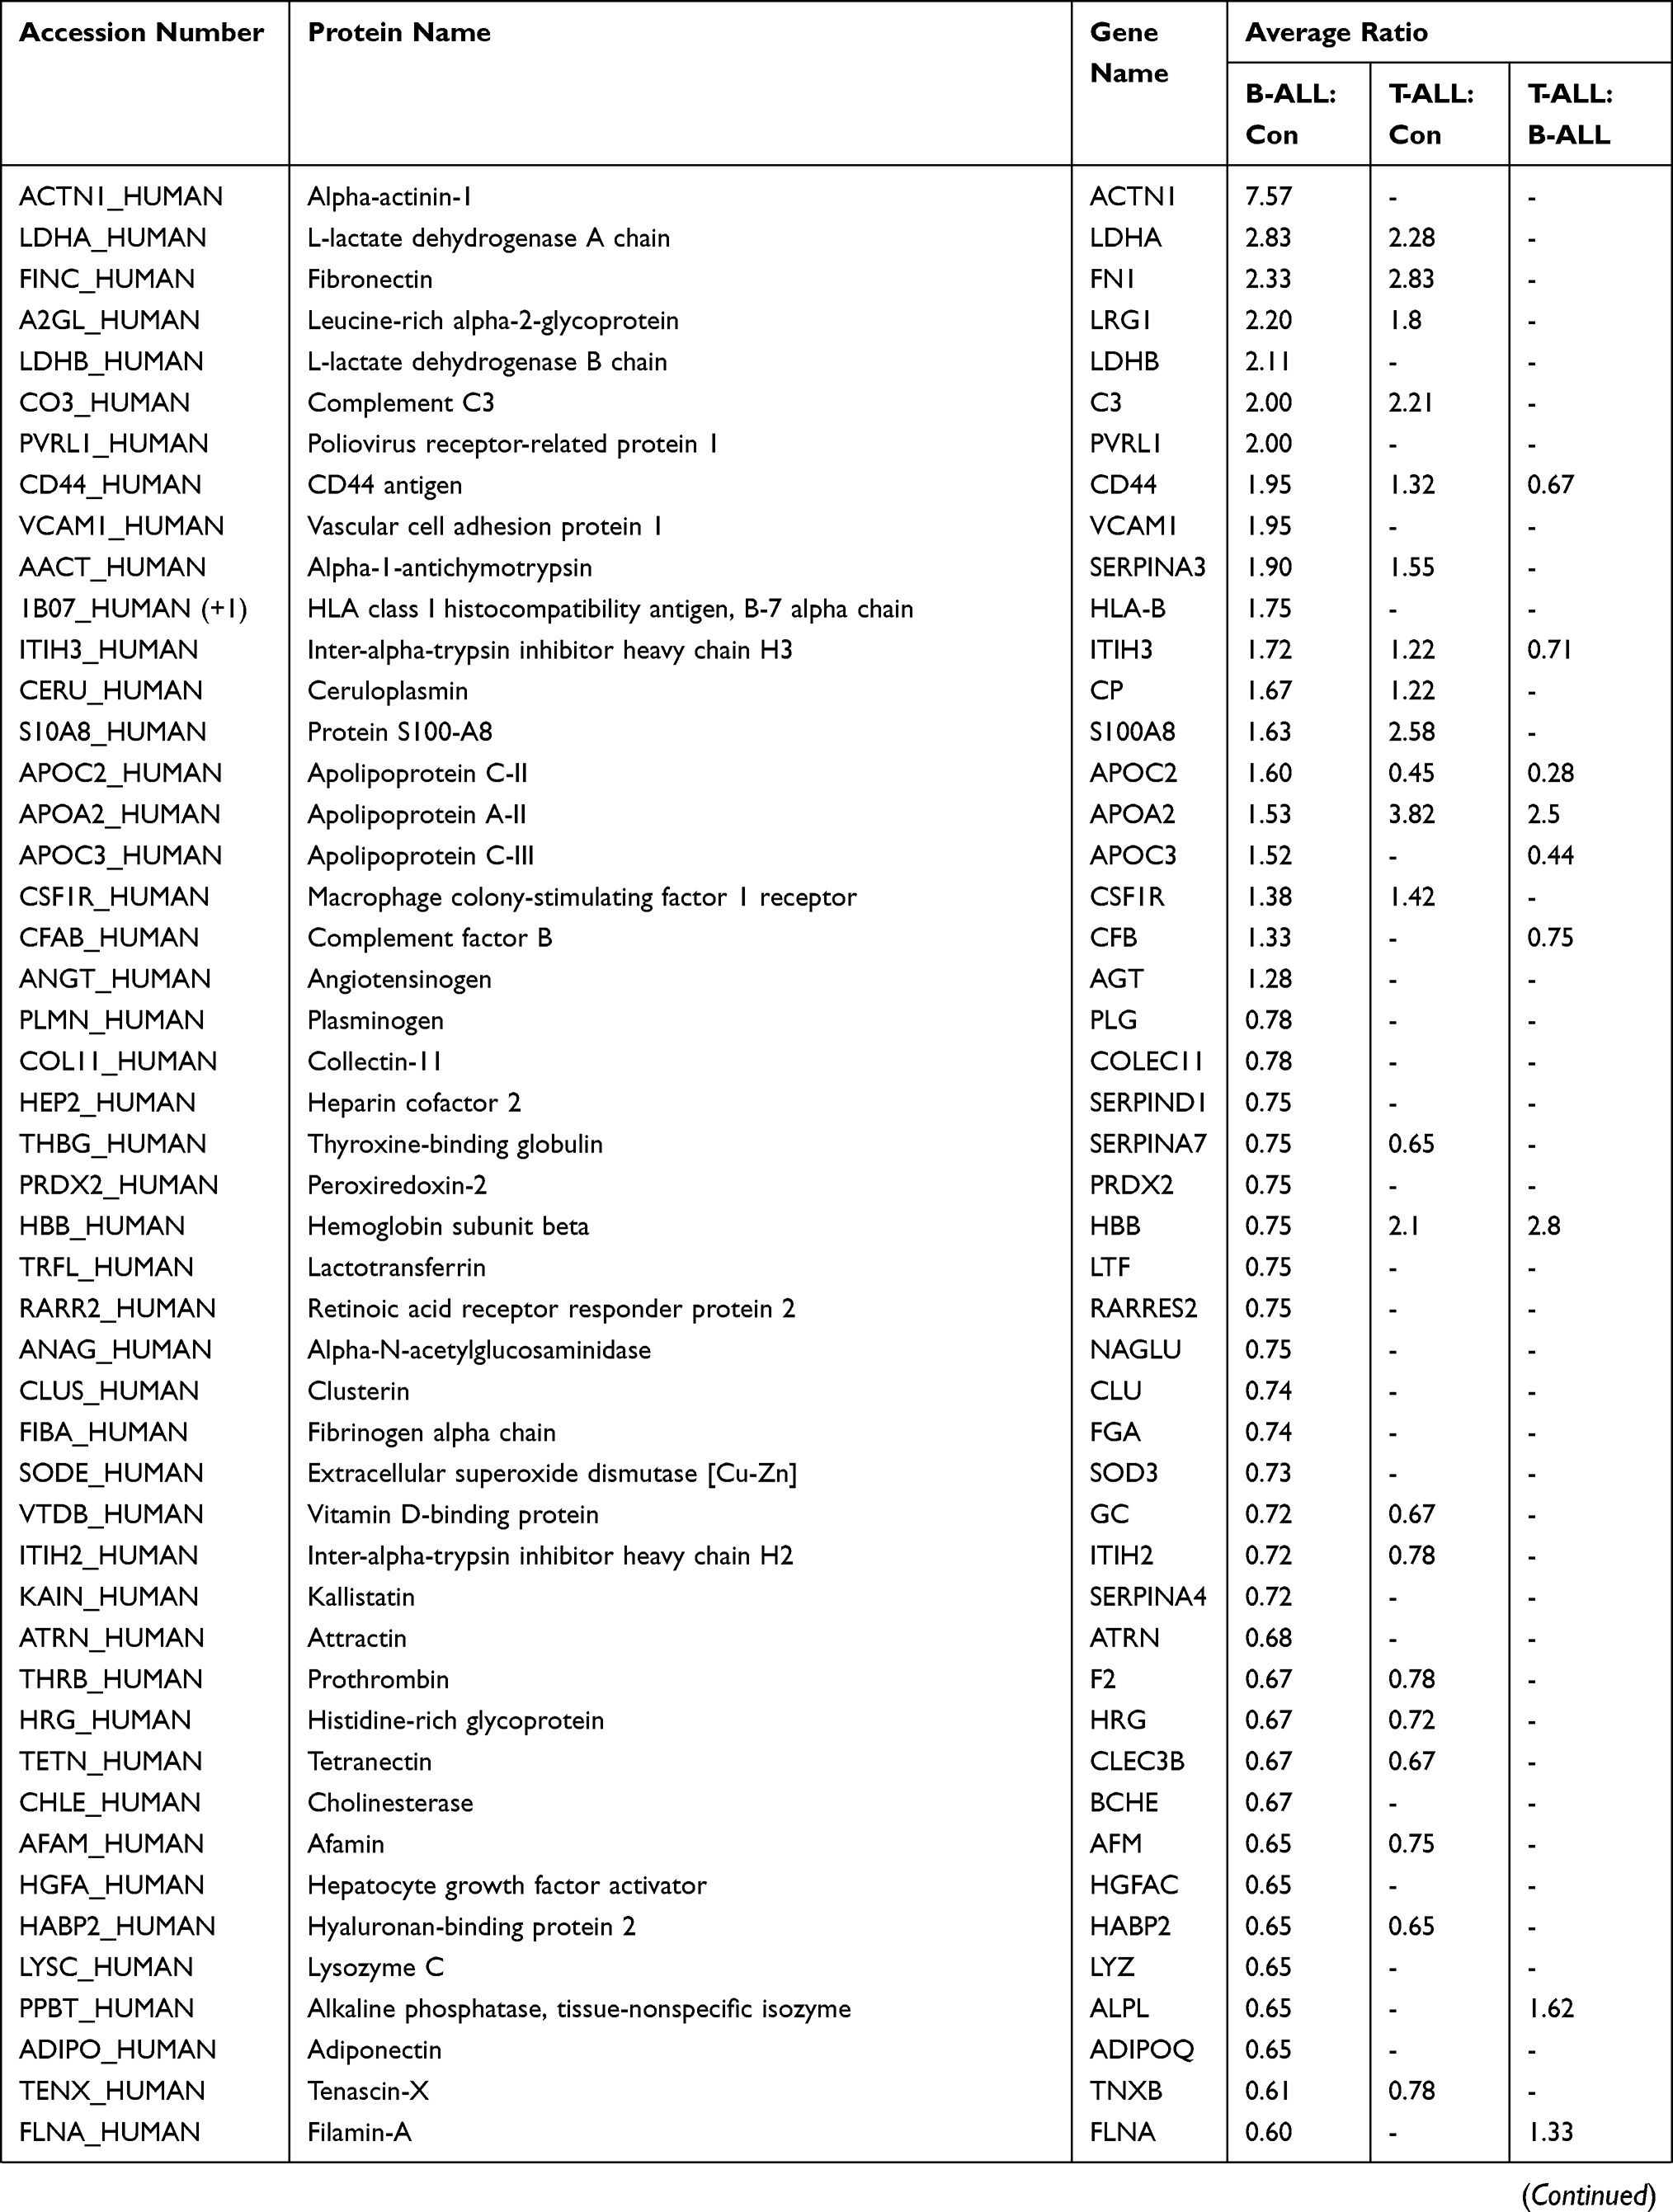 | 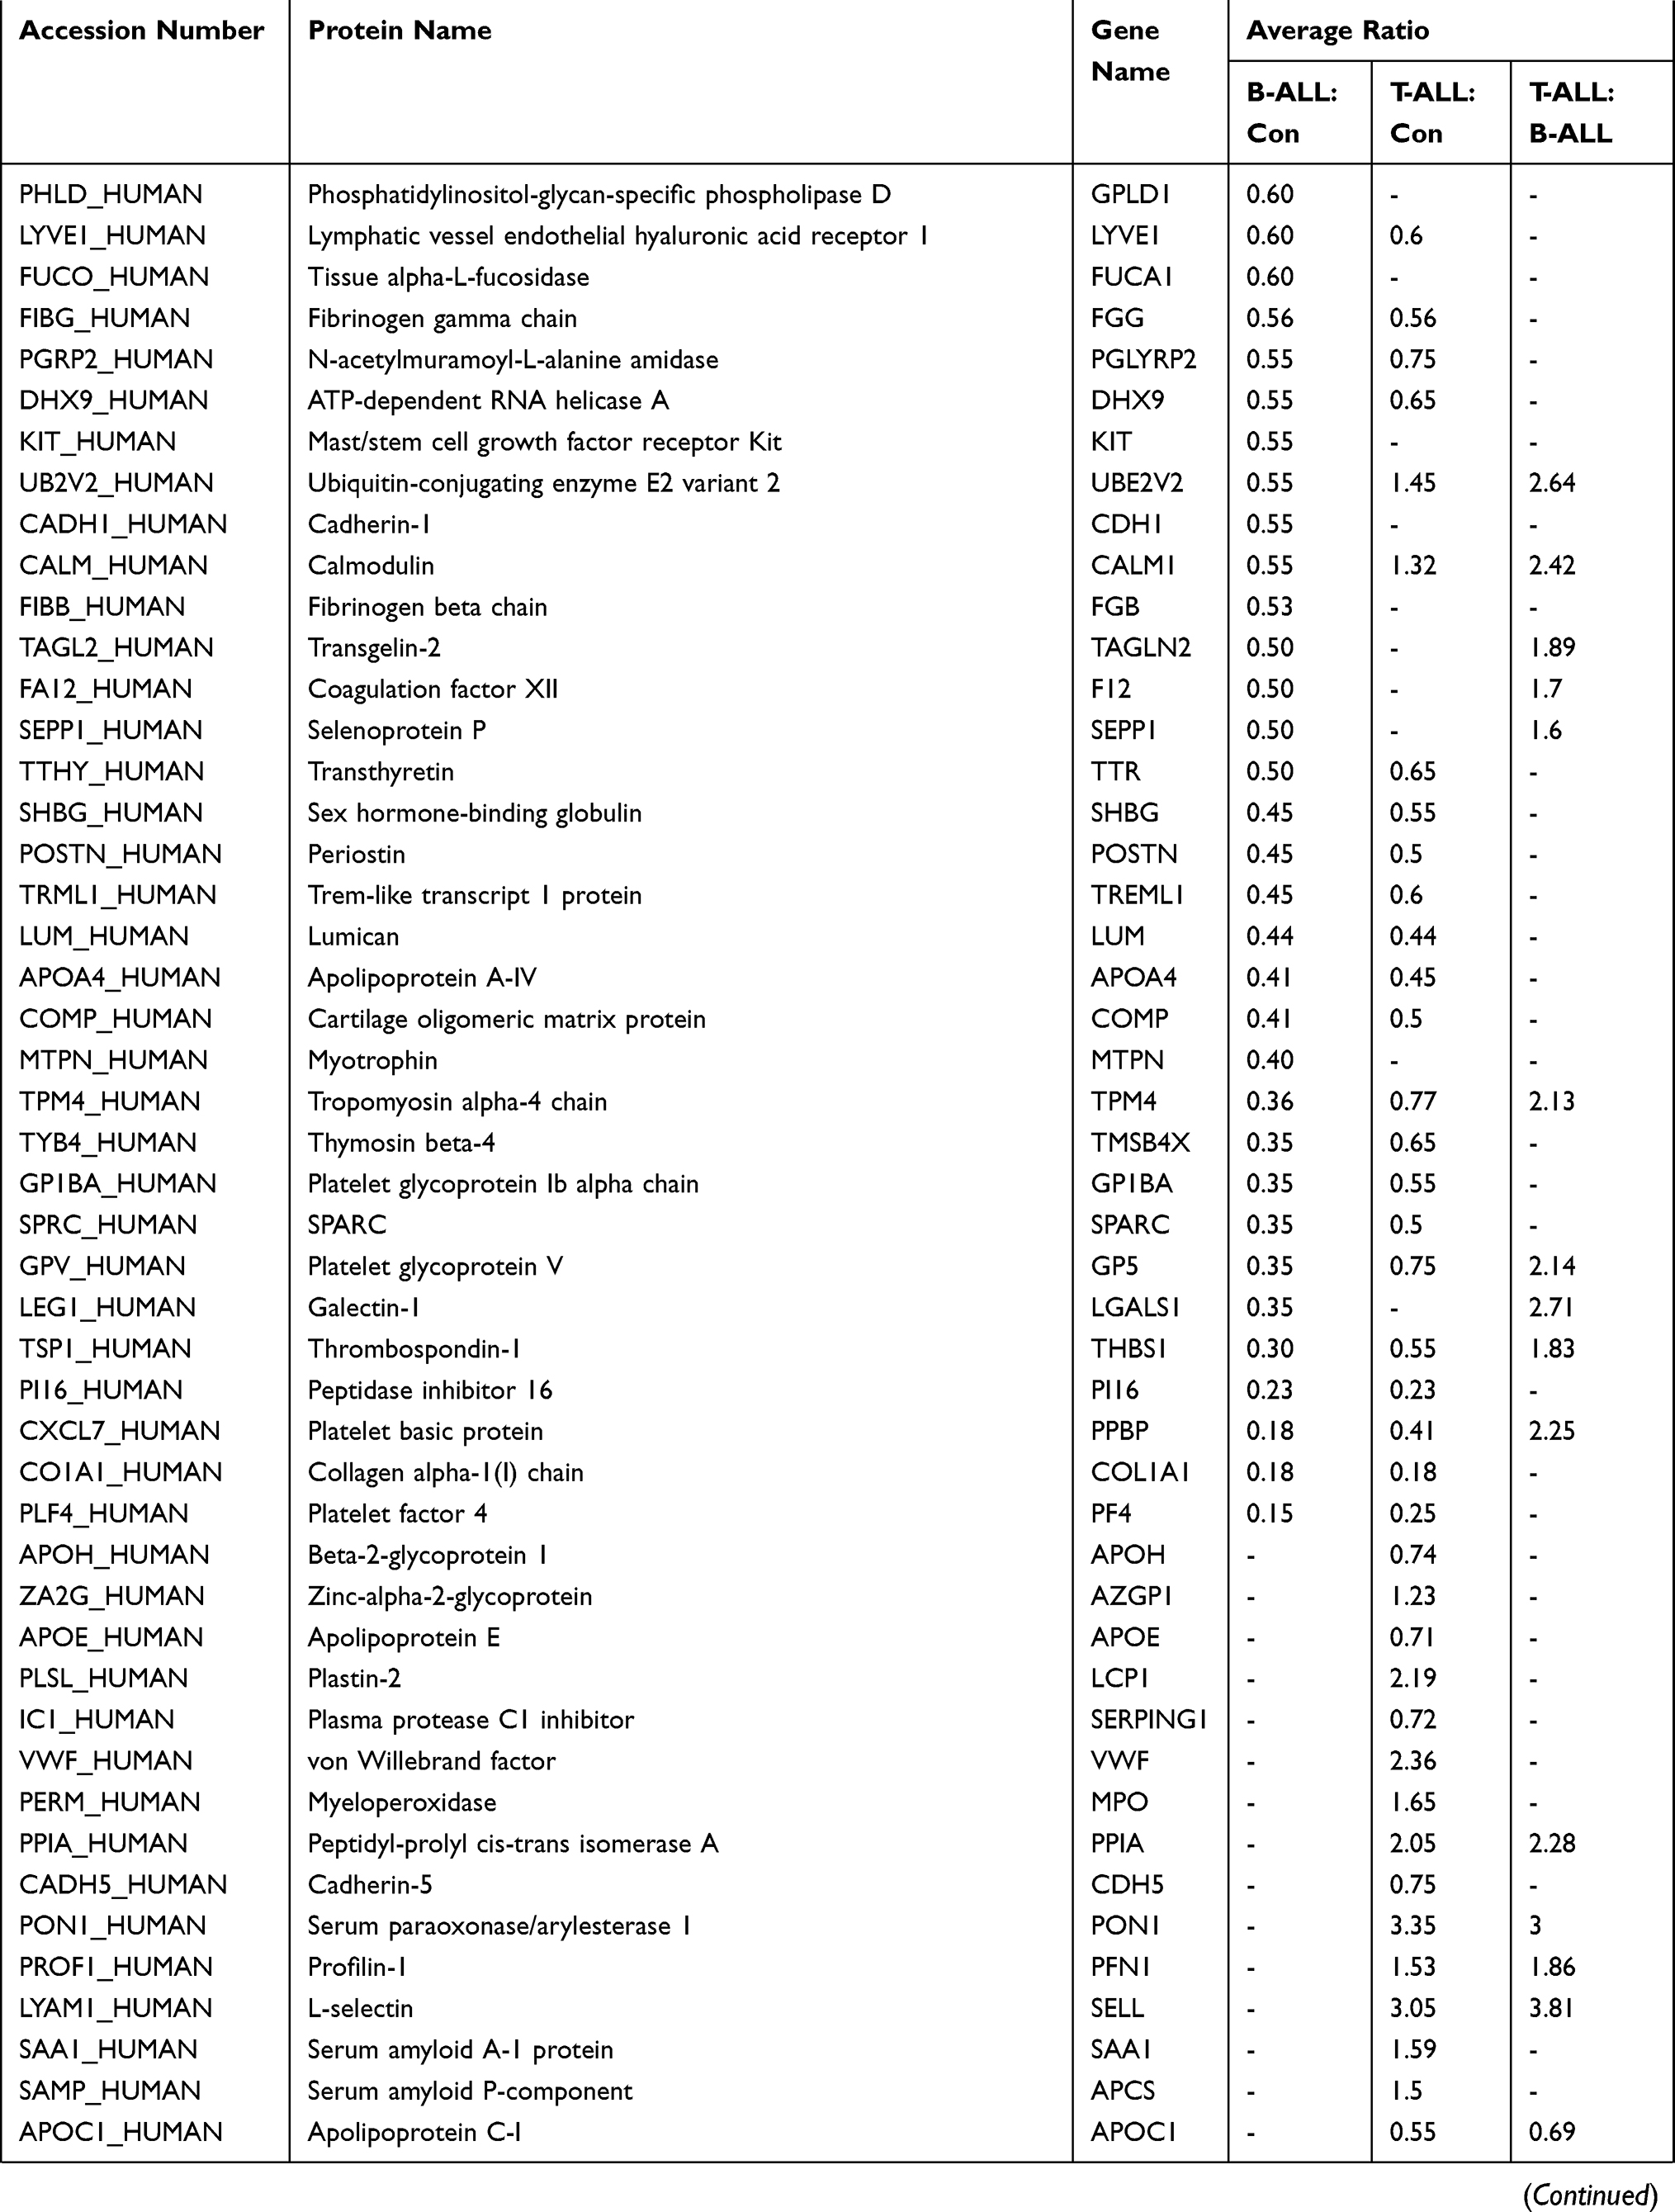 | 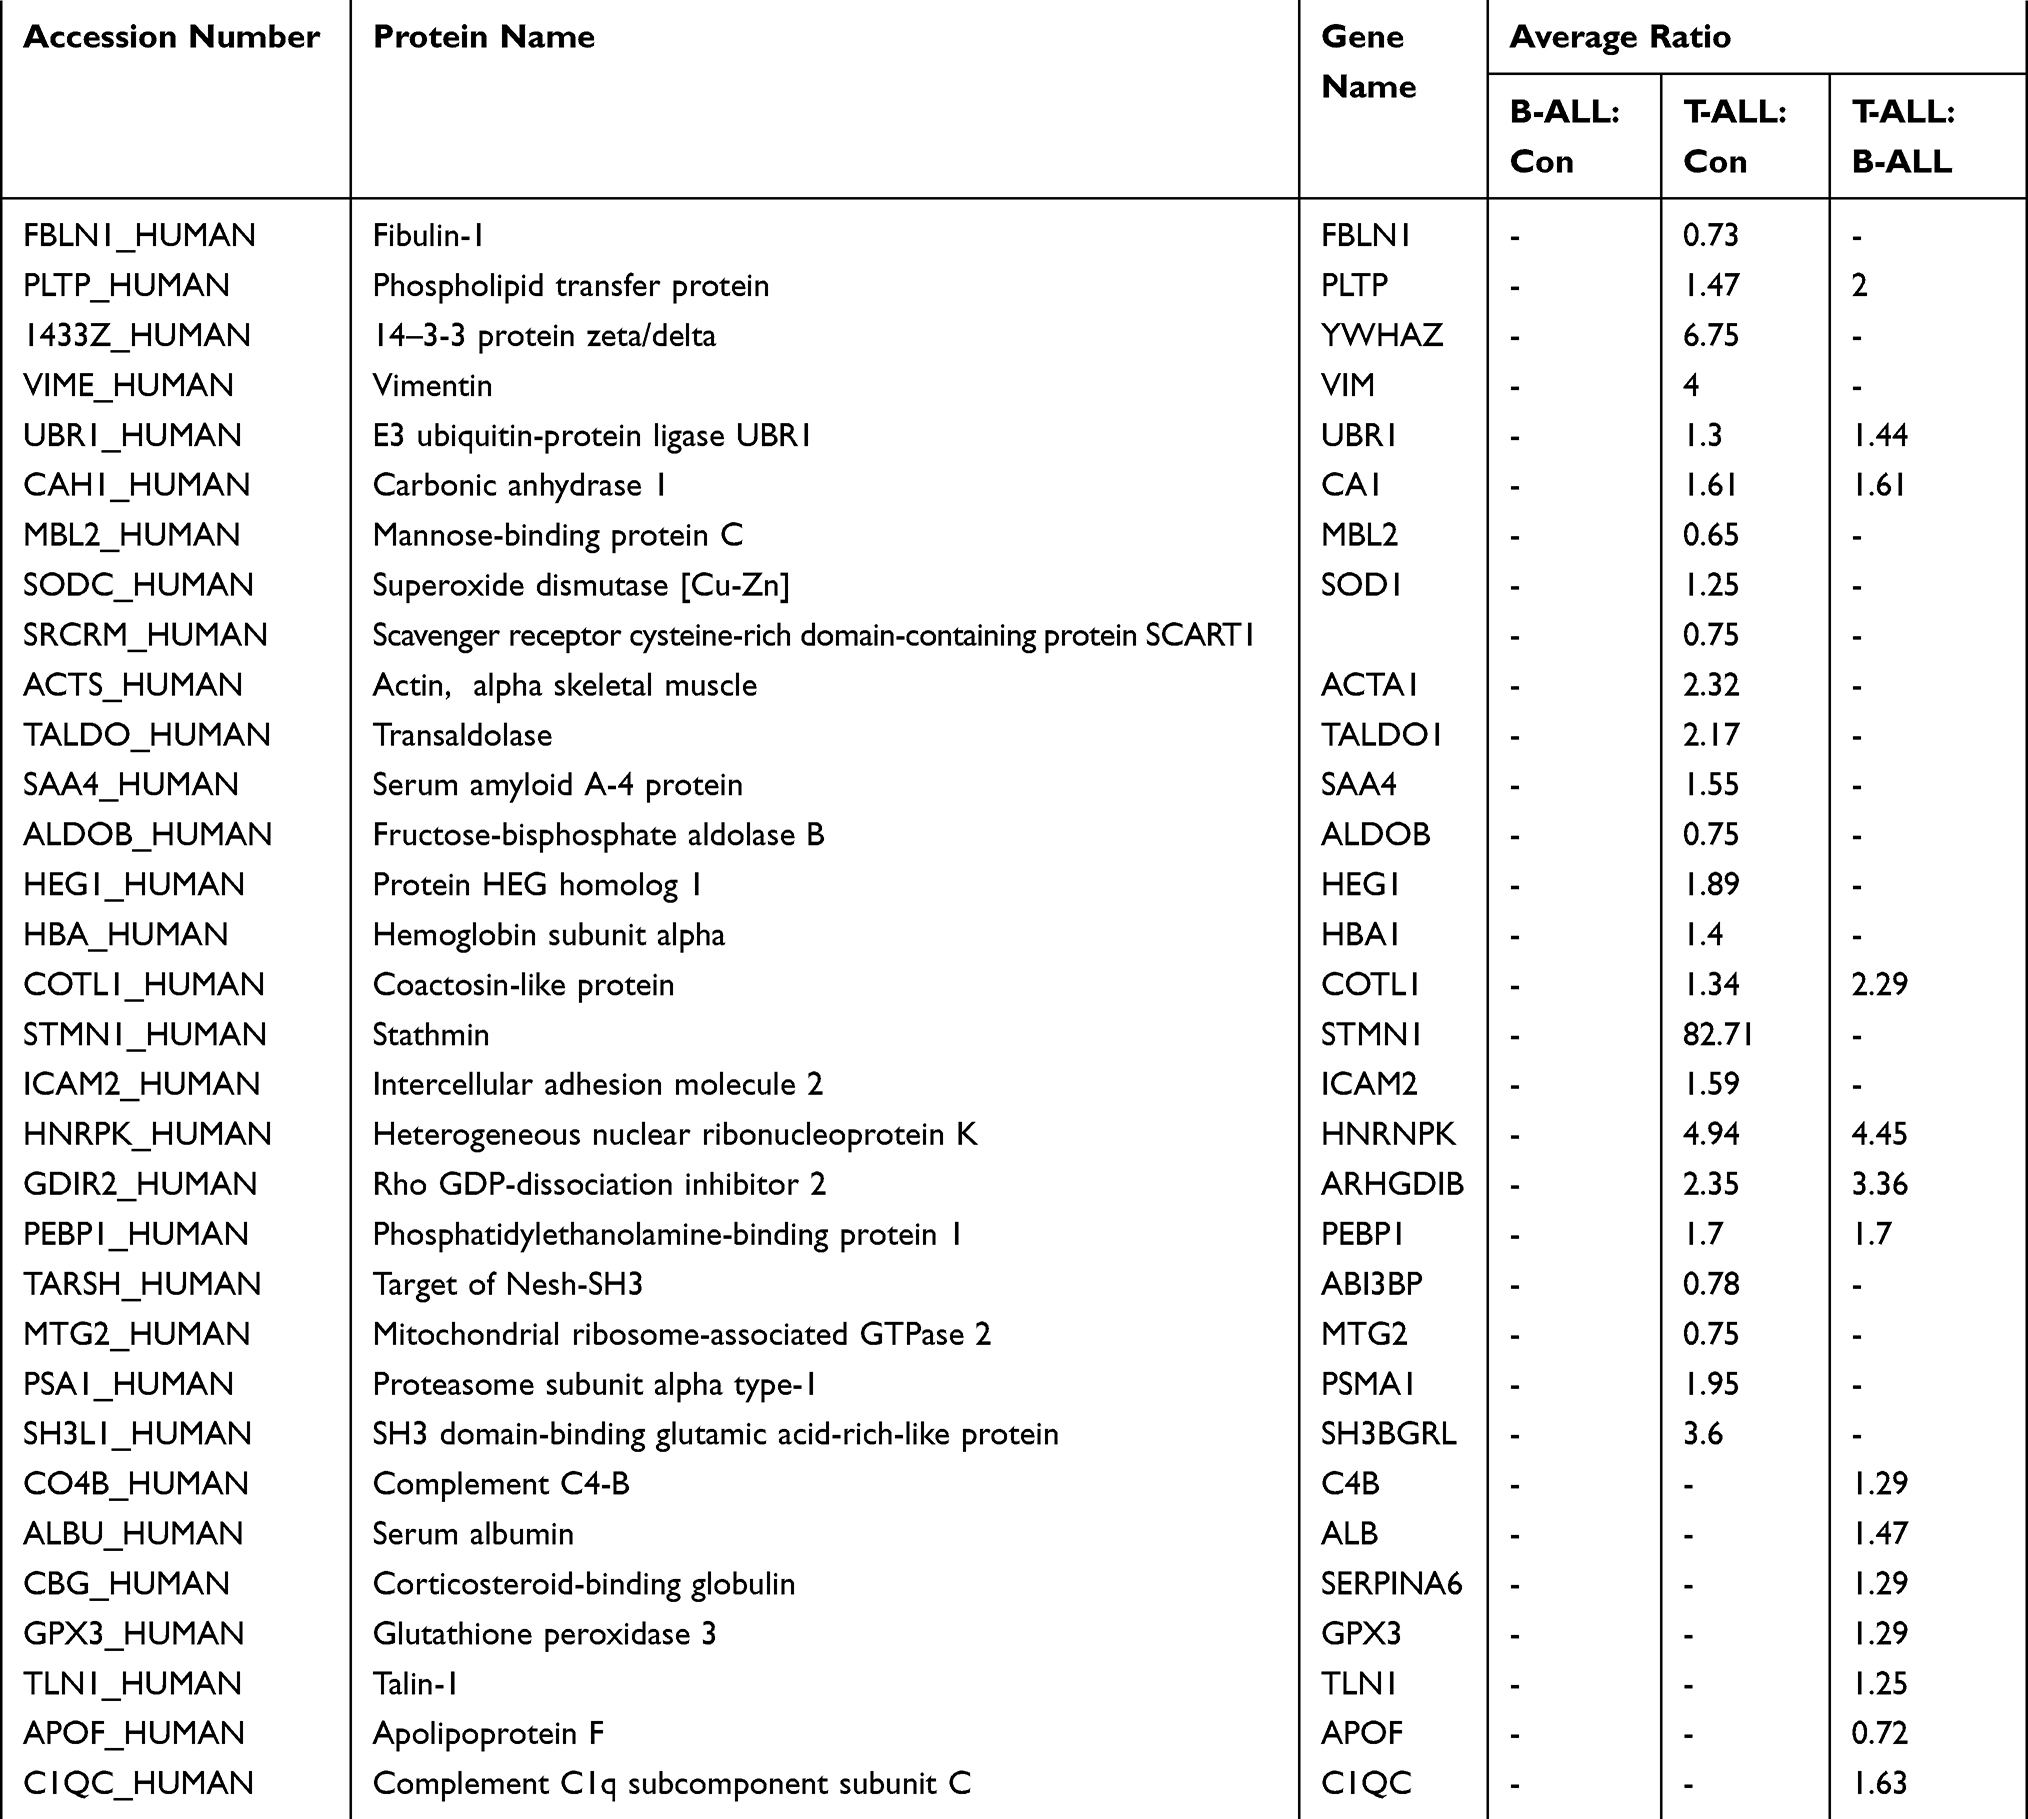 |
Table 3 Significant differentially expressed proteins identified by iTRAQ coupled with 2DLC‑MS/MS |
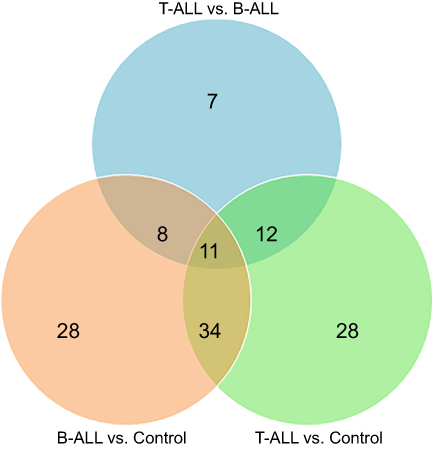 |
Figure 1 Venn diagram representing the serum significantly altered proteins among pediatric B-ALL, T-ALL and Control group. A total of 81,85 and 38 DEPs were identified in B-ALL vs control, T-ALL vs control, and T-ALL vs B-ALL, respectively. |
Bioinformatics analysis of DEPs
To better understand these DEPs, we used IPA. The significant DEPs (shown in Table 2) were imported into the IPA software. The biological functions, canonical pathways, and interacting networks were constructed based on underlying biological evidence from the literature database. Based on the DEPs of B-ALL and T-ALL groups versus the control group, the functional analysis showed that DEPs between T-ALL and control or between B-ALL and control shared similar results, indicating that these DEPs were significantly related to cell-to-cell signaling and interaction, tissue development, cellular movement, immune cell trafficking, cardiovascular disease, and hematological system development and function (Figure 2A and B). As shown in Figure 2C, the five top categories of DEP biological functions between T-ALL and B-ALL were cardiovascular disease, lipid metabolism, molecular transport, small molecule biochemistry, and protein synthesis. IPA canonical pathways analysis identified several pathways, which were ranked in term of the DEP enrichment. Canonical pathways were considered significantly perturbed for P<0.05, which corresponded to –log (P-value)>1.3 by IPA. The top 10 enriched canonical pathways are shown in Figure 3. Many significantly changed signaling pathways were enriched in two sets of comparisons (B-ALL: control and T-ALL: control), including acute phase response signaling, LXR/RXR activation, atherosclerosis signaling, and coagulation system, suggesting that these pathways may be closely related to the development of pediatric ALL. These results indicated that the development of ALL is a complex process regulated by various signaling pathways.
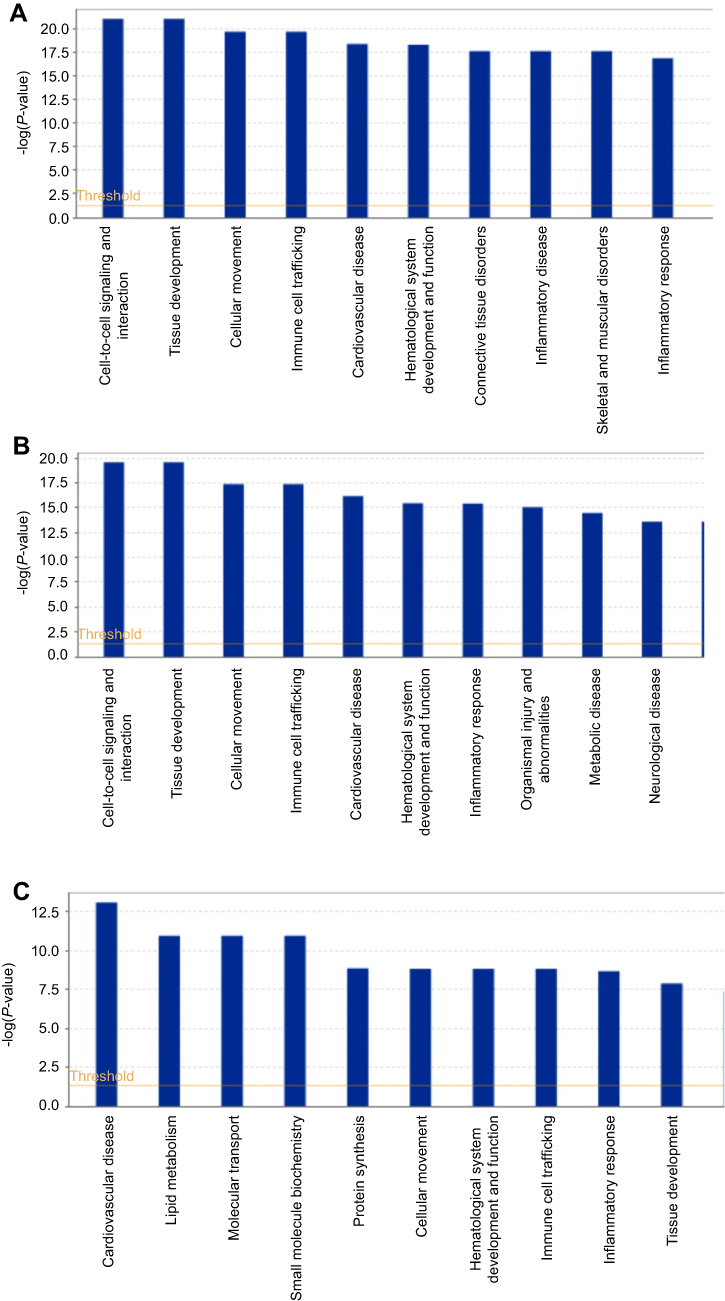 |
Figure 2 The top 10 biological functions of DEPs identified by IPA. (A) B-ALL versus control group (B) T-ALL versus control group (C) T-ALL versus B-ALL group. |
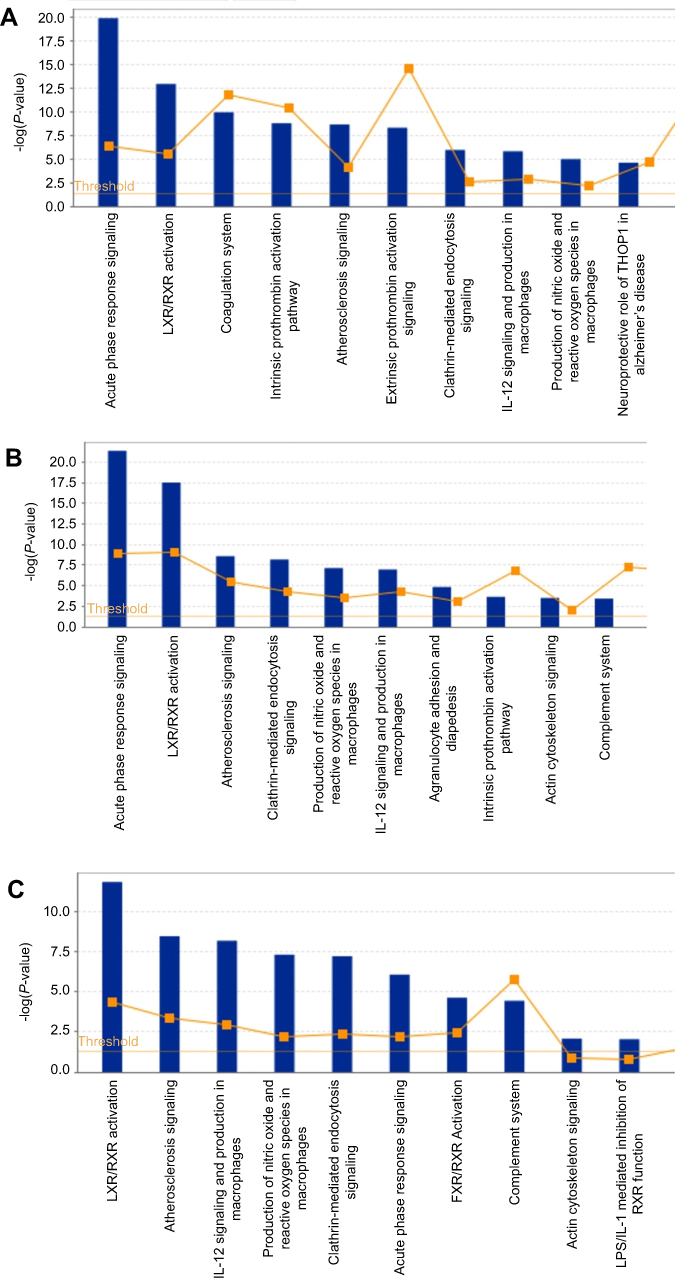 |
Figure 3 The top 10 canonical pathways of DEPs identified by IPA. The threshold line indicates significance threshold.Scores above the orange line are statistically significant (P<0.05). (A) B-ALL versus control group (B) T-ALL versus control group (C) T-ALL versus B-ALL group. |
IPA analysis showed that, compared to the control group, the DEPs in B-ALL were mainly involved in acute phase response signaling, LXR/RXR activation, the coagulation system, the intrinsic prothrombin activation pathway, and atherosclerosis signaling (Figure 3A). In T-ALL, the most representative pathways were acute phase response signaling, LXR/RXR activation, atherosclerosis signaling, clathrin-mediated endocytosis signaling, and production of nitric oxide and reactive oxygen species in macrophages (Figure 3B).
The top five significant canonical pathways in the comparison of T-ALL and B-ALL were LXR/RXR activation, atherosclerosis signaling, IL-12 signaling and production in macrophages, production of nitric oxide and reactive oxygen species in macrophages, and clathrin-mediated endocytosis signaling (Figure 3C).
To better understand these DEPs, the data were further subjected to network analysis to determine how the DEPs were interconnected in the development of pediatric ALL. Hypothetical networks were constructed among the experimental and IPA database proteins. The two top networks obtained in B-ALL compared to the healthy controls were related to 1) cellular movement/hematological system development and function/immune cell trafficking, with a score of 43 and containing 21 target molecules, including seven up-regulated and 14 down-regulated proteins; and 2) hematological system development and function/organismal functions/tissue development, with a score of 35 and a network containing on 19 molecules, including five up-regulated and 14 down-regulated proteins (Figure 4A and B).The two most representative networks in T-ALL compared to the healthy controls were involved in: 1) cell-to-cell signaling and interaction/hematological system development and function/inflammatory response, with a score of 34 and a network of 18 polypeptides, including five upregulated and 13 downregulated proteins; and 2) lipid metabolism/molecular transport/small molecule biochemistry. In this case, the score was 34 and the network comprised 17 molecules, including 10 upregulated and seven downregulated proteins (Figure 4C and D). Finally, the DEPs between T-ALL and B-ALL played roles in 1) lipid metabolism/molecular transport/small molecular biochemistry, with a score of 34 and 15 proteins, including nine upregulated and six downregulated proteins (Figure 4E); and 2) cellular movement/hematological system development and function/immune cell trafficking. This network had a score of 24 and contained 11 polypeptides, including 10 upregulated and one downregulated protein (Figure 4E and F). Overall, these results show that our quantitative proteomics approach is suitable for examining overall molecular profile changes in pediatric T-ALL and provides further insight into potential molecular mechanisms.
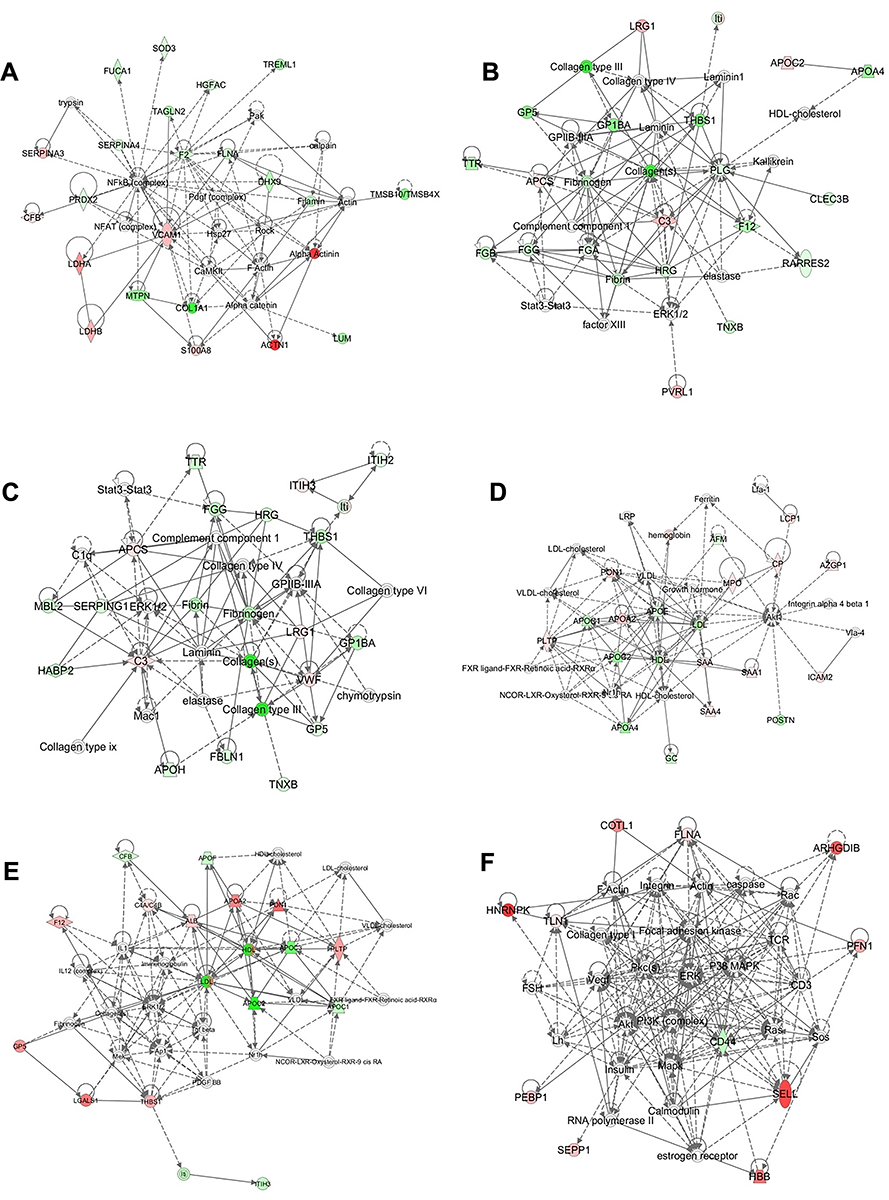 |
Figure 4 Protein-Protein interaction networks of DEPs identified by IPA. There are only shown the two top networks of each core analysis. (A and B):B-ALL:versus control group. (C and D):T-ALL versus control group. (E and F):T-ALL versus B-ALL group. (A) Network A are related with: cellular movement/hematological system development and function/immune cell trafficking; (B) Network B are implicated in: hematological system development and function/organismal functions/tissue development; (C) Network C are involved in: cell-to-cell signaling and interaction/hematological system development and function/inflammatory response; (D) Network D are implicated in: lipid metabolism/molecular transport/small molecule biochemistry; (E) Network E are related with: lipid metabolism/molecular transport/small molecular biochemistry; (F) Network F are involved in: cellular movement/hematological system development and function/immune cell trafficking. Red symbols represent upregulated proteins, while green symbols represent downregulated proteins, and the proteins existed in the network but not identified in our analysis are depicted in white. The color intensity corresponds to the degree of significance. Solid lines indicate direct interactions and dashed lines indicate indirect interactions. |
DEP verification by ELISA
Several iTRAQ-identified DEPs, including sL-selectin/CD62L, S100A8, LRG1, and SPARC were selected for validation by ELISA (Figure 5). The results showed that the expression levels of S100A8 and LRG1 were significantly up-regulated in B- and T-ALL compared to those in the control group, while SPARC was down-regulated. The expression of sL-Selectin was up-regulated in T-ALL compared to that in the B-ALL group. These results were consistent with the protein expression levels observed in the iTRAQ approach, implying the reliability of the proteomics analysis.
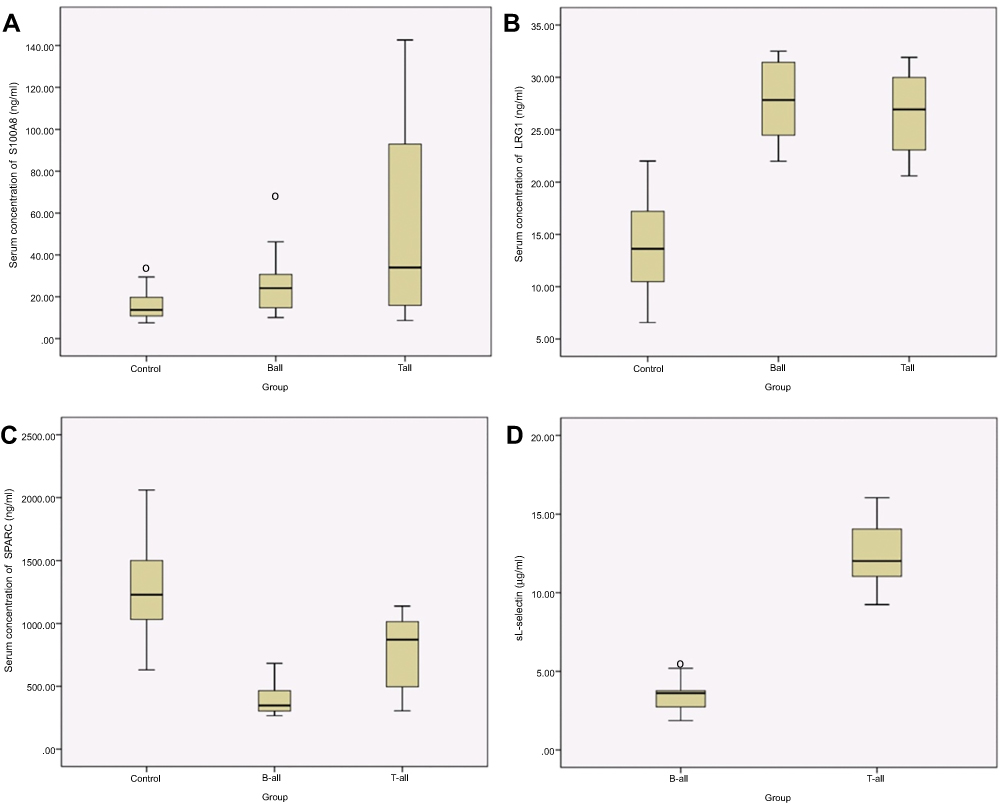 |
Figure 5 ELISA validation of serum proteins levels in different experimental groups. Serum levels of S100A8 (A), LRG1 (B), SPARC (C), and in pediatric B-ALL patients, T-ALL patients and healthy controls; and serum levels of sL-selectin (D) in B-ALL and T-ALL patients. Data are presented as mean±SE. P<0.05, compared with the corresponding controls, respectively. |
Area under the receiver operating characteristic (ROC) curves and DEPs performance
The areas under the curve (AUCs) of the ROC curves were calculated as a measure of the discriminative power. We further generated the ROC curves of the DEPs confirmed by ELISA. Our results showed unsatisfactory ROC curves of sL-selectin, LRG1, and SPARC (data not shown), which may be attributed to the limited sample size. However, the test for S100A8 was informative (Figure 6), with an AUC of 0.792 (95% confidence interval [CI]: 0.683–0.902). The AUCs, which quantify the overall ability to discriminate ALL from the control, were significantly greater than 0.5, suggesting the usefulness of S100A8 markers for the stratification and diagnosis of ALL. A cutoff of 20.81 ng/mL for S100A8 showed good performance for ALL, with a sensitivity of 65.91% and specificity of 86.36%. However, these results require validation in a larger patient cohort.
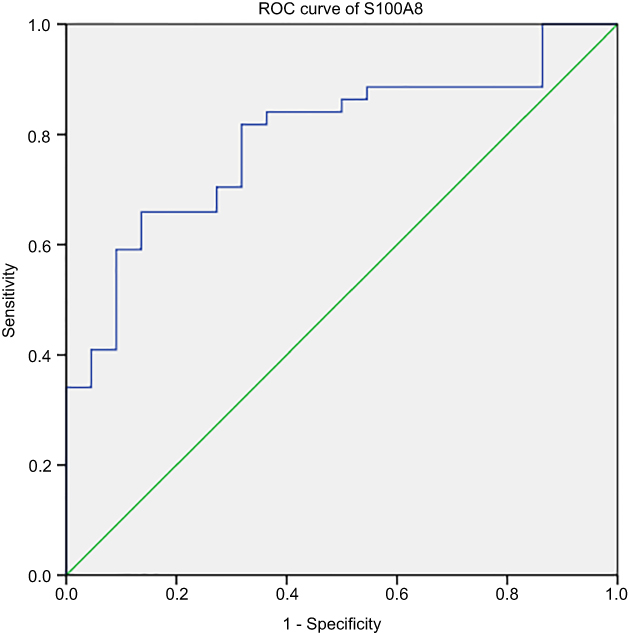 |
Figure 6 Area under the ROC curve of S100A8 for pediatric ALL. |
Discussion
T-ALL is an aggressive hematologic malignancy arising from early T-cell progenitors that accounts for approximately 15% of childhood ALL.13,14 Despite significant improvements in intensive combination chemotherapy and hematopoietic stem cell transplantation in recent decades, pediatric T-ALL patients show a dismal outcome compared to that in patients with B-ALL, with 25–30% of cases not able to achieve complete remission and, thus, experiencing relapse.15,16 Moreover, childhood T-ALL survivors are at an increased risk of developing long-term adverse health outcomes, including secondary malignancies due to the use of genotoxic drugs.21 In contrast to B-ALL, the prognostic relevance of blast karyotype has not been well established for pediatric T-ALL and has limited impact on treatment approaches.6,7 Thus, the systematic investigation of the mechanisms of pediatric T-ALL and identification of prognostic biomarkers of pediatric T-ALL will be helpful for clinical diagnosis and therapy.
Proteome analysis can provide valuable information on multiple proteins involved in oncogenesis and cancer progression and identify additional diagnostic and prognostic biomarkers.22 To our knowledge, this is the first study to apply serum proteomic analyses with iTRAQ-2D LC-MS/MS to identify serum proteins that were differentially expressed between pediatric T-ALL and B-ALL patients. In the present study, the identified DEPs in the two types of pediatric ALL differed significantly, with 36 and 40 DEPs specifically linked to B-ALL and T-ALL compared to those in the control group, respectively. Furthermore, we detected 38 DEPs in the T-ALL: B-ALL comparison. The proteomic profiles indicated that there were biological differences between T-ALL and B-ALL, which were further confirmed by bioinformatics analyses. Finally, four proteins, S100A8, LRG1, SPARC, and sL-selectin, were validated by ELISA.
Using the IPA software, we determined that the biological functions of the DEPs in the T-ALL: B-ALL comparison were all related to essential tumorigenesis processes, including lipid metabolism, molecular transport, small molecule biochemistry, and protein synthesis. Malignant cells appear to metabolize lipids differently from normal mature cells, and lipids can exert significant immunoregulatory effects. In addition, lipid metabolism also affects tumor progression.17 Apolipoprotein A2 (APOA2) is preferentially expressed and is a prognostic indicator in prostate cancer, hepatocellular carcinoma, and breast cancer and many reports suggest a relationship between leukemia susceptibility and proteins involved in lipid metabolism, including APOA2.18,19 In our study, APOA2 was also significantly up-regulated in T-ALL compared to the level in B-ALL sera, suggesting that lipid metabolism may be disordered in T-ALL patients. APOA2 appears to play a role in leukemogenesis in T-ALL; however, the pathophysiological mechanisms resulting in serum lipid alterations in ALL have not been fully elucidated. Further studies are still needed to clarify the role of APOA2 in ALL.
The IPA showed that multiple pathways were involved in B-ALL and T-ALL compared to the unaffected control, with the most prominently affected pathways being the acute phase response signaling and LXR/RXR activation pathway. The top pathways included Liver X Receptors/Retinoid X Receptors (LXR/RXR) activation in T-ALL: B-ALL, which functions in cholesterol transport, lipid and glucose metabolism, and the modulation of inflammatory responses, which are essential biological processes for tumor development.20 In T-ALL patients, DEPs may promote leukemogenesis by taking part in these signaling pathways directly or indirectly. Deregulation of lipid metabolism has increasingly been recognized as a feature of cancer cells.21 There is now accumulating evidence to support the involvement of LXRs in a variety of malignancies.31 A recent study has demonstrated that cholesterol homeostasis can be normalized by treatment with LXR agonists which can trigger apoptosis in blastic plasmacytoid dendritic cell neoplasm.22
The most interesting finding of this study is that four DEPs, namely S100A8, LRG1, SPARC and sL-Selectin, identified through our serum comparative proteomics and validation approach can be considered candidate biomarker proteins for pediatric T-ALL. It is important to note that S100A8 and LRG1 were up-regulated, while SPARC were down-regulated in B- and T-ALL vs control. In addition, the most promising biomarkers to differentiate T-ALL from B-ALL was sL-selectin, which showed significantly higher in T-ALL than B-ALL. Expression profiles of these proteins and assessment of their changes will provide useful information for the diagnosis of pediatric T-ALL.
S100A8, usually forming a heterodimer S100A8/A9 with S100A9, is highly expressed in neutrophils and plays important roles in multiple stages of tumor cell proliferation, migration, invasion, and apoptosis.23 Recent clinical and experimental data have indicated that S100A8 is up-regulated in various human cancers, such as lung, gastric, breast, prostatic, colon, skin, and ovarian cancer, and is closely associated with cancer development, progression, invasion, metastasis, and prognosis.24–26 In hematological malignancies, S100A8 and S100A9 are highly expressed in acute myeloid leukemia (AML) and S100A8 expression has been linked to poor prognosis in de novo AML.27 Spijkers-Hagelstein et al reported that elevated S100A8/S100A9 expression causes glucocorticoid resistance in MLL-rearranged infant ALL.28 Similarly, our study showed that S100A8 is involved in the development of chemoresistance in leukemia cells by regulating autophagy.29 In addition, mesenchymal S100A8/S100A9 predicts leukemic evolution and disease outcome in human MDS.30 However, a recent study indicated that S100A8 and S100A9 were regulators of myeloid differentiation in leukemia and have therapeutic potential in myelomonocytic and monocytic AMLs.31 S100A8 may be used as a typical or atypical marker to diagnose diseases or predict disease progression.
LRG1 is involved in cell adhesion and development, protein-protein interaction, and signal transduction. Recent evidence has suggested that LRG1 may promote disorganized pathological rather than developmental/physiological angiogenesis by modulating endothelial TGF-β signaling.32 LRG1 may also be a biomarker for various types of cancer, including colorectal, lung and breast cancers.3–43 In leukemia research, a previous study suggested that serum LRG1 was upregulated in B-ALL, consistent with our findings.34 In our study, upregulated serum LRG1 was also observed in T-ALL. Our results suggested that LRG1 may be a potentially promising biomarker and therapeutic target in ALL.
SPARC is a multi-faceted matricellular protein secreted by many types of cancer and tumor-associated stromal cells and is believed to regulate tumor cell growth and metastasis.35 However, SPARC is differentially expressed in various tumors and its patterns of expression vary depending on the cancer type. In certain types of cancers, such as breast, lung and pancreatic cancers, higher levels of SPARC expression are associated with highly aggressive tumor phenotypes.36–50 In contrast, SPARC is downregulated in ovarian, neuroblastomas, and colorectal cancers and shows an anti-tumor role in anti-angiogenesis, anti-adipogenesis, pro-apoptosis, and inhibition of cell proliferation.37,38 In the field of hematopoietic research, SPARC is part of the commonly deleted region of the 5q myelodysplastic syndrome and is deregulated in other hematologic malignancies.39,40 In leukemic contexts, SPARC may exert opposing effects depending on the leukemia type.41 Indeed, high SPARC expression is associated with adverse outcomes in cytogenetically normal acute myeloid leukemia (AML).42 Similarly, divergent roles for SPARC have been proposed in lymphoid malignancies, where the absence of stromal SPARC predicts a poor prognosis in diffuse large B-cell lymphoma, while its leukemia-specific upregulation is a recurrent event in relapsed pediatric B-ALL.43,58 In our study, serum SPARC expression at diagnosis was down-regulated in pediatric T- and B-ALL. A previous study also showed that SPARC deficiency promoted CD5 (+) B–cell lymphomagenesis and was correlated with chronic lymphocytic leukemia (CLL) in humans44 A recent study demonstrated a significant down-regulation of SPARC in T-cell non-Hodgkin lymphoma (T-NHL) samples and cell lines owing to DNA methylation, while low SPARC levels were associated with a poor prognosis in T-NHL patients. Furthermore, SPARC functions as a tumor suppressor gene in T-NHL.45 In chronic myelogenous leukemia (CML) cells, endogenous SPARC levels are reduced but imatinib mesylate treatment induced increased production of exogenous SPARC by normal cells. This exogenous SPARC may inhibit CML cell proliferation and synergize with tyrosine kinase inhibitors (TKIs) by inhibiting cell cycle progression from G1 to S phase.46 A recent study suggested that the loss of SPARC protects hematopoietic stem cells from the toxic effects of serial 5-FU chemotherapy treatment.47
L-selectin or CD62L, a cell adhesion molecule with a primary function of directing leukocyte migration and lymphocyte homing to lymph nodes, is expressed on most normal leukocytes and is also detectable on blast cells in ALL and AML.48,49 Monitoring of sL-selectin concentration may be useful for evaluating leukemia activity in ALL patients as its concentration likely reflects the total mass of leukemic cells and its synthesis may be upregulated by blast cells.50 In acute leukemia, the plasma sL-selectin concentration is elevated but lower in patients with CR, with increased levels observed during leukemia relapse.50,51 High plasma sL-selectin levels were detectable in patients with AML and correlated with disease activity and poor prognosis. Patients with extramedullary disease had higher levels of sL-selectin than those in patients without extramedullary disease.51 A recent clinical study demonstrated that high expression of CD62L in T cells and low sCD62L plasma levels at diagnosis were strong markers predicting deep molecular response to TKI therapy in early chronic-phase CML.52 Another study also suggested that sL-selectin in cerebrospinal fluid is a good diagnostic tool for the detection of central nervous system involvement in children with ALL.53 In our study, sL-selectin expression was markedly higher in pediatric T-ALL than that in B-ALL, which may be related to earlier central nervous system infiltration.
Since serological ELISAs are relatively simple, inexpensive, and minimally invasive to perform in children, serum S100A8, LRG1, SPARC, and sL-selectin may comprise a potential biomarker panel for distinguishing pediatric T-ALL from B-ALL. Furthermore, sL-selectin level might be a powerful indicator of leukemia activity in T-ALL and useful for early diagnosis of relapse or meningeal infiltration in T-ALL. As this was a single-center study and the sample size was relatively small, further validation using a larger series of children with ALL is needed. Additional studies are also necessary to define the potential role of sL-selectin in the risk stratification of T-ALL.
Conclusion
In summary, iTRAQ-based two-dimensional LC-MS/MS serum profiling led to the identification of several DEPs in ALL. The potential biomarkers for early diagnosis of childhood T-ALL or B-ALL included serum S100A8, LRG1, SPARC, and sL-selectin. These potential biomarkers may improve the pre-diagnosis of T-ALL or B-ALL, which are currently difficult to diagnose in early stages. Compared to that in B-ALL, sL-selectin was present at a higher level in T-ALL and may, therefore, be a sensitive and specific biomarker for the diagnosis and prognosis of T-ALL and may also be a potential therapeutic target. Further clinical studies using a larger cohort are necessary to determine whether serums levels of S100A8, LRG1, SPARC, and sL-selectin are associated with the development of acute symptoms or survival in patients with ALL.
Acknowledgments
The authors would like to thank the personnel at the Research Center for Proteome Analysis, Institutes of Biomedical Sciences, Fudan University for excellent technical assistance. This work was supported by the Natural Science Foundation of Henan Province, China (No. 162300410265).
Disclosure
The authors report no conflicts of interest in this work.
References
1. Inaba H, Greaves M, Mullighan CG. Acute lymphoblastic leukaemia. Lancet. 2013;381(9881):1943–1955. doi:10.1016/S0140-6736(12)62187-4
2. Siegel RL, Miller KD, Jemal A. Cancer statistics, 2018. CA Cancer J Clin. 2018;68(1):7–30. doi:10.3322/caac.21442
3. Pui CH, Yang JJ, Bhakta N, Rodriguez-Galindo C. Global efforts toward the cure of childhood acute lymphoblastic leukaemia. Lancet Child Adolesc Health. 2018;2(6):440–454. doi:10.1016/S2352-4642(18)30066-X
4. Pui CH, Ip SH, Dodge RK, et al. Serum levels of CD8 antigen in childhood lymphoid malignancies: a possible indicator of increased suppressor cell activity in poor-risk patients. Blood. 1988;72(3):1015–1021.
5. Pui CH, Ip SH, Iflah S, et al. Serum interleukin 2 receptor levels in childhood acute lymphoblastic leukemia. Blood. 1988;71(4):1135–1137.
6. Belver L, Ferrando A. The genetics and mechanisms of T cell acute lymphoblastic leukaemia. Nat Rev Cancer. 2016;16(8):494–507. doi:10.1038/nrc.2016.63
7. Girardi T, Vicente C, Cools J, De Keersmaecker K. The genetics and molecular biology of T-ALL. Blood. 2017;129(9):1113–1123. doi:10.1182/blood-2016-10-706465
8. Cravatt BF, Simon GM, Yates JR
9. Wu WW, Wang G, Baek SJ, Shen RF. Comparative study of three proteomic quantitative methods, DIGE, cICAT, and iTRAQ, using 2D gel- or LC-MALDI TOF/TOF. J Proteome Res. 2006;5(3):651–658. doi:10.1021/pr050405o
10. Bennett JM, Catovsky D, Daniel MT, et al. Proposals for the classification of the acute leukaemias. French-American-British (FAB) co-operative group. Br J Haematol. 1976;33(4):451–458.
11. Gan CS, Chong PK, Pham TK, Wright PC. Technical, experimental, and biological variations in isobaric tags for relative and absolute quantitation (iTRAQ). J Proteome Res. 2007;6(2):821–827. doi:10.1021/pr060474i
12. Ren Y, Hao P, Dutta B, et al. Hypoxia modulates A431 cellular pathways association to tumor radioresistance and enhanced migration revealed by comprehensive proteomic and functional studies. Mol Cell Proteomics. 2013;12(2):485–498. doi:10.1074/mcp.M112.018325
13. Dores GM, Devesa SS, Curtis RE, Linet MS, Morton LM. Acute leukemia incidence and patient survival among children and adults in the United States, 2001–2007. Blood. 2012;119(1):34–43. doi:10.1182/blood-2011-04-347872
14. Hunger SP, Mullighan CG. Acute lymphoblastic leukemia in children. N Engl J Med. 2015;373(16):1541–1552. doi:10.1056/NEJMra1400972
15. Richter-Pechanska P, Kunz JB, Hof J, et al. Identification of a genetically defined ultra-high-risk group in relapsed pediatric T-lymphoblastic leukemia. Blood Cancer J. 2017;7(2):e523. doi:10.1038/bcj.2017.3
16. Vadillo E, Dorantes-Acosta E, Pelayo R, Schnoor M. T cell acute lymphoblastic leukemia (T-ALL): new insights into the cellular origins and infiltration mechanisms common and unique among hematologic malignancies. Blood Rev. 2018;32(1):36–51. doi:10.1016/j.blre.2017.08.006
17. Tosi MR, Tugnoli V. Cholesteryl esters in malignancy. Clin Chim Acta. 2005;359(1–2):27–45. doi:10.1016/j.cccn.2005.04.003
18. Moschovi M, Trimis G, Apostolakou F, Papassotiriou I, Tzortzatou-Stathopoulou F. Serum lipid alterations in acute lymphoblastic leukemia of childhood. J Pediatr Hematol Oncol. 2004;26(5):289–293.
19. Pallasch CP, Schwamb J, Konigs S, et al. Targeting lipid metabolism by the lipoprotein lipase inhibitor orlistat results in apoptosis of B-cell chronic lymphocytic leukemia cells. Leukemia. 2008;22(3):585–592. doi:10.1038/sj.leu.2405058
20. Altucci L, Leibowitz MD, Ogilvie KM, de Lera AR, Gronemeyer H. RAR and RXR modulation in cancer and metabolic disease. Nat Rev Drug Discov. 2007;6(10):793–810. doi:10.1038/nrd2397
21. Ray U, Roy SS. Aberrant lipid metabolism in cancer cells - the role of oncolipid-activated signaling. Febs J. 2018;285(3):432–443. doi:10.1111/febs.14281
22. Ceroi A, Masson D, Roggy A, et al. LXR agonist treatment of blastic plasmacytoid dendritic cell neoplasm restores cholesterol efflux and triggers apoptosis. Blood. 2016;128(23):2694–2707. doi:10.1182/blood-2016-06-724807
23. Shabani F, Farasat A, Mahdavi M, Gheibi N. Calprotectin (S100A8/S100A9): a key protein between inflammation and cancer. Inflamm Res. 2018;67(10):801–812. doi:10.1007/s00011-018-1173-4
24. Miller P, Kidwell KM, Thomas D, et al. Elevated S100A8 protein expression in breast cancer cells and breast tumor stroma is prognostic of poor disease outcome. Breast Cancer Res Treat. 2017;166(1):85–94. doi:10.1007/s10549-017-4366-6
25. Srikrishna G. S100A8 and S100A9: new insights into their roles in malignancy. J Innate Immun. 2012;4(1):31–40. doi:10.1159/000330095
26. Zhang X, Ai F, Li X, et al. Inflammation-induced S100A8 activates Id3 and promotes colorectal tumorigenesis. Int J Cancer. 2015;137(12):2803–2814. doi:10.1002/ijc.29671
27. Nicolas E, Ramus C, Berthier S, et al. Expression of S100A8 in leukemic cells predicts poor survival in de novo AML patients. Leukemia. 2011;25(1):57–65. doi:10.1038/leu.2010.251
28. Spijkers-Hagelstein JA, Schneider P, Hulleman E, et al. Elevated S100A8/S100A9 expression causes glucocorticoid resistance in MLL-rearranged infant acute lymphoblastic leukemia. Leukemia. 2012;26(6):1255–1265. doi:10.1038/leu.2011.388
29. Yang M, Zeng P, Kang R, et al. S100A8 contributes to drug resistance by promoting autophagy in leukemia cells. PLoS One. 2014;9(5):e97242. doi:10.1371/journal.pone.0097242
30. Zambetti NA, Ping Z, Chen S, et al. Mesenchymal inflammation drives genotoxic stress in hematopoietic stem cells and predicts disease evolution in human pre-leukemia. Cell Stem Cell. 2016;19(5):613–627. doi:10.1016/j.stem.2016.08.021
31. Laouedj M, Tardif MR, Gil L, et al. S100A9 induces differentiation of acute myeloid leukemia cells through TLR4. Blood. 2017;129(14):1980–1990. doi:10.1182/blood-2016-09-738005
32. Wang X, Abraham S, McKenzie JAG, et al. LRG1 promotes angiogenesis by modulating endothelial TGF-beta signalling. Nature. 2013;499(7458):306–311. doi:10.1038/nature12345
33. Ramirez-Ardila DE, Ruigrok-Ritstier K, Helmijr JC, et al. LRG1 mRNA expression in breast cancer associates with PIK3CA genotype and with aromatase inhibitor therapy outcome. Mol Oncol. 2016;10(8):1363–1373. doi:10.1016/j.molonc.2016.07.004
34. Cavalcante Mde S, Torres-Romero JC, Lobo MD, et al. A panel of glycoproteins as candidate biomarkers for early diagnosis and treatment evaluation of B-cell acute lymphoblastic leukemia. Biomark Res. 2016;4:1. doi:10.1186/s40364-016-0055-6
35. Tichet M, Prod’Homme V, Fenouille N, et al. Tumour-derived SPARC drives vascular permeability and extravasation through endothelial VCAM1 signalling to promote metastasis. Nat Commun. 2015;6:6993. doi:10.1038/ncomms7993
36. Lindner JL, Loibl S, Denkert C, et al. Expression of secreted protein acidic and rich in cysteine (SPARC) in breast cancer and response to neoadjuvant chemotherapy. Ann Oncol. 2015;26(1):95–100. doi:10.1093/annonc/mdu487
37. Feng J, Tang L. SPARC in tumor pathophysiology and as a potential therapeutic target. Curr Pharm Des. 2014;20(39):6182–6190.
38. Nagaraju GP, Sharma D. Anti-cancer role of SPARC, an inhibitor of adipogenesis. Cancer Treat Rev. 2011;37(7):559–566. doi:10.1016/j.ctrv.2010.12.001
39. Siva K, Jaako P, Miharada K, et al. SPARC is dispensable for murine hematopoiesis, despite its suspected pathophysiological role in 5q-myelodysplastic syndrome. Leukemia. 2012;26(11):2416–2419. doi:10.1038/leu.2012.97
40. Tripodo C, Sangaletti S, Guarnotta C, et al. Stromal SPARC contributes to the detrimental fibrotic changes associated with myeloproliferation whereas its deficiency favors myeloid cell expansion. Blood. 2012;120(17):3541–3554. doi:10.1182/blood-2011-12-398537
41. Tirado-Gonzalez I, Czlonka E, Nevmerzhitskaya A, et al. CRISPR/Cas9-edited NSG mice as PDX models of human leukemia to address the role of niche-derived SPARC. Leukemia. 2018;32(4):1049–1052. doi:10.1038/leu.2017.346
42. Alachkar H, Santhanam R, Maharry K, et al. SPARC promotes leukemic cell growth and predicts acute myeloid leukemia outcome. J Clin Invest. 2014;124(4):1512–1524. doi:10.1172/JCI70921
43. Nian Q, Xiao Q, Wang L, et al. SPARC silencing inhibits the growth of acute myeloid leukemia transformed from myelodysplastic syndrome via induction of cell cycle arrest and apoptosis. Int J Mol Med. 2014;33(4):856–862. doi:10.3892/ijmm.2014.1648
44. Sangaletti S, Tripodo C, Vitali C, et al. Defective stromal remodeling and neutrophil extracellular traps in lymphoid tissues favor the transition from autoimmunity to lymphoma. Cancer Discov. 2014;4(1):110–129. doi:10.1158/2159-8290.CD-13-0276
45. Yan J, Zhang J, Zhang X, et al. SPARC is down-regulated by DNA methylation and functions as a tumor suppressor in T-cell lymphoma. Exp Cell Res. 2018;364(2):125–132. doi:10.1016/j.yexcr.2017.12.022
46. Giallongo C, La Cava P, Tibullo D, et al. SPARC expression in CML is associated to imatinib treatment and to inhibition of leukemia cell proliferation. BMC Cancer. 2013;13:60. doi:10.1186/1471-2407-13-60
47. Ehninger A, Boch T, Medyouf H, et al. Loss of SPARC protects hematopoietic stem cells from chemotherapy toxicity by accelerating their return to quiescence. Blood. 2014;123(26):4054–4063. doi:10.1182/blood-2013-10-533711
48. Aref S, Salama O, Al-Tonbary Y, et al. L and E selectins in acute myeloid leukemia: expression, clinical relevance and relation to patient outcome. Hematology. 2002;7(2):83–87. doi:10.1080/10245330290028579
49. Hafez FM, Hassab H, Morad Z, Farag EA. CD54 and CD62L expression by lymphoid cells in acute lymphoblastic leukaemia in children. Br J Biomed Sci. 2003;60(3):149–154.
50. Spertini O, Callegari P, Cordey AS, et al. High levels of the shed form of L-selectin are present in patients with acute leukemia and inhibit blast cell adhesion to activated endothelium. Blood. 1994;84(4):1249–1256.
51. Kapelko-Slowik K, Jazwiec B, Miroslaw S, et al. [Plasma concentration of the shed form of L-selectin (sL-selectin) in patients with acute myeloblastic leukemia (AML) and acute lymphoblastic leukemia (ALL) and its relation to the clinical course]. Pol Arch Med Wewn. 2004;112(5):1283–1288.
52. Sopper S, Mustjoki S, White D, et al. Reduced CD62L expression on T cells and increased soluble CD62L levels predict molecular response to tyrosine kinase inhibitor therapy in early chronic-phase chronic myelogenous leukemia. J Clin Oncol. 2017;35(2):175–184. doi:10.1200/JCO.2016.67.0893
53. Dagdemir A, Ertem U, Duru F, Kirazli S. Soluble L-selectin increases in the cerebrospinal fluid prior to meningeal involvement in children with acute lymphoblastic leukemia. Leuk Lymphoma. 1998;28(3–4):391–398. doi:10.3109/10428199809092695
 © 2019 The Author(s). This work is published and licensed by Dove Medical Press Limited. The full terms of this license are available at https://www.dovepress.com/terms.php and incorporate the Creative Commons Attribution - Non Commercial (unported, v3.0) License.
By accessing the work you hereby accept the Terms. Non-commercial uses of the work are permitted without any further permission from Dove Medical Press Limited, provided the work is properly attributed. For permission for commercial use of this work, please see paragraphs 4.2 and 5 of our Terms.
© 2019 The Author(s). This work is published and licensed by Dove Medical Press Limited. The full terms of this license are available at https://www.dovepress.com/terms.php and incorporate the Creative Commons Attribution - Non Commercial (unported, v3.0) License.
By accessing the work you hereby accept the Terms. Non-commercial uses of the work are permitted without any further permission from Dove Medical Press Limited, provided the work is properly attributed. For permission for commercial use of this work, please see paragraphs 4.2 and 5 of our Terms.