Back to Journals » OncoTargets and Therapy » Volume 14
ITGA2 Overexpression Promotes Esophageal Squamous Cell Carcinoma Aggression via FAK/AKT Signaling Pathway
Authors Huang W, Zhu J, Shi H, Wu Q, Zhang C
Received 26 January 2021
Accepted for publication 10 May 2021
Published 3 June 2021 Volume 2021:14 Pages 3583—3596
DOI https://doi.org/10.2147/OTT.S302028
Checked for plagiarism Yes
Review by Single anonymous peer review
Peer reviewer comments 2
Editor who approved publication: Dr Federico Perche
Wei Huang,1,2,* Ju Zhu,1,* Haoming Shi,1 Qingchen Wu,1 Cheng Zhang1
1Department of Cardiothoracic Surgery, The First Affiliated Hospital of Chongqing Medical University, Chongqing, People’s Republic of China; 2Key Laboratory of Molecular Oncology and Epigenetics, The First Affiliated Hospital of Chongqing Medical University, Chongqing, People’s Republic of China
*These authors contributed equally to this work
Correspondence: Qingchen Wu; Cheng Zhang
Department of Cardiothoracic Surgery, The First Affiliated Hospital of Chongqing Medical University, Chongqing, People’s Republic of China
Email [email protected]; [email protected]
Background: Integrin alpha 2 (ITGA2) is highly expressed in various cancers. ITGA2 up regulation promotes tumor proliferation, invasion, migration, and angiogenesis and ITGA2 is a poor prognostic factor in many tumors. However, the mechanism underlying its role in esophageal squamous cell carcinoma (ESCC) is unknown.
Methods: The expression profile of ITGA2 in ESCC was analyzed using the Gene expression profiling interactive analysis (GEPIA). ESCC tissues were analyzed by real time PCR (RT-qPCR) and immunohistochemistry to verify ITGA2 expression. The impact of ITGA2 on the clinicopathological characteristics was explored using a chi-square test. Apoptosis, Transwell, colony formation, and wound healing assays were conducted to characterize the roles of ITGA2 in ESCC. Its impact on tumorigenesis was further examined using a tumor xenograft model. The expression of proteins associated with the epithelial-mesenchymal Transition (EMT) and focal adhesion kinase (FAK)/AKT pathway and regulated by ITGA2 was evaluated with Western blot analysis. The Akt inhibitor MK-2206 was used to explore the interaction of ITGA2 with the FAK/Akt pathway.
Results: ITGA2 was upregulated in ESCC tissues and related to lymph node metastasis as well as TNM stage. In vitro experimental models revealed that ITGA2 promotes proliferation, invasion, and migration, and inhibits apoptosis. In vivo experiments show that ITGA2 promotes ESCC proliferation. Additionally, Western blot analysis revealed that ITGA2 silencing inhibits FAK/AKT signaling and suppresses EMT, while its overexpression activates FAK/AKT signaling and promotes EMT. Moreover, treatment with the AKT inhibitor MK-2206 successfully repressed the progression of ESCC caused by ITGA2 overexpression.
Conclusion: Our findings indicated that in ESCC, ITGA2 promotes proliferation, invasion and migration, while inhibiting apoptosis and promoting EMT in ESCC, possibly via FAK/AKT phosphorylation. These findings highlight the therapeutic value of ITGA2 in ESCC.
Keywords: ITGA2, ESCC, FAK/AKT, phosphorylation, EMT
Corrigendum for this paper has been published.
Introduction
Esophageal cancer (ESCA) has a high mortality rate. It is the 6th leading cause of cancer mortality and the 7th most common cancer globally.1 Esophageal adenocarcinoma (EAC) and ESCC are the 2 main ESCA pathological subtypes. ESCC accounts for>90% of ESCAs. ESCC is the 3rd most common cancer in China, accounting for about half of the global ESCC burden.2–4 Despite advances in ESCC treatment, its 5-year overall survival is<20%.5 Thus, better understanding of the molecular mechanism underlying ESCC development is needed for improved outcomes.
Integrin is a transmembrane receptor, comprised of 2 non-covalently bound subunits: α and β.6 Each integrin subunit binds to a special component of extracellular matrix(ECM) to mediate cell-to-cell adhesion and also promote cancer-related signaling pathways.7 ITGA2 is expressed in multiple cell-types such as fibroblasts, blood cells and endothelial cells. It has physiological functions like bidirectional signal transmission, cell migration, differentiation, and angiogenesis.8–11 ITGA2 promotes various tumorigenic processes, including cell migration,12 is linked to poor clinical course of acute myeloid leukemia,13 and has therapeutic value against glioblastoma.14 ITGA2 is upregulated in numerous cancers but its role in ESCC is unclear.
During EMT process, epithelial cells lose E-cadherin to acquire mesenchymal markers like vimentin and N-cadherin.15 EMT affect occurrence, progression, treatment resistance, and stem cell features of tumors, especially tumor metastasis.16 FAK is an important receptor for transmitting integrin protein signals into cells17,18 and FAK signaling has been confirmed to be associated with tumor EMT.19,20 Moreover, in ESCC, increased FAK phosphorylation enhances tumor EMT.21 It is unclear whether ITGA2 affects EMT changes in ESCC via FAK signaling.
Here, we examined the role of ITGA2 in ESCC and the potential underlying mechanism using in vitro and in vivo approaches. In vitro analyses demonstrated that ITGA2 was up regulated in ESCC tissues and contributed to lymph node metastasis. It also revealed that ITGA2 promotes proliferation, invasion, and migration and inhibits ESCC apoptosis via FAK/AKT signaling, thereby enhancing EMT. Additionally, a nude mouse model of ESCC showed that ITGA2 promotes ESCC proliferation in vivo.
Materials and Methods
Ethics Statement
This study was approved by Ethics committee of the First Affiliated Hospital of Chongqing Medical University and conducted in accordance with the Declaration of Helsinki. All subject signed informed consent forms. Animal experiments conformed with guidelines on the Care and Use of Laboratory Animals of National Institutes of Health (NIH) and guideline for good clinical practice published by National Medical Products Administration.
Specimen Collection
A cohort of 71 and 25 ESCC tissues and pair-matched neighboring non-tumor esophageal tissues were collected from the department of Pathology-Chongqing Medical University and the First Affiliated Hospital of Chongqing Medical University, respectively. No patients had received treatment before surgery and none had been diagnosed with any other cancers 3 years before surgery. Upon collection, all specimens were snap-frozen in liquid nitrogen and maintained at −80°C until use.
Cell Culture and Transfection
Human ESCC cell lines KYSE-510, KYSE-150, ECA-109, TE-1, TE-10 and the normal human esophageal epithelial cell line, Het-1A were commercially obtained from Wuhan Fine Biotech Co., Ltd (Wuhan, China) and grown in DMEM (Biological Industries, Israel), containing 100U/mL pen/strep (Beyotime, China) and 10% fetal bovine serum (FBS) (Biological Industries, Israel) in a humidified incubator at 37°C, 5% CO2. ITGA2 was knocked down in the cell lines TE-1 and TE-10, which express high ITGA2 levels. ITGA2 was overexpressed in ECA-109, which has low ITGA2 levels. Puromycin-resistant lentivirus-sh-ITGA2 and lentivirus-ITGA2 were purchased from Genechem (Genechem, China). Virus transfection was carried out according to the manufacturer instructions.
RT-qPCR Analysis
Total RNA was isolated from cultured ESCC cell lines using Trizol (TaKaRa, Japan). It was then used to synthesize cDNA utilizing PrimeScript RT kit (TaKaRa, Japan) and stored at −20°C. The expression levels of the designated genes and GAPDH were determined using an ABI 7500 Real-Time PCR System (Applied Biosystems, Foster City, CA, USA) with the SYBR Green PCR Master Mix (TaKaRa, Japan). Each analysis was in 3 replicates and GADPH used as reference gene. Gene expression fold change was determined using the 2−ΔΔCt method. The following primers (sense/anti-sense) were used:
ITGA2:5′‐ctggtgttagcgctcagtca‐3′ (forward), 5′‐tcggttctcaggaaagccac‐3′ (reverse);
GAPDH: 5′‐ggagcgagatccctccaaaat‐3′(forward), 5′‐ggctgttgtcatacttctcatgg‐3′(reverse).
Western Blot Analysis
Cell lysing was accomplished with the RIPA buffer and then total protein extracted. Protein concentration was determined using a BCA protein kit (Beyotime, China) and 30μg of sample used for Western blot analyses as described before.22
Antibodies
Western blotting assay was conducted using the following antibodies: anti-ITGA2 (Abcam, ab137872), anti-FAK (Cell Signaling Technology (CST), #3285), anti-p-FAK (CST, # 8556), anti-Akt (CST, # 4685), anti-Vimentin (CST, #5741), anti-p-Akt (CST, #4060), anti-N-Cadherin (CST, #13,116), anti-E-Cadherin (CST, #3195), anti-GADH (Servicebio, GB11002).
Immunohistochemistry
Tissue sections were deparaffinized and rehydrated. Antigen retrieval was achieved by heating the sectioned tissues at 95° C for 20 minutes in citrate buffer (pH 6.0), and then cooling them to room temperature(RT). Between every incubation step, the slides were rinsed three times with TBST (pH 7.4). They were then soaked in 3% peroxidase solution for 20 minutes and blocked with 10% normal goat serum via incubation at 37°C for 30 min. They were then incubated overnight with indicated primary antibody at 4°C. Following 3 washes in TBST, the slices were incubated with goat anti-rabbit IgG for 30 min, and then incubated with HRP-conjugated streptavidin-biotin. Signal was then developed using diaminobenzidine after counter-staining with hematoxylin. Protein expression levels were determined based on percentage and staining intensity of immune-reactive cells. The staining intensity was categorized as follows: 0 (negative), 1 (weak positive), 2 (medium positive), and 3 (strong positive). The percentage of immune response cells was categorized as follows: 0 (0%), 0.5 (1–10%), 1 (11–20%), 2 (21–50%), 3 (51–80%), 4 (81–100%). To obtain the final score for each sample, average value of tumor cell staining intensity was multiplied by the percentage of positive cells.
CCK-8 Assays
2000 cells were cultured into 96-well plates and used for the CCK-8 (Beyotime, China) assay at 0, 24, 48, 72h using manufacturer instructions. Absorbance was read at 450nm on an Infinite 200 PRO, (TECAN) microplate reader.
Colony Formation Tests
2000 cells were seeded in 6-well plates, and fixed with 4% paraformaldehyde (Beyotime, China). This was followed by staining with 0.1% crystal violet (Beyotime, China). Subsequently, colony formation assays were conducted on the surviving cells and photographed after 7 days of plating.
Flow Cytometry
After harvesting, cells rinsed once with PBS, and suspended in 100μL combination buffer. After inoculation with Annexin V-FITC as well as propidium iodide (both Sigma-Aldrich) for 30 minutes at RT conditions, apoptosis assay was carried out using a FACS Calibur flow cytometer (BD Biosciences).
Cell Invasion and Migration Tests
Cell invasion was evaluated using Transwell assays on 24-well Corning Costar inserts with 8μm pores precoated with Matrigel (BD, diluted at 1:8). First, the cells were grown in FBS-free DMEM for 24 h. 5×10⁴cells were re-suspended in 200μL FBS-free DMEM and added to the upper chambers. Next, DMEM with 10% FBS was placed in the lower chambers and grown for 48h before being fixed on the insert membranes using 4% paraformaldehyde and stained with crystal violet solution. Migrated cells were examined and at least 3 fields randomly imaged per well. Next, Transwell Chambers without matrix coating were employed to explore cell migration. 2×10⁴ cells were planted in the upper compartments, and DMEM+10% FBS placed in the lower chambers. They were then allowed to grow for 24 h, fixed with 4% paraformaldehyde, and stained with crystal violet staining solution. Migrated cells were examined and at least 3 fields randomly imaged per well.
Wound Healing Assays
Cells were cultured in 6-well plates at a density of 5×10⁵/well and allowed to grow for 48 h. A 200μL pipette tip was subsequently employed to create a linear wound on the cell monolayer and wound healing assessed by imaging at 0, 24, and 48 h.
Generation of ESCC Xenografts in Nude Mice
5×10⁶ TE-1 cells stably expressing sh-ITGA2 or sh-Control, or 5×10⁶ ECA-109 cells stably expressing ITGA2 or Vector were suspended in PBS and inoculated subcutaneously into 5–6 weeks old female BALB/c nude mice (a total of 20, 5 mice/group). Animals were sacrificed after 21 days and tumors removed and weighed.
Statistical Analysis
ITGA2 expression in ESCC was examined using IHC and data analyzed using Chi-square test (SPSS 21.0). Differences between groups were compared using paired two-tailed Student’s t-test. Data are shown as mean±SD. Statistical analysis was done on GraphPad Prism 8. P <0.05 signified statistical significance.
Results
ITGA2 is Highly Expressed in Human ESCC Cells and Tissues
ITGA2 is upregulated in various cancers but its expression in ESCC is unclear. GEPIA analysis of ESCA vs adjacent normal tissues revealed that ITGA2 mRNA levels were remarkably up-regulated in ESCA (Figure 1A). To validate this, we analyzed ITGA2 expression in 25 ESCC patients using RT-qPCR and used IHC to determine ITGA2 protein levels in 71 ESCC patients paired cancer vs adjacent normal tissues. This analysis showed that protein and mRNA levels of ITGA2 were markedly elevated in ESCC tissues than in neighboring non-tumor tissues (Figure 1B and C). Analysis of ITGA2 expression showed that relative to Het-1A, the ESCC cell lines, TE-1, TE-10, KYSE-150, KYSE-510, ECA-109 possess elevated ITGA2 levels (Figure 1D).
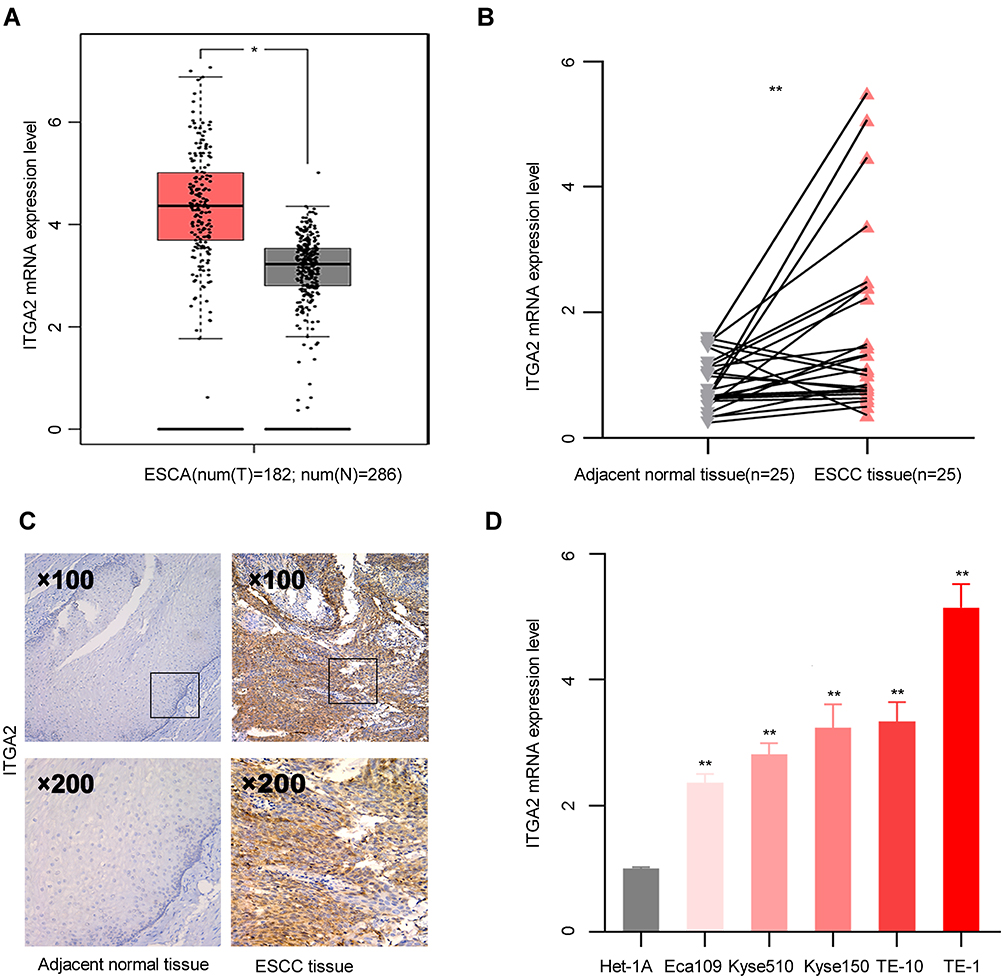 |
Figure 1 ITGA2 is highly expressed in ESCC. (A) ITGA2 mRNA levels were determined using GEPIA. *p <0.05. (B) ITGA2 mRNA level was measured in 25 paired primary ESCC tissues and matched neighboring non-tumor tissues of the same patient. **p<0.01. (C) Dot plots represent IHC scores for ITGA2 expression in TMA tissue sections. Scale bars are indicated in the figure. (D) ITGA2 mRNA expression in the esophageal mucosal epithelial cells (Het-1A) and ESCC cell lines (Eca109, Kyse510, Kyse150, TE-1, TE-10). **p<0.01. |
ITGA2 Expression Level Correlates with ESCC Clinicopathological Features
To establish the clinical significance of ITGA2 in ESCC, we studied the association of its expression with ESCC clinicopathological features and found that ITGA2 expression was linked to lymph node metastasis as well as TNM staging (p=0.031 and p=0.014, respectively; Table 1). Age and gender were not associated with ITGA2 expression. These data imply that ITGA2 may enhance ESCC progression and metastasis.
 |
Table 1 Correlation Between ITGA2 Expression and Clinicopathological Features in 71 ESCC Patients |
ITGA2 Knockdown Delays the Aggressiveness of ESCC Cells in vitro
Since ITGA2 expression was significantly higher in ESCC relative to adjacent normal tissue, we examined functions of ITGA2 in ESCC by stably depleting ITGA2 in TE-1 and TE-10 cells with sh-ITGA2. CCK8, colony formation and apoptosis assays (flow cytometry) revealed that knockdown of ITGA2 suppressed cell proliferation and enhanced apoptosis (Figure 2A–C). Transwell and wound healing assays showed that knocking out ITGA2 markedly reduced cell invasion and migration (Figure 2D and E). These results indicate that silencing ITGA2 may suppress ESCC aggressiveness in vitro.
 |
Figure 2 Silencing ITGA2 inhibits ESCC cells aggressiveness.(A–E) TE-1 and TE-10 cells were stably transfected with sh-Control or sh-ITGA2. Flow cytometric analysis of apoptosis (A), CCK8 assay (B), colony formation assay (C), wound healing assay (D), invasion and migration assay (E). For (E), displayed invasion and migration images are based on Transwell experiment. Sh-ITGA2 group and sh-Control group were compared. Each bar displays the mean±SD of 3 independent experiments as analyzed by paired two-tailed students, t-test.*p<0.05; **p<0.01;***p<0.001. |
ITGA2 Overexpression Enhances ESCC Aggressiveness in vitro
To determine the effect of ITGA2 up regulation in ESCC, we stably overexpressed ITGA2 in ECA-109 cells. CCK8, colony formation and apoptosis assays showed ITGA2 overexpression promotes cell proliferation and suppresses apoptosis (Figure 3A–C). Additionally, Transwell as well as wound healing assays demonstrated that overexpression of ITGA2 markedly reduced cell invasion and migration (Figure 3D–F). These results suggest that ITGA2 overexpression may promote ESCC aggressiveness in vitro.
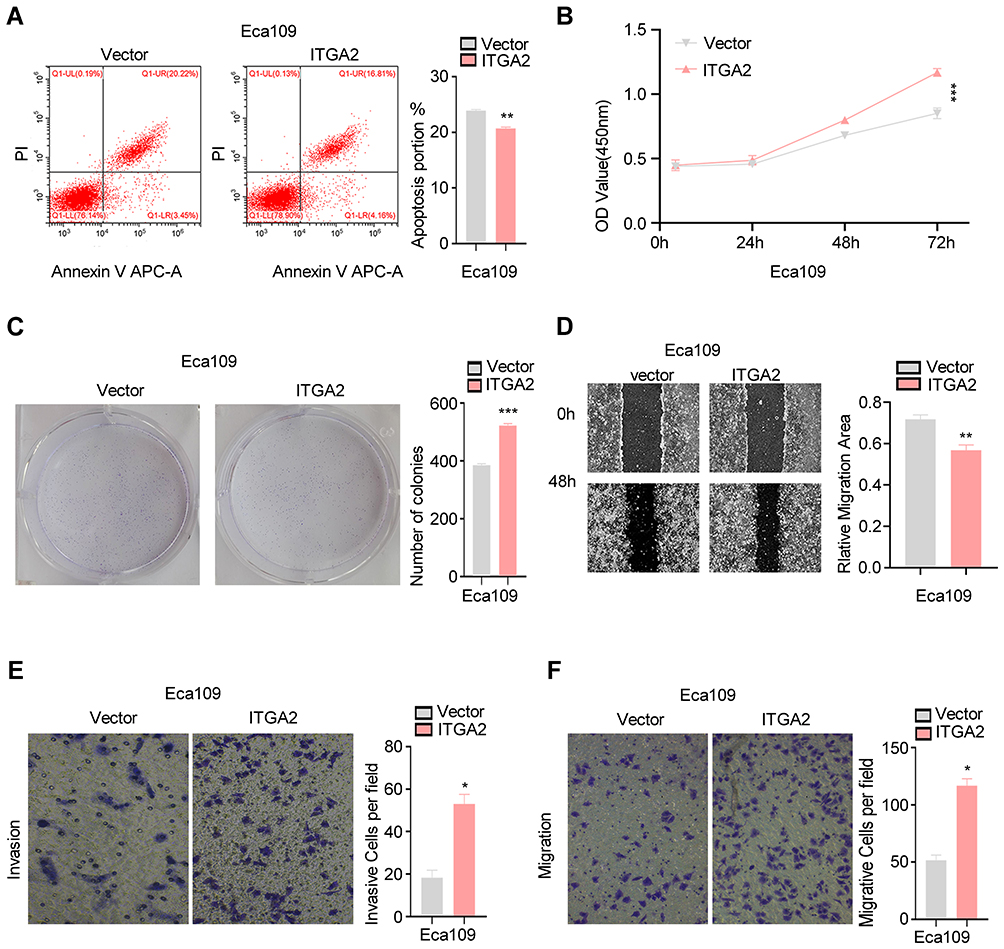 |
Figure 3 ITGA2 overexpression promotes ESCC cells aggressiveness.(A–E) ITGA2 was stably overexpressed in ECA-109 cells. Flow cytometry analysis of apoptosis (A), CCK8 assay (B), colony formation assay (C), wound healing assay (D), invasion and migration assay (E and F). For (E and F), displayed invasion and migration images are based on Transwell assays. The high expression ITGA2 group was compared to the Vector group. Each barsshowthe mean±SD of 3 independent experiments. Data were statistically analyzed with paired two-tailed students, t-test. *p<0.05; **p<0.01; ***p<0.001. |
ITGA2 Expression Correlates with EMT in ESCC
Next, we explored the role of ITGA2 in ESCC EMT. After the cells were stably transfected with the lentivirus, we detected the level of ITGA2 mRNA, and the results showed that ITGA2 mRNA was significantly reduced in the ITGA2 knockdown cell lines TE1 and TE10, while it was significantly increased in the ITGA2 overexpression cell line Eca109 (Figure 4A and B). Examination of expression measures of the EMT markers, Vimentin E-Cadherin, and N-Cadherin in ITGA2 stable knockdown TE-1 and TE-10 cells and ITGA2 overexpressing Eca109 cells revealed EMT suppression in ITGA2 knockdown TE-10 and TE-1 and elevation in ITGA2 overexpressing ECA-109 (Figure 4C–E). Thus, ITGA2 expression may promote ESCC invasion and migration by modulating EMT.
 |
Figure 4 ITGA2 was correlated with EMT in ESCC. (A) TE1 and TE10 cells were used for stable knockdown of ITGA2. The qPCR result showed that compared with the control, ITGA2 mRNA in sh-ITGA2 cells was significantly reduced. Sh-ITGA2 group and sh-Control group were compared. Each bars show the mean±SD of 3 independent experiments. Data analysis was conducted using paired two-tailed students, t-test. ****p=<0.0001. (B) ECA109 cells were used for the overexpression of ITGA2, and qPCR results showed that the mRNA of ITGA2 in the over-expression of ITGA2 cells was increased by about 4 times compared with the no-load cells. The high ITGA2-expression group was compared to empty vector group. Each bar represented the mean±SD of 3 independent experiments. Data were statistically analyzed with paired two-tailed students, t-test. **p<0.01. (C and D) TE-1 and TE-10 cells were stably transfected with sh-Control and sh-ITGA2. Western blotting assay revealed the expression of ITGA2 and EMT markers (Vimentin, N-Cadherin, E-Cadherin). GADPH was used as a reference gene. Sh-ITGA2 group and sh-Control group were compared. Each bars show the mean±SD of 3 independent experiments. Data analysis was conducted using paired two-tailed students, t-test.**p<0.01, ***p<0.001. (E) ECA-109 cells were used to stably express ITGA2. Western blot analysis examined the expression of ITGA2 and EMT- markers (E-Cadherin, N-Cadherin, Vimentin). GADPH was employed as an internal reference. The high ITGA2-expression group was compared to empty vector group. Each bar represents the mean±SD of 3 independent experiments. Data were statistically analyzed with paired two-tailed students, t-test. *p<0.05; **p<0.01. |
ITGA2 Promotes FAK/AKT Signaling in ESCC
Past studies have shown that integrins activate FAK/AKT signaling to promote tumor growth and metastasis.23 Thus, we hypothesized that ITGA2 may modulate ESCC aggressiveness via FAK/AKT signaling. To test this, we measured the expression levels of FAK, pFAK, AKT, pAKT in TE-1 and TE-10 cells stably transfected with sh-Control or sh-ITGA2, and ECA-109 cells stably transfected with empty vector or ITGA2. This analysis revealed that while FAK and AKT levels did not change significantly in ITGA2 stable knockdown TE-1 and TE-10 cells, pFAK and pAKT levels fell significantly (Figure 5A and B). Moreover, while FAK and AKT levels failed to significantly change upon ITGA2 overexpression in ECA-109 cells, pFAK and pAKT rose significantly (Figure 5C). Indicating that ITGA2 promotes FAK/AKT pathway activation in ESCC.
 |
Figure 5 ITGA2 enhances FAK/AKT pathway activation in ESCC.(A and B) TE-1 and TE-10 cells were stably transfected with sh-Control or sh-ITGA2. Western blot assaye valuated the expression of ITGA2, FAK, pFAK, AKT, and pAKT. Expression level of target proteins was standardized to that of GADPH. Sh-ITGA2 group and sh-Control group were compared. Each bars show the mean±SD of 3 independent experiments. Data were statistically analyzed with paired two-tailed students, t-test. **p<0.01, ***p<0.001. (C) ECA-109 cells stably expressed ITGA2. Western blot analysis examined the levels of ITGA2, FAK, pFAK, AKT, and pAKT. GADPH was employed as an internal reference. The high expression ITGA2 group was compared with vector group. Each bars show the mean±SD of 3 independent experiments. Statistical analyses were conducted using paired two-tailed students, t-test. **p<0.01. Abbreviation: ns, not significant. |
ITGA2 Activates FAK/Akt Signaling and Promotes Tumor Growth of ESCC in vivo
In vitro assays verified that ITGA2 promoted proliferation, invasion, migration and EMT by activating FAK/AKT signaling and inhibiting apoptosis in ESCC. To evaluate the influences of ITGA2 on FAK/AKT signaling and growth in vivo, we created a mouse xenograft model of ESCC by subcutaneously injecting TE-1 cells stably transfected with sh-ITGA2 or sh-Control and ECA-109 cells stably transfected with ITGA2 or empty vector into the armpits of BALB/c nude mice. After 3 weeks, the mice were sacrificed, tumors weighed and p-AKT levels in tumors determined by IHC. This analysis found that knockdown ITGA2 suppressed TE-10 cell growth and reduced p-AKT levels (Figure 6A and B) while ITGA2 overexpression promoted ECA-109 cell growth and increased p-AKT (Figure 6C and D). Thus, ITGA2 may promote ESCC in vivo.
 |
Figure 6 ITGA2 promotes ESCC tumor in vivo. (A and B) TE-1 cells stably transfected with sh-Control and sh-ITGA2 was injected into the armpit of nude mice, and tumors harvested and imaged on day 21. (A) Tumor mass (g) is shown as the mean±SD (n = 5) (A). Comparison of sh-ITGA2 group and sh-Control group. Statistical analyses were done with the paired two-tailed students, t-test, **p<0.01. ITGA2 and pAKT levels were evaluated using IHC (B). (C and D) The ECA-109 cells stably expressing ITGA2 or vector were injected into the armpit of nude mice, and tumors harvested and imaged on day 21. Tumor mass (g) data is shown as the mean±SD (n = 5) (C). Vector group was compared to the ITGA2 group. Data were statistically analyzed with paired two-tailed students t-test, **p<0.01. ITGA2 and pAKT levels were assessed using IHC (D). |
Inhibition of AKT Signaling Repressed the Aggression of ITGA2-Overexpressing Cells of ESCC in vitro
Overexpression of ITGA2 promoted AKT phosphorylation in ESCC cells. To further investigate the interaction between ITGA2 and AKT pathway, AKT inhibitor MK-2206 was used to treat ITGA2-overexpression cells. We observed that MK-2206 significantly inhibited the phosphorylation of AKT (Figure 7A), and eliminated the proliferation, invasion, and migration between ITGA2-overexpression and Victor group (Figure 7B–E). Therefore, ITGA2 might involve in the same pathway with AKT in ESCC cells.
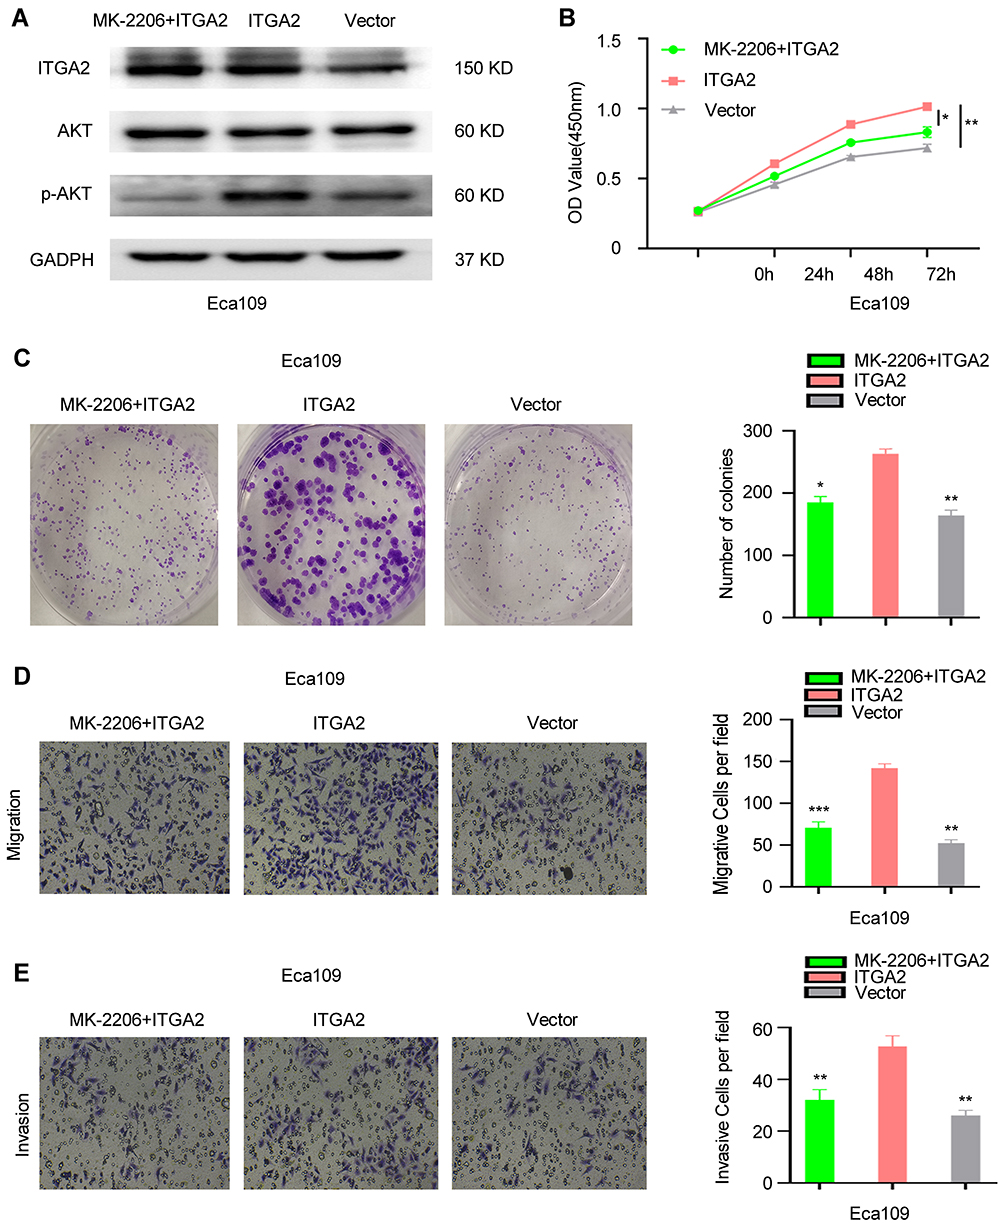 |
Figure 7 The function of ITGA2 was suppressed by AKT inhibitor MK-2206. (A)The protein level of ITGA2, AKT and p-AKT in Eca109 cells that treated with MK-2206+ITGA2, ITGA2 or Vector, respectively. CCK8 assay (B), colony formation assay (C), invasion and migration assay (D and E). For (D and E), displayed invasion and migration images were based on Transwell assays. MK-2206+ITGA2 and Vector groups were compared with the ITGA2 overexpression group, respectively. Data were statistically analyzed with paired two-tailed students, t-test. *p<0.05, **p<0.01, ***p<0.001. Abbreviation: ns, not significant. |
Discussion
ITGA2, an integrin subunit that is dysregulated in various cancers, affects almost all aspects of tumorigenic processes.12 ITGA2 upregulation is associated with paclitaxel resistance in ovarian cancer24 and poor prognosis in acute leukemia.13 Reduced ITGA2 levels induce apoptosis of gastric cancer cells and inhibit migration.25 ITGA2 is reported to promote cancer aggressiveness26 and is postulated to be of therapeutic value in glioma.14
While numerous studies suggest ITGA2 as an indicator of cancer prognosis and treatment, its role in ESCC is unclear. ESCC is has high mortality and therapeutic benefits of targeted drugs like EGFR and VEGF inhibitors in ESCC are unsatisfactory.4 To our knowledge, this is the first study to show that ITGA2 is upregulated in ESCC cell lines and tissues. In addition, abnormally expressed ITGA2 correlates with TNM staging in ESCC and lymphatic metastasis. In vivo and in vitro experiments confirmed that ITGA2 overexpression promotes proliferation, invasion, and migration of ESCC, and suppresses apoptosis. While ITGA2 silencing promotes apoptosis and inhibits proliferation, invasion and migration. Indicating that increased ITGA2 expression in ESCC promotes malignant features.
FAK is a key factor in integrin-mediated signaling.23,27 Multiple studies have shown that integrins regulate FAK activity and promote tumor growth and metastasis.20 As a multi-domain tyrosine kinase protein, FAK can change its conformation after activation, and function as a bridge between proteins or provide an assembly platform for protein complexes. By functioning as a kinase-dependent or non-kinase-dependent scaffold, FAK play a role in several signaling pathways, and regulates survival, proliferation, migration and adhesion processes.28 In lung and pancreatic cancer, increased FAK activation promotes tumor invasion and metastasis.29,30 In prostate, gastric, and breast cancer FAK activation enhances metastasis and tumor formation, progression, and blood vessel formation.31–33
To our knowledge, we are the first to verify FAK/AKT pathway regulation by ITGA2 in ESCC and demonstrate the relationship between ITGA2and EMT in vivo and in vitro. Akt is a central node in many signaling pathways and is dysregulated in many cancers.34 We observed that knocking out ITGA2 reduces pFAK and pAKT levels, inhibiting FAK/AKT signaling. ITGA2 overexpression elevated pFAK and pAKT, activating FAK/AKT signaling.
EMT is the process by which epithelial cells acquire mesenchymal characteristics. In cancer, EMT is related to tumor occurrence, invasion, metastasis and drug resistance.35 FAK/AKT signaling activation induces EMT in various cancers, including pancreatic cancer, breast cancer and hepatocellular carcinoma.19,20,36 Consistent with other studies, we find that ITGA2 activates FAK/AKT signaling and increases EMT in ESCC.
In conclusion, our data show that ITGA2 may induce EMT in ESCC via FAK/AKT signaling and that ITGA2 may be an important oncogene in ESCC and a potential therapeutic target. However, we did not assess the effects of ITGA2 blockers on ESCC, which warrants further study.
Conclusion
Our experiments discovered a new ITGA2 mechanism in ESCC. ITGA2 promotes ESCC proliferation, invasion, and migration, inhibits apoptosis, and promotes EMT – probably via FAK/AKT phosphorylation. These findings support further research into ITGA2 as a potential therapeutic target against ESCC.
Disclosure
Wei Huang and Ju Zhu should be considered co-first authors in this study. The authors report no conflicts of interest in this work.
References
1. Bray F, Ferlay J, Soerjomataram I, et al. Global cancer statistics 2018: GLOBOCAN estimates of incidence and mortality worldwide for 36 cancers in 185 countries. CA Cancer J Clin. 2018;68(6):394–424. doi:10.3322/caac.21492
2. Chen W, Zheng R, Baade PD, et al. Cancer statistics in China, 2015. CA Cancer J Clin. 2016;66(2):115–132. doi:10.3322/caac.21338
3. Zhao J, He Y-T, Zheng R-S, et al. Analysis of esophageal cancer time trends in China, 1989–2008. Asian Pac J Cancer Prev. 2012;13(9):4613–4617. doi:10.7314/APJCP.2012.13.9.4613
4. Abnet CC, Arnold M, Wei W-Q. Epidemiology of Esophageal squamous cell carcinoma. Gastroenterology. 2018;154(2):360–373. doi:10.1053/j.gastro.2017.08.023
5. Palladino-Davis AG, Mendez BM, Fisichella PM, et al. Dietary habits and esophageal cancer. Dis Esophagus. 2015;28(1):59–67. doi:10.1111/dote.12097
6. Campbell ID, Humphries MJ. Integrin structure, activation, and interactions. Cold Spring Harb Perspect Biol. 2011;3(3):3. doi:10.1101/cshperspect.a004994
7. Hynes RO. Integrins: bidirectional, allosteric signaling machines. Cell. 2002;110(6):673–687. doi:10.1016/S0092-8674(02)00971-6
8. Eble JA, Haier J. Integrins in cancer treatment. Curr Cancer Drug Targets. 2006;6(2):89–105. doi:10.2174/156800906776056518
9. Desgrosellier JS, Cheresh DA. Integrins in cancer: biological implications and therapeutic opportunities. Nat Rev Cancer. 2010;10(1):9–22. doi:10.1038/nrc2748
10. Takamori S, Toyokawa G, Takada K, et al. Combination therapy of radiotherapy and anti-PD-1/PD-L1 treatment in non–small-cell lung cancer: a mini-review. Clin Lung Cancer. 2018;19(1):12–16. doi:10.1016/j.cllc.2017.06.015
11. Kadry YA, Calderwood DA. Chapter 22: structural and signaling functions of integrins. Biochim Biophys Acta Biomembr. 2020;1862(5):183206. doi:10.1016/j.bbamem.2020.183206
12. Adorno-Cruz V, Liu H. Regulation and functions of integrin α2 in cell adhesion and disease. Genes Dis. 2019;6(1):16–24. doi:10.1016/j.gendis.2018.12.003
13. Lian X-Y, Zhang W, Wu D-H, et al. Methylation-independent ITGA2 overexpression is associated with poor prognosis in de novo acute myeloid leukemia. J Cell Physiol. 2018;233(12):9584–9593. doi:10.1002/jcp.26866
14. Guo P, Moses-Gardner A, Huang J, et al. ITGA2 as a potential nanotherapeutic target for glioblastoma. Sci Rep. 2019;9(1):6195. doi:10.1038/s41598-019-42643-7
15. Nieto MA, Huang RY, Jackson RA, Thiery JP. Emt: 2016. Cell. 2016;166(1):21–45.
16. Mittal V. Epithelial mesenchymal transition in tumor metastasis. Annu Rev Pathol. 2018;13(1):395–412. doi:10.1146/annurev-pathol-020117-043854
17. Sulzmaier FJ, Jean C, Schlaepfer DD. FAK in cancer: mechanistic findings and clinical applications. Nat Rev Cancer. 2014;14(9):598–610. doi:10.1038/nrc3792
18. Lee BY, Timpson P, Horvath LG, Daly RJ. FAK signaling in human cancer as a target for therapeutics. Pharmacol Ther. 2015;146:132–149.
19. Zhang P-F, Li K-S, Shen Y-H, et al. Galectin-1 induces hepatocellular carcinoma EMT and sorafenib resistance by activating FAK/PI3K/AKT signaling. Cell Death Dis. 2016;7(4):e2201. doi:10.1038/cddis.2015.324
20. Luo J, Yao J-F, Deng X-F, et al. 14, 15-EET induces breast cancer cell EMT and cisplatin resistance by up-regulating integrin αvβ3 and activating FAK/PI3K/AKT signaling. J Exp Clin Cancer Res. 2018;37(1):23. doi:10.1186/s13046-018-0694-6
21. Zhou J, Zhu J, Jiang G, et al. Downregulation of microRNA-4324 promotes the EMT of esophageal squamous-cell carcinoma cells via upregulating FAK. Onco Targets Ther. 2019;12:4595–4604. doi:10.2147/OTT.S198333
22. Ma S, Lu -C-C, Yang L-Y, et al. ANXA2 promotes esophageal cancer progression by activating MYC-HIF1A-VEGF axis. J Exp Clin Cancer Res. 2018;37(1):183. doi:10.1186/s13046-018-0851-y
23. Zhao X, Guan JL. Focal adhesion kinase and its signaling pathways in cell migration and angiogenesis. Adv Drug Deliv Rev. 2011;63(8):610–615. doi:10.1016/j.addr.2010.11.001
24. Ma L, Sun Y, Li D, et al. Overexpressed ITGA2 contributes to paclitaxel resistance by ovarian cancer cells through the activation of the AKT/FoxO1 pathway. Aging. 2020;12(6):5336–5351. doi:10.18632/aging.102954
25. Chuang Y-C, Wu H-Y, Lin Y-L, et al. Blockade of ITGA2 induces apoptosis and inhibits cell migration in gastric cancer. Biol Proced Online. 2018;20(1):10. doi:10.1186/s12575-018-0073-x
26. Ren D, Zhao J, Sun Y, et al. Overexpressed ITGA2 promotes malignant tumor aggression by up-regulating PD-L1 expression through the activation of the STAT3 signaling pathway. J Exp Clin Cancer Res. 2019;38(1):485. doi:10.1186/s13046-019-1496-1
27. Mitra SK, Schlaepfer DD. Integrin-regulated FAK–Src signaling in normal and cancer cells. Curr Opin Cell Biol. 2006;18(5):516–523. doi:10.1016/j.ceb.2006.08.011
28. Kleinschmidt EG, Schlaepfer DD. Focal adhesion kinase signaling in unexpected places. Curr Opin Cell Biol. 2017;45:24–30. doi:10.1016/j.ceb.2017.01.003
29. Hu C, Zhou H, Liu Y, et al. ROCK1 promotes migration and invasion of non‑small‑cell lung cancer cells through the PTEN/PI3K/FAK pathway. Int J Oncol. 2019;55(4):833–844. doi:10.3892/ijo.2019.4864
30. Li B-Q, Liang Z-Y, Seery S, et al. WT1 associated protein promotes metastasis and chemo-resistance to gemcitabine by stabilizing Fak mRNA in pancreatic cancer. Cancer Lett. 2019;451:48–57. doi:10.1016/j.canlet.2019.02.043
31. Li Y, Wu Z, Yuan J, et al. Long non-coding RNA MALAT1 promotes gastric cancer tumorigenicity and metastasis by regulating vasculogenic mimicry and angiogenesis. Cancer Lett. 2017;395:31–44. doi:10.1016/j.canlet.2017.02.035
32. Du C, Zheng Z, Li D, et al. BKCa promotes growth and metastasis of prostate cancer through facilitating the coupling between αvβ3 integrin and FAK. Oncotarget. 2016;7(26):40174–40188. doi:10.18632/oncotarget.9559
33. Wu Z, Wang T, Fang M, et al. MFAP5 promotes tumor progression and bone metastasis by regulating ERK/MMP signaling pathways in breast cancer. Biochem Biophys Res Commun. 2018;498(3):495–501. doi:10.1016/j.bbrc.2018.03.007
34. Revathidevi S, Munirajan AK. Akt in cancer: mediator and more. Semin Cancer Biol. 2019;59:80–91. doi:10.1016/j.semcancer.2019.06.002
35. Pastushenko I, Blanpain C. EMT transition states during tumor progression and metastasis. Trends Cell Biol. 2019;29(3):212–226. doi:10.1016/j.tcb.2018.12.001
36. Wu YJ, Lin SH, Din ZH, et al. Sinulariolide inhibits gastric cancer cell migration and invasion through downregulation of the EMT process and suppression of FAK/PI3K/AKT/mTOR and MAPKs signaling pathways. Mar Drugs. 2019;17(12):668. doi:10.3390/md17120668
 © 2021 The Author(s). This work is published and licensed by Dove Medical Press Limited. The
full terms of this license are available at https://www.dovepress.com/terms
and incorporate the Creative Commons Attribution
- Non Commercial (unported, 3.0) License.
By accessing the work you hereby accept the Terms. Non-commercial uses of the work are permitted
without any further permission from Dove Medical Press Limited, provided the work is properly
attributed. For permission for commercial use of this work, please see paragraphs 4.2 and 5 of our Terms.
© 2021 The Author(s). This work is published and licensed by Dove Medical Press Limited. The
full terms of this license are available at https://www.dovepress.com/terms
and incorporate the Creative Commons Attribution
- Non Commercial (unported, 3.0) License.
By accessing the work you hereby accept the Terms. Non-commercial uses of the work are permitted
without any further permission from Dove Medical Press Limited, provided the work is properly
attributed. For permission for commercial use of this work, please see paragraphs 4.2 and 5 of our Terms.