Back to Journals » International Journal of General Medicine » Volume 17
ITGA11, a Prognostic Factor Associated with Immunity in Gastric Adenocarcinoma
Authors Yang X , Wei M, Huang Y, Yang X, Yuan Z, Huang J, Wei J, Tian L
Received 28 October 2023
Accepted for publication 21 January 2024
Published 5 February 2024 Volume 2024:17 Pages 471—483
DOI https://doi.org/10.2147/IJGM.S444786
Checked for plagiarism Yes
Review by Single anonymous peer review
Peer reviewer comments 2
Editor who approved publication: Dr Hossam El-Din Shaaban
XiaoYing Yang, Mengda Wei, YanQing Huang, Xi Yang, ZhenMin Yuan, JunJie Huang, JunRen Wei, Lei Tian
Department of Gastrointestinal Surgery, The First Affiliated Hospital of Guangxi Medical University, Nanning, Guangxi, People’s Republic of China
Correspondence: Lei Tian, Department of Gastrointestinal Surgery, The First Affiliated Hospital of Guangxi Medical University, Nanning, Guangxi, People’s Republic of China, Email [email protected]
Background: Stomach adenocarcinoma (STAD) presents a challenge given its advanced stage at diagnosis and poor prognosis. Integrin subunit alpha 11 (ITGA11) encodes alpha integrin and has been implicated in promoting tumorigenesis and development by participating in cell proliferation and invasion. However, the precise mechanism of ITGA11 in STAD remains unclear.
Methods: The differences in ITGA11 expression levels between 375 gastric cancer samples and 32 paracancerous tissue samples from the Cancer Genome Atlas (TCGA) database were examined. The relationship between ITGA11 expression and clinical features and ITGA11 diagnostic and prognostic value were evaluated using the chi-square test and receiver operating characteristic (ROC) assay. Differentially expressed genes were identified based on ITGA11 expression. Subsequently, functional enrichment analyses were conducted using Gene Ontology, the Kyoto Encyclopedia of Genes and Genomes, and Gene Set Enrichment Analysis. Furthermore, immune infiltration and the expression of ITGA11-associated immune checkpoints in patients with tumors were assessed using CIBERSORT, single-sample gene set enrichment analysis, and the TIMER database. Drug sensitivity associated with ITGA11 expression was analyzed using the R oncoPredict package to guide treatment decisions. Finally, the difference in ITGA11 expression between cancer tissue and the adjacent tissues was validated using quantitative PCR (qPCR) and immunohistochemistry.
Results: The gastric cancer tissue had significantly upregulated ITGA11 expression compared to paracancerous tissues. ITGA11 demonstrated robust diagnostic and prognostic value in gastric cancer (GC) and was an independent risk factor for adverse outcomes. The patients with STAD with elevated ITGA11 expression levels had heightened immune cell infiltration and increased immune checkpoint marker expression. Notably, patients with increased ITGA11 expression demonstrated reduced responsiveness to oxaliplatin and afatinib.
Conclusion: The results indicated the pivotal role of ITGA11 in shaping the tumor immune microenvironment, ultimately establishing ITGA11 as an immune-related prognostic predictor within the intricate landscape of STAD.
Keywords: ITGA11, stomach adenocarcinoma, bioinformatics analysis, immune infiltration, prognosis
Introduction
Stomach adenocarcinoma (STAD) is the fifth most frequently diagnosed cancer and is the third leading cause of cancer-related mortality worldwide.1 STAD is frequently clinically diagnosed at an advanced stage, resulting in high mortality rates and a substantial global burden.2 By 2040, the number of new gastric cancer cases will rise to 1.77 million globally.3 The overall survival of STAD has been improved by combination therapies involving chemotherapy, immunotherapy, or targeted therapy driven by advances in molecular pathologies and the identification of therapeutic targets, such as HER2, FGFR2b, and CLDN18.2.4 However, for both targeted therapies and immunotherapies, there is currently a lack of biomarkers that can accurately predict who will benefit best.5 Therefore, there is a pressing need to explore the biomarkers related to gastric cancer tumorigenesis and development.
Integrins are formed by the combination of α and β subunits, which are involved in constructing the extracellular matrix and intracellular cytoskeleton and are used in the main pathway for the binding and response of various protein ligands inside and outside the cell. The integrin family member integrin subunit alpha 11 (ITGA11) is upregulated in various tumors, including lung cancer, breast cancer, cutaneous squamous cell carcinoma, and esophageal cancer. ITGA11 influences prognosis by promoting cancer-associated fibroblast (CAF) migration.6–14 Furthermore, ITGA11 is critical in myofibroblast differentiation, matrix reorganization, and collagen deposition.15,16 ITGA11 is overexpressed in CAFs, contributing to tumor matrix construction and affecting the overall survival of patients with head and neck squamous cell carcinoma.17 CAFs demonstrated enhanced tumor cell invasion activity in gastric cancer and mobilized immune cells to build the tumor immune microenvironment.18,19 These previous studies collectively underscored the potential function of ITGA11 in tumorigenesis, suggesting its capability to drive malignant progression in various cancers. Moreover, ITGA11 possibly has an equally indispensable role in STAD. Previous studies indicated that ITGA11 expression was related to STAD prognoses, although the specific mechanism has not been systematically investigated.20,21
In the present study, ITGA11 differential expression in gastric cancer and adjacent normal tissues in the Cancer Genome Atlas (TCGA) database was investigated and verified using the Gene Expression Omnibus (GEO) dataset. The differentially expressed genes (DEGs) underwent functional enrichment analysis using R to explore the pathways related to ITGA11 immune infiltration function, study the relationship between its immune checkpoints, and predict drug sensitivity. ITGA11 expression in gastric cancer tissues and the adjacent tissues was verified using real-time quantitative PCR (RT-qPCR) and immunohistochemical methods.
Materials and Methods
Data Acquisition
Transcriptional RNA sequencing (RNA-seq) data were obtained from the Genomic Data Commons (GDC) Data Portal (https://gdc.xenahubs.net). The clinical information of 32 normal samples and 375 tumor samples were from TCGA. The GEO datasets GSE54129 and GSE15459 were utilized for verification.
ITGA11 Expression in STAD
The differences in ITGA11 expression between TCGA gastric cancer tissue and adjacent noncancerous tissue were analyzed using R (https://www.r-project.org/) and the edgeR package. ITGA11 expression difference was validated using the GSE54129 dataset.
Diagnosis and Prognostic Analysis
TCGA tumor samples were divided into two groups for survival analysis based on the ITGA11 expression (cut-off value: 50%). The survival curve was drawn using the R survival and survminer packages, while prognosis and diagnosis curves were constructed using timeroc and pROC. P < 0.05 was defined as a statistically significant difference. The difference between the groups was validated using GSE15459 dataset in Kaplan-Meier plotter (http://kmplot.com/analysis/).
Functional Enrichment Analysis
The DEGs combined with ITGA11 expression in TCGA tumor samples were selected using the R limma package. Differential expression was indicated by an adjusted p-value < 0.05 and Ilog2 fold change (FC)I ≥ 1. The enrichment analysis was explored using the R packages clusterProfiler and Enrichment plot and using Gene Ontology (GO) functional enrichment, the Kyoto Encyclopedia of Genes and Genomes (KEGG), and gene set enrichment analysis (GSEA).
Immune Infiltration
The proportion of tumor-infiltrating immune cells was estimated by CIBERSORT based on the gene expression profiles of all STAD samples. The infiltration degree of 28 immune cell types was quantified using the R package GSVA utilizing single-sample GSEA (ssGSEA). The correlation between ITGA11 expression and immune cells was investigated in the TIMER database (https://cistrome.shinyapps.io/timer/).
Immune Checkpoint Correlation Analysis
The correlation between ITGA11 and immune checkpoints was examined using the Spearman correlation. The correlation between ITGA11 expression and immune checkpoints was validated using the TIMER database (https://cistrome.shinyapps.io/timer/).
Protein–Protein Interaction Network
The STRING database generated a Protein–protein interaction (PPI) network of DEGs with high confidence (0.400) and medium false discovery rate (FDR) stringency (5%). Cytoscape software was used for further analysis, where the top 10 hub genes with synergy with ITGA11 were identified with the cytoHubba plugin. Cox regression analysis and survival analysis of the hub genes were conducted using the R survival package and visualized using the R packages forest plot, survival, and survminer (cut-off value: 50%).
Antineoplastic Drug Sensitivity
The drug sensitivity of TCGA samples was analyzed using the R package oncoPredict. The relationship between the median inhibitory concentration (IC50) of the drugs and ITGA11 expression was then analyzed using the Wilcoxon test (cut-off value: 50%).
Quantitative Real-Time PCR
Cancer and para-cancer tissues were obtained from 31 patients at the First Affiliated Hospital of Guangxi Medical University. The specimens were acquired in compliance with the Declaration of Helsinki and with all participants’ explicit consent and written approval. The First Affiliated Hospital of Guangxi Medical University Medical Ethics Committee approved the research protocol and procedure for acquiring human samples (approval number: 2023-E461-01). Total RNA was extracted from the specimens and then reverse-transcribed to complementary DNA (cDNA). ITGA11 expression was quantitatively analyzed using quantitative real-time (qRT) PCR using SYBR Green Premix (YEASEN, China). The internal reference was β-actin. The ITGA11 primer sequences were as follows: 5′-GGAGGAAGACTTGCGTCG-3′ (forward) and 5′-CACAGGTTCCCCAGTAGATG-3′ (reverse). The relative mRNA expression was quantified by the comparative threshold cycle (2−ΔΔCt) method.
Immunohistochemistry
ITGA11 protein expression was assessed using immunohistochemical analysis of 50 gastric cancer cases and 40 adjacent tissues. Immunohistochemistry (IHC) was conducted as follows: after deparaffinization, rehydration, and antigen retrieval, tissue sections were incubated overnight with anti-ITGA11 antibody (1:100 dilution, Elabscience, China) at 4 °C. Following secondary antibody incubation, the sections were stained sequentially with 3,3′-diaminobenzidine (DAB) and hematoxylin. The sections were analyzed using an optical microscope. ITGA11 expression levels were quantified using the average optical density (AOD).
Results
ITGA11 Expression in Tumors and Its Diagnostic and Prognostic Significance in STAD
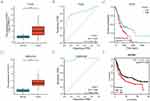
The gastric cancer tissues had significantly higher ITGA11 expression levels (n = 375) compared to normal tissues (n = 32) (Figure 1A). The receiver operating characteristic (ROC) curve analysis yielded an area under the curve (AUC) value of 0.822 with a 95% confidence interval (95% CI) of 0.763–0.881, indicating its effectiveness in distinguishing normal tissue from gastric adenocarcinoma tissue (Figure 1B). The Kaplan–Meier curve analysis revealed that patients with gastric cancer with elevated ITGA11 expression had shorter overall survival than those with lower ITGA11 expression (p = 0.020) (Figure 1C).
Concurrently, a complementary analysis was conducted using the GEO database (GSE54129 and GSE15459). In GSE54129, ITGA11 expression in gastric cancer tissues significantly exceeded that in normal tissues (Figure 1D), and diagnostic ROC curve analysis confirmed its robust diagnostic efficacy (AUC = 0.980, 95% CI = 0.962–0.999) (Figure 1E). Subsequently, the GSE15459 dataset validated the association between high ITGA11 expression and lower survival rates in patients with gastric cancer (p = 0.036) (Figure 1F).
Correlation Between ITGA11 Expression and Clinical Features
Analysis of the correlation between ITGA11 and clinical features in STAD yielded notable associations with local progression and prognosis. The ITGA11 clinical prognostic value in GC was assessed using univariate and multivariate Cox regression analyses. The univariate analysis identified ITGA11 (hazard ratio [HR] = 1.483, p = 0.02), age (HR = 1.620, p = 0.005), T stage (HR = 8.829, p < 0.001), N stage (HR = 1.925, p = 0.001), M stage (HR = 2.254, p = 0.01), and clinical stage (HR = 2.247, p = 0.004) as significant factors for overall survival in STAD (Figure 2A). The multivariate analysis confirmed that ITGA11 (HR = 1.614, p = 0.009), age (HR = 1.810, p = 0.002), and M stage (HR = 2.398, p = 0.005) were independent prognostic factors for STAD (Figure 2B). Interestingly, ITGA11 expression was increased in high pathologic T stages and advanced stages in patients with STAD (Figure 2C and F) but demonstrated no significant differences for the N and M stages (Figure 2D and E). The one-, three-, and five-year ITGA11 prognostic AUC values were 0.534 (95% CI = 0.461–0.6071), 0.621 (95% CI = 0.5241–0.7188), and 0.780 (95% CI = 0.6746–0.8846), respectively (Figure 2G).
Functional Predictions of ITGA11 Related to Immune Activity
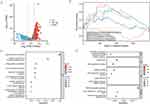
In TCGA-STAD, the comparison of two ITGA11 expression groups identified 1053 DEGs (377 upregulated genes and 676 downregulated genes) (Figure 3A). GSEA revealed associations between the DEGs and immune-related processes and tumorigenesis, including pathways such as WP_PI3KAKT_SIGNALING_PATHWAY, KEGG_PATHWAYS_IN_CANCER, PID_P53_DOWNSTREAM_PATHWAY, REACTOME_INNATE_IMMUNE_SYSTEM, and REACTOME_DISEASES_OF_METABOLISM (Figure 3B).
The GO/KEGG enrichment analysis revealed that the DEGs were notably enriched in immune-related activities involving pathways such as that for humoral immune response, negative regulation of immune system process, phagocytosis, engulfment, B cell-mediated immunity, egulation of leukocyte migration, immunoglobulin-mediated immune response, positive regulation of B cell activation, B cell receptor signaling pathway, humoral immune response mediated by circulating immunoglobulin, negative regulation of leukocyte differentiation, regulation of extrinsic apoptotic signaling pathway via death domain receptors, Golgi lumen, immunoglobulin complex, cytokine binding, immunoglobulin receptor binding, oxygen binding, alcohol dehydrogenase (NADP+) activity, PI3K–Akt signaling, drug metabolism: cytochrome P450, and chemical carcinogenesis: DNA adducts (Figure 3C and D).
The Relationship Between ITGA11 and Immune Infiltration
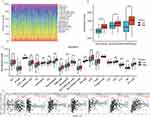
The proportion of immune subsets infiltrating in STAD was analyzed using the CIBERSORT algorithm to investigate the connection between ITGA11 expression and the immune microenvironment (Figure 4A). The high ITGA11 expression group exhibited higher ESTIMATE, immune, and stromal scores (Figure 4B). Furthermore, the ssGSEA algorithm demonstrated increased expression of multiple immune subsets in the high-expression group, encompassing CD8 active T cells, cytotoxic cells, dendritic cells, eosinophils, macrophages, mast cells, neutrophils, natural killer (NK) cells, T cells, effective memory T cells, T follicular helper cells, and Th1 cells (Figure 4C). Additionally, correlation analyses indicated a positive correlation between ITGA11 expression and CD8 active T cells, CD4 active T cells, macrophages, neutrophils, and dendritic cells, and an inverse correlation with memory B cells (Figure 4D).
Expression of ITGA11-Related Immune Checkpoints
Spearman correlation analysis conducted to elucidate the mechanism of ITGA11 influence on the immune microenvironment revealed significant positive correlations between ITGA11 expression and common immune checkpoints (PDCD1, CD274, PDCD1LG2, CTLA4, HAVCR2, LILRB1, SIRPA, LAG3, CD8A, and TIGIT) (Figure 5A–K).
PPI Network Construction and Hub Gene Selection
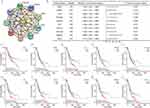
A PPI network was constructed using STRING and Cytoscape to elucidate interactions between ITGA11 and binding proteins. The top 10 hub genes were identified and formed a PPI network that included BGN, MMP2, LOX, POSTN, COL3A1, FN1, COL1A1, COL1A2, SPARC, and DCN (Figure 6A). These hub genes were all identified as independent risk factors for prognosis in STAD, and seven were directly linked to survival outcomes (Figure 6B–L). MMP2, COL3A1, COL1A2, and prognosis were not statistically significantly different.
Prediction of Antineoplastic Drug Response
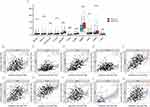
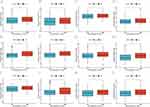
The drug sensitivity to antineoplastic drugs in two distinct ITGA11 expression groups (cut-off: 50%) was assessed to develop personalized treatment plans. The high-ITGA11 expression group had higher IC50 values for the antineoplastic drugs afatinib, cytarabine, dabrafenib, entinostat, erlotinib, gefitinib, ibrutinib, lapatinib, leflunomide, osimertinib, oxaliplatin, and sorafenib than the low-ITGA11 expression group (Figure 7A–L). These findings suggested that high-ITGA11 expression patients with STAD might benefit less from targeted therapy.
ITGA11 Expression in STAD Tissues Compared to Normal Tissues
ITGA11 expression and distribution in tumor tissue compared to the adjacent noncancerous tissue were examined using PCR and IHC. Analysis of the RNA expression in 31 fresh gastric cancer cases and the adjacent noncancerous tissues revealed higher ITGA11 mRNA expression in the gastric cancer tissues (Figure 8A). Figure 8D demonstrates that the gastric cancer tissues had significantly higher ITGA11 expression levels (Figure 8E and F) than the adjacent tissues (Figure 8B and 8C). This result highlighted the notable upregulation of ITGA11 expression in gastric cancer tissue compared to the adjacent noncancerous tissue and emphasized its potential significance in gastric cancer development.
Discussion
Recently, it was reported that ITGA11 was dysregulated and associated with poor prognosis in diverse cancers.22 ITGA11 expression is high in non-small cell lung cancer, esophageal cancer, colorectal adenocarcinoma, and breast cancer, driving cancer cell proliferation, migration, and invasion, which are closely linked to tumor recurrence.7,11–13 In the present study, bioinformatics analysis of STAD tissues revealed significantly elevated ITGA11 expression compared to that in paracancerous tissues. Patients with STAD with ITGA11 overexpression had a lower survival rate, indicating that ITGA11 is a robust diagnostic and prognostic indicator. Correlation analyses of clinicopathological parameters revealed a significant link between high ITGA11 expression, invasion depth, and patients’ survival status. Both univariate and multivariate analyses suggested the potential of ITGA11 as an independent prognostic factor for gastric cancer. Thus, ITGA11 might be a new potential STAD diagnosis and prognosis biomarker.
The ITGA11-associated DEGs in STAD underwent GO/KEGG and GSEA functional enrichment analysis to predict ITGA11 function. The analysis revealed ITGA11 involvement in STAD tumor progression, immune system activation, tumorigenesis mechanisms, PI3K–AKT pathway activation, and other signaling cascades. Furthermore, ssGSEA demonstrated that high ITGA11 expression correlated with increased CD8+ T cell, macrophage, dendritic cell, and NK cell infiltration. Therefore, ITGA11 is closely related to regulating the tumor immune microenvironment and promotes tumor progression by participating in coordinating antigen presentation, cellular immunity, and humoral immunity. Immunity is critical in tumor promotion and tumor protection.23 Cancer cells exploit signaling pathways to induce checkpoint molecule overexpression and reduce autoimmune response amplitude, thereby suppressing tumor immunity, which is a key immune resistance mechanism.24,25 Therefore, searching for immune-related biomarkers is critical to developing new cancer therapies. In the present study, correlation analysis demonstrated a positive association between ITGA11 and immune checkpoint expression levels (PDCD1, CD274, PDCD1LG2, CTLA4, HAVCR2, LILRB1, SIRPA, LAG3, CD8A, and TIGIT). Thus, high ITGA11 expression might have a better effect on immune checkpoint inhibition.
The ITGA11 PPI network was predicted and constructed, and 10 hub genes that synergistically interact with ITGA11 were identified. BGN, LOX, POSTN, FN1, COL1A1, COL1A2, COL3A1, SPARC, and MMP2 are highly expressed in gastric cancer and associated with poor prognosis.26–33 These genes facilitate tumor progression by participating in collagen synthesis, extracellular matrix construction, CAF activation, promotion of tumor cell migration, local invasion, and lymph node metastasis.31,34–40 These findings provided insight into the role of ITGA11 in STAD and directions for treatment.
Gastric cancer is frequently diagnosed at an advanced stage and has limited treatment options, primarily centered on cytotoxic chemotherapy. Currently, the HER2 antibody trastuzumab is the sole targeted therapy for gastric cancer, while the pan-HER inhibitor afatinib is under clinical investigation.41 In the present study, drug sensitivity analysis based on ITGA11 expression level conducted to guide clinical treatment revealed that high ITGA11 expression correlated with reduced STAD sensitivity to oxaliplatin, the first-line chemotherapy drug, and afatinib, the pan-HER inhibitor.
The treatment landscape for advanced gastric cancer presents significant challenges, necessitating the exploration of novel anti-tumor therapeutic agents. Given the increased expression of immune checkpoints, immunosuppression appears promising as a breakthrough for treating patients with STAD with elevated ITGA11 expression. Finally, the present study confirmed the increased ITGA11 expression in tumor tissues through RT-qPCR and IHC, highlighting ITGA11 as an immune-related biomarker for diagnosing and prognosticating gastric cancer. The findings provided insight into ITGA11’s function for future research on STAD.
The present study underscores the potential of ITGA11 as a diagnostic and prognostic marker for STAD. However, the study’s limitations should be acknowledged. Although a correlation between ITGA11 and immune infiltration was established, the precise molecular mechanism remains elusive. The reduced sensitivity to oxaliplatin treatment among patients with high ITGA11 expression remains unverified experimentally. Lastly, the therapeutic approach for patients with elevated ITGA11 expression warrants further investigation.
Conclusion
ITGA11 is highly expressed in STAD and is a sensitive diagnostic and prognostic factor with potential as a therapeutic target for STAD. ITGA11 expression was associated with immune infiltration, which might promote STAD progression by influencing the tumor immune microenvironment.
Acknowledgments
The authors would like to thank TCGA, GEO databases, TIMER database, online website Kaplan-Meier Plotter, and Guangxi Medical University for providing platforms.
Funding
There is no funding to report.
Disclosure
The authors declare that the research was conducted without any commercial or financial relationships that could be construed as a potential conflict of interest.
References
1. Bray F, Ferlay J, Soerjomataram I, Siegel RL, Torre LA, Jemal A. Global cancer statistics 2018: GLOBOCAN estimates of incidence and mortality worldwide for 36 cancers in 185 countries. CA Cancer J Clin. 2018;68(6):394–424. doi:10.3322/caac.21492
2. Thrift AP, Wenker TN, El-Serag HB. Global burden of gastric cancer: epidemiological trends, risk factors, screening and prevention. Nat Rev Clin Oncol. 2023;20(5):338–349. doi:10.1038/s41571-023-00747-0
3. Morgan E, Arnold M, Camargo MC, et al. The current and future incidence and mortality of gastric cancer in 185 countries, 2020–40: a population-based modelling study. EClinicalMedicine. 2022;47:101404. doi:10.1016/j.eclinm.2022.101404
4. Jinling J, Chenfei Z, Chao W, Liqin Z, Junwei W, Jun Z. Advanced progress in research and diagnosis of gastric cancer in 2022. China Oncology. 2023;33(04):303–314.
5. Qi CS, Cheng SY, Shen L. Current status and research progress of third-line treatment for patients with gastric cancer in China. Zhonghua zhong liu za zhi. 2020;42(12):983–988. doi:10.3760/cma.j.cn112152-20190910-00589
6. Iwai M, Tulafu M, Togo S, et al. Cancer-associated fibroblast migration in non-small cell lung cancers is modulated by increased integrin α11 expression. Mol Oncol. 2021;15(5):1507–1527. doi:10.1002/1878-0261.12937
7. Primac I, Maquoi E, Blacher S, et al. Stromal integrin α11 regulates PDGFR-β signaling and promotes breast cancer progression. J Clin Invest. 2019;129(11):4609–4628. doi:10.1172/JCI125890
8. Martínez-Nieto GA, Teppo HR, Petrelius N, et al. Upregulated integrin α11 in the stroma of cutaneous squamous cell carcinoma promotes skin carcinogenesis. Front Oncol. 2022;12:981009. doi:10.3389/fonc.2022.981009
9. Ainiwaer J, Zhang L, Niyazi M, et al. Alpha protein kinase 2 promotes esophageal cancer via integrin alpha 11. Biomed Res Int. 2022;2022:7676582. doi:10.1155/2022/7676582
10. Wang G, Sun D, Li W, Xin Y. CircRNA_100290 promotes GC cell proliferation and invasion via the miR-29b-3p/ITGA11 axis and is regulated by EIF4A3. Can Cell Inter. 2021;21(1):324. doi:10.1186/s12935-021-01964-2
11. Zhang H, Zhang L, Lu M. Inhibition of integrin subunit alpha 11 restrains gastric cancer progression through phosphatidylinositol 3-kinase/Akt pathway. Bioengineered. 2021;12(2):11909–11921. doi:10.1080/21655979.2021.2006551
12. Fan Z, Luo G, Gong Y, Liu C, Yu X. ASO author reflections: c-reactive protein/lymphocyte ratio as a promising marker for predicting survival in pancreatic cancer. Ann Surg Oncol. 2020;27(10):4026–4027. doi:10.1245/s10434-020-08335-7
13. Song H, Li H, Ding X, et al. Long non‑coding RNA FEZF1‑AS1 facilitates non‑small cell lung cancer progression via the ITGA11/miR‑516b‑5p axis. Int j Oncol. 2020;57(6):1333–1347. doi:10.3892/ijo.2020.5142
14. Yu J, Yang K, Zheng J, Sun X, Zhao W. Establishment of a novel prognostic signature based on an identified expression profile of integrin superfamily to predict overall survival of patients with colorectal adenocarcinoma. Gene. 2022;808:145990. doi:10.1016/j.gene.2021.145990
15. Smeland HY, Askeland C, Wik E, et al. Integrin α11β1 is expressed in breast cancer stroma and associates with aggressive tumor phenotypes. J Pathol Clin Res. 2020;6(1):69–82. doi:10.1002/cjp2.148
16. Pan Y, Liu G, Yuan Y, Zhao J, Yang Y, Li Y. Analysis of differential gene expression profile identifies novel biomarkers for breast cancer. Oncotarget. 2017;8(70):114613–114625. doi:10.18632/oncotarget.23061
17. Ando T, Kage H, Matsumoto Y, et al. Integrin α11 in non-small cell lung cancer is associated with tumor progression and postoperative recurrence. Cancer Sci. 2020;111(1):200–208. doi:10.1111/cas.14257
18. Carracedo S, Lu N, Popova SN, Jonsson R, Eckes B, Gullberg D. The fibroblast integrin alpha11beta1 is induced in a mechanosensitive manner involving activin A and regulates myofibroblast differentiation. J Biol Chem. 2010;285(14):10434–10445. doi:10.1074/jbc.M109.078766
19. Navab R, Strumpf D, To C, et al. Integrin α11β1 regulates cancer stromal stiffness and promotes tumorigenicity and metastasis in non-small cell lung cancer. Oncogene. 2016;35(15):1899–1908. doi:10.1038/onc.2015.254
20. Parajuli H, Teh MT, Abrahamsen S, et al. Integrin α11 is overexpressed by tumour stroma of head and neck squamous cell carcinoma and correlates positively with alpha smooth muscle actin expression. J Oral Pathol Med. 2017;46(4):267–275. doi:10.1111/jop.12493
21. Ramsay AG. Immune checkpoint blockade immunotherapy to activate anti-tumour T-cell immunity. Br. J. Haematol. 2013;162(3):313–325. doi:10.1111/bjh.12380
22. Chen DS, Mellman I. Oncology meets immunology: the cancer-immunity cycle. Immunity. 2013;39(1):1–10. doi:10.1016/j.immuni.2013.07.012
23. Baumeister SH, Freeman GJ, Dranoff G, Sharpe AH. Coinhibitory pathways in immunotherapy for cancer. Ann Rev Immunol. 2016;34:10434–10445. doi:10.1146/annurev-immunol-032414-112049
24. Pardoll DM. The blockade of immune checkpoints in cancer immunotherapy. Nat Rev Cancer. 2012;12(4):252–264. doi:10.1038/nrc3239
25. Fuchs CS, Doi T, Jang RW, et al. Safety and efficacy of pembrolizumab monotherapy in patients with previously treated advanced gastric and gastroesophageal junction cancer: phase 2 clinical KEYNOTE-059 trial. JAMA Oncol. 2018;4(5):e180013. doi:10.1001/jamaoncol.2018.0013
26. Shitara K, Ajani JA, Moehler M, et al. Nivolumab plus chemotherapy or ipilimumab in gastro-oesophageal cancer. Nature. 2022;603(7903):942–948. doi:10.1038/s41586-022-04508-4
27. Huang G, Xiang Z, Wu H, et al. The lncRNA SEMA3B-AS1/HMGB1/FBXW7 axis mediates the peritoneal metastasis of gastric cancer by regulating BGN protein ubiquitination. Oxid Med Cell Longev. 2022;2022:5055684. doi:10.1155/2022/5055684
28. Ma LJ, Li YG, Huang L, et al. 赖氨酰氧化酶和基质金属蛋白酶2在胃癌组织中的表达及其与胃癌转移的关系 [Expression of LOX and MMP-2 in gastric cancer tissue and the effects of LOX and MMP-2 on tumor invasion and metastasis]. Zhonghua Zhong Liu Za Zhi. 2011;33(1):37–41.
29. Lu S, Peng L, Ma F, et al. Increased expression of POSTN predicts poor prognosis: a potential therapeutic target for gastric cancer. J Gastrointest Surg. 2023;27(2):233–249. doi:10.1007/s11605-022-05517-4
30. Li L, Zhu Z, Zhao Y, et al. FN1, SPARC, and SERPINE1 are highly expressed and significantly related to a poor prognosis of gastric adenocarcinoma revealed by microarray and bioinformatics. Sci Rep. 2019;9(1):7827. doi:10.1038/s41598-019-43924-x
31. Li J, Ding Y, Li A. Identification of COL1A1 and COL1A2 as candidate prognostic factors in gastric cancer. World J Surg Oncol. 2016;14(1):297. doi:10.1186/s12957-016-1056-5
32. Nie K, Shi L, Wen Y, et al. Identification of hub genes correlated with the pathogenesis and prognosis of gastric cancer via bioinformatics methods. Minerva Med. 2020;111(3):213–225. doi:10.23736/S0026-4806.19.06166-4
33. Sun J, Bai YK, Fan ZG. Clinicopathological and prognostic significance of SPARC expression in gastric cancer: a meta‑analysis and bioinformatics analysis. Oncol Lett. 2023;25(6):240. doi:10.3892/ol.2023.13826
34. Dong Z, Guo S, Wang Y, et al. USP19 enhances MMP2/MMP9-mediated tumorigenesis in gastric cancer. Onco Targets Ther. 2020;13:8495–8510. doi:10.2147/OTT.S240543
35. Feng G, Tan Y. 基质金属蛋白酶及Ⅳ型胶原在胃癌中的表达及其意义 [Expression and significance of MMP2 and type IV collagen in gastric cancer]. Zhonghua Wai Ke Za Zhi. 2000;38(10):775–7, 45.
36. Franke K, Carl-McGrath S, Röhl FW, et al. Differential expression of SPARC in intestinal-type gastric cancer correlates with tumor progression and nodal spread. Transl Oncol. 2009;2(4):310–320. doi:10.1593/tlo.09169
37. Chen ZY, Zhang JL, Yao HX, et al. Aberrant methylation of the SPARC gene promoter and its clinical implication in gastric cancer. Sci Rep. 2014;4:7035. doi:10.1038/srep07035
38. Li J, Chen C, Chen B, Guo T. High FN1 expression correlates with gastric cancer progression. Pathol Res Pract. 2022;239:154179. doi:10.1016/j.prp.2022.154179
39. Zhao Z, Zhang Y, Guo E, Zhang Y, Wang Y. Periostin secreted from podoplanin-positive cancer-associated fibroblasts promotes metastasis of gastric cancer by regulating cancer stem cells via AKT and YAP signaling pathway. Mol Carcinog. 2023;62(5):685–699. doi:10.1002/mc.23517
40. Lai H, Jin Q, Lin Y, et al. Combined use of lysyl oxidase, carcino-embryonic antigen, and carbohydrate antigens improves the sensitivity of biomarkers in predicting lymph node metastasis and peritoneal metastasis in gastric cancer. Tumour Biol. 2014;35(10):10547–10554. doi:10.1007/s13277-014-2355-5
41. Barker HE, Cox TR, Erler JT. The rationale for targeting the LOX family in cancer. Nat Rev Cancer. 2012;12(8):540–552. doi:10.1038/nrc3319
 © 2024 The Author(s). This work is published and licensed by Dove Medical Press Limited. The full terms of this license are available at https://www.dovepress.com/terms.php and incorporate the Creative Commons Attribution - Non Commercial (unported, v3.0) License.
By accessing the work you hereby accept the Terms. Non-commercial uses of the work are permitted without any further permission from Dove Medical Press Limited, provided the work is properly attributed. For permission for commercial use of this work, please see paragraphs 4.2 and 5 of our Terms.

