Back to Journals » International Journal of Chronic Obstructive Pulmonary Disease » Volume 10 » Issue 1
Iterative reconstruction for quantitative computed tomography analysis of emphysema: consistent results using different tube currents
Authors Yamashiro T ![]() , Miyara T, Honda O, Tomiyama N, Ohno Y, Noma S, Murayama S
, Miyara T, Honda O, Tomiyama N, Ohno Y, Noma S, Murayama S
Received 23 September 2014
Accepted for publication 1 December 2014
Published 11 February 2015 Volume 2015:10(1) Pages 321—327
DOI https://doi.org/10.2147/COPD.S74810
Checked for plagiarism Yes
Review by Single anonymous peer review
Peer reviewer comments 2
Editor who approved publication: Prof. Dr. Richard Russell
Tsuneo Yamashiro,1 Tetsuhiro Miyara,1 Osamu Honda,2 Noriyuki Tomiyama,2 Yoshiharu Ohno,3 Satoshi Noma,4 Sadayuki Murayama1
On behalf of the ACTIve Study Group
1Department of Radiology, Graduate School of Medical Science, University of the Ryukyus, Nishihara, Okinawa, Japan; 2Department of Radiology, Osaka University Graduate School of Medicine, Suita, Osaka, Japan; 3Department of Radiology, Kobe University Graduate School of Medicine, Kobe, Hyogo, Japan; 4Department of Radiology, Tenri Hospital, Tenri, Nara, Japan
Purpose: To assess the advantages of iterative reconstruction for quantitative computed tomography (CT) analysis of pulmonary emphysema.
Materials and methods: Twenty-two patients with pulmonary emphysema underwent chest CT imaging using identical scanners with three different tube currents: 240, 120, and 60 mA. Scan data were converted to CT images using Adaptive Iterative Dose Reduction using Three Dimensional Processing (AIDR3D) and a conventional filtered-back projection mode. Thus, six scans with and without AIDR3D were generated per patient. All other scanning and reconstruction settings were fixed. The percent low attenuation area (LAA%; < -950 Hounsfield units) and the lung density 15th percentile were automatically measured using a commercial workstation. Comparisons of LAA% and 15th percentile results between scans with and without using AIDR3D were made by Wilcoxon signed-rank tests. Associations between body weight and measurement errors among these scans were evaluated by Spearman rank correlation analysis.
Results: Overall, scan series without AIDR3D had higher LAA% and lower 15th percentile values than those with AIDR3D at each tube current (P<0.0001). For scan series without AIDR3D, lower tube currents resulted in higher LAA% values and lower 15th percentiles. The extent of emphysema was significantly different between each pair among scans when not using AIDR3D (LAA%, P<0.0001; 15th percentile, P<0.01), but was not significantly different between each pair among scans when using AIDR3D. On scans without using AIDR3D, measurement errors between different tube current settings were significantly correlated with patients’ body weights (P<0.05), whereas these errors between scans when using AIDR3D were insignificantly or minimally correlated with body weight.
Conclusion: The extent of emphysema was more consistent across different tube currents when CT scans were converted to CT images using AIDR3D than using a conventional filtered-back projection method.
Keywords: emphysema, iterative reconstruction, Adaptive Iterative Dose Reduction using Three Dimensional Processing, computed tomography
Introduction
Quantitative analysis of emphysema using computed tomography (CT) is a reliable, reproducible method for evaluating the severity or extent of emphysema. In the field of imaging for chronic obstructive pulmonary disease (COPD), CT-based quantitative analyses of emphysema have been extensively investigated and have proved to be predictors of spirometric values, similar to quantitative measurements of airway walls.1–4 Based on developments in imaging technology, many commercially available workstations can now provide fully automated quantitative analysis of emphysema using three-dimensional CT techniques, which enables researchers to more thoroughly understand the progression or distribution of emphysema.
However, it has also been reported that quantitative analyses of emphysema are sensitive to technical factors during CT scanning or reconstruction.5–10 Both differences in CT manufacturers or scanners and several imaging factors can affect the results, such as radiation dose settings, reconstruction kernels, or slice thickness. For example, it is well known that using sharp reconstruction kernels (for lung or bone) usually results in overestimating the extent of emphysema; therefore, standard kernels (for soft tissue) are recommended for CT-based quantitative analysis of emphysema.5,6 It is also known that different tube current settings result in inconsistent measurements, which result in overestimating the extent of emphysema when using lower tube current settings.7,8
The most important developments in CT technology during the last half decade have been iterative reconstruction (IR) techniques, which have been applied to all major multidetector-row CT (MDCT) scanners and have created a new generation of reconstruction methods. Compared with conventional filtered-back projection (FBP) methods, IR is characterized by multiple iteration cycles during the reconstruction process until final output images are created and often enhances input images by using various statistical models. All major CT vendors have released their original IR techniques, which include Sinogram Affirmed Iterative Reconstruction (SAFIRE) and Advanced Modeled Iterative Reconstruction (ADMIRE) by Siemens Healthcare, Adaptive Statistical Iterative Reconstruction (ASIR) and Model Based Iterative Reconstruction (MBIR) by GE Healthcare, Adaptive Iterative Dose Reduction using Three Dimensional Processing (AIDR3D) by Toshiba Medical Systems, and Iterative Model Reconstruction (IMR) by Philips Healthcare. Although the characteristics of these IR methods differ, it has been accepted that all of these IR methods can dramatically reduce image noise and improve image quality for chest CT.11–13
Although IR can be considered as a revolution in CT imaging, published information on the effects of IR for quantitative analysis of COPD is quite limited.14–17 Some reports have demonstrated that there were systematic differences in the extent of emphysema between scans when using IR and those when using FBP. However, it remains ambiguous as to which technique is more reliable or robust for quantitative analysis of emphysema. If an IR method truly reduces image noise and improves image quality, then it can be hypothesized that one advantage of IR would be consistent measurements at different tube current settings.
Thus, the aims of this study were to clarify the effects of IR on quantitative analysis of emphysema and to make comparisons with a conventional FBP method.
Materials and methods
This study was conducted as part of the Area-detector Computed Tomography for the Investigation of Thoracic Diseases (ACTIve) Study, an ongoing multicenter research project in Japan. The research committee of the study project outlined and approved our study protocols. This study was planned as a supplementary analysis after our previous research,13 which did not include any quantitative measurements of pulmonary emphysema.
The Institutional Review Board of each participating institution approved this study: Kobe University, Osaka University, Tenri Hospital, and University of the Ryukyus. Written informed consent was obtained from all enrolled patients.
Patients
From January to July of 2012, a total of 133 patients were initially enrolled for this study at the participating institutions. Our primary inclusion criteria were: 1) adult patients (≥20 years old); 2) provided fully informed consent; and 3) plain chest CT was planned as a part of routine clinical care for assessing known or suspected chest diseases, such as primary lung cancer, lung metastasis, emphysema, interstitial lung disease, or lymphadenopathy.
Some of these 133 patients were preliminarily assessed in our previous research for a different purpose.13 After the CT scans of all subjects were reviewed by a board-certified radiologist of the Japan Radiological Society (TY, with 13 years’ experience in thoracic radiology), 22 patients with visible pulmonary emphysema on chest CT were selected for this quantitative investigation. We did not include patients with sub-pleural bullae who did not have pulmonary emphysema. The enrolled patients included four women and 18 men. Their mean age was 67±11 years and mean body weight was 60.6±12.3 kg.
CT protocols
During a single visit, the 22 patients underwent plain chest CT (64-row helical mode) using identical 320-row MDCT scanners (Aquilion ONE, Toshiba Medical Systems, Otawara, Tochigi, Japan). Each subject was scanned three times at full inspiration, using different tube currents (240, 120, and 60 mA) with the same rotation time (0.35 sec). Thus, the final current settings were 84, 42, and 21 mAs. Patients were coached before scanning to hold their breath consistently during the three scanning times.
A scanning field of view was selected from two settings by radiological technologists based on a patient’s body habitus: 320 mm (medium) or 400 mm (large). Other scanning and reconstruction settings were fixed: tube voltage =120 kVp; collimation =0.5 mm; beam pitch =0.828 (helical pitch =53); imaging field of view =320 mm; slice thickness =1 mm (without image interval or overlapping); and reconstruction kernel = FC13 (for mediastinum).
Scan data were converted to CT images using AIDR3D (“standard” setting) and a conventional FBP method (Boost3D = without AIDR3D). Thus, six CT series with or without AIDR3D were made for each patient.
Radiation exposure was assessed using the volume CT dose index and the dose-length product (DLP), which were provided by the scanner as dose information for each patient. The effective radiation dose was obtained by multiplying DLP by a weighting factor for the chest (0.0145).
Quantitative analysis of lung densitometry and emphysema
All CT images were analyzed using a commercial workstation (Synapse Vincent, Fujifilm Medical, Minato-ku, Tokyo, Japan).18 A board-certified radiologist (TM, with 12 years’ experience in thoracic radiology) checked and obtained the following CT indices from the workstation: lung volume (LV), mean lung density (MLD), percent low attenuation area (LAA%, < −950 Hounsfield unit), and 15th percentile.
Image noise analysis
Using a different workstation viewer (ZioTerm 2009, Ziosoft, Minato-ku, Tokyo, Japan), a circular region of interest (ROI) with a radius of 10 mm was placed on the aortic arch by a single observer (TY).13 Image noise at each ROI was determined as the standard deviation of the CT values within the ROI. Because this analysis required measuring comparable regions on the aortic arch on different scan series, all six series with and without AIDR3D from a single patient were displayed simultaneously and set side-by-side on the screen. Thus, the observer was aware of the scanning protocol used for each scan series.
Statistical analysis
Comparisons of CT indices between scans with and without using AIDR3D at each tube current were made by Wilcoxon signed-rank tests. For each reconstruction method, comparisons of CT indices between each pair of three tube current settings were made by Bonferroni corrections. Possible associations between body weight and measurement errors (LAA% and 15th percentile) and with quantitative image noise were assessed by Spearman rank correlation analysis. A P-value of <0.05 was considered significant. All statistical analyses were done using JMP 8.0 software (SAS Institute Inc., Cary, NC, USA).
Results
Radiation dose assessments
Two CT dose index volume settings were used in this study based on a patient’s body habitus: either 8.6, 4.3, or 2.2 mGy for, respectively, 240, 120, or 60 mA (n=14; those with a small or medium body habitus) or 9.5, 4.7, or 2.4 mGy (n=8, large habitus). Mean DLP values for 240, 120, and 60 mA were 337.9, 167.3, and 83.7 mGy·cm, respectively. The mean effective radiation dose for the entire protocol used in this study was 8.54±1.08 mSv (range: 7.20–10.25 mSv).
Quantitative measurements of lung indices and image noise
Table 1 shows the measured values for all lung indices (LV, MLD, LAA%, and 15th percentile) and image noise. Although LV was slightly larger at each tube current on scans with AIDR3D than on those without AIDR3D, higher MLD, lower LAA%, and higher 15th percentile values were obtained on scans with AIDR3D than on those without AIDR3D (Figure 1). The differences in these four CT indices between scans with and without AIDR3D were judged to be significant (P<0.0001). Also, at each tube current, significantly less image noise was observed on scans with AIDR3D than on those without AIDR3D (P<0.0001; Figure 2).
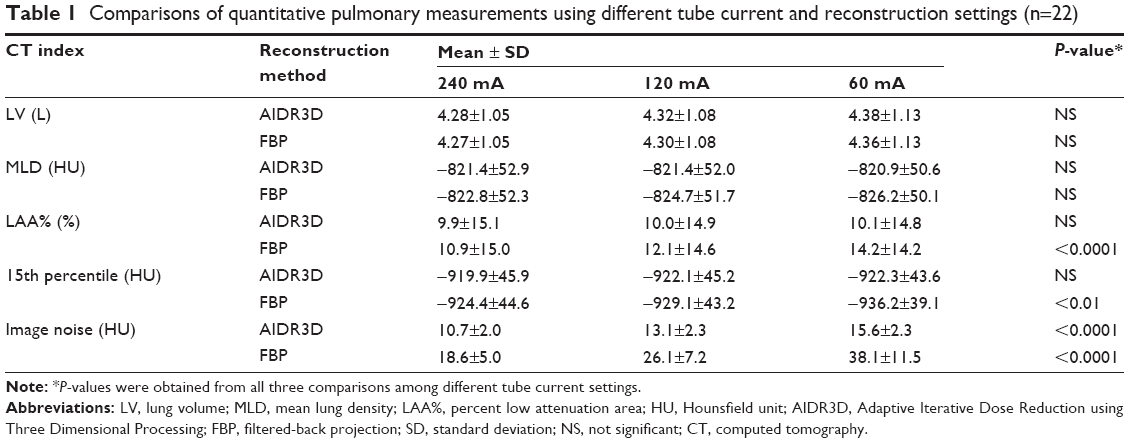 | Table 1 Comparisons of quantitative pulmonary measurements using different tube current and reconstruction settings (n=22) |
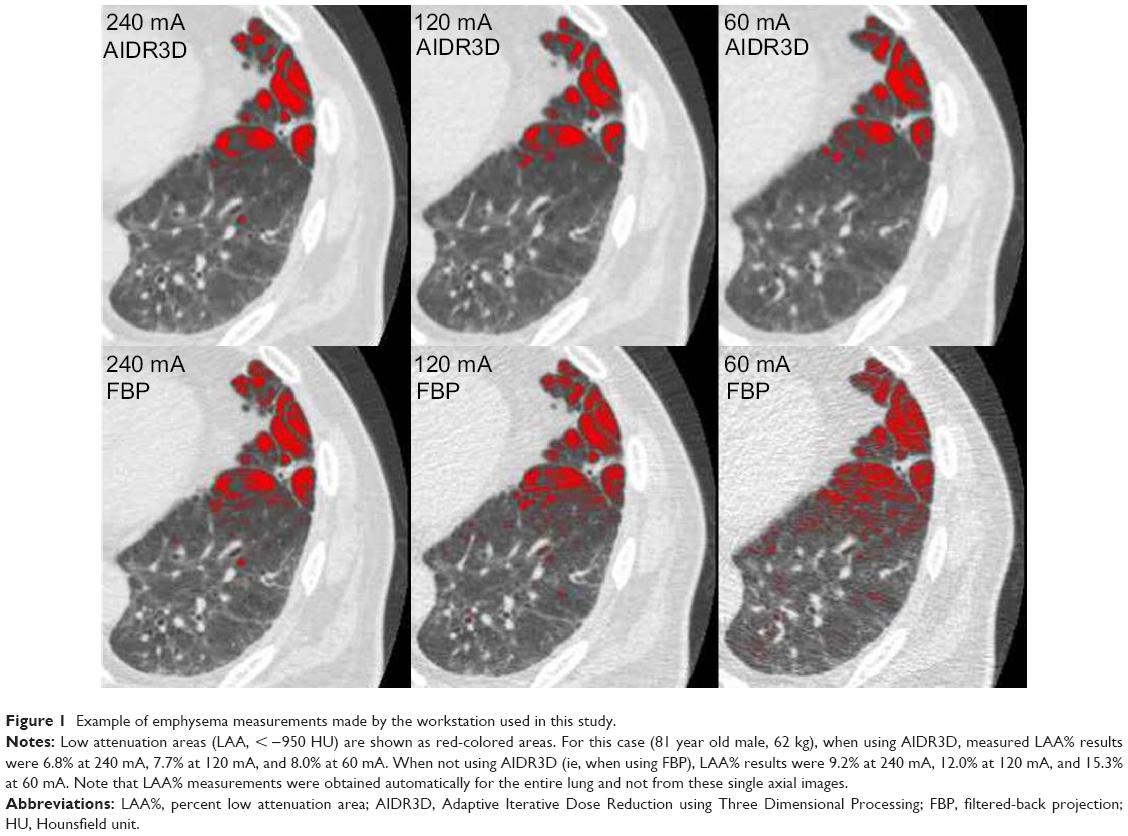 | Figure 1 Example of emphysema measurements made by the workstation used in this study. |
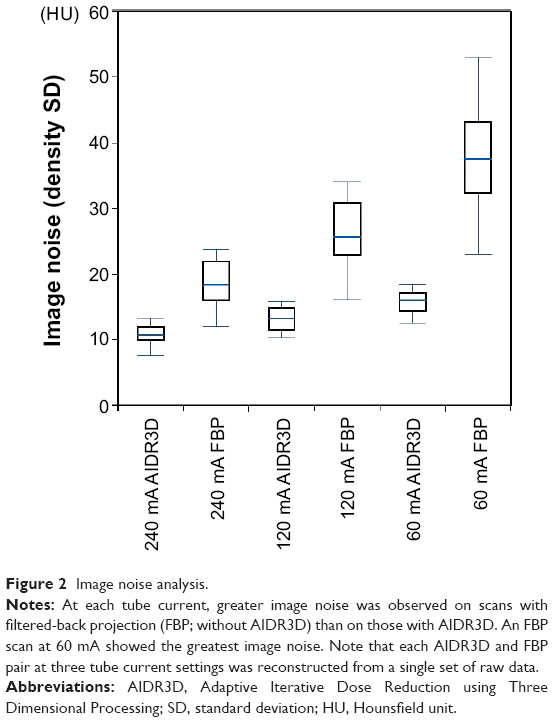 | Figure 2 Image noise analysis. |
As shown in Table 1, when the tube current was decreased from 240 to 60 mA for scan series without AIDR3D, lower tube currents resulted in higher LAA% values and lower 15th percentiles. The differences in measures between 240 and 120 mA, between 120 and 60 mA, and between 240 and 60 mA were judged to be significant (LAA%, P<0.0001; 15th percentile, P<0.01). However, on scans with AIDR3D, the differences in measures of LAA% and 15th percentile among the three tube current settings were not significant, although very slight increases in LAA% and decreases in 15th percentiles were observed by changing the tube current from 240 to 60 mA.
Thus, using AIDR3D resulted in less severe but more consistent emphysema measurements for different tube current settings than when using the conventional FBP method.
Associations between body weight and measurement errors in LAA% and 15th percentile for different tube currents
On scans without AIDR3D, measurement errors for LAA% and 15th percentiles between different tube current settings were significantly correlated with subjects’ body weights (P<0.05; Table 2), whereas these errors between scans when using AIDR3D were insignificantly or minimally correlated with body weight. Thus, using AIDR3D reduced the effects of body habitus on LAA% and 15th percentile results. Similar findings were made for our image noise analysis (Table 2).
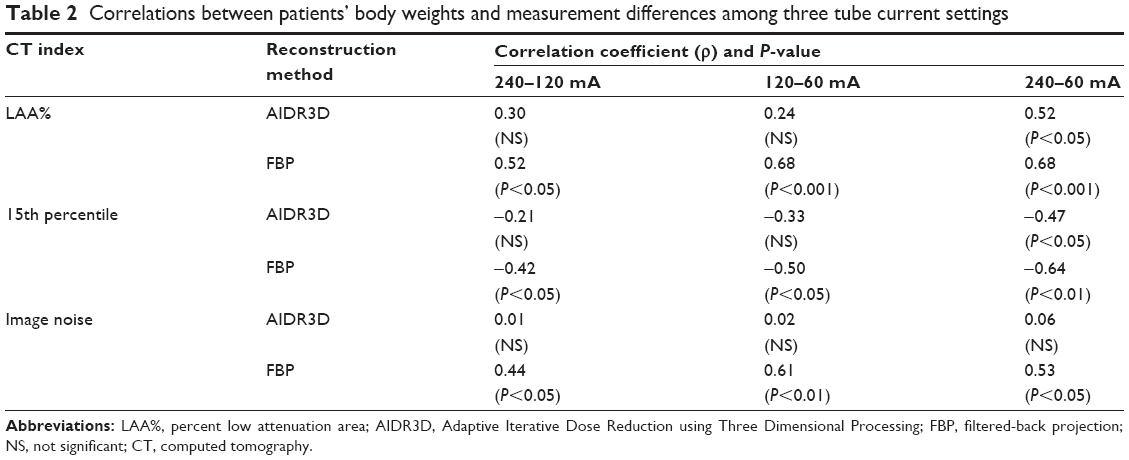 | Table 2 Correlations between patients’ body weights and measurement differences among three tube current settings |
Discussion
In this study, we made three observations regarding the use of IR for CT-based quantitative analysis of emphysema. 1) The extent of emphysema was more consistent across three different tube currents on CT images when using AIDR3D than on CT images when using FBP. 2) Similar to previous studies that used different IR techniques,5–9 using AIDR3D resulted in slightly higher MLD, smaller LAA%, and higher 15th percentile values than when using conventional FBP. 3) Measurement errors for LAA% or 15th percentiles were correlated with patients’ body weights on scans without AIDR3D, and were minimized on scans with AIDR3D. Based on these observations, we believe that using IR should be recommended for quantitative analysis of emphysema to reduce measurement errors that are caused by tube current settings and body habitus; however, investigators must be aware that there will inevitably be differences in measured values between scans using IR and those using FBP.
Although there have been a few reports regarding the effects of IR on CT-based quantitative analysis of emphysema,14–17 it remains unclear whether IR can provide truly “better” measurements than conventional FBP methods. In this study, by using three different dose settings, we demonstrated that there were increases in LAA% or decreases in 15th percentile results due to artifacts at lower tube current settings when using the FBP method and these errors were clearly reduced or controlled when using IR (AIDR3D). Better stabilized and more consistent measurements at different dose settings or for patients with different body habitus may enable researchers to select lower radiation dose settings and use automatic exposure control in future COPD studies. Although it remains difficult to explain why AIDR3D can stabilize measurements, the following explanation is plausible for understanding this phenomenon. It is known that when using conventional FBP methods, sharper reconstruction kernels result in higher LAA% or lower 15th percentile values as compared to using standard kernels.5,6 These sharp kernels, which are frequently applied to chest CT for edge-enhancement and better acutance of small pulmonary structures, involve much greater image noise than do standard kernels.5,13 When using these sharp kernels, artifact density dispersion (density heterogeneity) that is caused by added image noise directly causes an increase in LAA% and a decrease in the 15th percentile, which results in overestimating emphysema severity.5 This relationship regarding image noise differences between sharp and standard kernels can be expanded to that between FBP and IR. Because IR methods greatly reduce image noise, LAA% and 15th percentile are less affected by image noise on scans when using IR, as compared to those when using FBP. Further, even when a significant amount of image noise is anticipated, such as when scanning at a lower tube current or scanning larger patients, IR still powerfully reduces image noise (Figure 2). For these situations, conventional FBP gradually loses control over image noise and, thus, emphysema overestimation caused by greater density heterogeneity appears at lower tube current settings or for larger patients, similar to when using sharper kernels. However, the increase in image noise for these situations is much less when using IR, which probably provides for better stabilized, more consistent measurements.
Although we only used AIDR3D in this study, we believe that similar advantages of IR techniques for more stable measurements will be common among scanners from other manufacturers when considering that all IR methods greatly reduce image noise.12–16,19–21 Stabilizing CT-based emphysema measurements by using IR would be a breakthrough for using CT data in clinical care for COPD and for generating a larger study cohort using different CT scanners. CT-based COPD analysis invariably involves limitations with regard to standardizing measurements between different models and generations of CT scanners,22 which may be avoided or reduced by using IR methods. Longitudinal CT observations of COPD patients for longer periods or consolidating CT data from multiple institutions may also be achieved by using IR.
This study had several limitations. First, the number of patients was relatively small. However, because the entire process, including image generation and quantitative measurements, was completely automatic, we strongly believe that our results were not unduly skewed due to the small sample size. Second, because our aim was not to investigate quantitative airway analysis, the advantages of IR for airway analysis should be evaluated in additional studies.17 Third, we did not clearly demonstrate a direct association between image noise and changes in emphysema indices due to artifacts. However, several previous studies did demonstrate possible correlations between image noise and measurement errors during the quantitative analysis of emphysema.5–9 Fourth, we did not determine whether or not IR provided stronger correlations between emphysema measurements and spirometric values, as spirometry was not performed for this study. This should be investigated in future studies.
In conclusion, IR, represented by AIDR3D in this study, provides consistent measurements of LAA% and 15th percentile results at different tube current settings as compared with those using a conventional FBP method.
Acknowledgments
The authors thank Mr Hiroyasu Inokawa, Mr Shinsuke Tsukagoshi, and Mr Yasuo Saito (Toshiba Medical Systems Corporation) for their technical support. The authors also thank Dr Shin Matsuoka, Dr George R Washko, and Dr Raul San Jose Estepar for their helpful suggestions.
The ACTIve Study Group includes the following institutions:
Ohara General Hospital, Fukushima-shi, Fukushima, Japan (Koutaro Sakuma, MD, Hiroshi Moriya, MD, PhD); Shiga University of Medical Science, Otsu, Shiga, Japan (Yukihiro Nagatani, MD, Norihisa Nitta, MD, Masashi Takahashi, MD, Kiyoshi Murata, MD); Osaka University, Suita, Osaka, Japan (Osamu Honda, MD, PhD, Noriyuki Tomiyama, MD, PhD); Osaka Medical College, Takatsuki, Osaka, Japan (Mitsuhiro Koyama, MD, PhD, Mitsuru Matsuki, MD, PhD). Tenri Hospital, Tenri, Nara, Japan (Ryo Sakamoto, MD, Yuko Nishimoto, MD, Satoshi Noma, MD, PhD); Kobe University, Kobe, Hyogo, Japan (Hisanobu Koyama, MD, PhD, Yoshiharu Ohno, MD, PhD, Kazuro Sugimura, MD); Okayama University, Okayama-shi, Okayama, Japan (Katsuya Kato, MD, PhD); University of the Ryukyus, Nishihara, Okinawa, Japan (Tetsuhiro Miyara, MD, Tsuneo Yamashiro, MD, Sadayuki Murayama, MD, PhD).
Disclosure
Each participating institution has a research grant from Toshiba Medical Systems. The authors have no other conflicts of interest to disclose.
References
Nakano Y, Muro S, Sakai H, et al. Computed tomographic measurements of airway dimensions and emphysema in smokers. Correlation with lung function. Am J Respir Crit Care Med. 2000;162(3 Pt 1):1102–1108. | ||
Mishima M, Hirai T, Itoh H, et al. Complexity of terminal airspace geometry assessed by lung computed tomography in normal subjects and patients with chronic obstructive pulmonary disease. Proc Natl Acad Sci U S A. 1999;96(16):8829–8834. | ||
Lynch DA, Al-Qaisi MA. Quantitative computed tomography in chronic obstructive pulmonary disease. J Thorac Imaging. 2013;28(5):284–290. | ||
Mets OM, de Jong PA, van Ginneken B, Gietema HA, Lammers JW. Quantitative computed tomography in COPD: possibilities and limitations. Lung. 2012;190(2):133–145. | ||
Boedeker KL, McNitt-Gray MF, Rogers SR, et al. Emphysema: effect of reconstruction algorithm on CT imaging measures. Radiology. 2004;232(1):295–301. | ||
Gierada DS, Bierhals AJ, Choong CK, et al. Effects of CT section thickness and reconstruction kernel on emphysema quantification relationship to the magnitude of the CT emphysema index. Acad Radiol. 2010;17(2):146–156. | ||
Yuan R, Mayo JR, Hogg JC, et al. The effects of radiation dose and CT manufacturer on measurements of lung densitometry. Chest. 2007;132(2):617–623. | ||
Madani A, De Maertelaer V, Zanen J, Gevenois PA. Pulmonary emphysema: radiation dose and section thickness at multidetector CT quantification – comparison with macroscopic and microscopic morphometry. Radiology. 2007;243(1):250–257. | ||
Gierada DS, Pilgram TK, Whiting BR, et al. Comparison of standard- and low-radiation-dose CT for quantification of emphysema. Am J Roentgenol. 2007;188(1):42–47. | ||
Zompatori M1, Fasano L, Mazzoli M, et al. Spiral CT evaluation of pulmonary emphysema using a low-dose technique. Radiol Med. 2002;104(1–2):13–24. | ||
Willemink MJ, de Jong PA, Leiner T, et al. Iterative reconstruction techniques for computed tomography Part 1: technical principles. Eur Radiol. 2013;23(6):1623–1631. | ||
Ohno Y, Takenaka D, Kanda T, et al. Adaptive iterative dose reduction using 3D processing for reduced and low-Dose pulmonary CT: comparison with standard-dose CT for image noise reduction and radiological findings. AJR Am J Roentgenol. 2012;199(4):W477–W485. | ||
Yamashiro T, Miyara T, Honda O, et al. Adaptive Iterative Dose Reduction using Three Dimensional Processing (AIDR3D) improves chest CT image quality and reduces radiation exposure. PLoS ONE. 2014;9(8):e105735. | ||
Nishio M, Matsumoto S, Ohno Y, et al. Emphysema quantification by low-dose CT: potential impact of adaptive iterative dose reduction using 3D processing. AJR Am J Roentgenol. 2012;199(3):595–601. | ||
Choo JY, Goo JM, Lee CH, Park CM, Park SJ, Shim MS. Quantitative analysis of emphysema and airway measurements according to iterative reconstruction algorithms: comparison of filtered back projection, adaptive statistical iterative reconstruction and model-based iterative reconstruction. Eur Radiol. 2014;24(4):799–806. | ||
Mets OM, Willemink MJ, de Kort FP, et al. The effect of iterative reconstruction on computed tomography assessment of emphysema, air trapping and airway dimensions. Eur Radiol. 2012;22(10):2103–2109. | ||
Koyama H, Ohno Y, Nishio M, et al. Iterative reconstruction technique vs filter back projection: utility for quantitative bronchial assessment on low-dose thin-section MDCT in patients with/without chronic obstructive pulmonary disease. Eur Radiol. 2014;24(8):1860–1867. | ||
Iwano S, Kitano M, Matsuo K, et al. Pulmonary lobar volumetry using novel volumetric computer-aided diagnosis and computed tomography. Interact Cardiovasc Thorac Surg. 2013;17(1):59–65. | ||
Yamada Y, Jinzaki M, Hosokawa T, et al. Dose reduction in chest CT: comparison of the adaptive iterative dose reduction 3D, adaptive iterative dose reduction, and filtered back projection reconstruction techniques. Eur J Radiol. 2012;81(12):4185–4195. | ||
Katsura M, Matsuda I, Akahane M, et al. Model-based iterative reconstruction technique for radiation dose reduction in chest CT: comparison with the adaptive statistical iterative reconstruction technique. Eur Radiol. 2012;22(8):1613–1623. | ||
Baumueller S, Winklehner A, Karlo C, et al. Low-dose CT of the lung: potential value of iterative reconstructions. Eur Radiol. 2012;22(12):2597–2606. | ||
Washko GR. Diagnostic imaging in COPD. Semin Respir Crit Care Med. 2010;31(3):276–285. |
 © 2015 The Author(s). This work is published and licensed by Dove Medical Press Limited. The
full terms of this license are available at https://www.dovepress.com/terms
and incorporate the Creative Commons Attribution
- Non Commercial (unported, 3.0) License.
By accessing the work you hereby accept the Terms. Non-commercial uses of the work are permitted
without any further permission from Dove Medical Press Limited, provided the work is properly
attributed. For permission for commercial use of this work, please see paragraphs 4.2 and 5 of our Terms.
© 2015 The Author(s). This work is published and licensed by Dove Medical Press Limited. The
full terms of this license are available at https://www.dovepress.com/terms
and incorporate the Creative Commons Attribution
- Non Commercial (unported, 3.0) License.
By accessing the work you hereby accept the Terms. Non-commercial uses of the work are permitted
without any further permission from Dove Medical Press Limited, provided the work is properly
attributed. For permission for commercial use of this work, please see paragraphs 4.2 and 5 of our Terms.