Back to Journals » Cancer Management and Research » Volume 13
Is the Fixed Periodic Treatment Effective for the Tumor System without Complete Information?
Authors Wang J, Zhang Y, Liu X, Liu H
Received 22 September 2021
Accepted for publication 11 November 2021
Published 30 November 2021 Volume 2021:13 Pages 8915—8928
DOI https://doi.org/10.2147/CMAR.S339787
Checked for plagiarism Yes
Review by Single anonymous peer review
Peer reviewer comments 3
Editor who approved publication: Dr Sanjeev K. Srivastava
Jiali Wang,1,2 Yixuan Zhang,1,2 Xiaoquan Liu,1,2 Haochen Liu1,2
1School of Pharmacy, China Pharmaceutical University, Nanjing, 210009, People’s Republic of China; 2Center of Drug Metabolism and Pharmacokinetics, China Pharmaceutical University, Nanjing, 210009, People’s Republic of China
Correspondence: Xiaoquan Liu; Haochen Liu Email [email protected]; [email protected]
Objective: The treatment plans designed with the guidance of the mathematical model and adaptive strategy can trap tumor subpopulations in a periodic and controllable loop. But this process requires detailed information about the tumor system, which is difficult to obtain. Therefore, we wondered whether the fixed periodic treatment plans designed with the typical values of population parameters could be applied to a similar tumor system without complete information.
Methods: A binary tumor system constructed by an EGFR-mutant and a KRAS-mutant cell line was used to explore the applicability of the fixed periodic treatment plans. The dynamics of this system were described by combining the Lotka-Volterra model with the framework of the nonlinear mixed-effects model. The typical values of population parameters were used to design the plans, and the robust plans were screened through parameter variation. These screened plans were examined their applicability in animal experiments and simulations.
Results: In animal experiments where system parameters vary from − 30% to 30%, the “osimertinib administration, withdrawal, FK866 administration and withdrawal” plan can trap subpopulations of the system in periodic cycles. In simulation, when there was an unknown resistant subpopulation, the screened fixed periodic treatment plans can still delay the evolution of resistance. The median outcomes of screened plans were better than conventional sequential treatment in most cases. There was no significant difference between the outcomes of the screened plan with median stability and the optimal therapy. The evolutionary trajectories of these two plans were similar.
Conclusion: According to the results, these fixed periodic plans should be tried in treatment even the information of the tumor system was incomplete.
Keywords: adaptive strategy, osimertinib resistance, tumor evolution, fixed periodic treatment plans
Introduction
Extensive subclone mutations and complex microenvironmental interaction construct tumors as a cunning enemy.1–5 This enemy is an adaptive complex system.6 The self-organization and adaptation of participants in this ecosystem have shaped the evolution of resistance and metastasis.7–10 Adaptive therapy exploits the intra-competition among participants and traps the evolution trajectory of this system within a controllable area.11–14 In the research of adaptive therapy clinical trial in metastatic prostate cancer, the frequency-dependent evolution “cycles” have been constructed with the guidance of the mathematical model.11 The frequency of each subpopulation was cycled in a succession of treatments by implementing of well-timed switching between each treatment. But sometimes, we are unable to obtain the detailed information of this tumor system. In this case, can we still design and implement this evolution “cycle”?
In terms of the targeted therapy, the above periodic treatment cycle is meaningful. Sensitive subpopulations of targeted therapy are the subpopulations with driver mutations. When sensitive subpopulations are lifted, the outgrowth of resistant subpopulations will be the bottleneck of treatment, that is, competitive release.15–17 The high-intensity selective pressure has promoted the rapid resistance evolution of targeted therapy.18 In this regard, the periodic treatment cycle can provide appropriate selective pressure and delay this evolutionary process. Mathematical model guidance is essential to achieve this periodic treatment cycle. Thus, it is still necessary to obtain the tumor system’s composition and the corresponding subpopulations’ biological properties. Generally, the amount of tumor volume or tumor marker data needs to be collected to establish the mathematical model and estimate the values of the above parameters. However, obtaining this data is tricky. The acquisition of tumor volume requires CT or MRI. According to the National Comprehensive Cancer Network guidelines, there is a period between each collection, so collecting an amount of data requires long-term follow-up. In addition, there may not be suitable tumor markers for estimating changes in tumor burden. In the case of incomplete system information, can the fixed periodic treatment cycle formulated by the typical values of population parameters trap heterogeneous individuals’ subpopulations in the approximate limit cycle? Herein, the real-time tumor composition information is also difficult to obtain, so the periodic treatment cycle is fixed.
Osimertinib is a third-generation tyrosine kinase inhibitor for EGFR-mutant non-small cell lung cancer. For the use of osimertinib, acquired resistance is an obstacle to its clinical treatment. Here, the KRAS (G12S) mutation is a potential resistant mechanism. We investigate the control of this system, which was constructed with the EGFR-mutant sensitive subpopulation and this KRAS(G12S)-mutant resistant subpopulation. The inhibition of this mutation subpopulation was considered to be achieved through metabolic intervention. Then, we explored the feasibility of the fixed periodic treatment plan when complete information is not available in this system. Furthermore, because of the instability of tumor cell chromosomes and the complexity of the tumor system, there are generally other subpopulations in the tumor. Moreover, we also wondered whether this fixed periodic treatment plan designed with the adaptive strategy could prolong the control of the unknown third subpopulation.
In this study, we mainly focused on the above two scenarios. Herein, a density-dependent model was adopted to establish a good correlation with the tumor volume. The tumor system was constructed by the EGFR-mutant sensitive and KRAS (G12S)-mutant resistant cell lines. We will screen out a fixed periodic treatment plan and apply it to the treatment of this tumor system without adjustment to test whether it is necessary to obtain enough tumor information to develop an individualized plan to induce the tumor in a periodic and controllable loop. Moreover, simulations would test the fixed periodic treatment plan’s effectiveness in the tumor system with an unknown resistant subpopulation. In summary, we wondered whether the fixed periodic treatment plan capitalized on the adaptive strategy is suitable for a type of tumor that contains similar tumor subpopulations but without complete information of tumor composition and subpopulations’ biological properties.
Methods
Cell Culture
The human lung adenocarcinoma cell lines H1975 and A549 were used to construct the tumor system. The above two cell lines were purchased from the National Collection of Authenticated Cell Cultures (Shanghai, China). Mycoplasma was detected by Gmyc-PCR kit (Yeasen, Shanghai, China, cat# 40601ES10), and these two cell lines were mycoplasma-free. EGFR (T790M) mutant H1975 is sensitive to osimertinib, KRAS (G12S) mutant A549 is resistant to osimertinib. Both cell lines were cultured in RPMI-1640 (Gibco (Thermo Fisher Scientific), Waltham, MA, USA, cat# 21870076) containing 10% fetal bovine serum (Gibco, cat# 10099141C) and 1% Penicillin-Streptomycin (5000 U/mL) (Gibco, cat# 15070063). A549 was transfected by Luciferase-puromycin resistant lentivirus (Genomeditech, Shanghai, China, cat# GM-0220PC) to express firefly luciferase. This A549/luc (firefly luciferase) cells were selected with 1.6mg/L puromycin (MedChemExpress, Shanghai, China, cat#HY-B1743A) to maintain the label protein.
Transcriptomics Data Origin and Processing
The microarray gene expression data to analyze differentially expressed genes (DEGs) between H1975 and A549 was obtained from the NCBI GEO database (accession number GSE31625). We used the limma package of R,19 and the threshold set as | log2-fold-change | > 1 and adj. P-value <0.001 to obtain DEGs. Then, protein–protein interaction (PPI) of DEGs was constructed by the STRING database. The database Genomics of Drug Sensitivity in Cancer (GDSC)20 was referenced to find an appropriate metabolic target based on the different metabolic pathway.
Western Blot Analysis
Cells were lysed and equivalent amounts of protein samples (25 μg per sample) were run on 10% SDS-PAGE gels at 60–120V constant voltage to separate them and transferred onto Immobilon-P PVDF membranes (Millipore) at a constant current (200mA for 1h). Membranes were blocked using Blocking Buffer for Wb (Beyotime, cat#P0252) for 2 h at room temperature. Membranes probed for NAMPT and GAPDH were reprobed with the Anti-NAMPT antibody (Abcam, cat#ab236873, EPR21984, 1:1000 diluted) and GAPDH Rabbit pAb (Yeasen, cat# 30202ES40, 1:3000 diluted) overnight at 4°C. Next, they were washed three times with TBS-T, followed by incubation with Peroxidase-Conjugated Goat Anti-Rabbit IgG (H+L) (Yeasen, cat#33101ES60, 1:5000 diluted) for 1 h at room temperature. Following washing with TBS-T. Densitometer and ImageJ software immunoreactivity signals were detected by enhanced chemiluminescence (Tanon 5200, Shanghai, China).
Proliferation Rate Assay
Cell viability was measured by MTT assay. Cells were seeded into 96-well plates at an appropriate density and treated with different concentrations of FK866 (MedChemExpress, cat#HY-50876) for 72 h. After treatment, culture media was removed and 100ul 0.5mg/mL MTT (Beyotime, Shanghai, China, cat# ST316) was added per well for 4 hours. Then, 100ul dimethyl sulfoxide (Beyotime, cat# ST038) dissolve formazan, the absorbance of each well at 540 nm was detected by microplate reader.
Animal
All animal care and experimental procedures were approved by the animal ethics committee of the Pharmaceutical Animal Experiment Center of China Pharmaceutical University in compliance with the Chinese law on animal welfare. Female BALB/c nude mice aged 5 to 7 weeks were purchased from Charles River and allowed to acclimatize (in groups of 3–4 mice per cage) for at least 7 days before the experiment. The mice were maintained on a 12-h light:12-h dark cycle with free access to standard rodent chow and water.
The Efficacy Experiment of FK866 in vivo
In the experiment, mice were subcutaneously inoculated with A549 or H1975 suspension (~5×10⁶ cells per mouse) in the left forelimb flank.21–23 Tumor volume was generally measured by caliper two to three times a week, and calculated according to the formula 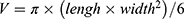 .24–26 When tumor volume reached around 100 mm3, mice with A549 or H1975 were randomly grouped according to tumor volume and weight. In the FK866 group, mice were injected intraperitoneally with FK866 (20 mg/kg) in normal saline (1% DMSO) for eight days. The vehicle control group was given the corresponding solvent without drug for eight days. The tumor volume at each time point was compared to clarify whether FK866 inhibited the growth of A549 or H1975.
Animal Experiment for Model Fitting
In this experiment, mice were subcutaneously inoculated with single or mixed cell suspension (~5×10⁶ cells per mouse) in left forelimb flank.21–23 The single cell suspension was a single A549, and the mixed cell suspension was a mixture of H1975 and A549 in equal proportions. For mice with single A549, FK866 was administered from day 0 to day 8 at a dose of 20 mg/kg/day. For mice with the mixed tumor, FK866 was administered from day 3 to day 11 at a dose of 20 mg/kg/day. The volume of A549 in the mixed tumor was obtained by in vivo imaging every 3–4 days. Moreover, the volume of single A549 and the total volume of mixed tumor was obtained by caliper two to three times a week. These data were used for the model establishment and parameter fitting.
Animal Experiment for the Fixed Periodic Treatment Plan
Mice were subcutaneously inoculated with mixed tumor cells (~5×10⁶ cells per mouse), the mixed cell suspension of H1975 and A549 was at a ratio of 9:1. When tumor volume reached 200–300 mm3, mice were randomly divided into the DT1 and DT2 groups according to tumor volume and weight. Different treatment plans would be applied to these two groups. Using the same way of the animal experiment for model fitting, the total tumor volume and A549 volume of mixed tumors were obtained and used for model validation.
In vivo Imaging
The volume of A549 in the mixed tumor was evaluated by IVIS Spectrum (PerkinElmer, Waltham, MA, USA) through the in vivo imaging. First, a quantification database of bioluminescence intensity with cell numbers should be built. The serial dilutions of A549/luc cells were cultured in a 96-well black plate with a transparent bottom. After cell planting, the culture medium was replaced with 0.15 mg/mL D-Luciferin potassium salt (Beyotime, cat#ST196) and incubated 5 minutes to acquire the bioluminescence intensity. After that, for acquisition of the diffuse luminescence imaging tomography, mice were given D-Luciferin potassium salt by intraperitoneal injection at a dose of 150 mg/kg 12 minutes before imaging. Living Image software (version 4.3.2, PerkinElmer) was used to reconstruct a luminescence source in 3D space and calculate the absolute intensity of that source at depth.27 Based on the quantification database, we can get the cell number of A549. Then the cell number can be converted to the A549 volume of the mixed tumor according to the cell volume of A549 from our previous study.28 The cell volume of A549 in our previous study was obtained from the regression of cell number and tumor volume.
Model Establishment
The competition of subpopulations was illustrated by Lotka-Volterra model.29 The nonlinear mixed-effects model was adopted as the statistical framework to take account of inter-individual variability.30 In Equation 1, structural model f and residual error model g constitute the observations. Here, the variation of observations to the variables is described by structural model f. The difference between model prediction and observation is the residual error, which was set as the proportional error model. In addition, subscript i of each item represents individual and j represents the corresponding time point,  represents the time point. The individual parameters
  are from the same population distribution, here they were assumed from a lognormal distribution. The vector
  of the distribution represents the fixed effects, and
  represents the variance of individual random effects. Furthermore, the fixed effect is the mean of the population parameters under the pre-assumed distribution and the random effect means the variation of the population parameters between individuals. The residual errors
  follows standard normal distribution and ξ is the regression parameter of the residual error model.

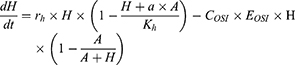
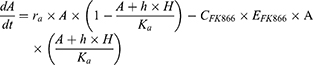
The model of mixed tumor administered with osimertinib or FK866 was as following Equations 2 and 3, the equation of osimertinib administration was the same as our previous study.28 In equations, H and A represent the volume of H1975 and A549,  and
and  represent the concentration of osimertinib and FK866,
  represents the efficacy of osimertinib on H1975,
  represents the efficacy of FK866 on A549. When
  and
and  equal zero, Equations 2 and 3 illustrate the normal growth of the mixed tumor. Intrinsic growth rate,
  , carrying capacity,
  , competition parameters,
  and
and  , these biologically related parameters were considered interindividual variability and the subscripts (
 ) of parameters indicated that they belonged to H1975 and A549, respectively. And for other drug-related parameters like
  ,
,  , interindividual variability was not considered. In addition, the second term in Equation 2 describes the survival support of A549 to H1975 when osimertinib was administered. Because the inhibition of osimertinib on H1975 was significantly reduced in the mixed tumor,28 we suspected that A549 might produce some secretions to support the survival of H1975, which is also present in other TKIs.31 The second term in Equation 3 indicates the impact of actual carrying capacity on the efficacy of FK866. Here the actual carrying capacity was the item
  , which calculates the portion of resources occupied by A549 and H1975 relative to the necessary resources of A549. Because FK866 mainly acts by inhibiting the synthesis of NAD+, the actual carrying capacity of the tumor will affect the degree of NAD+ deficiency, thereby affecting the efficacy of FK866. Therefore, for the mixed tumors, osimertinib controls the H1975 selectively, and FK866 controls the A549 selectively.
Parameter Estimation
Monolix 2019R2 (Lixoft SAS, Antony, France, 2019) was used for parameter estimation, which maximizes the likelihood function to obtain the appropriate values by the stochastic approximation expectation maximization algorithm.32 The fitting results of biologically related parameters contained typical value and inter-individual variability. The typical value was the mean of the population parameter and the inter-individual variability was the variance of the parameter distribution. The parameters about tumor normal growth, cell competition and efficacy of osimertinib were obtained from the previous study.28 The efficacy of FK866 was estimated based on the volume of single A549, total volume of the mixed tumors and the A549 volume of the mixed tumors. The goodness-of-fit plots and residual plots evaluated the model. The 90% confidence interval of change of tumor volume over time was obtained by the simulation of the median of the experimental samples.
Simulation to Get Fixed Periodic Treatment Plans with Typical Values of Parameters
In this simulation, the initial tumor composition was set as H1975 (180 mm3) and A549 (20mm3), the biologically related parameters were set to the typical values, the time to start periodic treatment was set to 2–15. For periodic treatment regimens, the first combination sequence was osimertinib administration, withdrawal, FK866 administration and withdrawal, and the second combination sequence was FK866 administration, withdrawal, osimertinib administration and withdrawal. The duration of each treatment was from 2 to 15 days, and the duration can also be 0, that is, skip this treatment. In this way, the fixed treatment cycle was simulated seven cycles. For the aim of keeping subpopulation content in a stable cycle, the stability of the treatment plan was evaluated by the degree of difference in the subpopulation content at the beginning and end of each treatment cycle. The top 10% of the treatment plans would enter the following evaluation. To evaluate the stability of these plans under the system changes, the value of one parameter was increased or decreased each time in the simulation system. The corresponding range is as follows: 100% subpopulation content, 50% intrinsic growth rate, 50% carrying capacity, 50% competition parameter. Then, each plan would be tested in these variant systems, and the top 10% of these plans would be retained. In animal experiments, the appropriate plans would be adopted to treat the mice with mixed tumors.
The Fixed Periodic Treatment Plans for Tumor Systems with an Unknown Resistant Subpopulation
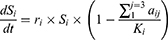
The screened fixed periodic treatment plans would be tested for effectiveness in a tumor system containing an unknown resistant subpopulation. The general dynamics of these three subpopulations are described by Equation 4, and the efficacy of osimertinib and FK866 was the same as Equations 2 and 3. Here, to simplify the simulation condition, the intrinsic growth rate and carrying capacity of resistant subpopulation was set to the typical value of H1975. The competition parameters among three subpopulations were set to the four cases shown in Tables 1–4. The competition coefficients in Equation 4 were in the corresponding position of the competition matrix in Tables 1–4. The initial treatment volume of the tumor system was set to 200 mm3, and the proportions of H1975, A549 and resistant subpopulation were 90%, 9.9%, and 0.1%, respectively. This was also the start point for calculating the outcome of each treatment. The endpoint of treatment was defined as the weighted sum of the relative carrying capacity of subpopulations. If this value exceeds 90% of the carrying capacity for any subpopulation, it is judged to reach the treatment endpoint. Because the local high competition may promote the occurrence of malignant events.33,34 The outcome of each treatment plan from the previous screening would be calculated for the above four cases. For these four cases, simulated annealing was used to calculate the optimal plan for comparison. In this process, it was assumed that all information about the tumor system was available. The detailed information of the simulated therapy protocols compared in these cases are shown in Table 5.
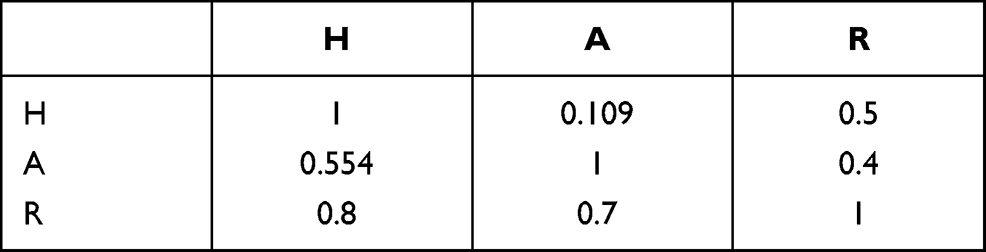 |
Table 1 Case 1 |
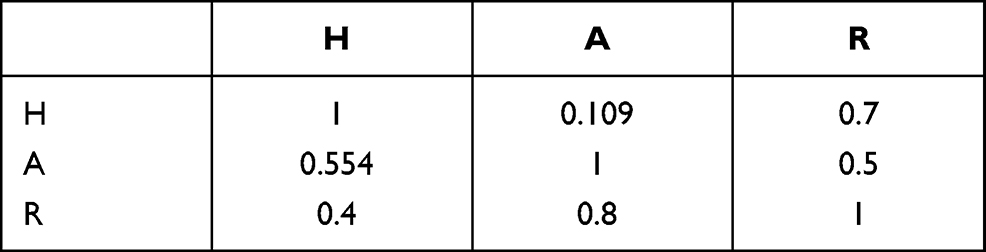 |
Table 2 Case 2 |
 |
Table 3 Case 3 |
 |
Table 4 Case 4 |
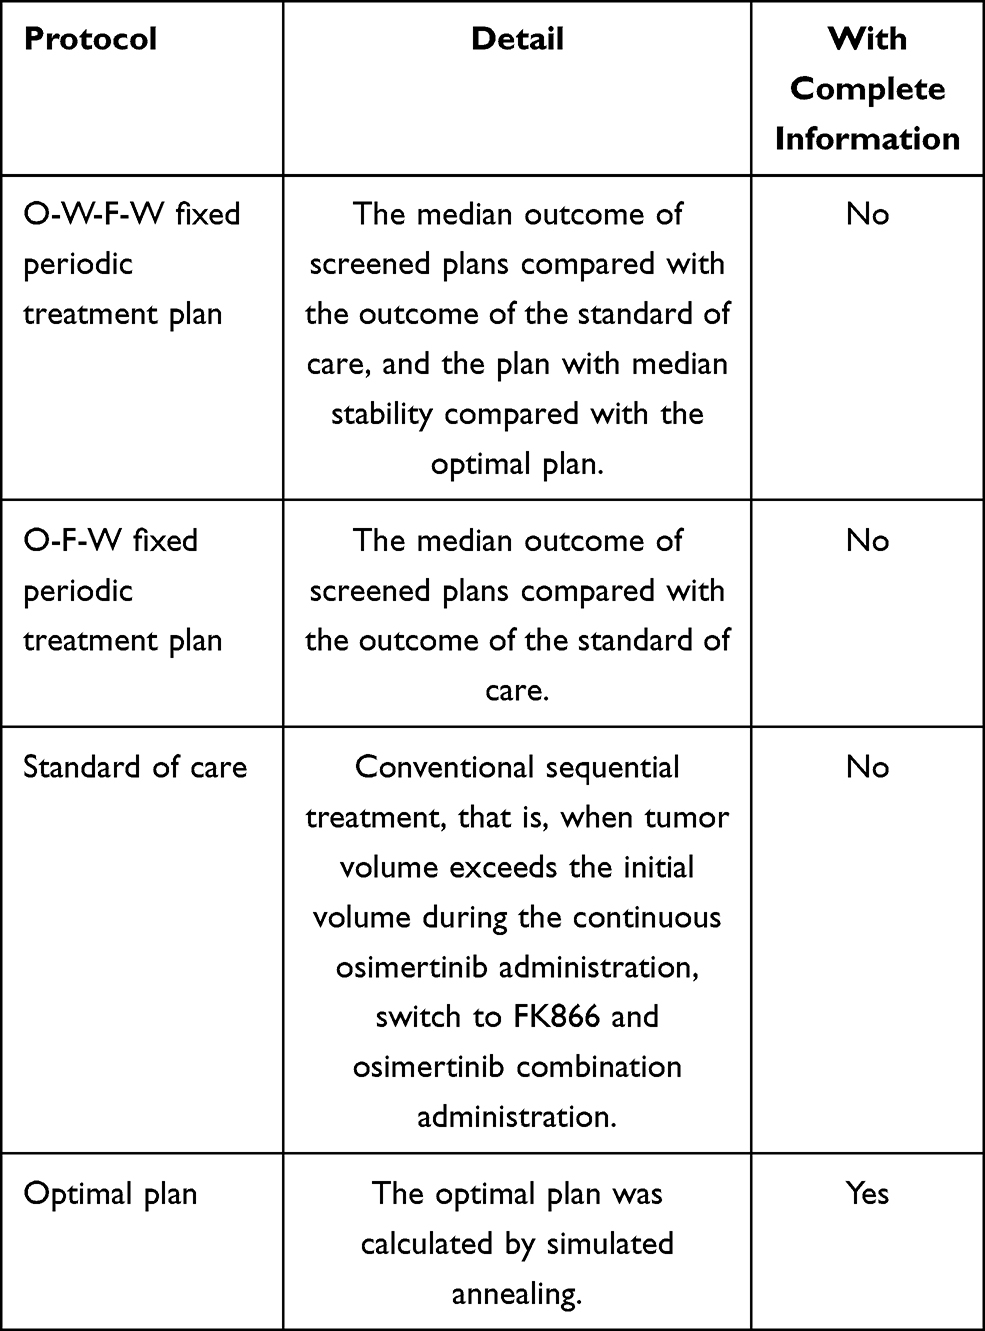 |
Table 5 Therapy Protocols |
Statistical Analysis
The data were expressed as the mean ± standard error of the mean. The significance analysis for two groups at each time point or drug concentration was performed by a two-sided unpaired t-test by R (4.0.5) and visualized by ggplot2. The acceptable level of significance set at p < 0.05; p-values were shown in figures as *: p < 0.05, **: p < 0.01 and ***: p < 0.005, ****: p < 0.0001, ns: not significant.
Results
FK866 Selectively Inhibits the Proliferation of A549
According to the transcriptomics data analysis, the differentially expressed genes (DEGs) have been found, and the corresponding proteins formed the PPI shown in Figure 1A. Protein expression in the pink circle was lower in A549 than in H1975, and the protein expression in the blue circle was the opposite. In this network, the metabolic pathway of NAD+ has been explored and shown in Figure 1B (top). In A549, the low-expressed metabolic enzymes in this pathway were the metabolic enzymes that synthesize NAD+, while the high-expressed metabolic enzymes were the metabolic enzymes in the decomposition process. Therefore, A549 may be more sensitive to the intervention of this pathway than H1975. The expression level of the rate-limiting enzyme NAMPT in the synthesis process of NAD+ is shown in Figure 1B (bottom), which was consistent with the transcriptomics data. According to the drug sensitivity data of GDSC, FK866 was chosen to inhibit the proliferation of A549.
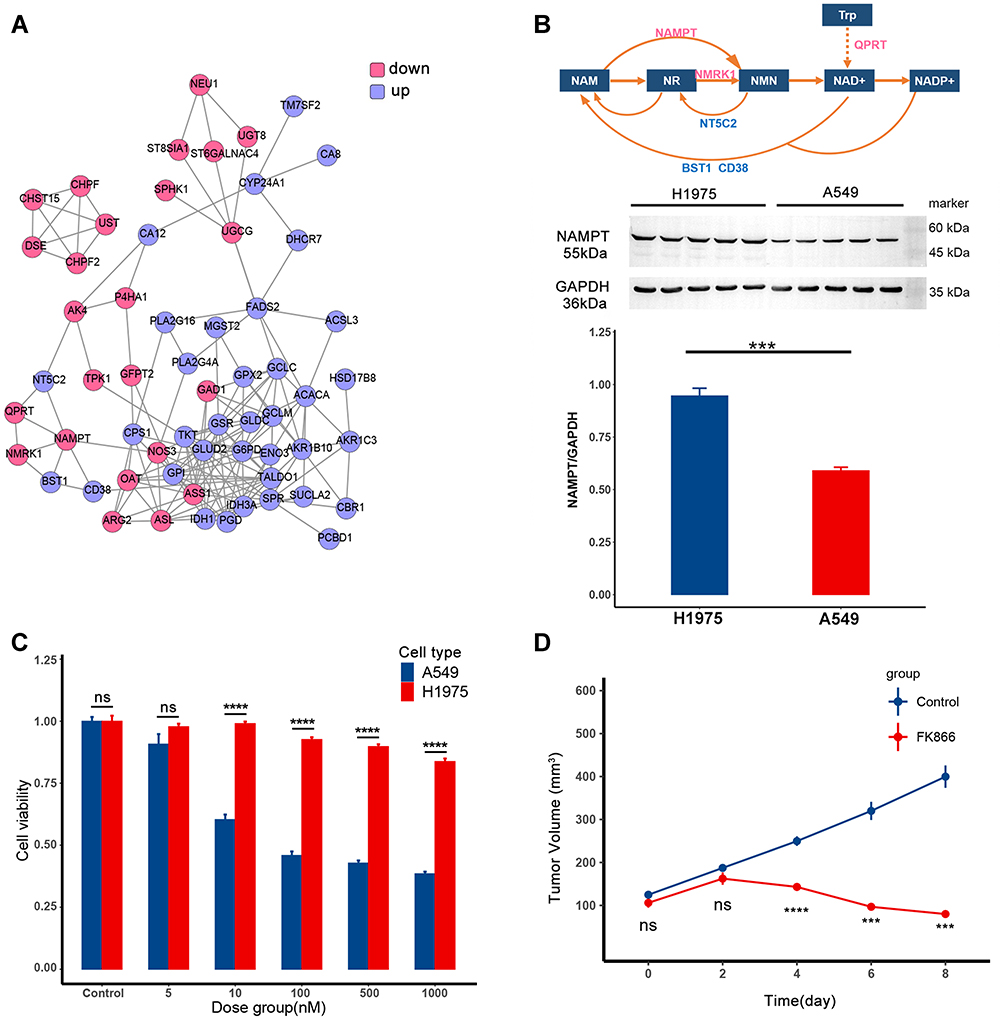 |
Figure 1 FK866 selectively inhibits the proliferation of A549. (A) The protein–protein interaction (PPI) of differentially expressed genes (DEGs) between H1975 and A549. The protein in the pink circle was less expressed in A549 than in H1975, and protein in the blue circle was more expressed in A549. (B) The top is the metabolic pathway of NAD+. The text in the box represents metabolite, and the text around the arrow represents metabolic enzyme. The middle part is expression level of NAMPT in H1975 and A549, the corresponding quantitative result is in the bar plot at the bottom (p-value=0.001, ***p < 0.005). (C) The efficacy of FK866 in vitro. H1975 and A549 were cultured in different concentrations of FK866 for 72h. The cell viability comparison of H1975 and A549 in the same dose group was calculated by t-test. The significant difference started from 10 nM (p < 0.0001: ****ns: not significant). (D) The efficacy of FK866 in vivo. Mice inoculated with A549 were given FK866 (20 mg/kg/day) or vehicle for eight days. The tumor volume at the same time point was compared by t-test in these two groups, and the significant difference started from the fourth day (p < 0.005: ***p < 0.0001: ****ns: not significant). |
Then the efficacy of FK866 was first verified in vitro (Figure 1C). As shown in the bar plot, when the concentration of FK866 was higher than 10 nM, the proliferation of A549 was significantly reduced compared to H1975. After that, the efficacy of FK866 has been further verified in vivo (Figure 1D). When FK866 was given to nude mice inoculated with A549 at 20 mg/kg/day, the tumor volume was significantly lower than the vehicle control group after four days. For nude mice inoculated with H1975, there was no significant difference in tumor volume between the FK866 and the vehicle control groups (Supplementary Figure S1). Both in vitro and in vivo experiments showed that FK866 selectively inhibited the proliferation of A549. As for the osimertinib, it only selectively inhibited the proliferation of H1975.28
Model Parameter Estimates and Model Evaluation
The established model is shown in Equations 2 and 3. Equation 2 and the parameters contained in these equations were adopted from our previous study.28 The pharmacodynamic model of FK866 and related parameters were explored in this study. The experimental data used for the model establishment and parameter estimation consisted of two parts. One was the tumor volume of single A549 with 20 mg/kg/day FK866 administration for eight days and regrowth for thirteen days. The other was the total tumor volume and A549 volume of the mixed tumors (H1975:A549 = 1:1) with normal growth for three days and 20 mg/kg/day FK866 administration for eight days. The parameter estimation was performed by Monolix and listed in Table 6.
 |
Table 6 Parameter List |
The diagnostic plots of the model are shown in Figure 2. Because the A549 volume in the mixed tumor was obtained through in vivo imaging every 3–4 days, the observations of A549 volume in mixed tumors were less than observations of the single A549. The observed volume versus predicted volume was in the left column of Figure 2, the dots were around the diagonal, and the individual predictions were close to the observations. The middle column was the IWRES versus time, the distribution of dots followed the standard normal distribution. The right column was used to describe the change of tumor volume over time. The blue shade was the 90% confidence interval obtained by simulation using the median of the individual parameters, and the black line was that the median of the observations fell within the confidence interval.
 |
Figure 2 Graphical diagnostics of the model. Observations versus individual predictions for A549 in single with FK866 from day 0 to day 8 (top, n=5), the total volume of the mixed tumor with FK866 from day 3 to day 11 (middle, n=5), A549 in mixed tumor (bottom, n=5). Each row includes lines of identity (left), individual-weighted residuals (IWRES) versus time (middle), and the predicted volume versus time (right). In the subplots of predicted volume versus time, the blue shaded area represents the 90% confidence interval of the simulation of the median value of the experimental samples. The line represents the median of the observations. |
Fixed Periodic Treatment Plans Designed with Typical Values Can Still Trap H1975 and A549 in a Stable Cycle
According to the Simulation to get fixed periodic treatment plans, several treatment plans were screened out, and only the first combination sequence can meet the requirements, that is, osimertinib administration, withdrawal, FK866 administration, withdrawal (O-W-F-W), or skipping the intermediate withdrawal (O-F-W). In animal experiments, the O-W-F-W and O-F-W treatment plans of equal cycle length were implemented to the treatment. The mice in the DT1 group adopted the O-W-F-W plan, mice in the DT2 group adopted the O-F-W plan. When tumor volume reached 700–900 mm3, these plans were started, which were adopted without any adjustment to confirm the applicability of the fixed periodic treatment plans designed by typical values.
The data of total tumor volume and A549 volume was collected during the treatment to validate the model. In addition, the data before the plan started was used to estimate the individual parameters of each sample by individual empirical Bayes estimates, and the initial subpopulations volumes of the model validation were obtained by the parameter estimation of Monolix. With these individual parameters, the predictions of tumor volume and A549 volume versus therapy time were shown as the orange and green curves in Figure 3A. The observation indicated by black scatters were close to the prediction curves. The experiment has been performed for 60 days, so the observations were collected to the 60th day. According to the observations and simulation results, it can be considered that the content of H1975 and A549 was in a cyclical change with periodic treatment. The range of each individual parameter of the experiment samples is shown in Figure 3B, and the parameter differences between the samples were around −30% to 30%. The fixed periodic treatment plans screened out from simulation can trap two subpopulations of these samples in an approximate limit cycle. This means that for the tumor systems of the two subpopulations, it was still possible to maintain the periodic cycle of the system with the same treatment plan, although there were some differences in biological properties, competition parameters from the original simulated system. In all, the fixed periodic treatment plans designed by the typical values were applicable when there were not enough data to get complete information of the tumor system.
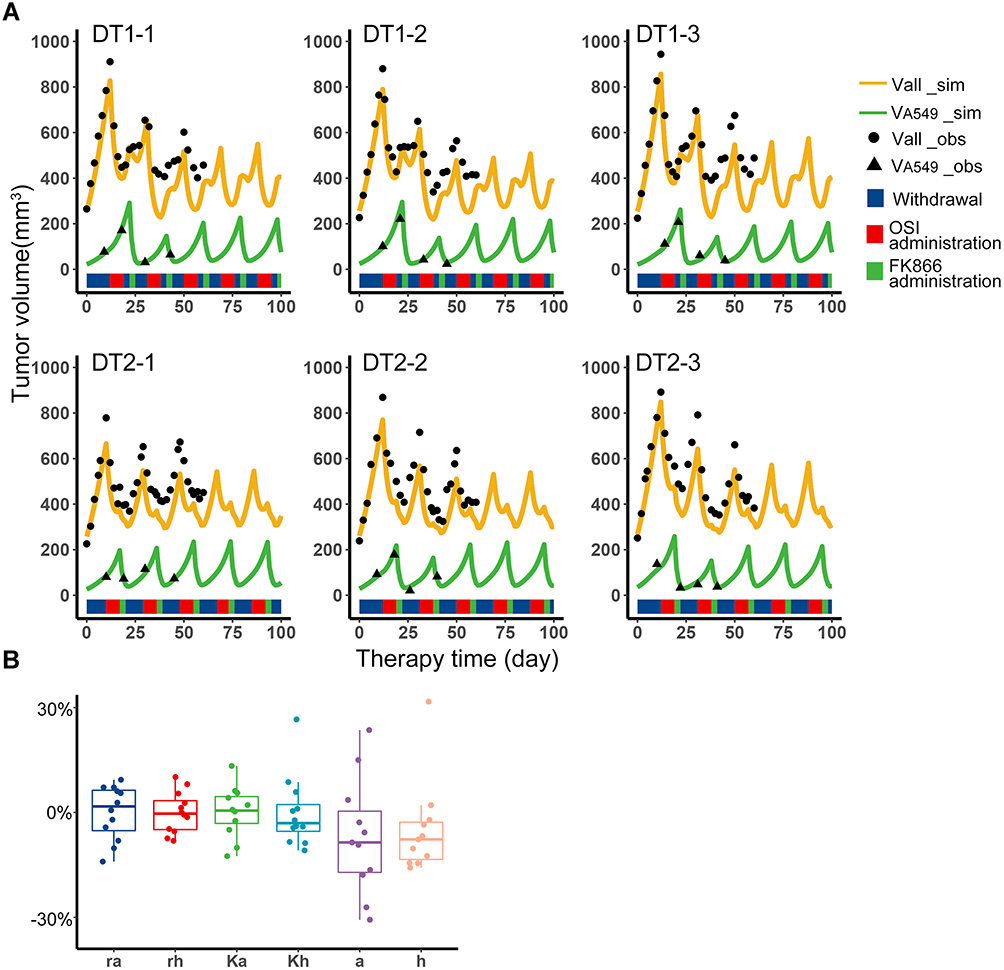 |
Figure 3 Fixed periodic treatment plan implemented in animal experiment. (A) Tumor volume versus therapy time in the experiment. The first row was the three representative samples from the DT1 group, which adopted the O-W-F-W plan. The second row was the three representative samples from the DT2 group which adopted the O-F-W plan. The black dots were the observations of total volume, and the black triangle was the observations of A549 volume. The experiment has been performed for 60 days, so the observations were collected to the 60th day. The yellow curves were the simulation results of total volume, and the green curves were the simulation results of A549 volume. The blue, red and green color bands below the curves represent the withdrawal, administration of osimertinib and FK866, respectively. (B) Distribution of individual parameters of experiment samples. Boxplot of biological parameters of experiment samples obtained from individual empirical Bayes estimates. |
Fixed Periodic Treatment Plans Can Inhibit Potential Resistant Subpopulation
Since the chromosomal instability of tumor cells, it is common that there are other unknown subpopulations in the tumor system. In the treatment of the two main subpopulations, the content of these unknown subpopulations may increase and affect the evolutionary trajectory. At this time, the effect of the fixed periodic treatment plan was explored in the four competitive cases, which were mentioned in the methods. These cases represented four different competitive relationships between the unknown resistant subpopulation and two sensitive subpopulations, H1975 and A549. The screened treatment plans have been tested for efficacy in these cases. The endpoint of this simulation was set as the weighted sum of the relative carrying capacity of subpopulations exceeded 90%, which was used to measure the local competitive level of the tumor. High local carrying capacity and intense competition may lead to malignant events such as metastasis, which should be avoided in the treatment. The distribution of the outcome of these treatment plans is shown in Figure 4. The outcome of the O-W-F-W group was a little better than the outcome of the O-F-W group, and the competitive suppression intensity of H1975 and A549 on the resistant subpopulation affected the outcome significantly. In addition, except for the fourth case, the median outcomes of these two groups were better than the outcome of the standard of care.
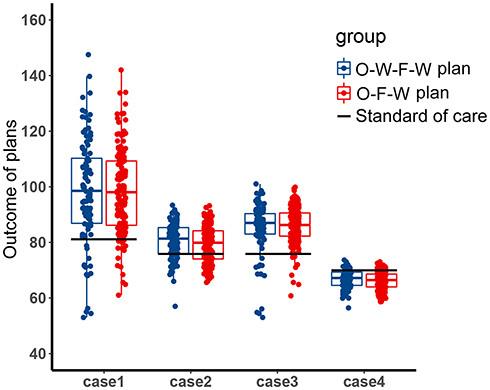 |
Figure 4 The distribution of the outcome of the filtered fixed periodic plans. Boxplot of the outcome of the O-W-F-W plans and O-F-W plans in four competitive cases. The black horizontal line was the outcome of the standard of care in the corresponding competitive case. |
Then the fixed periodic treatment plan with median stability was chosen from the O-W-F-W screened plans. The plan’s performance from start to the end in the four cases is shown in the left column of Figure 5. The middle column of Figure 5 was the performance of the optimal treatment plan, which was obtained by the simulated annealing method. For this optimal plan, it was assumed that all information of the tumor system was available and the treatment cycle was not fixed. In these four cases, the tumor subpopulation content of the fixed periodic plan and the optimal plan changed similarly with the treatment time. In the right column of Figure 5, the tumor composition of these two plans and the relative evolutionary velocity of resistant subpopulation was presented on the trilinear simplex. In these two treatment trajectories, the content of H1975 and A549 changed sequentially, and the content of resistant subpopulation increased slowly. The lower the competitive inhibition to resistant subpopulation, the fewer treatment cycles would be implemented in these four cases. In general, the difference between the outcomes of the fixed period plan and the optimal plan was not significant. Meanwhile, in actual circumstances, we usually cannot obtain all the information of the tumor system, so that is difficult to design the optimal plan. Therefore, a fixed periodic plan that achieves a similar effect can replace the optimal plan.
 |
Figure 5 The performance of fixed periodic plan and optimal plan. The four rows in the figure represent the four competition cases described in the methods. Each row includes the tumor subpopulation content varies with time of fixed periodic plan from start to the endpoint (left), the tumor subpopulation content varies with time of optimal plan from start to the end point (middle), the tumor composition of these two plans and the relative evolutionary velocity of resistant subpopulation (right). |
Discussion
In the tumor system composed of H1975 and A549, osimertinib and FK866 were used to control the tumor burden. We have explored the therapeutic effectiveness of fixed periodic treatment plans in the tumor system. The endpoint set in these studies was that the weighted sum of the relative carrying capacity of subpopulations exceeded 90%. Because carrying capacity describes the ability of the tissue to provide resources required by subpopulations, and this value can evaluate the intensity of competition for resources among tumor subpopulations. Intense competition for local resources may promote the occurrence of malignant events, such as metastasis. Therefore, this criterion takes into account the characteristics of each subpopulation.
This research found that when there are two main subpopulations in the tumor system, the fixed periodic treatment plans designed according to the typical values of population parameters are still effective in tumor systems with some differences. Because when the plans were filtered, the content variation of each subpopulation before and after each cycle of treatment was evaluated, and this variation defined the stability of each plan. In addition, the stability of the plan also was evaluated when individual parameters changed. Therefore, the screened plans were robust to tumor systems with variations in subpopulation composition and biological properties.
With the fixed periodic treatment cycle, the content of each sensitive subpopulation changes periodically. The total content of sensitive subpopulations is relatively stable, thus prolonging the control of the resistant subpopulation. Given the four competitive cases, we chose a plan with median stability from screened plans. Such a plan has a more robust outcome for different competitive situations. Because a plan with high stability for one case was designed accurately for this situation, it will inevitably lower the outcome for other competition situations, thereby reducing the general applicability of this plan. Based on this, a fixed periodic treatment plan with appropriate stability is generally selected to improve the robustness of the outcome for different cases.
In this research, the applicability of fixed periodic treatment was confirmed. However, there are still some uncertainties in the use of this protocol. First of all, the premise is that the main subpopulations in the tumor system should be definite and similar to the tumor subpopulations of the original tumor system used to design the fixed periodic treatment plans. In such a tumor system, the pre-designed plan is applicable. In addition, once the system deviates significantly from the original system used for designing and screening the plans, the above plans are still challenging to maintain the periodic cycle of sensitive subpopulations in the system. Moreover, the interaction between subpopulations during the administration will also increase the uncertainty of the system.
Conclusion
Though sometimes we cannot obtain complete information of the tumor system, the fixed periodic treatment plans designed by the typical values of population parameters are still feasible for the same type of tumor. These plans capitalized on the adaptive strategy can still trap the main subpopulations in cyclic change with therapy and delay the outgrowth of an unknown resistant subpopulation. It should be pointed out that the drugs in this research selectively act on a specific subpopulation and have no inhibitory effect on others. However, chemotherapeutic drugs have different levels of inhibition for subpopulations, so it will be more complicated to design periodic treatment plans. In addition, chemotherapy is the primary treatment method for tumors, so the applicability of the fixed periodic treatment plans for chemotherapeutic drugs without complete information should be further explored.
Abbreviations
DEGs, differentially expressed genes; PPI, protein–protein interaction; GDSC, Genomics of Drug Sensitivity in Cancer; O-W-F-W, osimertinib administration, withdrawal, FK866 administration, withdrawal; O-F-W, osimertinib administration, FK866 administration, withdrawal.
Ethics Approval
All animal care and experimental protocols (Approval No:2020081407) were approved by the animal ethics committee of the Pharmaceutical Animal Experiment Center of China Pharmaceutical University.
Acknowledgments
This research was supported by funding from the Graduate Research Innovation Program of Jiangsu Province (KYCX20_0631) and the “Double First-Class” University Project (CPU2018GY19). Part of the experimental instruments was provided by the public platform of the State Key Laboratory of Natural Medicines.
Disclosure
The authors report no conflicts of interest in this work.
References
1. Loeb LA, Kohrn BF, Loubet-Senear KJ, et al. Extensive subclonal mutational diversity in human colorectal cancer and its significance. Proc Natl Acad Sci U S A. 2019;116:26863–26872. doi:10.1073/pnas.1910301116
2. Campbell PJ, Pleasance ED, Stephens PJ, et al. Subclonal phylogenetic structures in cancer revealed by ultra-deep sequencing. Proc Natl Acad Sci U S A. 2008;105(35):13081–13086. doi:10.1073/pnas.0801523105
3. Diaz LA, Williams RT, Wu J, et al. The molecular evolution of acquired resistance to targeted EGFR blockade in colorectal cancers. Nature. 2012;486(7404):537–540. doi:10.1038/nature11219
4. Gentles AJ, Hui AB, Feng W, et al. A human lung tumor microenvironment interactome identifies clinically relevant cell-type cross-talk. Genome Biol. 2020;21(1):107. doi:10.1186/s13059-020-02019-x
5. Lee JK, Choi YL, Kwon M, Park PJ. Mechanisms and consequences of cancer genome instability: lessons from genome sequencing studies. Annu Rev Pathol. 2016;11:283–312. doi:10.1146/annurev-pathol-012615-044446
6. Coffey DS. Self-organization, complexity and chaos: the new biology for medicine. Nat Med. 1998;4(8):882–885. doi:10.1038/nm0898-882
7. Jiao Y, Berman H, Kiehl TR, Torquato S. Spatial organization and correlations of cell nuclei in brain tumors. PLoS One. 2011;6(11):e27323. doi:10.1371/journal.pone.0027323
8. Deisboeck TS, Berens ME, Kansal AR, Torquato S, Stemmer-Rachamimov AO, Chiocca EA. Pattern of self-organization in tumour systems: complex growth dynamics in a novel brain tumour spheroid model. Cell Prolif. 2001;34(2):115–134. doi:10.1046/j.1365-2184.2001.00202.x
9. Jamous S, Comba A, Lowenstein PR, Motsch S. Self-organization in brain tumors: how cell morphology and cell density influence glioma pattern formation. PLoS Comput Biol. 2020;16(5):e1007611. doi:10.1371/journal.pcbi.1007611
10. Fitzgerald DM, Rosenberg SM. Driving cancer evolution. eLife. 2017;6. doi:10.7554/eLife.25431.
11. West J, You L, Zhang J, et al. Towards multidrug adaptive therapy. Cancer Res. 2020;80(7):1578–1589. doi:10.1158/0008-5472.CAN-19-2669
12. Gatenby RA, Silva AS, Gillies RJ, Frieden BR. Adaptive therapy. Cancer Res. 2009;69(11):4894–4903. doi:10.1158/0008-5472.CAN-08-3658
13. Enriquez-Navas PM, Kam Y, Das T, et al. Exploiting evolutionary principles to prolong tumor control in preclinical models of breast cancer. Sci Transl Med. 2016;8(327):327ra24. doi:10.1126/scitranslmed.aad7842
14. Zhang J, Cunningham JJ, Brown JS, Gatenby RA. Integrating evolutionary dynamics into treatment of metastatic castrate-resistant prostate cancer. Nat Commun. 2017;8(1):1816. doi:10.1038/s41467-017-01968-5
15. Enriquez-Navas PM, Wojtkowiak JW, Gatenby RA. Application of evolutionary principles to cancer therapy. Cancer Res. 2015;75(22):4675–4680. doi:10.1158/0008-5472.CAN-15-1337
16. Gatenby RA. A change of strategy in the war on cancer. Nature. 2009;459(7246):508–509. doi:10.1038/459508a
17. Monro HC, Gaffney EA. Modelling chemotherapy resistance in palliation and failed cure. J Theor Biol. 2009;257(2):292–302. doi:10.1016/j.jtbi.2008.12.006
18. Yesilkanal AE, Johnson GL, Ramos AF, Rosner MR. New strategies for targeting kinase networks in cancer. J Biol Chem. 2021;297:101128. doi:10.1016/j.jbc.2021.101128
19. Ritchie ME, Phipson B, Wu D, et al. limma powers differential expression analyses for RNA-sequencing and microarray studies. Nucleic Acids Res. 2015;43(7):e47. doi:10.1093/nar/gkv007
20. Yang W, Soares J, Greninger P, et al. Genomics of Drug Sensitivity in Cancer (GDSC): a resource for therapeutic biomarker discovery in cancer cells. Nucleic Acids Res. 2013;41(Databaseissue):D955–61. doi:10.1093/nar/gks1111
21. Wu D, Zhu ZQ, Tang HX, et al. Efficacy-shaping nanomedicine by loading calcium peroxide into tumor microenvironment-responsive nanoparticles for the antitumor therapy of prostate cancer. Theranostics. 2020;10(21):9808–9829. doi:10.7150/thno.43631
22. Chatterjee S, Chakraborty P, Daenthanasanmak A, et al. Targeting PIM kinase with PD1 inhibition improves immunotherapeutic antitumor T-cell response. Clin Cancer Res. 2019;25(3):1036–1049. doi:10.1158/1078-0432.CCR-18-0706
23. Choi J, Beaino W, Fecek RJ, et al. Combined VLA-4-targeted radionuclide therapy and immunotherapy in a mouse model of melanoma. J Nucl Med. 2018;59(12):1843–1849. doi:10.2967/jnumed.118.209510
24. Sano D, Xie TX, Ow TJ, et al. Disruptive TP53 mutation is associated with aggressive disease characteristics in an orthotopic murine model of oral tongue cancer. Clin Cancer Res. 2011;17(21):6658–6670. doi:10.1158/1078-0432.CCR-11-0046
25. Zhou Y, Gu H, Xu Y, et al. Targeted antiangiogenesis gene therapy using targeted cationic microbubbles conjugated with CD105 antibody compared with untargeted cationic and neutral microbubbles. Theranostics. 2015;5(4):399–417. doi:10.7150/thno.10351
26. Pachow D, Andrae N, Kliese N, et al. mTORC1 inhibitors suppress meningioma growth in mouse models. Clin Cancer Res. 2013;19(5):1180–1189. doi:10.1158/1078-0432.CCR-12-1904
27. Kuo C, Coquoz O, Troy TL, Xu H, Rice BW. Three-dimensional reconstruction of in vivo bioluminescent sources based on multispectral imaging. J Biomed Opt. 2007;12(2):024007. doi:10.1117/1.2717898
28. Wang J, Zhang Y, Liu X, Liu H. Optimizing adaptive therapy based on the reachability to tumor resistant subpopulation. Cancers. 2021;13(21):5262. doi:10.3390/cancers13215262
29. Volterra V. Fluctuations in the abundance of a species considered mathematically. Nature. 1926;118(2972):560.
30. Lavielle M, Ribba B. Enhanced method for diagnosing pharmacometric models: random sampling from conditional distributions. Pharm Res. 2016;33(12):2979–2988. doi:10.1007/s11095-016-2020-3
31. Obenauf AC, Zou Y, Ji AL, et al. Therapy-induced tumour secretomes promote resistance and tumour progression. Nature. 2015;520(7547):368–372. doi:10.1038/nature14336
32. Kuhn E, Lavielle M. Maximum likelihood estimation in nonlinear mixed effects models. Comput Stat Data Anal. 2005;49(4):1020–1038. doi:10.1016/j.csda.2004.07.002
33. Pelham CJ, Nagane M, Madan E. Cell competition in tumor evolution and heterogeneity: merging past and present. Semin Cancer Biol. 2020;63:11–18. doi:10.1016/j.semcancer.2019.07.008
34. Parker TM, Gupta K, Palma AM, et al. Cell competition in intratumoral and tumor microenvironment interactions. EMBO J. 2021;40(17):e107271. doi:10.15252/embj.2020107271
 © 2021 The Author(s). This work is published and licensed by Dove Medical Press Limited. The
full terms of this license are available at https://www.dovepress.com/terms
and incorporate the Creative Commons Attribution
- Non Commercial (unported, 3.0) License.
By accessing the work you hereby accept the Terms. Non-commercial uses of the work are permitted
without any further permission from Dove Medical Press Limited, provided the work is properly
attributed. For permission for commercial use of this work, please see paragraphs 4.2 and 5 of our Terms.
© 2021 The Author(s). This work is published and licensed by Dove Medical Press Limited. The
full terms of this license are available at https://www.dovepress.com/terms
and incorporate the Creative Commons Attribution
- Non Commercial (unported, 3.0) License.
By accessing the work you hereby accept the Terms. Non-commercial uses of the work are permitted
without any further permission from Dove Medical Press Limited, provided the work is properly
attributed. For permission for commercial use of this work, please see paragraphs 4.2 and 5 of our Terms.