Back to Journals » Diabetes, Metabolic Syndrome and Obesity » Volume 14
Investigation of the Reference Interval Values of Fasting Plasma Glucose, Blood Pressure, and Blood Lipids in the Longevity People Aged 90 Years Old and Above
Authors Wang Z, Ni X, Gao D, Sun L, Zhu X, Jiao J, Zhou Q ![]() , Chen C, Zhang N, Wu Z, Yang Z, Yuan H
, Chen C, Zhang N, Wu Z, Yang Z, Yuan H
Received 4 July 2021
Accepted for publication 11 August 2021
Published 21 August 2021 Volume 2021:14 Pages 3711—3718
DOI https://doi.org/10.2147/DMSO.S327823
Checked for plagiarism Yes
Review by Single anonymous peer review
Peer reviewer comments 2
Editor who approved publication: Dr Konstantinos Tziomalos
Zhaoping Wang,1 Xiaolin Ni,1,2 Danni Gao,2,3 Liang Sun,1 Xiaoquan Zhu,1 Juan Jiao,4 Qi Zhou,1 Chen Chen,1 Nan Zhang,1 Zhu Wu,1 Ze Yang,1 Huiping Yuan1
1The MOH Key Laboratory of Geriatrics, Beijing Hospital, National Center of Gerontology, National Center for Gerontology, Beijing, 100730, People’s Republic of China; 2Graduate School of Chinese Academy of Medical Science and Peking Union Medical College, Beijing, 100730, People’s Republic of China; 3Peking University Fifth School of Clinical Medicine (Beijing Hospital), Beijing, 100730, People’s Republic of China; 4Clinical Laboratory Department, The Seventh Medical Center, PLA General Hospital, Beijing, 100730, People’s Republic of China
Correspondence: Huiping Yuan
The MOH Key Laboratory of Geriatrics, Beijing Hospital, National Center of Gerontology, Dongdan DaHua Road 1#, Beijing, 100730, People’s Republic of China
Tel +86-10-58115043
Fax +86-10-65237929
Email [email protected]
Purpose: To our knowledge, the normal fasting plasma glucose (FPG), blood pressure (BP), and blood lipids (BL) interval values have not been well-established in the longevity population. This study aims to provide a reference for the establishment of normal BP, FPG, and BL interval values in the longevity people in China.
Patients and Methods: A total of 7417 people were selected from the natural longevity cohort in Guangxi, with an age range of 20– 110 years old, including 7093 classified as the non-longevity (20– 89 years old) (94.02%) and 324 classified as the longevity (≥ 90 years old) (5.98%); there were 4309 men (58.1%) and 3108 women (41.9%). FPG, systolic blood pressure (SBP), diastolic blood pressure (DBP), total cholesterol (TC), and low-density lipoprotein (LDL-C) levels were defined as desirable levels when they were below the 75th percentile (P75), borderline levels from the 75th to 90th percentile (P75–P90), and high levels above P90; triglyceride (TG) levels above P90 were defined as high; and high-density lipoprotein cholesterol (HDL-C) levels below the 5th percentile (P5) were defined as low levels.
Results: The reference interval values of FPG in the longevity were as follows: desirable levels < 6.15 mmol/L, borderline levels 6.15– 7.45 mmol/L, high levels ≥ 7.45 mmol/L. Reference interval values of systolic blood pressure (SBP) were as follows: desirable levels < 160.00 mmHg, borderline levels 160.00– 174.50 mmHg, high levels ≥ 175.00 mmHg. DBP reference interval values were as follows: desirable levels < 88.00 mmHg, borderline levels 88.00– 90.00 mmHg, high levels ≥ 90.00 mmHg. TC reference interval values were as follows: desirable levels < 5.59 mmol/L, borderline levels 5.59– 6.45 mmol/L, high levels ≥ 6.45 mmol/L. LDL-C reference interval values were as follows: desirable levels < 3.30 mmol/L, borderline levels 3.30– 3.85 mmol/L, high levels ≥ 3.85 mmol/L. TG reference interval values were as follows: desirable levels < 2.82 mmol/L, high levels ≥ 2.82 mmol/L. HDL-C reference interval values were as follows: low levels < 0.80 mmol/L, desirable levels ≥ 0.80 mmol/L.
Conclusion: The reference interval values of BP, FPG, and BL are different between the longevity population and the non-longevity population, and the interval values change with increasing age.
Keywords: longevity, blood pressure, fasting plasma glucose, blood lipids, reference interval values
Introduction
The number of aging people worldwide will gradually increase in the coming decades.1 It is predicted that by the next decade, roughly one in three citizens of the world’s industrialized countries will be over 65 years old.2 In light of the rapid economic development in China and further improvements in people’s living standards and their physical fitness, life span in the Chinese population has been extended.3 However, the problems of aging could result in both economic problems and social anxiety, such as slower economic development4 and enormous health care challenges.5 Compared to other countries, the aging rate in China is currently moderate; its rate is faster than in most developed countries and slower than other East Asian countries except for North Korea and Mongolia.3 Therefore, more attention should be paid to research on healthy aging.
An analysis showed that various biochemical indices were significantly associated with physical function, morbidity, and mortality, which means these patterns represent differences in the process of biological aging, and the trends in such biochemical indices may have an association with age.6 Several studies have found a higher prevalence of overweight among longevity individuals in both men and women7 and a possible correlation between total cholesterol (TC) levels or body mass index (BMI) levels and the state and quality of life in the longevity adults.8 Furthermore, complex structural and functional modifications occur in the arterial system with advancing age.9 Gao demonstrated that compared with young adults, older adults had an impaired coronary vasodilatory response to acute cold stress.10 In addition, a study showed that the levels of fasting plasma glucose (FPG) could rise by 0.06 mmol/L per decade among adults over 50 years old.11
Given the information above, the FPG, blood pressure (BP), and blood lipid (BL) interval values among the longevity population may be different from those under age 90. In order to avoid the misdiagnosis of disease, drug abuse, and poor bodily function in the longevity people and to improve their living quality, new FPG, BP, and BL reference interval values in the longevity population should be established. To meet this aim, we conducted this study to provide a reference for the establishment of new FPG, BP, and BL interval values among longevity people to promote healthy strategies for healthy aging.
Materials and Methods
Subjects
This study was carried out based on data collected in an ongoing longitudinal study of a natural longevity cohort in Guangxi, China, with an age range of 20–110 years old. A total of 7417 participants were included in the present study, with 4309 (58.1%) men and 3108 (41.9%) women, of which 7093 (94.02%) were defined as non-longevity group (20–89 years old); 324 (5.98%) were defined as the longevity group (≥ 90 years old), according to the definition of the joint committee of Japan Gerontological Society and the Japan Geriatrics Society.12 The exclusion criteria were as follows: (1) longevity subjects who were bedridden; (2) patients with a previous diagnosis of diabetes or hypertension and undergoing treatment, which may have an impact on the results; (3) subjects with abnormal liver or kidney function or history of other serious and chronic diseases. The study was conducted in accordance with the Declaration of Helsinki,13 and the protocol was approved by the Ethics Committee of Beijing Hospital. All subjects signed the informed consent forms.
Measurements
Blood was collected from all subjects after they had been fasting for at least 8 hours, and blood samples were drawn using anticoagulant blood collection tubes containing 1% edetate (EDTA), stored at −80°C and then sent to Jiangbin Hospital in Guangxi Province for analysis. FPG, TC, TG (triglycerides), LDL-C (low-density lipoprotein cholesterol), and HDL-C (high-density lipoprotein cholesterol) were measured according to standard laboratory procedures. Height and weight were measured using a uniform standard measurement tool, and BMI was calculated as bodyweight (kg) divided by squared body height (m2). Waist circumference was measured using a non-elastic plastic measuring tape from the midpoint to the nearest 0.1 cm of waist circumference. After resting for at least 10 minutes, systolic blood pressure (SBP) and diastolic blood pressure (DBP) were measured in the right arm of participants, using a mercury-column sphygmomanometer.
Stratification Criteria for FPG, BP, and BL
Stratification criteria were as follow: (1) FPG stratification criteria (WHO, 1999):14 normal blood glucose FPG < 6.1 mmol/L, impaired fasting blood glucose 6.1 mmol/L ≤ FPG < 7.0 mmol/L, high FPG ≥ 7.0 mmol/L; (2) BP stratification criteria (ISH, 2020):15 normal blood pressure SBP < 130 mmHg and DBP < 85 mmHg, normal high blood pressure 130 mmHg ≤ SBP ≤ 139 mmHg or 85 mmHg ≤ DBP ≤ 89 mmHg, hypertension SBP ≥ 140 mmHg or DBP ≥ 90 mmHg; (3) BL stratification criteria (China, 2016 revised edition):16 desirable levels TC < 5.2 mmol/L, LDL-C < 3.4 mmol/L, TG < 1.7 mmol/L; borderline levels 5.2 mmol/L ≤ TC < 6.2 mmol/L, 3.4 mmol/L ≤LDL-C < 4.1 mmol/L, 1.7 mmol/L≤ TG < 2.3 mmol/L, high levels TC ≥ 6.2 mmol/L, LDL-C ≥ 4.1 mmol/L, TG ≥ 2.3 mmol/L; low levels HDL-C < 1.0 mmol/L.
Statistical Analysis
All analyses were performed using SPSS 16.0 software, and graphs were plotted using GraphPad Prism 8.0.1 software. The Shapiro–Wilk test was conducted to determine the type of distribution of all continuous variables, presenting them as mean (standard deviation) or median (interquartile range) depending on normal or non-normal distribution, respectively. Qualitative variables are presented as frequency (percentage). The Mann–Whitney U-test was used to determine the differences in quantitative data, and the chi-squared test was used to determine the differences in categorical data. Linear regression was performed to determine which factors (among FPG, BMI, SBP, DBP, TG, TC, HDL-C, and LDL-C) correlated with age. We defined FPG, SBP, DBP, TC, and LDL-C levels below the 75th percentile (P75) as desirable levels, 75th to 90th percentile (P75–P90) as borderline levels, and above P90 as high levels; TG levels above P90 were defined as high levels; and HDL-C levels below the 5th percentile (P5) were defined as low levels.17 We plotted the change in P75 values for each index in the age 20 to 110 group at 5-year intervals. Statistical significance was assessed at two-tailed P = 0.05 level.
Results
Characteristics of the Subjects
Characteristics of the Guangxi healthy residents recruited in this study, as stratified by age, are shown in Table 1. All subjects were between 20 and 110 years old, and we found that the height, weight, waist circumference, BMI, FPG, SBP, DBP, TG, TC, and LDL-C were significantly different in the longevity population compared with the non-longevity population (P < 0.05). The height, weight, waist circumference, BMI, TG, TC, and LDL-C were lower in the longevity than in the non-longevity population.
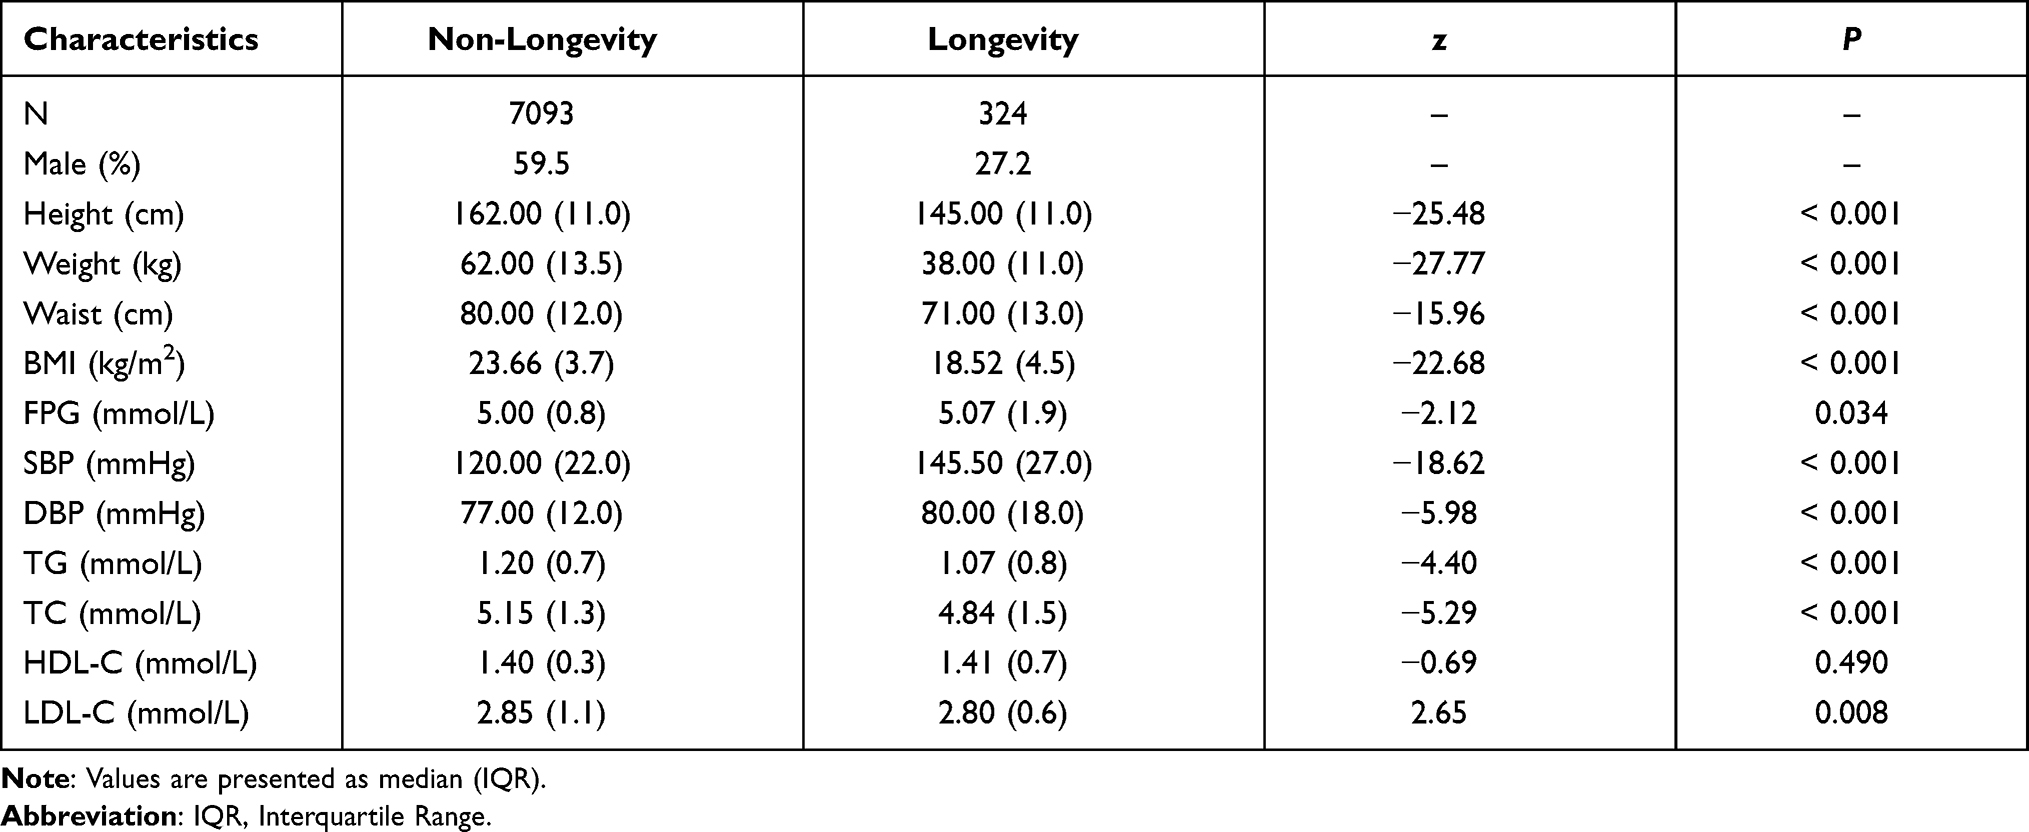 |
Table 1 Baseline Characteristics |
Correlation Between the Levels of BMI, FPG, BP, BL, and Age
We calculated the correlation between the levels of BMI, FPG, BP, BL, and age, as shown in Table 2. Age was positively correlated with SBP, DBP, FPG, TC, HDL-C, and LDL-C, while age was negatively correlated with BMI. Figure 1 shows the trends of different indices with age from 20 to 110 years old, and we found that BMI levels significantly fell after age 85–89 years and remain relatively stable in the longevity population (Figure 1A). SBP levels gradually increased with age (Figure 1B); DBP levels remained relatively stable after 90–94 years old, and an increase was seen in the longevity population compared with the non-longevity population (Figure 1C). The lowest FPG levels were found at 85 years old with a rapid rise up to 90 years old, and FPG levels in the longevity population showed a decrease around 100 years old, followed by a rapid increase with increasing age (Figure 1D). TC and HDL-C levels were highest at ages 85–89 and remained stable in the longevity population, and the TC levels in the longevity population were lower than that in non-longevity population (Figure 1E and G). TG levels showed a downward trend after ages 85–89 (Figure 1F); LDL-C levels gradually decreased at 80–84 years old, and their lowest value was found at 95 years old (Figure 1H).
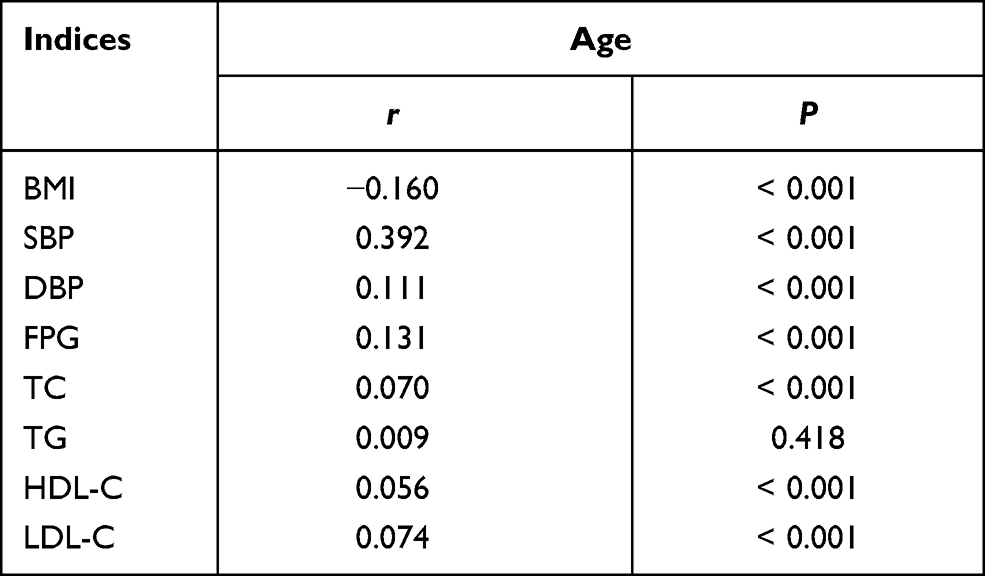 |
Table 2 The Correlations Between Several Indices and Age |
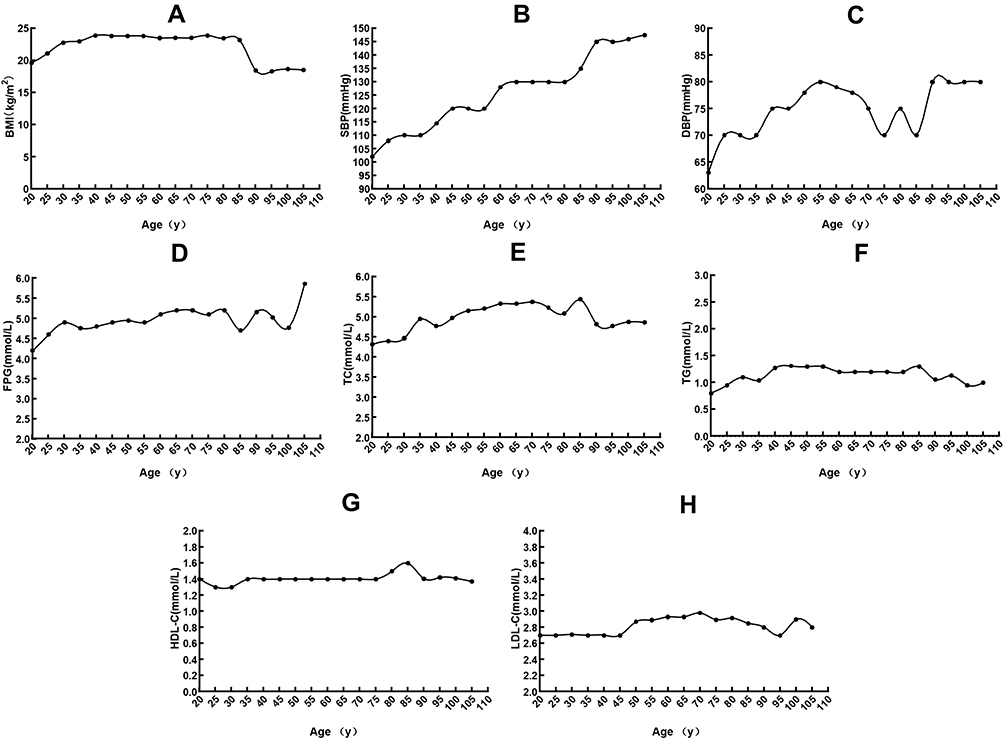 |
Figure 1 Relation between age and the P75 levels of BMI, FPG, BP, BL. (A) The association of age with P75 levels of BMI. The longevity had lower BMI levels; (B and C) The association of age with P75 levels of SBP and DBP. SBP and DBP levels in the longevity subjects were higher than in other subjects; (D) The association of age with P75 levels of FPG. The longevity subjects had higher FPG levels; (E–H) The association of age with P75 levels of TC, TG, HDL-C, and LDL-C. The BL levels were different between longevity people and others. |
Distribution of FPG, BP, and BL in the Non-Longevity and the Longevity Groups
Table 3 shows that there were significant differences in the distribution of FPG, SBP, DBP, TC, TG, HDL-C, and LDL-C between the non-longevity and the longevity groups (P < 0.05). The proportion of the longevity population who had high FPG levels was larger than in the non-longevity population (15.1% vs 2.0%, P < 0.001). The percentage of the longevity population who had high SBP and DBP levels was larger than in the non-longevity population (64.5% vs 18.7%, P < 0.001; 24.4% vs 12.7%, P < 0.001). The proportion of the longevity population who had high TC levels was smaller than in the non-longevity population (14.8% vs 16.3%, P = 0.002); in terms of low HDL-C levels, the proportion of the longevity population was larger than in the non-longevity population (16.0% vs 0.7%, P < 0.001), and a larger proportion of the longevity population had high TG and high LDL-C levels compared with the non-longevity population (13.0% vs 10.2%, P = 0.027; 7.7% vs 5.0%, P = 0.019).
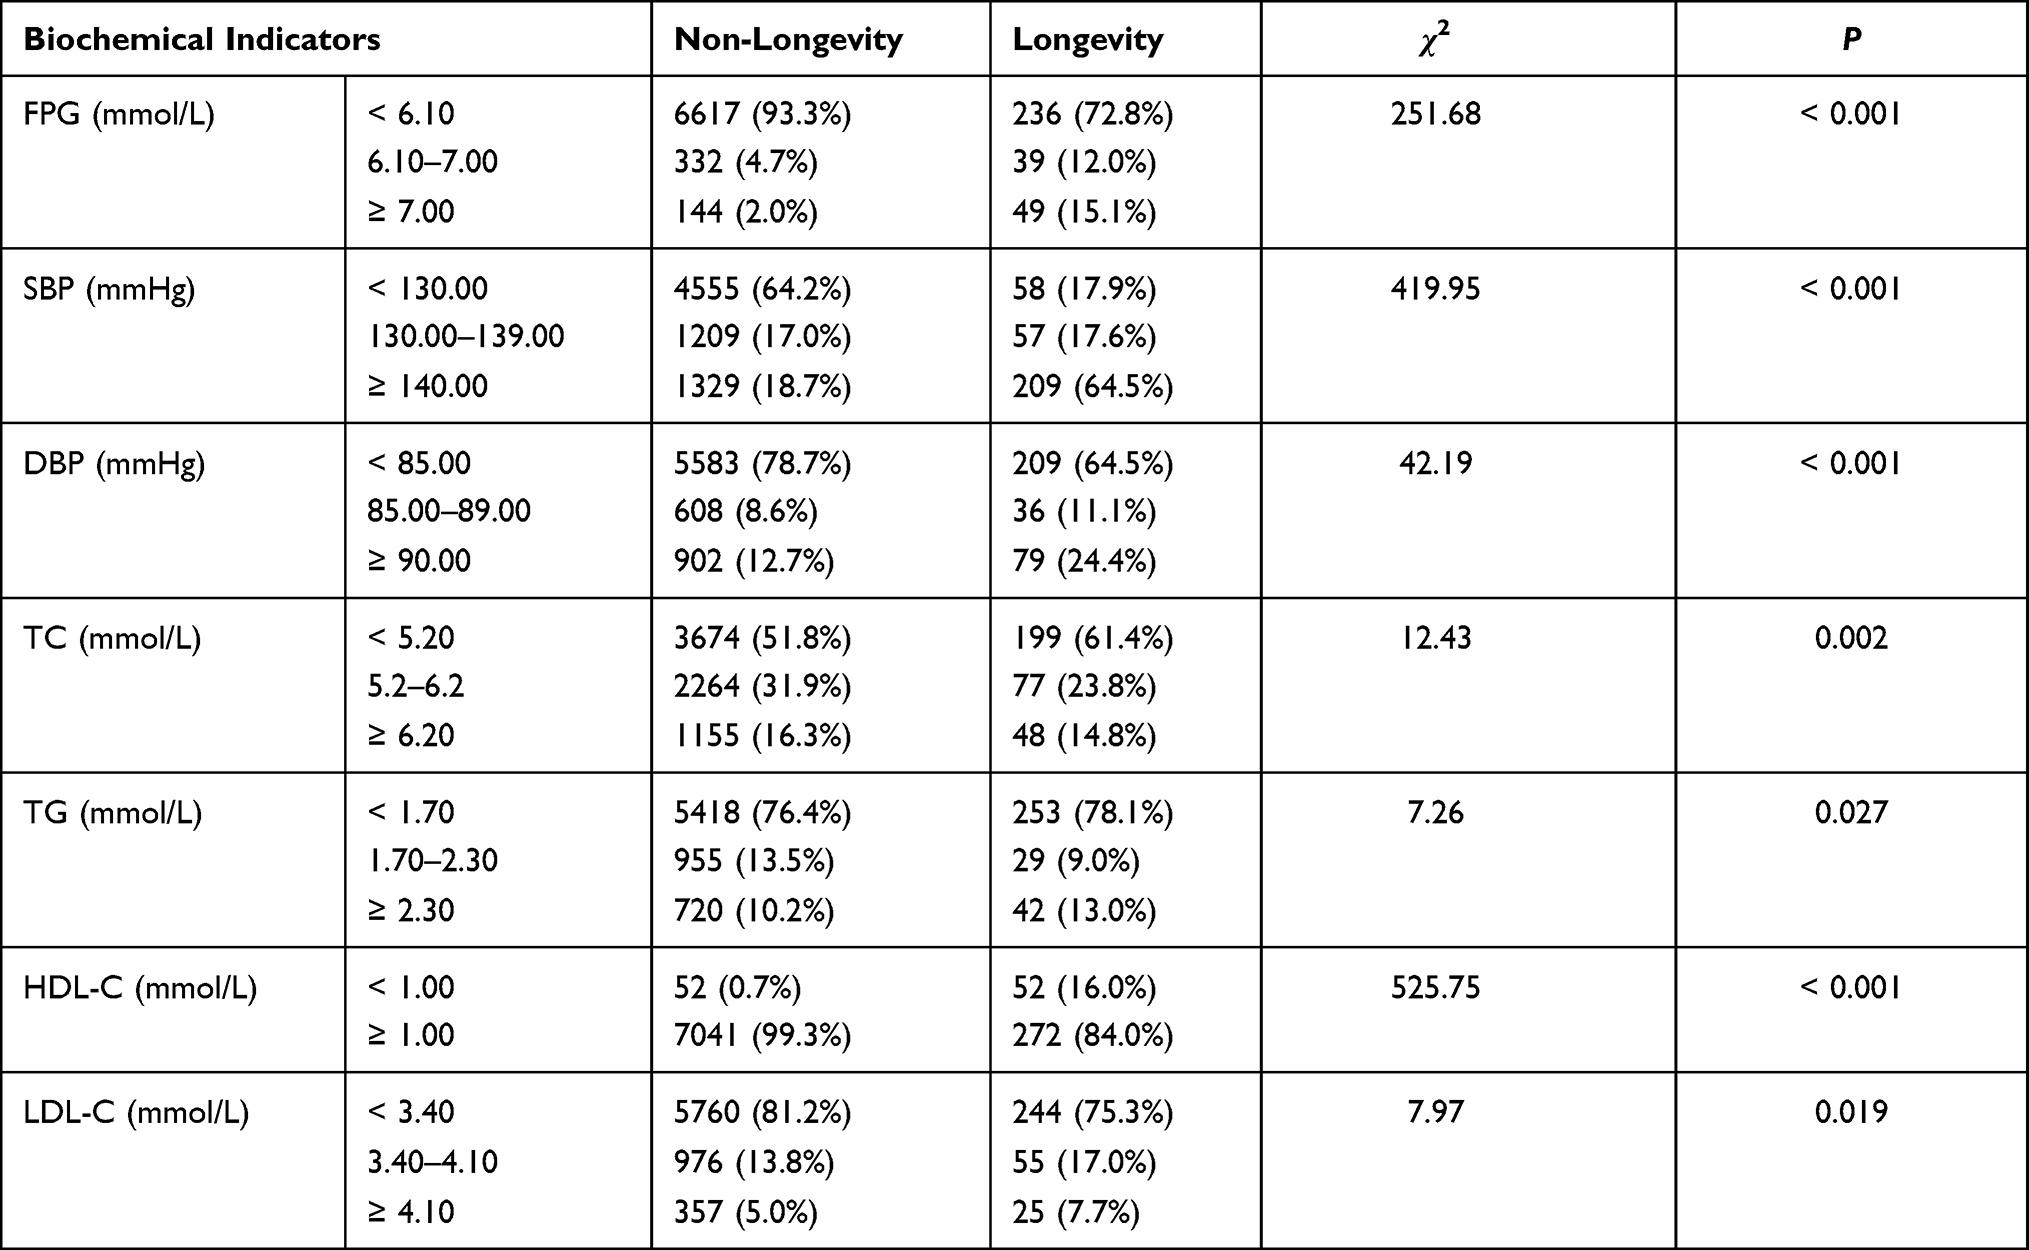 |
Table 3 The Distribution of Several Indicators in the Non-Longevity Population and the Longevity Population |
Establishment of Reference Interval Values for BP, FPG, and BL in the Longevity Population
Table 4 shows the reference interval values for BP, FPG, and BL in the longevity population (90–110 years old). The desirable reference levels were as follows: FPG < 6.15 mmol/L; SBP < 160.00 mmHg; TC < 5.59 mmol/L; LDL-C < 3.30 mmol/L; TG < 2.82 mmol/L; HDL-C ≥ 0.80 mmol/L. The reference interval values for FPG, SBP, TC, and TG were higher than their standard values, while the reference interval values for LDL-C and HDL-C were lower than their standard values.
 |
Table 4 Reference Interval Values for FPG, BP and BL of Longevity (≥ 90 Years-Old) and Their Standard Values |
Discussion
In most societies, the presence of a longevity population has always been considered a sign of health, especially for those who live to over 100 years of age and delay or avoid life-threatening illness.18 Considering the increasing number of aging people and the need for healthy aging, it is important to improve the accuracy in assessment and diagnosis of chronic diseases in the longevity people in order to improve their quality of life. Because of a certain degree of decline in somatic function in the longevity population, it is not reasonable to diagnose hyperlipidemia, hypertension, and hyperglycemia based on the conventional criteria; however, there are no unified reference interval values for BP, FPG, and BL in the longevity population. Based on the above reasons, we conducted this study to examine the current status of BP, FPG, and BL levels of the longevity people in China and sought to establish their reference interval values.
Ravindrarajah showed that among elderly people (≥ 80 years old), higher mortality was associated with SBP < 120 mmHg rather than frailty status, gender, or antihypertensive treatment.19 This study may explain the fact that participants with lower SBP were vulnerable to mortality. Healthy elderly people may have higher SBP levels, which is consistent with our results. A review described the process of arterial aging and showed that the decrease in distensibility and elasticity of the arterial wall led to a reduction in vascular compliance, resulting in an increase in SBP levels.9 Furthermore, aging was also accompanied by a decrease in the cellularity of the tunica media and an increase in thickness.20 According to our results, the reference interval value of SBP was categorized into three subgroups: desirable < 160.00 mmHg; borderline 160.00–174.50 mmHg; and high ≥ 175.00 mmHg.
In addition, a study showed that the FPG levels in the longevity population were slightly higher than the levels in the non-longevity population,21 and the FPG levels tended to increase with age,22 which is consistent with our results. With aging, human somatic functions start to naturally degenerate, leading to a decrease in the ability to secrete insulin by pancreatic islet cells, which may result in the trend of increasing FPG levels.22 Meanwhile, Shi showed that the FPG levels in elderly people who were exposed to particulate matter PM2.5 for a long time were likely to increase.23 And according to Figure 1, We found that the FPG levels in the longevity population showed a different tendency. Therefore, the mechanism of blood glucose regulation needs further study in the longevity population.
The results of this study demonstrated that the longevity people had a much lower BMI. Studies from the United States and Australia showed that higher BMI was associated with a substantial decrease in life expectancy, more so for whites than for blacks, especially for men in early adulthood.24–27 BMI is often used to measure weight status or nutritional health status. Regarding BL, we found that TC levels were lower in the longevity population, and the proportion of the longevity population with high TC levels was lower than that in the non-longevity population, while the trend in TC levels was positively correlated with age. As shown in Figure 1E, we observed that TC levels in the longevity population were higher than those in people 20 to 30 years old but lower than those in people from 35 to 85 years old. The positive correlation between TC levels and age was seen for the entire age range from 20 to 110 years. For non-longevity healthy people, HDL-C was maintained at a relatively high and stable level. However, having the apolipoprotein E (APOE) gene in the longevity people was positively correlated with higher HDL-C levels,28,29 especially in those with the APOE 3 homozygote, while those without the APOE gene showed a low level of HDL-C. A previous study revealed that the dietary components of the longevity people in Guangxi province were low in energy, fat, salt, and cholesterol, contributing to lower BMI, which may be one of the main reasons for the low BMI in the longevity people.30 Moreover, it is known that HDL-C has antioxidant proprieties, and elevated HDL-C levels are related to anti-atherogenic effects.31,32 Furthermore, Shi found that the serum concentration of HDL-C was nonlinearly correlated with all-cause or cardiovascular mortality in the longevity population, and a higher HDL-C serum concentration may not be protective.33 Cullen showed that decreased HDL-C levels and increased TC, LDL-C, and TG levels were important predictors of cardiovascular events.34 These studies support our results: while the differences were not significant, HDL-C levels in longevity people were slightly higher than in non-longevity people, and TG levels were decreased in centenarians. However, the TC levels decreased at around 85 years old, and LDL-C levels decreased in 90–99 year-olds, then they increased in centenarians.
However, the sample size of healthy longevity people that met the experimental inclusion criteria was relatively small, so there may be some limitations in applicability, but this study was the first to our knowledge to focus on the establishment of new BP, FPG, and BL reference interval values in the longevity people, which could provide reference levels for future studies. Furthermore, because there were no previous reports on the development of criteria for the longevity population and the research methods were relatively lacking, we used the methodology found in other studies, and further research is still needed to confirm the findings. Finally, because our data were cross-sectional, the categories considered (desirable, borderline, or high) cannot reflect the risk of cardiovascular disease or another disease that interferes with health status without relevant cohort studies.
Conclusion
In conclusion, our results revealed that there are differences in FPG, BP, and BL levels in the longevity population compared with the non-longevity population, and they change with increasing age. This study provides an initial reference for establishing interval values for FPG, BP, and BL in the longevity population, which could help in diagnosing related diseases in this group.
Acknowledgments
All authors made substantial contributions to conception and design, acquisition of data, or analyses and interpretation of data; took part in drafting the article or revising it critically for important intellectual content; agreed to submit to this journal; gave approval of the final version to be published; and agree to be accountable for all aspects of the work.
This work was supported by the Natural Science Foundation of China (81870552, 81400790, 81872096, 81571385, 91849118, 91849132, 9184910151, 81672075, and 81600622), National Key R&D Program of China (2018YFC2000400), Beijing Hospital Doctoral Scientific Research Foundation (BJ-2018-024), Beijing Hospital Nova Project (BJ-2018-139) and Non-profit Central Research Institute Fund of Chinese Academy of Medical Sciences (2018RC330003), CAMS Innovation Fund for Medical Sciences (2018-I2M-1-002); Priority Union Foundation of Yunnan Provincial Science and Technology Department and Kunming Medical University (202001AY070001-011).
Disclosure
The authors report no conflicts of interest in this work.
References
1. Aguiar B, Macario R. The need for an Elderly centred mobility policy. In: Ulengin F, Li K, Boltze M, editors. World Conference on Transport Research - Wctr 2016. Elsevier Science Bv; 2017. Transportation Research Procedia.
2. Rosenbloom S. Sustainability and automobility among the elderly: an international assessment. Transportation. 2001;28(4):375–408. doi:10.1023/a:1011802707259
3. Feng J, Hong GL, Qian WR, Hu RF, Shi GM. Aging in China: an international and domestic comparative study. Sustainability. 2020;12(12):5086. doi:10.3390/su12125086
4. Eggleston K, Oi JC, Rozelle S, Sun A, Walder A, Zhou XG. Will demographic change slow China’s rise? J Asian Stud. 2013;72(3):505–518. doi:10.1017/s0021911813000557
5. Fang EF, Scheibye-Knudsen M, Jahn HJ, et al. A research agenda for aging in China in the 21st century. Ageing Res Rev. 2015;24:197–205. doi:10.1016/j.arr.2015.08.003
6. Sebastiani P, Thyagarajan B, Sun FG, et al. Biomarker signatures of aging. Aging Cell. 2017;16(2):329–338. doi:10.1111/acel.12557
7. Dos Santos DM, Sichieri R. Indice de massa corporal e indicadores antropométricos de adiposidade em idosos [Body mass index and measures of adiposity among elderly adults]. Rev Saude Publica. 2005;39(2):163–168. doi:10.1590/s0034-89102005000200004
8. Kanoni S, Dedoussis G, Manios Y, Malavolta M, Mocchegiani E. Health status, blood and anthropometrical indices from Greek old and nonagenarian subjects. Biogerontology. 2006;7(5–6):329–337. doi:10.1007/s10522-006-9047-5
9. Tesauro M, Mauriello A, Rovella V, et al. Arterial ageing: from endothelial dysfunction to vascular calcification. J Intern Med. 2017;281(5):471–482. doi:10.1111/joim.12605
10. Gao Z, Wilson TE, Drew RC, Ettinger J, Monahan KD. Altered coronary vascular control during cold stress in healthy older adults. Am J Physiol Heart Circ Physiol. 2012;302(1):H312–8. doi:10.1152/ajpheart.00297.2011
11. Scheen AJ. Diabetes mellitus in the elderly: insulin resistance and/or impaired insulin secretion? Diabetes Metab. 2005;31(2):5s27–5s34. doi:10.1016/s1262-3636(05)73649-1
12. Ouchi Y, Rakugi H, Arai H, et al. Redefining the elderly as aged 75years and older: proposal from the joint committee of Japan Gerontological Society and the Japan Geriatrics Society. Geriatr Gerontol Int. 2017;17(7):1045–1047. doi:10.1111/ggi.13118
13. Williams J. The declaration of helsinki and public health. Bull World Health Organ. 2008;86(8):650–652. doi:10.1590/S0042-96862008000800022
14. Alberti KG, Zimmet PZ. Definition, diagnosis and classification of diabetes mellitus and its complications. Part 1: diagnosis and classification of diabetes mellitus provisional report of a WHO consultation. Diabet Med. 1998;15(7):539–553. doi:10.1002/(sici)1096-9136(199807)15:7<539::Aid-dia668>3.0.Co;2-s
15. Unger T, Borghi C, Charchar F, et al. 2020 international society of hypertension global hypertension practice guidelines. J Hypertens. 2020;38(6):982–1004. doi:10.1097/hjh.0000000000002453
16. Zhu J, Gao R, Zhao S, et al. Guidelines for the prevention and treatment of dyslipidemia in adults in China (2016 revised edition). Chin Circ J. 2016;31(10):937–953. doi:10.3969/j.issn.1000-3614.2016.10.001
17. Okada T, Murata M, Yamauchi K, Harada K. New criteria of normal serum lipid levels in Japanese children: the nationwide study. Pediatr Int. 2002;44(6):596–601. doi:10.1046/j.1442-200x.2002.01634.x
18. Hitt R, Young-Xu Y, Silver M, Perls T. Centenarians: the older you get, the healthier you have been. Lancet. 1999;354(9179):652. doi:10.1016/s0140-6736(99)01987-x
19. Ravindrarajah R, Hazra NC, Hamada S, et al. Systolic blood pressure trajectory, frailty, and all-cause mortality >80 years of age: cohort study using electronic health records. Circulation. 2017;135(24):2357–2368. doi:10.1161/circulationaha.116.026687
20. Spina M, Garbisa S, Hinnie J, Hunter JC, Serafini-Fracassini A. Age-related changes in composition and mechanical properties of the tunica media of the upper thoracic human aorta. Arteriosclerosis. 1983;3(1):64–76. doi:10.1161/01.atv.3.1.64
21. Wu J, Lv Z, Pan P, et al. Correlation of BDNF Val66Met polymorphism with blood glucose in Zhuang people long-lived families living along Guangxi Hongshuihe River basin. Chin J Diabetes. 2014;22(1):7–11. doi:10.3969/j.issn.1006-6187.2014.01.003
22. Wang J, Lv Z, Hu P, et al. Epidemiological Analysis of Blood Glucose Level and Hyperglycemia for Zhuang long-lived families in Guangxi Bama area. J Guangxi Med Univ. 2011;28(1):55–57. doi:10.16190/j.cnki.45-1211/r.2011.01.026
23. Zhang Y, Li T, Ma R, et al. Long-term exposure to ambient fine particulate matter and fasting blood glucose level in a Chinese elderly cohort. Sci Total Environ. 2020;717:137191. doi:10.1016/j.scitotenv.2020.137191
24. Fontaine KR, Redden DT, Wang C, Westfall AO, Allison DB. Years of life lost due to obesity. JAMA. 2003;289(2):187–193. doi:10.1001/jama.289.2.187
25. Finkelstein EA, Brown DS, Wrage LA, Allaire BT, Hoerger TJ. Individual and aggregate years-of-life-lost associated with overweight and obesity. Obesity. 2010;18(2):333–339. doi:10.1038/oby.2009.253
26. Stewart ST, Cutler DM, Rosen AB. Forecasting the effects of obesity and smoking on U.S. life expectancy. N Engl J Med. 2009;361(23):2252–2260. doi:10.1056/NEJMsa0900459
27. Lung T, Jan S, Tan EJ, Killedar A, Hayes A. Impact of overweight, obesity and severe obesity on life expectancy of Australian adults. Int J Obes. 2019;43(4):782–789. doi:10.1038/s41366-018-0210-2
28. Mahley RW, Innerarity TL, Bersot TP, Lipson A, Margolis S. Alterations in human high-density lipoproteins, with or without increased plasma-cholesterol, induced by diets high in cholesterol. Lancet. 1978;2(8094):807–809. doi:10.1016/s0140-6736(78)92588-6
29. Feng J, Liu M, Zhang J, et al. MtDNA variants, apolipoprotein E gene and longevity in Southern Chinese population. J Clin Rehab Tissue Eng Res. 2010;14(15):2823–2827. doi:10.3969/j.issn.1673-8225.2010.15.039
30. Xie Q, Cai D, Chen L, et al. Survey of dietary nutrition in families with long-lived people in Bama of Guangxi Province. Chin J Clin Nutr. 2005;5: 276–280.
31. Kontush A, Chapman MJ. Functionally defective high-density lipoprotein: a new therapeutic target at the crossroads of dyslipidemia, inflammation, and atherosclerosis. Pharmacol Rev. 2006;58(3):342–374. doi:10.1124/pr.58.3.1
32. Boes E, Coassin S, Kollerits B, Heid IM, Kronenberg F. Genetic-epidemiological evidence on genes associated with HDL cholesterol levels: a systematic in-depth review. Exp Gerontol. 2009;44(3):136–160. doi:10.1016/j.exger.2008.11.003
33. Li ZH, Lv YB, Zhong WF, et al. High-density lipoprotein cholesterol and all-cause and cause-specific mortality among the elderly. J Clin Endocrinol Metab. 2019;104(8):3370–3378. doi:10.1210/jc.2018-02511
34. Cullen P. Evidence that triglycerides are an independent coronary heart disease risk factor. Am J Cardiol. 2000;86(9):943–949. doi:10.1016/s0002-9149(00)01127-9
 © 2021 The Author(s). This work is published and licensed by Dove Medical Press Limited. The
full terms of this license are available at https://www.dovepress.com/terms
and incorporate the Creative Commons Attribution
- Non Commercial (unported, 3.0) License.
By accessing the work you hereby accept the Terms. Non-commercial uses of the work are permitted
without any further permission from Dove Medical Press Limited, provided the work is properly
attributed. For permission for commercial use of this work, please see paragraphs 4.2 and 5 of our Terms.
© 2021 The Author(s). This work is published and licensed by Dove Medical Press Limited. The
full terms of this license are available at https://www.dovepress.com/terms
and incorporate the Creative Commons Attribution
- Non Commercial (unported, 3.0) License.
By accessing the work you hereby accept the Terms. Non-commercial uses of the work are permitted
without any further permission from Dove Medical Press Limited, provided the work is properly
attributed. For permission for commercial use of this work, please see paragraphs 4.2 and 5 of our Terms.