")
Back to Journals » OncoTargets and Therapy » Volume 12
Investigation Of Small Molecular Substances As Potential Biomarkers For Discrimination Of Gastric Tumor
Authors Zhang J, Gao Q, Luo X, Zhang W, Wang N, Wei Y
Received 2 July 2019
Accepted for publication 7 October 2019
Published 17 October 2019 Volume 2019:12 Pages 8587—8594
DOI https://doi.org/10.2147/OTT.S221589
Checked for plagiarism Yes
Review by Single anonymous peer review
Peer reviewer comments 2
Editor who approved publication: Prof. Dr. Nicola Silvestris
Jianyong Zhang,1–3,* Qingjun Gao,1,* Xue Luo,1 Wenxiong Zhang,2 Nanpeng Wang,1 Yiping Wei2
1Department of General Surgery, The Affiliated Hospital of Guizhou Medical University, Guiyang, Guizhou Province 550004, People’s Republic of China; 2Department of Thoracic Surgery, The Second Affiliated Hospital of Nanchang University, Nanchang, Jiangxi Province 330006, People’s Republic of China; 3Jiangxi Key Laboratory for Mass Spectrometry and Instrumentation, East China University of Technology, Nanchang, Jiangxi Province 330013, People’s Republic of China
*These authors contributed equally to this work
Correspondence: Yiping Wei
Department of Thoracic Surgery, The Second Affiliated Hospital of Nanchang University, Nanchang, Jiangxi Province 330006, People’s Republic of China
Tel +86 136 8791 9322
Email [email protected]
Nanpeng Wang
Department of General Surgery, The Affiliated Hospital of Guizhou Medical University, Guiyang, Guizhou Province 550004, People’s Republic of China
Tel +86 136 0856 6260
Email [email protected]
Background: Gastric tumor (GT) is associated with high morbidity and mortality, with surgery among the most effective treatment methods. Accurate interoperative determination of the tumor margin is crucial.
Methods: In this study, using internal extractive electrospray ionization-MS, mass spectral data of GT and gastric normal (GN) tissues from 36 patients were collected.
Results: In positive ion detection mode, the relative abundances of m/z 132, 147, 170, and 175 were increased, while the relative abundances of m/z 55, 83, 154, and 203 were decreased in GT tissue. Using partial least squares analysis, the mass spectral data of GT and GN tissues were discriminated, and differential ions (P≤0.01), including m/z 55, 83, 154, 170, and 203, were obtained from loading plots. After receiver operating characteristic curve analysis, peaks at m/z 83 and 203 showed high accuracy for distinguishing GT from GN tissue. These two peaks were then preliminarily attributed to 5-aminoimidazole and serylproline, respectively, which might be useful molecular biomarkers associated with GT development.
Conclusion: Further investigations of the functions of 5-aminoimidazole and serylproline might provide a better understanding of the underlying mechanisms involved in GT.
Keywords: gastric tumor, biomarkers, mass spectrometry, MS, tumor margin
Introduction
Gastric tumor (GT) is associated with high morbidity and mortality,1 and has a five-year survival rate of approximately 20% globally and 60% in Japan.2 Surgery is the most effective treatment for gastric tumor. Identifying precise tumor margins during surgery is vital for obtaining confident resection and accurate prognosis, and minimizing healthy tissue loss.3–5 Currently, frozen-section histology is the gold standard method for determining tumor margins intraoperatively. However, this method has several disadvantages, including being time-consuming (taking 30–40 min), which significantly prolongs patient exposure to general anesthesia, and the diagnosis of the process being subjective.3,6 Therefore, a new and reliable diagnostic method is urgently required.
Metabolites are the end product of cellular regulation processes and their levels can be considered as the final response to other omics or environmental changes. Metabolites provide a better means of identifying disease biomarkers for diagnosis.7 Therefore, an in-depth understanding of the molecular mechanisms involved in tumor metabolic reprogramming can help discover new molecular diagnostic methods to identify tumours.8 Small molecular substances play a vital role in biological processes and are closely related to life activities. Small molecular substances are of increasing interest in the field of metabolomics, which aims to establish the metabolic responses of living systems to external or internal perturbations. Small molecular substances play an important role in cancer metabolic pathways,9 but traditional methods focus on proteins and nucleic acids rather than small molecular substances. Therefore, in this study, we discuss small molecular substances as potential biomarkers for discriminating GT using mass spectroscopy (MS). MS has advantages including rapid analysis, high sensitivity, low detection limits, and insufficient requirements for analyte-specific reagents.3 MS is an effective method for analyzing complex mixtures. Internal extractive electrospray ionization-MS (iEESI-MS)3,10,11 is a method that efficiently provides molecular information within the body volume and characterizes analytes distributed in three-dimensional volumes of different biological tissues.
In this study, we used MS to examine trace differences in the metabolism of small molecular substances between GT tissue and adjacent matched gastric normal (GN) tissue from 36 patients. The mass spectra of tissues were then classified using partial least squares (PLS) analysis. Key small molecular substances affecting the separation of these samples were identified and their specificity and sensitivity for discriminating GT and GN tissues were evaluated.
Materials And Methods
Sample Collection
This study was approved by the Medical Ethics Committee in the Hospital Institutional Review Board of the Affiliated Hospital of Guizhou Medical University and the Second Affiliated Hospital of Nanchang University. Written informed consent was obtained from all patients in this study. All clinical investigations were conducted according to the principles expressed in the Declaration of Helsinki. We enrolled 36 patients (as shown in Supplementary Table 1) with GT and their diagnosis were confirmed by pathological analysis. Samples from each patient consisted of GT tissue and matched GN (obtained 5 cm from the tumor margin). The tissue samples were cooled in liquid nitrogen within 5 min of collection by a trained surgeon, and then stored at –80 °C.
iEESI-MS Analysis
A small piece of gastric tissue was cut with a disposable sterile surgical blade and directly loaded into the source of the iEESI-MS instrument (as shown in Supplementary Figure 1). An electrospray of the tissue was formed when placed in a solvent and subjected to high pressure. The internal chemical analytes of the tissue samples were extracted and charged continuously using an ionizing solvent (methanol/water/acetic acid, 50:50:0.01 (v/v/v)), and transported by the infusion pump at a flow rate of 0.5 μL·min–1 and high voltage of +4.5 kV. All MS spectra were collected using a linear trap quadrupole mass spectrometer (LTQ-XL, Thermo Scientific, San Jose, CA) equipped with homemade iEESI-MS ion sources. The LTQ instrument was operated in positive ion detection mode and mass spectra were acquired in the m/z range of 50–300. The capillary was heated to 150 °C, the capillary voltage was 35 V, and the tube lens voltage was set at 100 V. All other parameters were set at the default values of the instrument. A total of 72 samples were analyzed in this study, including 36 GT and 36 GN tissue samples. After MS, the tissue samples were collected and sent for histopathological examination to verify the MS results.
Data Analysis
PLS of the mass spectral data was performed using Matlab software (version 7.8, Mathworks, Inc., Natick, MA). The iEESI-MS data obtained from human tissues were exported into Microsoft Excel and arranged according to m/z values with unit resolution as independent variables and using the relative abundance of the full scan mass (MS1) fingerprints as dependent variables. All mass spectral data were treated as matrix X, with the rows and columns corresponding to sample cases and m/z value variables, respectively. All mass spectral data expressed by relative abundance were directly used for analysis. First, mass spectral data were normalized using standard normal variate transformations to correct for baseline shifts and global variation in signal intensities, GT and GN tissue data were analyzed by PLS, and key small molecular substances that had the most influence on the separation of sample classes were identified. Next, receiver operating characteristic (ROC) curves of four key analytes and the areas under the curve (AUC) of the ROCs were calculated using SPSS version 21.0 software (SPSS, Chicago, IL, USA), and then used to assess the validity of the potential biomarkers and identify the optimized cut-off values. Data for continuous variables with normal distributions are presented as means and standard deviation (mean ± SD). Student’s t-test was used to compare mean values of two groups. Statistical analysis was performed using SPSS 21.0 software for Windows (SPSS, Chicago, IL, USA). Two-sided P values were calculated, and P ≤0.01 indicated a significant difference.
Results
Mass Spectral Data Of GT And GN Tissues
Internal analyte signals are captured when the ionized chemicals are inserted into a mass spectrometer. In positive ion mode, the mass range was set at 50–300 Da, the main peaks of GT tissues were observed at m/z 60.50, 83.33, 104.34, 132.30, 154.23, 170.27, 175.25, and 203.27, among others, while those of GN tissues were observed at m/z 55.32, 83.24, 99.22, 104.30, 132.25, 154.17, 175.13, and 203.17, among others (Figure 1).
 |
Figure 1 Mass spectral data obtained from human (A) GT tissue and (B) GN tissue in positive ion mode. |
PLS Analysis Of Mass Spectral Data Of GN And GT Tissues
The relative abundances of the mass spectral data were directly subjected to PLS analysis. A total of 72 sample database entries were included in the PLS score map, comprising 36 GT and 36 GN tissue samples. After PLS analysis, mass spectral data of GT and GN tissues were clearly distinguished based on the recorded spectra (Figure 2A and B). A three-dimensional model for distinguishing GT from GN tissues was established (Figure 2C). Peaks at m/z 55, 83, 99, 132, 147, 154, 170, 175, and 203 were differential analytes between the GT and GN tissues based on the loading score plots (Figure 2D).
 |
Figure 2 PLS analysis of mass spectral data of GN and GT tissues: (A) Score plots for PLS1 and PLS2; (B) score plots for PLS1 and PLS3; (C) 3D model to distinguish mass spectral data of GT and GN tissues; (D) loading score plots for screening differential analytes. |
Comparison Of Relative Abundances Of Differential Ions Between GT And GN Tissues
In GT tissue, the relative abundances of peaks at m/z 132, 147, 170, and 175 were increased, while those of peaks at m/z 55, 83, 154, and 203 were decreased (Figure 3). Five significantly differential ions, observed at m/z 55, 83, 154, 170, and 203, were identified (P≤0.01), indicating their involvement in discriminating the mass spectral data of GN and GT tissues. In contrast, the relative abundances of the other four ions showed no significant differences between GN and GT tissues (Table 1).
 |
Table 1 Comparison Of Relative Abundances Of Differential Ions Between GT And GN Tissues |
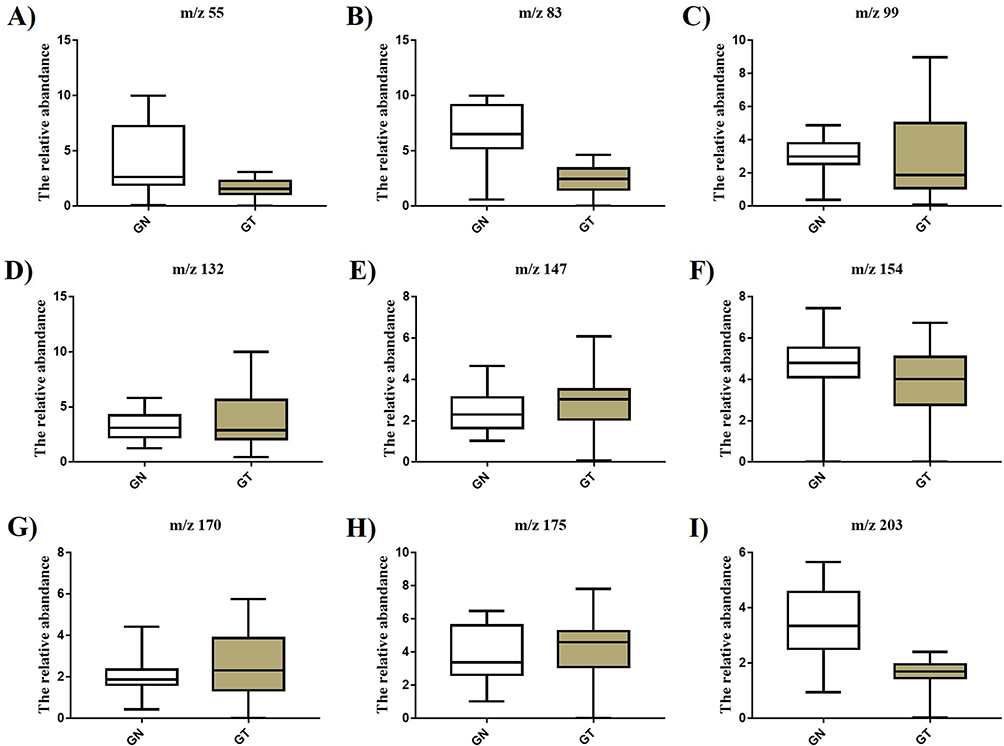 |
Figure 3 Quantitative analysis of the relative abundances of differential ions: (A) m/z 55, (B) m/z 83, (C) m/z 99, (D) m/z 132, (E) m/z 147, (F) m/z 154, (G) m/z 170, (H) m/z 175, (I) m/z 203. |
Performance Assessment Of Five Differential Small Molecular Substances To Discriminate GT From GN Tissues Using ROC
The ROC curve is defined as a diagram of the specificity of test sensitivity as the Y coordinate, with (1–specificity) as the X coordinate. ROC analysis is an effective method for evaluating the quality or performance of the diagnostic test, and is widely used in clinical medicine to assess the performance of many clinical trials. The rigorous statistical evaluation of the edges of new diagnostic tumors that distinguish cancer from normal tissue is a prerequisite for application to clinical medicine.12 ROC analysis is usually applied in bioinformatics to assess the ability of biomarkers to differentiate between the presence or absence of a disease. In a diagnostic or prognostic test, AUC values of 0.5–0.7, 0.7–0.9, and >0.9 represent low, moderate, and high accuracy, respectively. In the ROC curve analysis to distinguish GT and GN tissues in this study, the areas under the curves (AUC) for m/z 55, 83, 154, 170, and 203 were 0.759, 0.910, 0.654, 0.631, and 0.895, respectively (Figure 4). Accordingly, m/z 83 and 203 showed high accuracy for distinguishing GT from GN tissues. By searching the Human Metabolic Database, m/z 83 and 203 were preliminarily attributed to 5-aminoimidazole and serylproline, respectively.
 |
Figure 4 ROC curves of five small molecular substances with respective AUC values shown in parentheses: (A) m/z 55 (0.759), (B) m/z 83 (0.910), (C) m/z 154 (0.654), (D) m/z 170 (0.631), and (E) m/z 203 (0.895). |
Discussion
GT is among the most common types of cancer and the third highest cause of cancer-related mortality in China.13 The prognosis of patients with gastric cancer is generally quite severe, with only 30% of patients surviving five years after diagnosis of stages I–III, decreasing to <5% for stage IV.14,15 Surgery remains a main method for treating gastric cancer,16 and is especially important for accurately defining the surgical margin during surgery.6 In situ and near real-time identification of the tumor margins is very important to ensure radical tumor resection and minimize healthy tissue loss. Presently, tumor margins are established preoperatively by medical imaging and intraoperatively by frozen-section histology. Although frozen section analysis is the gold standard for tumor diagnosis and resection decision, this method has many shortcomings. First, histological methods cannot provide immediate results, usually taking at least 30–40 min. Second, the results are subjective because pathological diagnosis is based on the visual perception of morphological features.4
MS analysis techniques have become commonly employed in the detection and discrimination of endogenous biomolecules in biological tissue.17 The application of these techniques is now common in clinical studies, with mass spectrometric detection of important pathological molecules having shown prospects in gastric cancer research, providing further insight into the molecular aspects of the disease and helping to identify potential biomarkers.18 Internal extractive electrospray ionization mass spectrometry (iEESI-MS) is an ambient mass spectrometry technique capable of rapid and in situ solvent extraction of internal chemicals from biological tissue without pretreatment. Intraoperative tissue analysis using MS might be a new alternative to the standard frozen-section histology method. An important advantage of MS analysis is the objective capture of tissue bioinformatics. Many studies using mass spectrometry to identify biomarkers for the diagnosis of GT have been reported. Chang et al observed that human neutrophil peptides 1–3, which are considered to be potential biomarkers for the diagnosis and surveillance of gastric cancer, were overexpressed in gastric cancerous tissues using MALDI-TOF MS.19 Wang et al reported that fatty acid binding protein (FABP1) and fatty acid synthase (FASN) might be biomarkers for the detection of early gastric cancer.8 Furthermore, Kim et al showed that vitronectin, clusterin isoform 1, thrombospondin 1, and tyrosine-protein kinase SRMS could discriminate gastric cancer serum from the control.20
In this study, we used iEESI-MS to analyze GT and GN tissues, and then applied PLS to distinguish the mass spectral data of these two tissue types based on trace differences in small molecular substances. PLS analysis showed that the mass spectral data of GT and GN tissues could be clearly distinguished based on peaks at m/z 55, 83, 154, 170, and 203. The AUCs for each ion were obtained for the discovery and validation sets. In a diagnostic or prognostic test, AUC values of 0.5–0.7, 0.7–0.9, and >0.9 represent low, moderate, and high accuracy, respectively.12 The AUC values at m/z 55, 83, 154, 170, and 203 were 0.759, 0.910, 0.654, 0.631, and 0.895, respectively. Therefore, m/z 83 and 203 showed high accuracy for distinguishing GT from GN tissues. By searching the Human Metabolic Database, m/z 83 and 203 were preliminarily attributed to 5-aminoimidazole and serylproline, respectively. 5-Aminoimidazole and serylproline are closely related to the cancer occurrence and development, while the metabolism of 5-aminoimidazole is closely related to purine metabolism. Serylproline is a dipeptide composed of serine and proline, with the former having been reported as essential for tumor growth,21–24 while that latter is closely related to energy metabolism in cancer cells25,26 and cancer metastasis.27 In this study, the relative abundances of 5-aminoimidazole and serylproline in GN and GT tissues were different, making them useful potential biomarkers for identifying GT tissue.
Conclusion
This study showed that iEESI-MS in combination with PLS can be used to successfully distinguish GT from GN tissues. Furthermore, 5-aminoimidazole and serylproline were found to be useful potential molecular biomarkers associated with GT development. Further investigation of the functions of 5-aminoimidazole and serylproline might provide a better understanding of the underlying mechanisms involved in GT.
Acknowledgment
This work was supported by grants from the National Natural Science Foundation of China (grant number: 81560345), China Postdoctoral Science Foundation (grant number: 2017M610401), Preeminence Youth Fund of Jiangxi Province (grant number: 20162BCB23058) the Science and Technology Planning Project at the Department of Science and Technology of Jiangxi Province, China (grant number: 20151BBG70165).
Disclosure
The authors report no conflicts of interest in this work.
References
1. Siegel RL, Miller KD, Jemal A. Cancer statistics, 2016. CA Cancer J Clin. 2016;66:7–30. doi:10.3322/caac.21332
2. Kamangar F, Dores GM, Anderson WF. Patterns of cancer incidence, mortality, and prevalence across five continents: defining priorities to reduce cancer disparities in different geographic regions of the world. J Clin Oncol. 2006;24:2137–2150. doi:10.1200/JCO.2005.05.2308
3. Zhang J, Xu J, Ouyang Y, et al. Rapid discrimination of human oesophageal squamous cell carcinoma by mass spectrometry based on differences in amino acid metabolism. Sci Rep. 2017;7(1):3738. doi:10.1038/s41598-017-03375-8
4. Wei Y, Chen L, Zhou W, et al. Tissue spray ionization mass spectrometry for rapid recognition of human lung squamous cell carcinoma. Sci Rep. 2015;5(1):10077. doi:10.1038/srep10077
5. Balog J, Szaniszlo T, Schaefer KC, et al. Identification of biological tissues by rapid evaporative ionization mass spectrometry. Anal Chem. 2010;82:7343–7350. doi:10.1021/ac101283x
6. Balog J, Sasiszabó L, Kinross J, et al. Intraoperative tissue identification using rapid evaporative ionization mass spectrometry. Sci Transl Med. 2013;5:153–154. doi:10.1126/scitranslmed.3005623
7. Gu H, Du J, Carnevale NF, et al. Metabolomics method to comprehensively analyze amino acids in different domains. Analyst. 2015;140:2726–2734. doi:10.1039/c4an02386b
8. Jiang Z, Shen H, Tang B, Yu Q, Ji X, Wang L. Quantitative proteomic analysis reveals that proteins required for fatty acid metabolism may serve as diagnostic markers for gastric cancer. Clin Chim Acta. 2017;464:148–154. doi:10.1016/j.cca.2016.11.032
9. Luan J, Chu Z, Chandra J, Zhang P. Small molecular inhibitors targeting chromatin regulating proteins for cancer. Curr Protein Pept Sci. 2016;17:455–462.
10. Xu J, Chen H. Internal extractive electrospray ionization-mass spectrometry: a powerful platform for bioanalysis. Bioanalysis. 2018;10:523–525. doi:10.4155/bio-2018-0038
11. Zhang H, Gu H, Yan F, et al. Direct characterization of bulk samples by internal extractive electrospray ionization mass spectrometry. Sci Rep. 2013;3:2495. doi:10.1038/srep02495
12. Novoselova N, Della BC, Wang J, Li J, Pessler F, Klawonn F. Hum calculator and hum package for r: easy-to-use software tools for multicategory receiver operating characteristic analysis. Bioinformatics. 2014;30:1635–1636. doi:10.1093/bioinformatics/btu086
13. Chen W, Zheng R, Baade PD, et al. Cancer statistics in china, 2015. Ca A Cancer J Clin. 2016;66:115. doi:10.3322/caac.21338
14. Cheng C, Chang C, Patria YN, et al. Sex hormone‐binding globulin (shbg) is a potential early diagnostic biomarker for gastric cancer. Cancer Med. 2018;7:64–74. doi:10.1002/cam4.1254
15. Asaka M, Mabe K. Strategies for eliminating death from gastric cancer in Japan. Proc Jpn Acad Ser B Phys Biol Sci. 2014;90:251–258. doi:10.2183/pjab.90.251
16. Virgilio E, Balducci G, Mercantini P, et al. Preoperative gastric lavage in gastric cancer patients undergoing surgical, endoscopic or minimally invasive treatment: an oncological measure preventing peritoneal spillage of intragastric cancer cells and development of related metastases. Med Hypotheses. 2018;114:30–34. doi:10.1016/j.mehy.2018.02.023
17. Takats Z, Strittmatter N, McKenzie JS. Chapter Nine - Ambient Mass Spectrometry in Cancer Research. In: Drake RR, McDonnell LA, editors. Advances in Cancer Research. Vol. 134. Academic Press;2017:231–256. doi:10.1016/bs.acr.2016.11.011
18. Bălănescu P, Lădaru A, Bălănescu E, Băicuş C, Dan GA. Systemic sclerosis biomarkers discovered using mass-spectrometry-based proteomics: a systematic review. Biomarkers. 2014;19:345–355. doi:10.3109/1354750X.2014.920046
19. Cheng CC, Chang J, Chen LY, et al. Human neutrophil peptides 1-3 as gastric cancer tissue markers measured by maldi-imaging mass spectrometry: implications for infiltrated neutrophils as a tumor target. Dis Markers. 2012;32:21–31. doi:10.3233/DMA-2012-0857
20. Yoo MW, Park J, Han HS, et al. Discovery of gastric cancer-specific biomarkers by the application of serum proteomics. Proteomics. 2017;17(6):1600332. doi:10.1002/pmic.201600332
21. Possemato R, Marks KM, Shaul YD, et al. Functional genomics reveals serine synthesis is essential in phgdh-amplified breast cancer. Nature. 2011;476:346–350. doi:10.1038/nature10350
22. Yang M, Vousden KH. Serine and one-carbon metabolism in cancer. Nat Rev Cancer. 2016;16:650–662. doi:10.1038/nrc.2016.81
23. Locasale JW. Serine, glycine and one-carbon units: cancer metabolism in full circle. Nat Rev Cancer. 2013;13:572–583. doi:10.1038/nrc3557
24. Odk M, Athineos D, Cheung EC, et al. Modulating the therapeutic response of tumors to dietary serine and glycine starvation. Nature. 2017;544:372–376. doi:10.1038/nature22056
25. Sahu N, Dela CD, Gao M, et al. Proline starvation induces unresolved er stress and hinders mtorc1-dependent tumorigenesis. Cell Metab. 2016;24:753–761. doi:10.1016/j.cmet.2016.08.008
26. Loayzapuch F, Rooijers K, Buil LCM, et al. Tumour-specific proline vulnerability uncovered by differential ribosome codon reading. Nature. 2016;530:490–494. doi:10.1038/nature16982
27. Elia I, Broekaert D, Christen S, et al. Proline metabolism supports metastasis formation and could be inhibited to selectively target metastasizing cancer cells. Nat Commun. 2017;8:15267. doi:10.1038/ncomms15267
 © 2019 The Author(s). This work is published and licensed by Dove Medical Press Limited. The full terms of this license are available at https://www.dovepress.com/terms.php and incorporate the Creative Commons Attribution - Non Commercial (unported, v3.0) License.
By accessing the work you hereby accept the Terms. Non-commercial uses of the work are permitted without any further permission from Dove Medical Press Limited, provided the work is properly attributed. For permission for commercial use of this work, please see paragraphs 4.2 and 5 of our Terms.
© 2019 The Author(s). This work is published and licensed by Dove Medical Press Limited. The full terms of this license are available at https://www.dovepress.com/terms.php and incorporate the Creative Commons Attribution - Non Commercial (unported, v3.0) License.
By accessing the work you hereby accept the Terms. Non-commercial uses of the work are permitted without any further permission from Dove Medical Press Limited, provided the work is properly attributed. For permission for commercial use of this work, please see paragraphs 4.2 and 5 of our Terms.