")
Back to Journals » Infection and Drug Resistance » Volume 16
Investigation of Gut Microbiota Disorders in Sepsis and Sepsis Complicated with Acute Gastrointestinal Injury Based on 16S rRNA Genes Illumina Sequencing
Authors Zuo Z, Pei L, Liu T, Liu X, Chen Y, Hu Z
Received 7 October 2023
Accepted for publication 22 November 2023
Published 30 November 2023 Volume 2023:16 Pages 7389—7403
DOI https://doi.org/10.2147/IDR.S440335
Checked for plagiarism Yes
Review by Single anonymous peer review
Peer reviewer comments 2
Editor who approved publication: Professor Sandip Patil
Zhigang Zuo,1– 3 Liu Pei,4 Tianzhi Liu,2 Xiujuan Liu,2 Yuhong Chen,1,3 Zhenjie Hu1,3
1Department of Critical Care Medicine, the Fourth Hospital of Hebei Medical University, Shijiazhuang, Hebei, 050011, People’s Republic of China; 2Department of Critical Care Medicine, the First Hospital of Qinhuangdao, Qinhuangdao, Hebei, 066000, People’s Republic of China; 3Hebei Key Laboratory of Critical Disease Mechanism and Intervention, Shijiazhuang, Hebei, 050011, People’s Republic of China; 4Department of Laboratory, the First Hospital of Qinhuangdao, Qinhuangdao, Hebei, 066000, People’s Republic of China
Correspondence: Zhenjie Hu, Department of Critical Care Medicine, the Fourth Hospital of Hebei Medical University, No. 12 Jiankang Road, Shijiazhuang, Hebei, 050011, People’s Republic of China, Email [email protected]
Background: Sepsis is a life-threatening organ dysfunction caused by the host’s dysfunctional response to infection, which can cause acute gastrointestinal injury (AGI). The gut microbiota is dynamic and plays a role in the immune and metabolic. The aim of this study was to investigate the composition and function of gut microbiota in patients with sepsis, as well as the gut microbiome that may be involved in the occurrence of AGI.
Methods: A total of 23 stool samples from healthy control individuals and 41 stool samples from sepsis patients were collected. Patients with sepsis were followed up for one week to observe whether AGI has occurred. Finally, 41 patients included 21 sepsis complicated with AGI (referred to as Com-AGI) and 20 sepsis without complicated with AGI (referred to as No-AGI). The gut microbiota was analyzed by 16S rRNA gene sequencing, followed by composition analysis, difference analysis, correlation analysis, functional prediction analysis.
Results: The diversity and evenness of gut microbiota were decreased in patients with sepsis. Compared with No-AGI, the gut microbiota of Com-AGI has higher community diversity, richness, and phylogenetic diversity. Escherichia-Shigella, Blautia and Enterococcus may be important indicators of sepsis. The correlation analysis showed that aspartate aminotransferase (AST) and Barnesiella have the most significant positive correlation. Moreover, Clostridium_innocuum_group, Christensenellaceae_R-7_group and Eubacterium were all significantly correlated with LAC and DAO. Clostridium_innocuum_group, Barnesiella, Christensenellaceae_R-7_group and Eubacterium may play important roles in the occurrence of AGI in sepsis. PICRUSt analysis revealed multiple functional pathways involved in the relationship between gut microbiota and sepsis, including starch degradation V, glycogen degradation I (bacterial), Lipoic acid metabolism and Valine, leucine and isoleucine biosynthesis. BugBase analysis showed that the gut microbiota with Aerobic phenotype may play an important role in sepsis.
Conclusion: Dysfunction of gut microbiota was associated with sepsis and AGI in patients with sepsis.
Keywords: sepsis, acute gastrointestinal injury, gut microbiota, PICRUSt, classification model
Introduction
Sepsis is a global health care problem and remains the leading cause of death from infection.1 Sepsis is a life-threatening organ dysfunction caused by the host’s dysfunctional response to infection.2 Acute gastrointestinal injury (AGI) is often caused by serious illness such as infection, sepsis and shock.3 Among the organ dysfunction caused by sepsis, the gut is one of the most vulnerable organs.4 More and more evidence suggests that gastrointestinal dysfunction is associated with high mortality rates in patients with sepsis.5,6 Improving intestinal barrier damage is considered an important measure for treating sepsis.4 Therefore, exploring the potential link between sepsis and AGI may contribute to the management and treatment of patients.
Microbiota plays an important role in the maintenance of gastrointestinal physiology.7 The gut microbiota is dynamic and plays a role in the immune, metabolic, structural, and nervous systems of the human body.8 It has been reported that the regulation of the gut microbiota can significantly influence a variety of diseases, such as sepsis.9,10 The alterations of gut microbiota are associated with an increased susceptibility to sepsis and an increased risk of adverse consequences.11 In addition, gut microbiota types or gut abundance of enterococci may be used as biomarkers for sepsis intensive care unit patients to predict adverse outcomes.12,13 Moreover, regulating the gut microbiota through fecal microbiota transplantation or supplementation with probiotics has beneficial effects in patients with sepsis.14,15 Thus, it can be seen that identifying the potential gut microbiota of patients with sepsis is needed.
At present, 16S rRNA gene sequencing technology has become an important means of studying the composition and distribution of microbial communities.16 In this study, 23 stool samples from healthy control individuals and 41 stool samples from sepsis patients were collected. After one week of follow-up, it was found that 21 sepsis complicated with AGI and 20 sepsis without complicated with AGI. Subsequently, 16S rRNA gene sequencing technology was used to investigate the composition and function of gut microbiome. The aim of this study was to investigate the composition and function of gut microbiota in patients with sepsis, as well as the gut microbiome that may be involved in the occurrence of AGI.
Materials and Methods
Patients
In this study, a total of 23 stool samples from healthy control individuals and 41 stool samples from sepsis patients were collected. Samples were collected from patients with sepsis as soon as they were admitted to the intensive care unit (ICU). AGI did not onset in patients with sepsis at the time of sample collection. The detailed information of the individuals included in this study is shown in Table S1. Patients with sepsis were followed up for one week to observe whether AGI has occurred. Finally, 41 patients included 21 sepsis complicated with AGI (referred to as Com-AGI) and 20 sepsis without complicated with AGI (referred to as No-AGI). Detailed inclusion criteria for patients were as follows (1) The diagnosis of western medicine conforms to the sepsis standard in the “Third Edition International Consensus Definition of Sepsis and Infectious Shock”,17 and the definition and grading of AGI refer to standards such as the “European Association of Critical Care Medicine’s Guidelines for the Definition and Management of Acute Gastrointestinal Injury”;18 (2) Patient age >18 years old; (3) Patient has informed consent and is willing to cooperate. Detailed exclusion criteria for patients were as follows (1) Patients diagnosed with primary AGI or with primary diseases of the gastrointestinal system before the onset of sepsis; (2) Patients with severe gastrointestinal bleeding and gastrointestinal tumors; (3) Patients with sepsis caused by acute abdomen and abdominal infection; (4) Patients with previous gastrointestinal resection; (5) Patients with other malignant tumors; (6) Patients with combined immune system defects, hematological diseases, liver and kidney dysfunction, and abnormal coagulation function; (7) Pregnant women; (8) Patients with incomplete medical history information (such as patients who have not completed treatment and are automatically discharged early). Healthy control individuals (age >18 years old) were recruited.
Illumina MiSeq Sequencing
In this study, stool samples were collected for DNA extraction and detected by NanoDrop2000 and 1% agarose gel electrophoresis. Subsequently, DNA amplification was performed using ABI GeneAmp® 9700. The experiment used TransGen AP221-02: TransStart FastPfu DNA Polymerase 20 μL reaction system. Illumina’s TruseqTM DNA sample Prep Kit was used to construct DNA library. The constructed library was denatured by sodium hydroxide to produce single-strand DNA fragments. Then, sequencing was performed using the Illumina MiSeq platform.
Data Processing
The raw data (FASTQ format) obtained from MiSeq sequencing needs to undergo quality control, splicing, and filtering through FASTP (version V0.19.6) and FLASH (version V1.2.11). There may also be some polymerase chain reaction (PCR) amplification and sequencing errors in the optimized sequence obtained after data quality control and splicing. The sequence was further denoised by DADA2 to obtain the real sequence information amplicon sequence variant (ASV) in the sample. In order to obtain the species classification information corresponding to each ASV, species annotation (reference database: Silva138, https://www.arb-silva.de/documentation/release-138/) was carried out based on QIIME2 (version 2022.2) software. The species annotation method and classification confidence are classified-sklearn (Naive Bayes) and 0.7, respectively.
Diversity Analysis of Gut Microbiota
The vegan package was used for Pan/Core species analysis. Pan/Core species analysis was used to describe changes in total species and core species populations as the sample size increases. The mothur software (version 1.30) was used for alpha diversity analysis. The commonly used alpha diversity indices include sobs, chao, ace, shannon, simpson, shannoneven, coverage and phylogenetic diversity (PD). Sobs, chao and ace indices were used to reflect community richness. Shannon and simpson indices were used to reflect community diversity. Shannoneven indice was used to reflect community evenness. Coverage index was used to reflect community coverage. PD index was used to reflect community phylogenetic diversity. The Wilcoxon rank sum test was used to analyze the differences in alpha diversity indices between groups. Subsequently, beta diversity analysis was also performed. Principal coordinate analysis (PCoA) can be used to study the similarity or difference of sample community composition. The weighted UniFrac distance algorithm was used to calculate the distance between samples. The ANOSIM was used to test differences between groups. In addition, non-metric multidimensional scaling (NMDS) analysis was also performed.
Composition Analysis of Gut Microbiota
Community Circos diagram is a visual circle diagram that describes the corresponding relationship between samples and microbial species. The Circos diagram not only reflects the proportion of dominant species in each group of samples, but also reflects the distribution proportion of each dominant species in different groups.
Differential Analysis of Gut Microbiota Species
Based on community abundance data, Wilcoxon rank sum test was used to analyze gut microbiota with significant differences between groups. The screening criteria is P <0.05. In addition, the Pearson correlation coefficient between differential gut microbiota and clinical information was calculated using the corr.test function in R language.
Phylogenetic Investigation of Communities by Reconstruction of Unobserved States (PICRUSt) Functional Prediction Analysis
PICRUSt2 (version 2.2.0-b) is a software that predicts functional abundance based on marker gene (16S/18S/ITS) sequences. It supports prediction based on multiple gene family databases such as Kyoto Encyclopedia of Genes and Genomes (KEGG), Clusters of Orthologous Group (COG) and MetaCyc. KEGG is an integrated database resource composed of multiple databases such as KEGG module and KEGG pathway.19 Evolutionary genealogy of genes: Non-supervised Orthologous Groups (eggNOG) is an internationally recognized professional annotation database for homologous clustering gene groups, including functional classifications from original COG/KOG and taxonomic-based functional annotations.20 MetaCyc is a metabolic pathway database.21 The Wilcoxon rank sum test was used to analyze the differences between groups.
BugBase Phenotype Prediction Analysis
BugBase (https://bugbase.cs.umn.edu/documentation.html) is a microbiome analysis tool that can be used to identify high levels of phenotypes present in microbiome samples. It includes 7 major phenotypes, biofilm forming, mobile element containing, pathogenic, gram positive, gram negative, oxygen utilizing (aerobic, anaerobic, facultatively anaerobic) and oxidative stress tolerant. The Wilcoxon rank sum test was used to analyze the differences between groups.
Model Prediction Analysis
The Random Forest package was used to establish diagnostic classification models. The random forest algorithm was used to sort the importance of gut microbiota species from large to small according to the Mean Decrease Accuracy value. Subsequently, adding one gut microbiota species at a time in a top-down forward-wrapper approach according to the order of the random forest sorting results, and the area under curve (AUC) value was obtained by the 10-fold cross-validation process. The optimal biomarkers were selected according to the maximum value of AUC. In addition, pROC packets were used to perform receiver operator characteristic (ROC) analysis to verify the diagnostic accuracy of diagnostic classification model. AUC > 0.7 indicates that the model has a very good diagnostic accuracy.22
Statistical Analysis
The Shapiro test function was used to test the normality distribution of clinical data. If the clinical data conforms to normal distribution (P > 0.05), it was represented by the mean and standard deviation (SD). If the clinical data conforms abnormal distribution (P < 0.05), it was represented by the median and interquartile range (IQR). Wilcoxon rank sum test was used to analyze the difference of alpha diversity indices, gut microbiota, PICRUSt function and BugBase phenotypic between groups. The Pearson correlation between differential gut microbiota and clinical information was calculated using the corr.test function. P < 0.05 was considered statistically significant.
Results
Analysis of Clinical Data
In this study, a total of 23 healthy controls individuals and 41 patients with sepsis were included. Samples were collected from patients with sepsis as soon as they were admitted to the ICU. Age, Acute Physiology and Chronic Health Evaluation (APACHE)-II score, Sequential Organ Failure Assessment (SOFA) score, temperature, heart rate (HR), respiratory rate (RESP), glucose (GLU), C-reactive protein (CRP), procalcitonin (PCT), cardiac troponin I (cTnI), blood lactic acid (LAC), white blood cell (WBC), aspartate aminotransferase (AST), endotoxin, IL-6, D_Lactate, diamine oxidase (DAO) and multiple organ dysfunction syndrome (MODS) were significantly different between the control and sepsis groups (Table 1). In addition, 41 patients included 21 Com-AGI and 20 No-AGI. SOFA score, CRP, LAC, AST, endotoxin, IL_6, DAO, sepsis infection pathway, intra-abdominal pressure (IAP) and high blood pressure (HBP, also known as hypertension) were significantly different between the Com-AGI and No-AGI groups (Table 2).
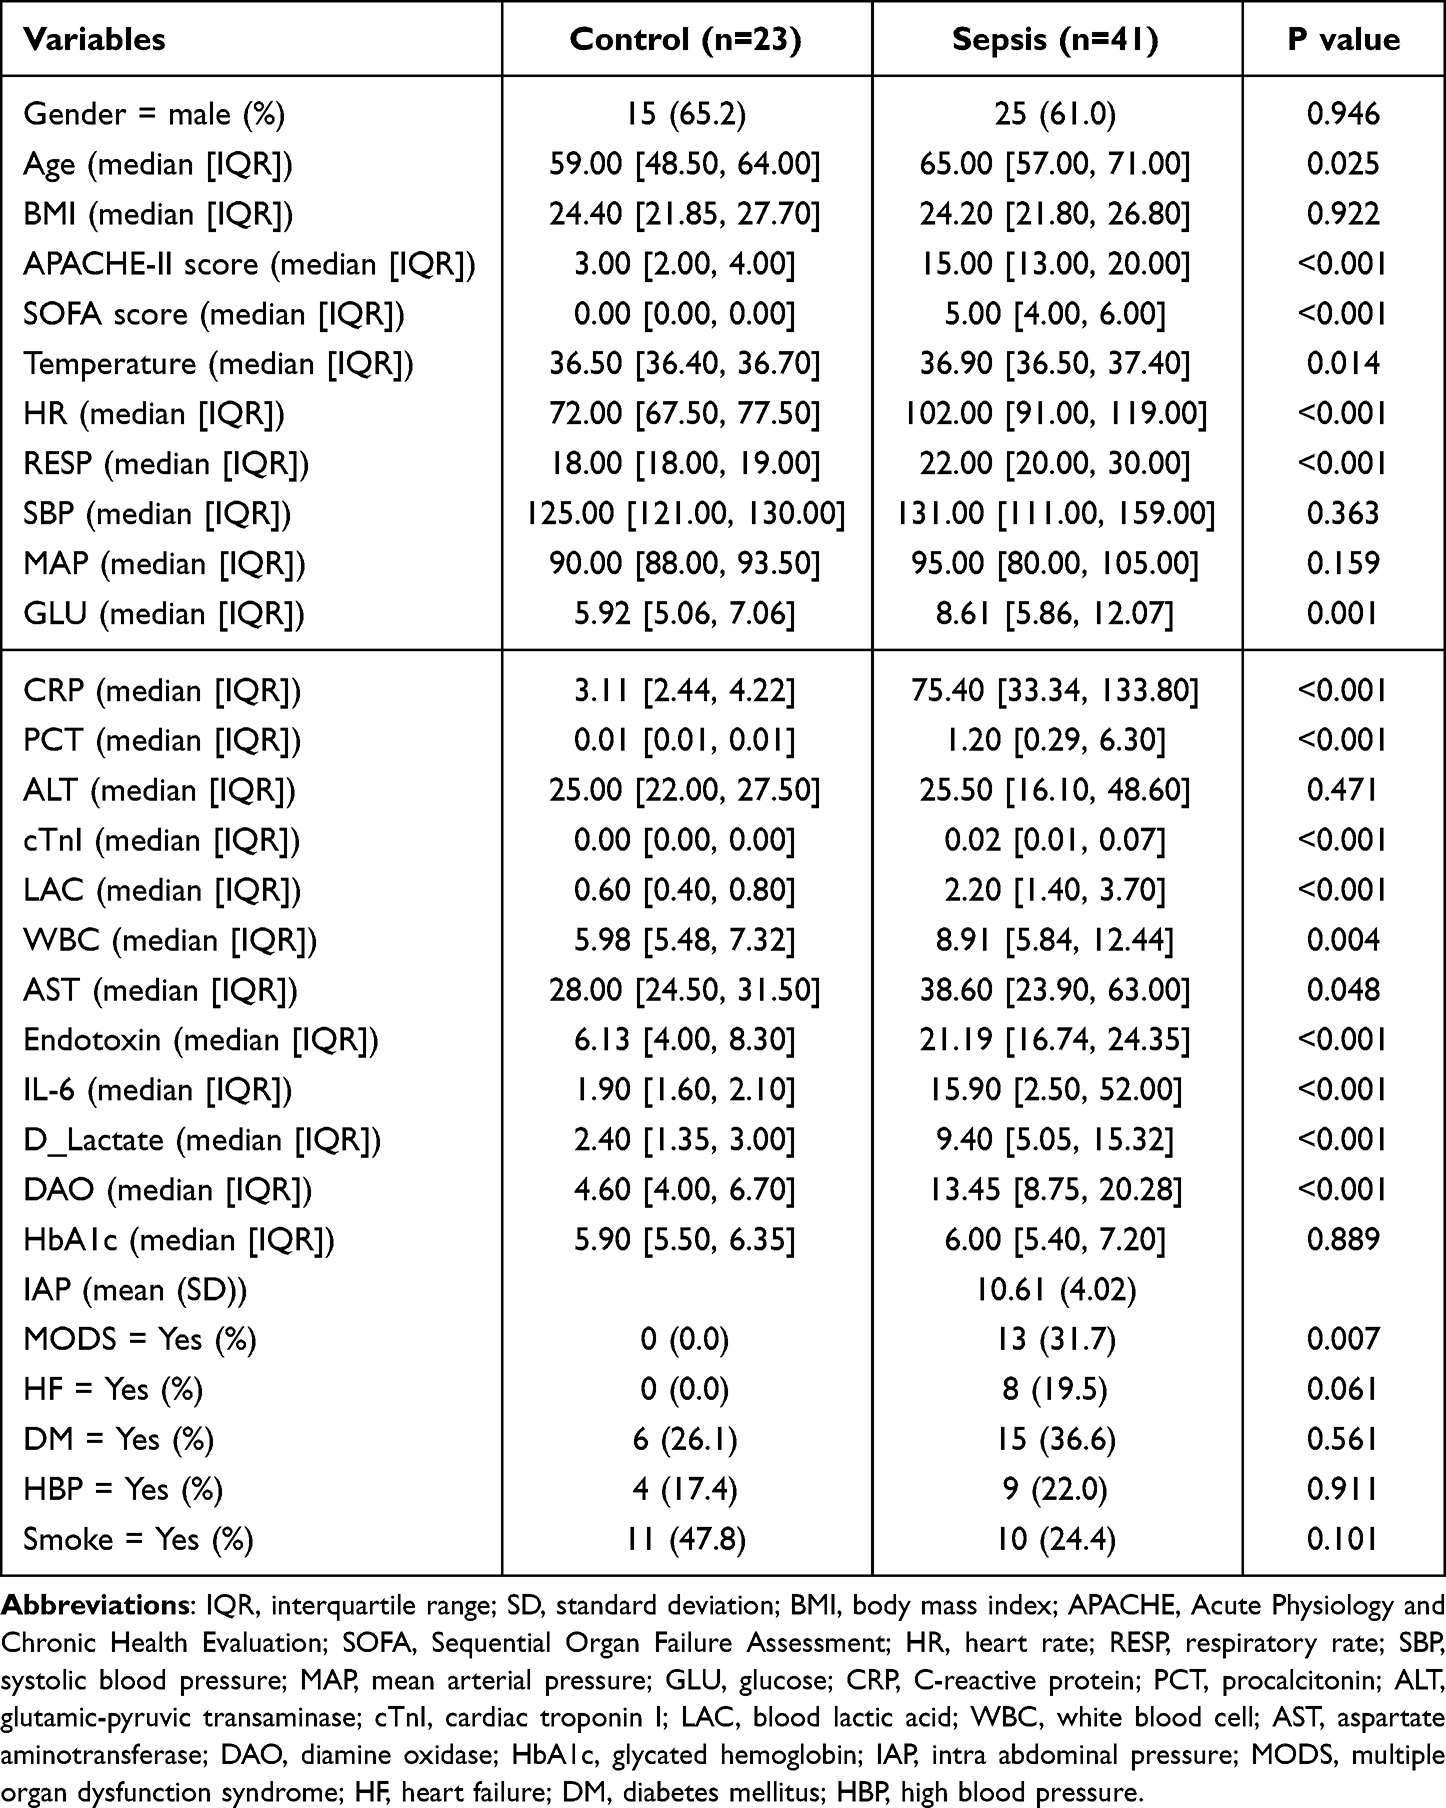 |
Table 1 Analysis of Clinical Characteristics of Control Individuals and Sepsis Patients |
 |
Table 2 Analysis of Clinical Characteristics of Sepsis Complicated with AGI and Sepsis without Complicated with AGI |
Diversity Analysis of Gut Microbiota in Different Groups
In Pan/Core analysis, with the number of samples increased, the total number of microbiota species was higher. However, with the number of samples increased, the number of core microbiota species was lower (Figure S1). Alpha diversity analysis showed that shannon in the sepsis group was lower than that in the control group, while simpson was higher than that in the control group, indicating that the community diversity in the sepsis group was lower than that in the control group (Figure 1A and B). In addition, the shannoneven of the sepsis group was lower than that of the control group, indicating that the community evenness of the sepsis group was also lower than that of the control group (Figure 1C). Subsequently, the alpha diversity was also analyzed in the Com-AGI and No-AGI groups. The ace, chao and sobs of the Com-AGI group were higher than that of the No-AGI group, indicating that the community richness of the Com-AGI group was also higher than that of the No-AGI group (Figure 1D-F). The PD of the Com-AGI group was higher than that of the No-AGI group, indicating that the community phylogenetic diversity of the Com-AGI group was also higher than that of the No-AGI group (Figure 1G). The shannon in the Com-AGI group was higher than that in the No-AGI group, while simpson was lower than that in the No-AGI group, indicating that the community diversity in the Com-AGI group was higher than that in the No-AGI group (Figure 1H and I). The coverage of the Com-AGI group was lower than that of the No-AGI group, indicating that the community coverage of the Com-AGI group was also lower than that of the No-AGI group (Figure 1J). These results imply that patients with high diversity, richness, and PD may be more prone to AGI. Subsequently, beta diversity analysis was also performed. The results of PCoA and NMDS analysis showed that the distribution between the healthy control and sepsis groups was significantly different (Figure 2A and B). However, the difference between the Com-AGI and No-AGI groups was not significant (Figure 2C and D). It is indicated that the structure of gut microbiota was significantly different between the healthy control and sepsis groups.
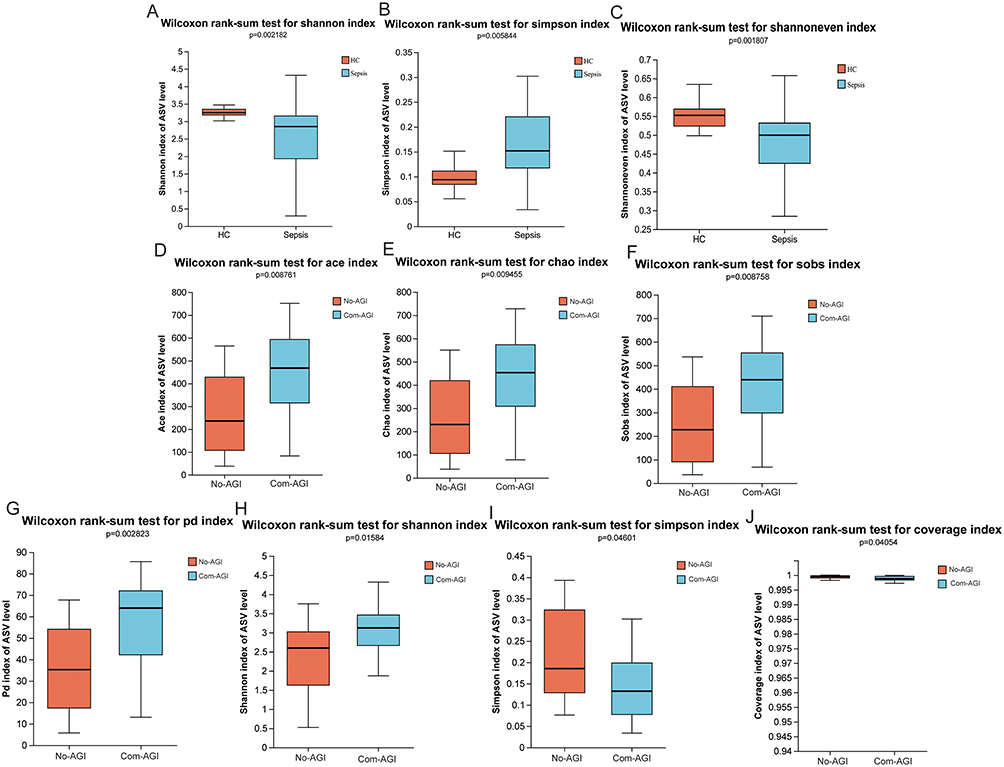 |
Figure 1 Alpha diversity analysis in healthy control, sepsis, Com-AGI and No-AGI groups. (A) Difference analysis of shannon index between healthy control and sepsis groups; (B) Difference analysis of simpson index between healthy control and sepsis groups; (C) Difference analysis of shannoneven index between healthy control and sepsis groups; (D) Difference analysis of ace index between Com-AGI and No-AGI groups; (E) Difference analysis of chao index between Com-AGI and No-AGI groups; (F) Difference analysis of sobs index between Com-AGI and No-AGI groups; (G) Difference analysis of PD index between Com-AGI and No-AGI groups; (H) Difference analysis of shannon index between Com-AGI and No-AGI groups; (I) Difference analysis of simpson index between Com-AGI and No-AGI groups; (J) Difference analysis of coverage index between Com-AGI and No-AGI groups. |
 |
Figure 2 Beta diversity analysis. (A) PCoA analysis between healthy control and sepsis groups; (B) NMDS analysis between healthy control and sepsis groups; (C) PCoA analysis between Com-AGI and No-AGI groups; (D) NMDS analysis between Com-AGI and No-AGI groups. |
Composition Analysis of Gut Microbiota in Different Groups
Circos diagram showed that the dominant gut microbiota at the phylum level of the healthy control and sepsis groups were Firmicutes, Proteobacteria, Actinobacteriota, Bacteroidota and Verrucomicrobiota (Figure 3A). Circos diagram also showed that the dominant gut microbiota at the phylum level in the No-AGI group were Firmicutes, Proteobacteria, Verrucomicrobiota, Actinobacteriota and Bacteroidota, but the dominant gut microbiota at the phylum level in the Com-AGI group were Firmicutes, Proteobacteria, Bacteroidota, Actinobacteriota and Patescibacteria (Figure 3B). At the same time, Circos diagram at the genus level was also drawn. The dominant gut microbiota at the genus level of the healthy control group were Faecalibacterium, Escherichia-Shigella, Klebsiella, Blautia and Eubacterium_hallii_group (Figure 3C). The dominant gut microbiota at the genus level of the sepsis group were Escherichia-Shigella, Enterococcus, Romboutsia, Klebsiella and Blautia (Figure 3C). The dominant gut microbiota at the genus level of the No-AGI group were Escherichia-Shigella, Enterococcus, Romboutsia, Klebsiella and Akkermansia (Figure 3D). The dominant gut microbiota at the genus level of the Com-AGI group were Escherichia-Shigella, Romboutsia, Enterococcus, Klebsiella and Blautia (Figure 3D). In addition, Circos diagram at the species level was also drawn (Figure 3E and F). However, at the species level, most gut microbiota have not been classified, and the corresponding species cannot be determined.
 |
Figure 3 Circos maps of the predominant dominant gut microbiota species at phylum, genus and species levels in different groups. (A) Circos maps of the predominant dominant gut microbiota species at phylum level in healthy control and sepsis groups; (B) Circos maps of the predominant dominant gut microbiota species at phylum level in Com-AGI and No-AGI groups; (C) Circos maps of the predominant dominant gut microbiota species at genus level in healthy control and sepsis groups; (D) Circos maps of the predominant dominant gut microbiota species at genus level in Com-AGI and No-AGI groups; (E) Circos maps of the predominant dominant gut microbiota species at species level in healthy control and sepsis groups; (F) Circos maps of the predominant dominant gut microbiota species at species level in Com-AGI and No-AGI groups. |
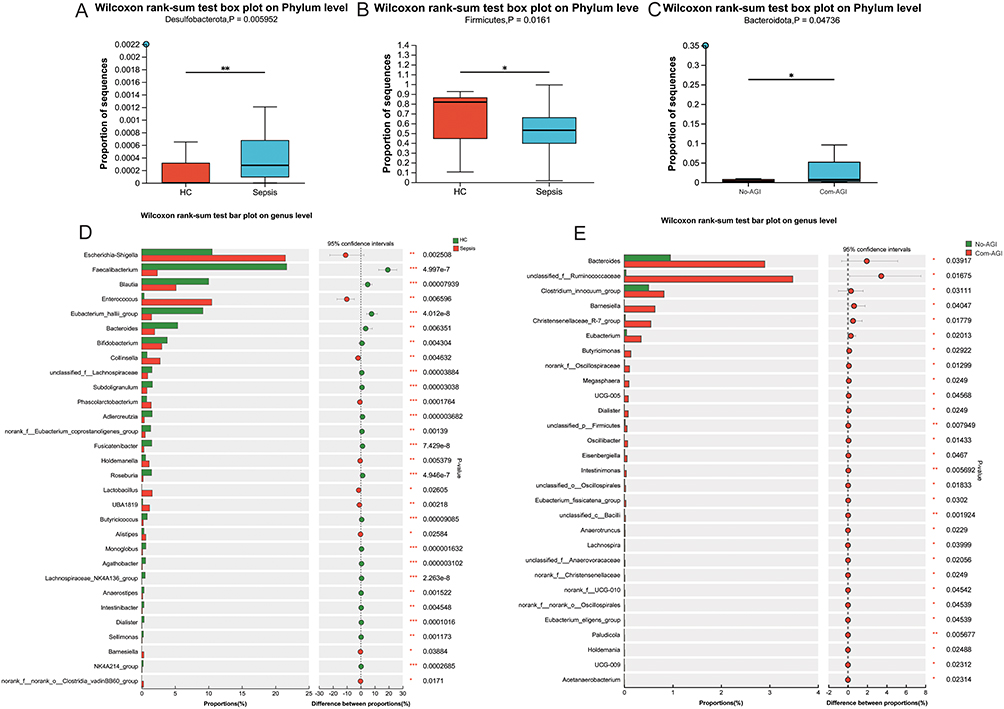 |
Figure 4 Differential species analysis of gut microbiota at phylum and genus levels. (A) Difference analysis of Desulfobacterota between healthy control and sepsis groups; (B) Difference analysis of Firmicutes between healthy control and sepsis groups; (C) Difference analysis of Bacteroidota between Com-AGI and No-AGI groups; (D) Differential species analysis of gut microbiota at genus level between healthy control and sepsis groups; (E) Differential species analysis of gut microbiota at genus level between Com-AGI and No-AGI groups; *, P <0.05; **, P <0.01; ***, P <0.001. |
Differential Analysis of Gut Microbiota Species at Phylum and Genus Levels
The Wilcoxon rank sum test showed that only Desulfobacterota and Firmicutes had significant differences at the phylum level between the healthy control and sepsis groups (Figure 4A and B). The Wilcoxon rank sum test also showed that only Bacteroidota had a significant difference at the phylum level between the Com-AGI and No-AGI groups (Figure 4C). At the genus level, 85 gut microbiota species were significantly different between healthy control and sepsis groups, such as Escherichia-Shigella, Faecalibacterium, Blautia, Enterococcus and Eubacterium_hallii_group. Histogram was drawn for the top 30 species with significant differences at the genus level (Figure 4D). At the genus level, 29 gut microbiota species were significantly different between Com-AGI and No-AGI groups, such as Bacteroides, Clostridium_innocuum_group, Barnesiella, Christensenellaceae_R-7_group and Eubacterium. Histogram was drawn for all species with significant differences at the genus level (Figure 4E). Subsequently, Pearson correlations between differential clinical information and differential gut microbiota species at the genus level were analyze (Figure S2). Correlation analysis showed that endotoxin, APACHE-II score, SOFA score and HR were associated with a variety of different gut microbiota species between healthy control and sepsis groups, while cTnI, IL_6, PTC and Age were associated with less different gut microbiota species (Figure S2A). Moreover, correlation analysis showed that IAP, DAO and lac were associated with a variety of different gut microbiota species between Com-AGI and No-AGI groups, while SOFA score, IL_6 and AST were associated with less different gut microbiota species (Figure S2B). In addition, the results of correlation analysis also showed that AST and Barnesiella have the most significant positive correlation.
PICRUSt Function and BugBase Phenotypic Prediction Analysis
In COG functional analysis, D (Cell cycle control, cell division, chromosome partitioning) function had the highest significant difference between healthy control and sepsis groups (Figure 5A and Table S2). In the metaCycle metabolic pathway prediction analysis, the abundance of multiple pathways such as PWY-6737 (starch degradation V), GLYCOCAT-PWY (glycogen degradation I (bacterial)) and PWY-5101 (L-isoleucine biosynthesis II) in the sepsis group was lower than that in the healthy control group (Figure 5B and Table S3). In the functional units of KEGG module, M00010 (Citrate cycle, first carbon oxidation, oxaloacetate => 2-oxoglutarate) and M00036 (Leucine degradation, leucine => acetoacetate + acetyl-CoA) was respectively the most significantly higher and lower functional composition of gut microbiota in sepsis group (Figure 5C and Table S4). In the functional units of KEGG pathway, ko00785 (Lipoic acid metabolism) and ko00290 (Valine, leucine and isoleucine biosynthesis) was respectively the most significantly higher and lower functional composition of gut microbiota in sepsis group (Figure 5D and Table S5). In the BugBase phenotypic analysis, only Aerobic phenotype was significantly different between the healthy control and sepsis groups (Figure S3).
 |
Figure 5 PICRUSt functional prediction analysis. (A) Difference analysis of COG functional composition of gut microbiota between healthy control and sepsis groups; (B) Difference analysis of MetaCyc functional composition of gut microbiota between healthy control and sepsis groups; (C) Difference analysis of KEGG Module functional composition of gut microbiota between healthy control and sepsis groups; (D) Difference analysis of KEGG Pathway functional composition of gut microbiota between healthy control and sepsis groups. *, P <0.05; **, P <0.01; ***, P <0.001. |
Prediction Analysis of Diagnostic Classification Model
The random forest algorithm was used to sort the importance of gut microbiota species from large to small according to the Mean Decrease Accuracy value (Figure 6A). Subsequently, it was found that the AUC value reached maximum when the number of species reached 24 through 10-fold cross-validation process (Figure 6B). Therefore, these 24 genera were considered to be the optimal biomarkers for sepsis. Then, a classification model was constructed based on 24 optimal biomarkers, and ROC analysis was performed. The ROC result showed that the classification model had good diagnostic accuracy (AUC = 0.948) in detecting sepsis (Figure 6C). In addition, the optimal biomarkers of Com-AGI were also analyzed based on random forest. A total of 13 genera were considered to be the optimal biomarkers for Com-AGI (Figure 6D and E). Similarly, a classification model was constructed based on 13 optimal biomarkers, and ROC analysis was performed. The ROC result showed that the classification model also had good diagnostic accuracy (AUC = 0.818) in detecting Com-AGI (Figure 6F).
 |
Figure 6 Construction of RF classification diagnosis models. (A) Rank the importance of the top 50 species of gut microbiota at the genus level in the healthy control and sepsis groups; (B) The tendency chart of AUC along with the increase of gut microbiota species; (C) ROC analyzed the diagnostic accuracy of the classification model composed of the top 24 genera; (D) Rank the importance of the top 50 species of gut microbiota at the genus level in the Com-AGI and No-AGI groups; (E) The tendency chart of AUC along with the increase of gut microbiota species; (F) ROC analyzed the diagnostic accuracy of the classification model composed of the top 13 genera. |
Discussion
The diverse and balanced gut microbiota enhances the host’s immunity to gut and systemic pathogens. This disruption of balance increases the susceptibility to sepsis and sepsis-related organ dysfunction, while the recovery of gut microbiota has a protective effect.23 A study has shown that there are significant dynamic changes in the gut microbiota of patients with sepsis of different severity.24 Previous studies have found that the diversity and evenness of gut microbiota in sepsis group are lower than that in healthy control group.25,26 In this study, shannon, simpson and shannoneven indices suggested that the diversity and evenness of gut microbiota in sepsis group were lower than that in healthy control group, which is consistent with previous reports. Among the organ dysfunction caused by sepsis, the gut is one of the most vulnerable organs.4 A study found that a higher AGI score was associated with an increase in sepsis mortality.27 Moreover, changes in gut microbiota are associated with the severity of AGI in sepsis.28 At present, there are few studies on early prediction of sepsis complicated with AGI, and there is a lack of effective biomarkers for early prediction and diagnosis. Herein, at the genus level, 29 gut microbiota species were found to be significantly different between Com-AGI and No-AGI groups, which provides potential research directions for future research.
The Firmicutes and Bacteroidota are the main component of healthy gut microbiota, and the ratio of Firmicutes to Bacteroidota is associated with disease susceptibility.29 Previous studies have found that the abundance of Firmicutes in the sepsis group is reduced.30,31 Moreover, its abundance increased in the sepsis group after treatment with related drugs.30,32 The Bacteroidota, also known as Bacteroidetes, is an anaerobic bacterium that plays a role in immunity and infection.33 It is usually associated with gut inflammation, and its abundance is also different before and after the treatment of sepsis.34,35 In the Circos diagram, Firmicutes and Bacteroidota is a dominant species at the phylum level. Moreover, the abundance of Firmicutes in the sepsis group was reduced compared to the control group, which is consistent with previous studies. Meanwhile, the abundance of Bacteroidota in the Com-AGI group was increased compared to the No-AGI group. Therefore, it is hypothesized that Firmicutes and Bacteroidota may play an important role in the development of sepsis and the development of AGI in sepsis patients, respectively. The Desulfobacterota can synthesize immunostimulatory endotoxin, its play a role in regulating SARS-CoV-2 mRNA vaccines immunogenicity.36 In this study, the abundance of Desulfobacterota in the sepsis group was increased compared to the control group. This suggested that the Desulfobacterota abundance anomalies may be associated with the occurrence of sepsis.
At the genus level, 85 gut microbiota species were significantly different between healthy control and sepsis groups, such as Escherichia-Shigella, Blautia and Enterococcus. Escherichia-Shigella is considered a conditional pathogen that causes infection and activates immune and inflammatory responses.37,38 Gut microbiota imbalance is a hallmark of IgA nephropathy patients, characterized by a significant expansion of the Escherichia-Shigella.39 The ratio of Escherichia-Shigella associated with lipopolysaccharide production was elevated in rats with sepsis.40 Blautia is a genus of anaerobic bacteria with probiotic characteristics and is widely present in the feces and intestines of mammals.41 Decreased levels of Blautia are associated with intestinal inflammation and inflammatory bowel disease.42,43 Enterococcus inhabits the intestines of almost all species, from insects to mammals, but its proportion in the gut microbiota of healthy individuals is relatively small. It can cause intestinal inflammation by stimulating immune cells.44 Moreover, it is also involved in the occurrence of sepsis in infants.45 In addition, at the genus level, 29 gut microbiota species were significantly different between Com-AGI and No-AGI groups, such as Clostridium_innocuum_group, Barnesiella, Christensenellaceae_R-7_group and Eubacterium. The abundance of Barnesiella correlates with the number of immunomodulatory cells, such as B cells and invariant natural killer T cells.46 Christensenellaceae_R-7_group and Clostridium_innocuum_group are mostly associated with metabolism.47–50 Eubacterium can regulate intestinal inflammation through short-chain fatty acids, and also regulate bile acid metabolism to promote intestinal and liver health.51 Therefore, it is speculated that Escherichia-Shigella, Blautia and Enterococcus may be important indicators of sepsis, and Clostridium_innocuum_group, Barnesiella, Christensenellaceae_R-7_group and Eubacterium may play an important role in sepsis complicated with AGI.
PICRUSt analysis revealed multiple functional pathways involved in the relationship between gut microbiota and sepsis, including cell cycle control, cell division, chromosome partitioning function, starch degradation V, glycogen degradation I (bacterial), L-isoleucine biosynthesis II, Citrate cycle, first carbon oxidation, oxaloacetate=>2-oxoglutarate, Leucine degradation, leucine => acetoacetate+acetyl-CoA, Lipoic acid metabolism and Valine, leucine and isoleucine biosynthesis. The occurrence and development of sepsis are closely related to the disorder of carbohydrate metabolism.52 Lipoic acid is involved in regulating inflammation and oxidative stress in patients with sepsis and is associated with Staphylococcus aureus tissue infection during sepsis.53,54 A study based on metabolomics and proteomics reveals the disorder of amino acid metabolism in sepsis.55 In addition, in BugBase phenotype analysis, only Aerobic phenotype was significantly different between the healthy control and sepsis groups. This suggested that Aerobic phenotype may play important roles in sepsis.
Random forest technology is a regression tree technique that uses bootstrap aggregation and randomization of predictors to achieve high prediction accuracy.56 In this study, two random forest classification models were constructed based on gut microbiota to distinguish between healthy controls and sepsis, as well as No-AGI and Com-AGI. In ROC analysis, AUC > 0.7 indicates that the model has a very good diagnostic accuracy.22 ROC analysis of the classification model of healthy control and sepsis showed that the AUC value was 0.948. This implies that the model can accurately classify the healthy controls and sepsis. Similarly, ROC analysis of the classification model of No-AGI and Com-AGI showed that the AUC value was 0.818. This also implies that the model can accurately classify the No-AGI and Com-AGI.
However, this study also has certain limitations. Firstly, the causal relationship between the identified gut microbiota and functional composition and sepsis or Com-AGI needs to be further investigated by functional experiments, such as fecal transplant experiment. Secondly, the constructed classification model also needs to collect a large number of clinical samples for further validation.
Conclusion
Compared with healthy control, the diversity and evenness of gut microbiota were decreased in patients with sepsis. Escherichia-Shigella, Blautia and Enterococcus may be important indicators of sepsis. In addition, the functions of gut microbiota that may be involved in the occurrence and development of sepsis were also found. Compared with No-AGI, the gut microbiota of Com-AGI has higher community diversity, richness, and phylogenetic diversity. Clostridium_innocuum_group, Barnesiella, Christensenellaceae_R-7_group and Eubacterium may play important roles in the occurrence of AGI in sepsis. Moreover, two random forest classification models were constructed based on gut microbiota. The results of ROC indicated that classification models can accurately classify the healthy controls and sepsis, as well as No-AGI and Com-AGI. In a word, our study extends the current knowledge on the role of gut microbiota in sepsis and Com-AGI, and also provides guidance and theoretical knowledge for the regulation of gut microbiota in the treatment of sepsis.
Data Sharing Statement
The datasets generated during and/or analysed during the current study are available from the corresponding author on reasonable request.
Ethics Approval and Consent to Participate
This study was approved by the Bioethics Committee of The First Hospital of Qinhuangdao (2022k015). The written informed consent was obtained from the all patients. All participants were informed as to the purpose of this study, and that this study complied with the Declaration of Helsinki.
Consent for Publication
The subjects gave written informed consent for the publication of any associated data and accompanying images.
Funding
This study was funded by “Qinhuangdao Science and Technology Research and Development Program (202301A250)”.
Disclosure
The authors declare no competing interests in this work.
References
1. Napolitano LM. Sepsis 2018: definitions and Guideline Changes. Surgical Infections. 2018;19(2):117–125. doi:10.1089/sur.2017.278
2. Srzić I, Nesek Adam V, Tunjić Pejak D. Sepsis Definition: what’s New In The Treatment Guidelines. Acta Clin Croatica. 2022;61(Suppl 1):67–72. doi:10.20471/acc.2022.61.s1.11
3. Reintam Blaser A, Preiser JC, Fruhwald S, et al. Gastrointestinal dysfunction in the critically ill: a systematic scoping review and research agenda proposed by the Section of Metabolism, Endocrinology and Nutrition of the European Society of Intensive Care Medicine. Critical Care. 2020;24(1):224. doi:10.1186/s13054-020-02889-4
4. Sun JK, Nie S, Chen YM, et al. Effects of permissive hypocaloric vs standard enteral feeding on gastrointestinal function and outcomes in sepsis. World j Gastroenterol. 2021;27(29):4900–4912. doi:10.3748/wjg.v27.i29.4900
5. Reintam Blaser A, Starkopf J, Moonen PJ, Malbrain M, Oudemans-van Straaten HM. Perioperative gastrointestinal problems in the ICU. Anaesthesiol Intensive Therapy. 2018;50(1):59–71. doi:10.5603/AIT.a2017.0064
6. Reintam Blaser A, Jakob SM, Starkopf J. Gastrointestinal failure in the ICU. Curr Opinion Critical Care. 2016;22(2):128–141. doi:10.1097/MCC.0000000000000286
7. An R, Wilms E, Masclee AAM, Smidt H, Zoetendal EG, Jonkers D. Age-dependent changes in GI physiology and microbiota: time to reconsider? Gut. 2018;67(12):2213–2222. doi:10.1136/gutjnl-2017-315542
8. Adak A, Khan MR. An insight into gut microbiota and its functionalities. Cell Mol Life Sci. 2019;76(3):473–493. doi:10.1007/s00018-018-2943-4
9. Chen Y, Zhou J, Wang L. Role and Mechanism of Gut Microbiota in Human Disease. Front Cell Infection Microbiol. 2021;11:625913. doi:10.3389/fcimb.2021.625913
10. Haak BW, Wiersinga WJ. The role of the gut microbiota in sepsis. lancet Gastroenterol Hepatol. 2017;2(2):135–143. doi:10.1016/S2468-1253(16)30119-4
11. Adelman MW, Woodworth MH, Langelier C, et al. The gut microbiome’s role in the development, maintenance, and outcomes of sepsis. Critical Care. 2020;24(1):278. doi:10.1186/s13054-020-02989-1
12. Agudelo-Ochoa GM, Valdés-Duque BE, Giraldo-Giraldo NA. Gut microbiota profiles in critically ill patients, potential biomarkers and risk variables for sepsis. Gut Microbes. 2020;12(1):1707610. doi:10.1080/19490976.2019.1707610
13. Kullberg RFJ, Wiersinga WJ, Haak BW. Gut microbiota and sepsis: from pathogenesis to novel treatments. Curr Opin Gastroenterol. 2021;37(6):578–585. doi:10.1097/MOG.0000000000000781
14. Bassetti M, Bandera A, Gori A. Therapeutic Potential of the Gut Microbiota in the Management of Sepsis. Critical Care. 2020;24(1):105. doi:10.1186/s13054-020-2780-3
15. Niu M, Chen P. Crosstalk between gut microbiota and sepsis. Burns & Trauma. 2021;9:tkab036. doi:10.1093/burnst/tkab036
16. Rapin A, Pattaroni C, Marsland BJ, Harris NL. Microbiota Analysis Using an Illumina MiSeq Platform to Sequence 16S rRNA Genes. Curr Protocols Mouse Biol. 2017;7(2):100–129. doi:10.1002/cpmo.29
17. Singer M, Deutschman CS, Seymour CW, et al. The Third International Consensus Definitions for Sepsis and Septic Shock (Sepsis-3). JAMA. 2016;315(8):801–810. doi:10.1001/jama.2016.0287
18. Reintam Blaser A, Malbrain ML, Starkopf J, et al. Gastrointestinal function in intensive care patients: terminology, definitions and management. Recommendations of the ESICM Working Group on Abdominal Problems. Intensive Care Med. 2012;38(3):384–394. doi:10.1007/s00134-011-2459-y
19. Kanehisa M, Furumichi M, Tanabe M, Sato Y, Morishima K. KEGG: new perspectives on genomes, pathways, diseases and drugs. Nucleic Acids Res. 2017;45(D1):D353–d361. doi:10.1093/nar/gkw1092
20. Jensen LJ, Julien P, Kuhn M, et al. eggNOG: automated construction and annotation of orthologous groups of genes. Nucleic Acids Res. 2008;36(Database issue):56.
21. Karp PD, Riley M, Paley SM, Pellegrini-Toole A. The MetaCyc Database. Nucleic Acids Res. 2002;30(1):59–61. doi:10.1093/nar/30.1.59
22. Šimundić AM. Measures of Diagnostic Accuracy: basic Definitions. Ejifcc. 2009;19(4):203–211.
23. Haak BW, Prescott HC, Wiersinga WJ. Therapeutic Potential of the Gut Microbiota in the Prevention and Treatment of Sepsis. Front Immunol. 2018;9:2042. doi:10.3389/fimmu.2018.02042
24. Liu Y, Guo Y, Hu S, et al. Analysis of the dynamic changes in gut microbiota in patients with different severity in sepsis. BMC Infect Dis. 2023;23(1):614. doi:10.1186/s12879-023-08608-y
25. Lee SJ, Kim D, Ann HW, et al. Deciphering gut microbiota in patients with severe sepsis and septic shock. Shock Augusta Ga. 2023. doi:10.1097/SHK.0000000000002241
26. Fang H, Fang M, Wang Y, et al. Indole-3-Propionic Acid as a Potential Therapeutic Agent for Sepsis-Induced Gut Microbiota Disturbance. Microbiology Spectrum. 2022;10(3):e0012522. doi:10.1128/spectrum.00125-22
27. Tyszko M, Citrulline L-PA. Intestinal Fatty Acid-Binding Protein and the Acute Gastrointestinal Injury Score as Predictors of Gastrointestinal Failure in Patients with Sepsis and Septic Shock. Nutrients. 2023;15(9):2100.
28. Han C, Guo N, Bu Y, et al. Intestinal microbiota and antibiotic-associated acute gastrointestinal injury in sepsis mice. Aging. 2021;13(7):10099–10111. doi:10.18632/aging.202768
29. Jandhyala SM, Talukdar R, Subramanyam C, Vuyyuru H, Sasikala M, Nageshwar Reddy D. Role of the normal gut microbiota. World j Gastroenterol. 2015;21(29):8787–8803. doi:10.3748/wjg.v21.i29.8787
30. Li Y, Zhao H, Sun G, et al. Alterations in the gut microbiome and metabolome profiles of septic rats treated with aminophylline. J Translational Med. 2022;20(1):69. doi:10.1186/s12967-022-03280-3
31. Szabó BG, Kiss R, Makra N, et al. Composition and changes of blood microbiota in adult patients with community-acquired sepsis: a pilot study from bench to bedside. Front Cell Infection Microbiol. 2022;12:1067476. doi:10.3389/fcimb.2022.1067476
32. Han B, Chao K, Wang D, et al. A purified membrane protein from Akkermansia muciniphila blunted the sepsis-induced acute lung injury by modulation of gut microbiota in rats. Int Immunopharmacol. 2023;121:110432. doi:10.1016/j.intimp.2023.110432
33. Wexler HM. Bacteroides: the good, the bad, and the nitty-gritty. Clin Microbiol Rev. 2007;20(4):593–621. doi:10.1128/CMR.00008-07
34. Han S, Zheng H, Han F, et al. Lactobacillus johnsonii 6084 alleviated sepsis-induced organ injury by modulating gut microbiota. Food Science & Nutrition. 2022;10(11):3931–3941. doi:10.1002/fsn3.2989
35. Parker BJ, Wearsch PA, Veloo ACM, Rodriguez-Palacios A. The Genus Alistipes: gut Bacteria With Emerging Implications to Inflammation, Cancer, and Mental Health. Front Immunol. 2020;11:906. doi:10.3389/fimmu.2020.00906
36. Daddi L, Dorsett Y, Geng T, Bokoliya S. Baseline Gut Microbiome Signatures Correlate with Immunogenicity of SARS-CoV-2 mRNA Vaccines. Nutrients. 2023;24(14):67.
37. Tan J, Zhong Z, Tang Y, Qin W. Intestinal dysbiosis featuring abundance of Streptococcus associates with Henoch-Schönlein purpura nephritis (IgA vasculitis with nephritis) in adult. BMC Nephrol. 2022;23(1):10. doi:10.1186/s12882-021-02638-x
38. Hu X, Du J, Xie Y, et al. Fecal microbiota characteristics of Chinese patients with primary IgA nephropathy: a cross-sectional study. BMC Nephrol. 2020;21(1):97. doi:10.1186/s12882-020-01741-9
39. Zhao J, Bai M, Ning X, et al. Expansion of Escherichia-Shigella in Gut Is Associated with the Onset and Response to Immunosuppressive Therapy of IgA Nephropathy. Journal of the American Society of Nephrology: JASN. 2022;33(12):2276–2292. doi:10.1681/ASN.2022020189
40. Sun J, Ding X, Liu S, Duan X, Liang H, Sun T. Adipose-derived mesenchymal stem cells attenuate acute lung injury and improve the gut microbiota in septic rats. Stem Cell Research & Therapy. 2020;11(1):384. doi:10.1186/s13287-020-01902-5
41. Liu X, Mao B. Blautia-a new functional genus with potential probiotic properties? Jan-Dec. 2021;13(1):1–21.
42. Suchodolski JS, Markel ME, Garcia-Mazcorro JF, et al. The fecal microbiome in dogs with acute diarrhea and idiopathic inflammatory bowel disease. PLoS One. 2012;7(12):e51907. doi:10.1371/journal.pone.0051907
43. Jenq RR, Ubeda C, Taur Y, et al. Regulation of intestinal inflammation by microbiota following allogeneic bone marrow transplantation. J exp med. 2012;209(5):903–911. doi:10.1084/jem.20112408
44. Stein-Thoeringer CK, Nichols KB. Lactose drives Enterococcus expansion to promote graft-versus-host disease. Science (New York, N.Y.). 2019;366(6469):1143–1149. doi:10.1126/science.aax3760
45. Hu XS, Zhu JG, Jiang CY, Chen XH, Yu ZB, Han SP. A clinical analysis of sepsis in very low birth weight infants. Chine j Contemporary Pediatrics. 2021;23(7):684–689. doi:10.7499/j.issn.1008-8830.2102114
46. Presley LL, Wei B, Braun J, Borneman J. Bacteria associated with immunoregulatory cells in mice. Appl. Environ. Microbiol. 2010;76(3):936–941. doi:10.1128/AEM.01561-09
47. He Z, Liu R, Wang M, et al. Combined effect of microbially derived cecal SCFA and host genetics on feed efficiency in broiler chickens. Microbiome. 2023;11(1):198. doi:10.1186/s40168-023-01627-6
48. Lozano CP, Wilkens LR, Shvetsov YB. Associations of the Dietary Inflammatory Index with total adiposity and ectopic fat through the gut microbiota, LPS, and C-reactive protein in the Multiethnic Cohort-Adiposity Phenotype Study. The American Journal of Clinical Nutrition. 2022;115(5):1344–1356. doi:10.1093/ajcn/nqab398
49. He X, Zhang M, Li ST, et al. Alteration of gut microbiota in high-fat diet-induced obese mice using carnosic acid from rosemary. Food Science & Nutrition. 2022;10(7):2325–2332. doi:10.1002/fsn3.2841
50. Liu J, Hao W, He Z, et al. Blueberry and cranberry anthocyanin extracts reduce bodyweight and modulate gut microbiota in C57BL/6 J mice fed with a high-fat diet. European Journal of Nutrition. 2021;60(5):2735–2746. doi:10.1007/s00394-020-02446-3
51. Mukherjee A, Lordan C, Ross RP. Gut microbes from the phylogenetically diverse genus Eubacterium and their various contributions to gut health. Gut Microbes. 2020;12(1):1802866. doi:10.1080/19490976.2020.1802866
52. Spitzer JJ, Bagby GJ, Mészáros K, Lang CH. Alterations in lipid and carbohydrate metabolism in sepsis. JPEN J Parenter Enteral Nutr. 1988;12(6 Suppl):53s–58s. doi:10.1177/014860718801200604
53. Della Giustina A, Goldim MP, Danielski LG, et al. Alpha-lipoic acid attenuates acute neuroinflammation and long-term cognitive impairment after polymicrobial sepsis. Neurochemistry Int. 2017;108:436–447. doi:10.1016/j.neuint.2017.06.003
54. Zorzoli A, Grayczyk JP. Staphylococcus aureus Tissue Infection During Sepsis Is Supported by Differential Use of Bacterial or Host-Derived Lipoic Acid. PLoS Pathogens. 2016;12(10):e1005933. doi:10.1371/journal.ppat.1005933
55. Chen Q, Liang X, Wu T, et al. Integrative analysis of metabolomics and proteomics reveals amino acid metabolism disorder in sepsis. Nutrients. 2022;20(1):123.
56. Rigatti SJ. Random Forest. J Insurance Med. 2017;47(1):31–39. doi:10.17849/insm-47-01-31-39.1
 © 2023 The Author(s). This work is published and licensed by Dove Medical Press Limited. The full terms of this license are available at https://www.dovepress.com/terms.php and incorporate the Creative Commons Attribution - Non Commercial (unported, v3.0) License.
By accessing the work you hereby accept the Terms. Non-commercial uses of the work are permitted without any further permission from Dove Medical Press Limited, provided the work is properly attributed. For permission for commercial use of this work, please see paragraphs 4.2 and 5 of our Terms.
© 2023 The Author(s). This work is published and licensed by Dove Medical Press Limited. The full terms of this license are available at https://www.dovepress.com/terms.php and incorporate the Creative Commons Attribution - Non Commercial (unported, v3.0) License.
By accessing the work you hereby accept the Terms. Non-commercial uses of the work are permitted without any further permission from Dove Medical Press Limited, provided the work is properly attributed. For permission for commercial use of this work, please see paragraphs 4.2 and 5 of our Terms.