Back to Journals » Neuropsychiatric Disease and Treatment » Volume 19
Investigation of Altered Spontaneous Brain Activity Patterns in Herpes Zoster Keratitis Using the Percent Amplitude of Fluctuation Method: A Resting-State Functional Magnetic Resonance Imaging Study
Authors Liao X, Li CQ, Ge QM ![]() , Tang LY, Su T
, Tang LY, Su T ![]() , Li QY, Pan YC
, Li QY, Pan YC ![]() , Shu HY, Zhang LJ
, Shu HY, Zhang LJ ![]() , Shao Y
, Shao Y ![]()
Received 14 March 2023
Accepted for publication 27 April 2023
Published 15 August 2023 Volume 2023:19 Pages 1781—1789
DOI https://doi.org/10.2147/NDT.S412516
Checked for plagiarism Yes
Review by Single anonymous peer review
Peer reviewer comments 2
Editor who approved publication: Professor Richard J Porter
Xulin Liao,1,2 Chu Qi Li,1 Qian Min Ge,1 Li Ying Tang,3 Ting Su,4 Qiu Yu Li,1 Yi Cong Pan,1 Hui Ye Shu,1 Li Juan Zhang,1 Yi Shao1
1Department of Ophthalmology, The First Affiliated Hospital of Nanchang University, Nanchang, Jiangxi, 330006, People’s Republic of China; 2Department of Ophthalmology and Visual Sciences, The Chinese University of Hong Kong, Kowloon, Hong Kong SAR, People’s Republic of China; 3Department of Ophthalmology, Zhongshan Hospital of Xiamen University, Xiamen, Fujian, 361004, People’s Republic of China; 4Department of Ophthalmology, Massachusetts Eye and Ear, Harvard Medical School, Boston, MA, 02114, USA
Correspondence: Yi Shao, Department of Ophthalmology, The First Affiliated Hospital of Nanchang University, No. 17, Yong Wai Zheng Street, Dong Hu District, Nanchang, Jiangxi, 330006, People’s Republic of China, Tel/Fax +86 791-88692520, Email [email protected]
Purpose: The purpose of this study was to use the percent amplitude of fluctuation (PerAF) to study the changes in brain activity and nerve function of herpes zoster keratitis (HZK) patients.
Methods: We recruited 20 HZK patients and 20 healthy controls (HCs). Each of these groups included ten males and ten females and were matched in weight and age. All participants underwent resting-state functional magnetic resonance imaging (rs-fMRI). The percent amplitude of fluctuation (PerAF) method was used for analysis and detected differences between the two groups in the neurological function of brain areas. We also applied the receiver operating characteristic (ROC) curve to analyze the two groups and did a correlation analysis between the PerAF value, anxiety and depression score, and visual acuity.
Results: The PerAF signal at the right putamen and right precentral gyrus was significantly higher in patients than in HCs. However, the PerAF value of the left inferior temporal was lower in patients than in HCs. In addition, the HZK patients’ anxiety and depression score (HADS) and visual acuity (V.A.) Log MAR negatively correlated with the PerAF value at the left inferior temporal gyrus.
Conclusion: HZK patients had some changes in brain regions, and the changes were also related to their mood and visual acuity. These findings might contribute to other studies on the potential pathological mechanism, disease development, prognosis, and brain function in HZK patients.
Keywords: herpes zoster keratitis, resting-state functional magnetic resonance imaging, brain activity patterns, brain region, the percent amplitude of fluctuation
Introduction
Herpes zoster keratitis (HZK) was caused by varicella-zoster virus infection.1,2 When the human body’s immune system weakens or when the human body lacks nutrition and rest, the virus, latent in the trigeminal ganglion, might be activated and cause disease. Patients with immunodeficiency, such as AIDS patients, were more susceptible to varicella-zoster virus infection and more likely to relapse than ordinary immune function people. Varicella-zoster virus infection had a high incidence rate in China, approximately 7/1000.3 It usually occurs after the appearance of a skin rash. HZK sometimes would combine with other eye diseases, such as blepharitis, conjunctivitis, keratitis, scleritis, uveitis, and retinopathy.4 Varicella-zoster virus could cause immune-mediated damage in all corneal layers and might lead to corneal scarring, thinning, and neovascularization. Finally, HZK patients might have a visual impairment and become blind.5 Thus, HZK could cause a severe burden on patients’ quality of life and the economy.
In this study, functional magnetic resonance imaging (fMRI) technology was performed to analyze the changes in human brain structure and function when patients suffered HZK. Resting-State Functional Magnetic Resonance Imaging (Rs-fMRI) differed from other types of fMRI due to its advantages of easier signal acquisition, easier functional brain area identification, and minimum requirements for patients. The amplitude of low-frequency fluctuation method was commonly used to study changes in brain activity.6 Another novel and advanced method of analysis was regional homogeneity,7 which involves analysis of the functional state of the brain as a whole within a single period. Its disadvantage was that it could not accurately reflect the activity and function of the neuron in a specific integrin. The method we applied in the present research was the percentage amplitude of fluctuation. It could be used both with and without dividing the whole-brain mean value.8 PerAF has been applied successfully in scientific research on the brain.9 Another technique used in this study was mean PerAF, which involves measurement of the PerAF of a single voxel as a fraction of the whole brain, and has better inter-scanner reliability.10 Thus, the method of PerAF had excellent potential for analyzing the whole brain and appeared to be superior to the amplitude of low-frequency fluctuation method and regional homogeneity methods.
This pioneering study used fMRI and PerAF to investigate functional differences in brain areas of HZK patients and aimed to contribute to further research on HZK development, prognosis, and brain function changes.
Methods
Subjects
20 HZK patients (10 males and 10 females) were recruited from the Department of Ophthalmology, the First Affiliated Hospital of Nanchang University. The inclusion criteria for the HZK group included: (1) Age from 30 to 65 years; (2) Unilateral facial rash or skin with a history of residual scars or brown deposits; (3) Keratitis; (4) Macrophages and nuclear eosinophilic inclusion bodies identified in the acute phase of corneal epithelial scraping; (5) No contraindications to MRI scanning. The exclusion criteria included: (1) Patients with other eye diseases such as cataracts or glaucoma; (2) Patients who have received eye surgery treatments such as myopia surgery, cataract surgery, or glaucoma surgery; (3) The presence of severe systemic disease. Healthy controls were matched in age and weight. The control group was also composed of 10 males and 10 females. The inclusion criteria for the healthy controls group included: (1) binocular uncorrected visual acuity >0.8; (2) No eye diseases; (3) No systemic diseases; (4) No MRI scan contraindications.
Parameters for MRI
The Department of Radiology at the First Affiliated Hospital of Nanchang University was responsible for conducting the MRI operations and data extraction. This study utilized a 3-Tesla Trio MR scanner (Siemens, Munich, Germany).11 Prior to scanning, participants were instructed to relax, close their eyes, and minimize movement. Functional data was obtained using a 3D metamorphic gradient echo pulse sequence. The following parameters were used for a 176-image scan: acquisition matrix 256 × 256, field of view 250 mm × 250 mm, echo time 2.26 ms, repetition time 1900 ms, thickness 1.0 mm, gap 0.5 mm, and flip angle 9°. For a 240-image scan, the parameters were as follows: acquisition matrix 64 × 64, field of view 220 mm × 220 mm, thickness 4.0 mm, gap 1.2 mm, repetition time 2000 ms, echo time 30 ms, flip angle 90°, with 29 axial slices.
Functional Magnetic Resonance Imaging Data Analysis
The MRIcro software (Nottingham University, Nottingham, UK) was used to sort and exclude incomplete or flawed data.12 The remaining data were processed using DPARSFA, which included standardizing the space, correcting head movement, aligning the slice times, and converting the digital image format. Linear regression was used to remove the influence of signals from white matter.13 Participants with excessive head movements (greater than 3 mm) were excluded from the analysis due to the potential impact on the fMRI sequence.14 Brain images were standardized to account for inter-individual differences in brain size and structure. Regions of interest in the central white matter region were used to control for irrelevant variables. The PerAF method was used to process the fMRI data, which is a reliable and direct measure of brain activity. The average BOLD signal value was calculated, and the signal strength at each time point was normalized to this value. This produced an amplitude at each time point as a percentage of the average across the time series, as well as a signal change percentage similarity index called PerAF. The formula used to calculate the PerAF value of a single voxel is as follows:
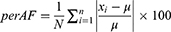

where Xi represents the signal strength at a given time point, n is the total number of time points, and μ is the mean value of the time series.
Correlation Analysis
The anxiety and depression scores of HZK patients were obtained using the Hospital Anxiety and Depression Score (HADS). Pearson’s correlation analysis was used to examine the correlations between HADS and visual acuity (measured in Log MAR, VA) with PerAF values in the left inferior temporal gyrus. GraphPad Prism (8.0, USA) was used to plot the linear correlations.
Statistical Analysis
The SPSS software (IBM SPSS Statistics for Windows, Version 25.0; Armonk, NY, USA) was used to conduct independent sample t-tests for between-group comparisons. The REST software was used to perform independent sample t-tests comparing PerAF values between the HZK and HC groups. Multiple comparison correction was done using Gaussian random field theory, with a voxel-level threshold of p < 0.001. The AlphaSim tool within the REST toolbox was used for correction, with a cluster size set at >49 voxels and a level of p < 0.05. Receiver operating characteristic (ROC) curves were used to compare the average PerAF values of relevant brain areas between the HZK and HC groups, and to calculate estimates of diagnostic accuracy based on the area under the curve (AUC). Pearson’s correlation was used to evaluate the relationship between HADS and VA (Log MAR) with PerAF. All averaged data are presented as mean ± standard deviation. The regions were defined using automatic anatomic labeling based on the Montreal Neurological Institute data set. A p-value of <0.05 was considered statistically significant.
Results
Demographic Characteristics
The average age of patients in the HZK group was 54.21 years, and their average weight was 65.32 kg. The patients were right-hand dominant. The average duration of the disease was about 25 days. The mean monocular best-corrected visual acuities (Log MAR) were 0.63 (left) and 0.33 (right). In the HCs group, the average age was 54.21 years, and the average weight was 67.16, with right-hand dominance. The mean monocular best-corrected visual acuities (Log MAR) were 0.01 (left) and 0.01 (right). No significant difference was found between the two groups in terms of gender, age, weight, or dominant hand (P>0.05), but there was a significant difference between the groups in visual acuity of the left eye (p<0.001) and the right eye (p<0.001) (Table 1).
 |
Table 1 Basic Information of Participants |
PerAF Differences
For the HZK group, the PerAF signal values in the brain regions of the right putamen and the right precentral gyrus were significantly higher than those of the HCs group (P<0.05). In contrast, the PerAF signal value in the left inferior temporal gyrus was significantly reduced compared with the HCs group (p<0.05) (Figure 1) (Table 2).
 |
Table 2 Brain Areas with Significantly Different PerAF Values Between the HZK and HCs |
 |
Figure 1 (A and B) Spontaneous brain activity in HZK and HCs. Red, blue, and yellow shadows represented the strength of the signals. The Right Putamen and Right Precentral gyrus exhibited higher signals, while the Left Inferior Temporal exhibited lower signals (P<0.005 for multiple comparisons using Gaussian random field theory, cluster >99 voxels, AlphaSim corrected). (C) The mean PerAF signal value between the HZK and HCs groups. Abbreviations: HZK, herpes zoster keratitis; HCs, healthy controls; PerAF, percent amplitude of fluctuation; R, right; L, left. Notes: Compared with HCs, the asterisk (*) means the statistical significance P < 0.05. |
ROC Curve Analysis
The ROC curve analysis results showed that the signal value of the mean PerAF in the Left Inferior Temporal Gyrus (area under the ROC curve (AUC) = 0.902, 95% CI= 0.7789 to 1.000, P=0.0002), Right Putamen (AUC= 0.956, 95CI%=0.8685 to 1.000, P= <0.0001) and Right Precentral (AUC=0.800, 95% CI= 0.6316 to 0.9684, P= 0.0051) might be used as a potential diagnostic marker for HZK (Figure 2).
 |
Figure 2 ROC curve analysis of the mean PerAF values for altered brain regions. Abbreviations: AUC, area under the curve; ROC, receiver operating characteristic. Notes: The Left Inferior Temporal Gyrus (AUC=0.902, 95% CI=0.7789, 1.000; P=0.0002), Right Putamen (AUC=0.956, 95CI%=0.8685, 1.000; P=<0.0001) and Right Precentral (AUC=0.800, 95% CI=0.6316, 0.9684, P=0.0051) might be used as a potential diagnostic marker for HZK. |
Correlation Analysis
Linear correlation analysis showed that in HZK patients, HADS scores were negatively correlated with the PerAF value in the left inferior temporal gyrus (r = 0.8687, P <0.0001). The result suggested that HZK patients experienced greater anxiety and depression. (Figure 3A) Visual acuity was negatively correlated with the PerAF value in the left inferior temporal gyrus (r=0.6523, p=0.0018), indicating that the HZK patients had poorer visual acuity (Figure 3B).
 |
Figure 3 (A) Correlations between the Hads scores and the PerAF signal values of left inferior temporal gyrus in HZK patients. (B) Correlations between the visual acuity (LogMAR) and the PerAF signal values of left inferior temporal gyrus in HZK patients. Abbreviations: HADS, Hospital Anxiety and Depression Scale; PerAF, percent amplitude of fluctuation; HZK, herpes zoster keratitis. |
Discussion
This study was the first study to apply fMRI technology and PerAF method in HZK patients. In this study, we used the method of percent amplitude of fluctuation, a theoretically more reliable and accurate method than the low-frequency fluctuation amplitude and regional homogeneity methods, to study the neural activity in different brain regions of HZK patients compared with healthy controls. Our results showed a relatively high PerAF value at the right putamen and the right precentral gyrus and a low value at the left inferior temporal gyrus in HZK patients (Figure 4).
 |
Figure 4 The mean PerAF values of altered brain regions. Abbreviations: HCs, healthy controls; B.A., Brodmann’s area. Notes: Compared with the HCs, the perAF values of the following regions were changed in various extents: 1- Right Putamen (BA 74, t = 7.894), 2- Left Inferior Temporal (BA 89, t = −5.8829), 3- Right Precentral (BA 2, t = 5.0579). |
The right putamen is a subcortical brain structure that is part of the basal ganglia and is involved in motor control, learning, and decision-making.15 It is not clear how the putamen may be related to a specific disease, as the putamen is not directly involved in the immune system or in the development of most diseases. However, some research has suggested that damage to the putamen and other brain structures may be associated with certain neurodegenerative diseases such as Parkinson’s disease and Huntington’s disease.16,17 Additionally, study have shown that the putamen may be involved in the processing of pain and other sensory information, so it is possible that the putamen may play a role in the experience of certain types of chronic pain.18 HZK is known to cause pain and our study found that at the right putamen, the signal intensity of PerAF was higher in HZK patients than in healthy controls. The changes at the right putamen might reveal the pathological mechanism of HZK and its changes on the brain might be useful for pain management in HZK patients.
The right precentral gyrus was located in the frontal lobe between the central sulcus and the central anterior sulcus. It contained many large pyramidal cells and was the center for movement control.19 It is important to note that the precentral gyrus is not directly involved in the control of eye movements or vision. However, damage to this area can result in motor deficits that can impact eye movements, such as those seen in conditions like hemiparesis.20,21 Other study show that the precentral gyrus was related to chronic pain,22 which is similar to our study. Our study found that in HZK patients, the PerAF signal intensity was significantly higher in both the right precentral gyrus and the right putamen areas than in healthy controls, further demonstrating altered brain activity.
The inferior temporal gyrus was related to visual processing, perception, facial perception, and digital recognition. One study has shown that inferior temporal gyrus damage impacts attention.23 For corneal ulcer patients, Our previous studies also have demonstrated that the regional homogeneity levels were increased in the inferior temporal gyrus.24 For patients with monocular blindness, compared with a healthy control group, the signal value of degree centrality of the left inferior temporal gyrus was increased.25 In the present study, HZK patients had decreased PerAF signal intensity than healthy controls in the left inferior temporal gyrus. Our results might help diagnose HZK and understand its underlying pathological mechanism.
Overall, the PerAF value at the left inferior temporal gyrus was significantly decreased in HZK patients compared with healthy controls. This reduced value suggested that related brain areas’ functional activities had become inactive, causing impaired visual perception and cognition. However, the PerAF values at the right putamen and right precentral brain areas significantly increased, indicating that some functional activities were enhanced in these two brain regions. We speculated that the change in the brain area of HZK patients might affect their visual processing, perception, sensory cognition, and emotional cognition. The limitations of our study include the small sample size and it is a cross-sectional study. Future research should focus on conducting a large-scale, multicenter, longitudinal study with a more substantial sample size. However, our findings might help understand the disease, including treatment, cognition, affect, underlying pathological mechanism, and diagnosis (Figure 5) (Table 3).
 |
Table 3 Brain Region Alternation and Its Potential Impact |
 |
Figure 5 The relationships among herpes zoster keratitis, brain activity, and mood changes. (Created with BioRender.com). |
Conclusion
The brain’s regional signal strength changes might reflect related body functions. The use of the PerAF method enhanced the quality of the research. Our findings may contribute to revealing potential brain regional changes in HZK patients.
Abbreviations
HZK, herpes zoster keratitis; HCs, healthy controls; PerAF, percent amplitude of fluctuation; R, right; L, left; AUC, area under the curve; ROC, receiver operating characteristic; HADS, Hospital Anxiety and Depression Scale; B.A., Brodmann’s area; MRI, magnetic resonance imaging; N/A, not applicable; V.A., visual acuity; MNI, Montreal Neurological Institute; rs-fMRI, resting-state functional magnetic resonance imaging; Log MAR, logarithm of minimum angle of resolution.
Ethical Statement
All research methods were approved by the medical ethics committee of the First Affiliated Hospital of Nanchang University and were in accordance with the 1964 Helsinki declaration and its later amendments or comparable ethical standards. (No. 2021039).
Consent to Participate
All subjects were informed of the purpose, method, potential risks and signed an informed consent form.
Author Contributions
All authors made a significant contribution to the work reported, whether that is in the conception, study design, execution, acquisition of data, analysis and interpretation, or in all these areas; took part in drafting, revising or critically reviewing the article; gave final approval of the version to be published; have agreed on the journal to which the article has been submitted; and agree to be accountable for all aspects of the work.
Funding
This research received no funding.
Disclosure
The authors report no conflicts of interest in this work.
References
1. Borroni D, Bonzano C, Sánchez-González JM, et al. Shotgun metagenomic sequencing in culture negative microbial keratitis. Eur J Ophthalmol. 2023;2023:11206721221149077.
2. Borroni D, Romano V, Kaye SB, et al. Metagenomics in ophthalmology: current findings and future prospectives. BMJ Open Ophthalmol. 2019;4:e000248. doi:10.1136/bmjophth-2018-000248
3. Sun X, Wei Z, Lin H, Jit M, Li Z, Fu C. Incidence and disease burden of herpes zoster in the population aged >/=50 years in China: data from an integrated health care network. J Infect. 2021;82:253–260. doi:10.1016/j.jinf.2020.12.013
4. Cohen EJ, Jeng BH. Herpes Zoster: a brief definitive review. Cornea. 2021;40(8):943–949. doi:10.1097/ICO.0000000000002754
5. Gallon P, Parekh M, Ferrari S, Fasolo A, Ponzin D, Borroni D. Metagenomics in ophthalmology: hypothesis or real prospective? Biotechnol Rep. 2019;23:e00355. doi:10.1016/j.btre.2019.e00355
6. Peng ZY, Liu YX, Li B, et al. Altered spontaneous brain activity patterns in patients with neovascular glaucoma using amplitude of low-frequency fluctuations: a functional magnetic resonance imaging study. Brain Behav. 2021;11:e02018. doi:10.1002/brb3.2018
7. Guo GY, Zhang LJ, Li B, et al. Altered spontaneous brain activity in patients with diabetic optic neuropathy: a resting-state functional magnetic resonance imaging study using regional homogeneity. World J Diabetes. 2021;12:278–291. doi:10.4239/wjd.v12.i3.278
8. Jia XZ, Sun JW, Ji GJ, et al. Percent amplitude of fluctuation: a simple measure for resting-state fMRI signal at single voxel level. PLoS One. 2020;15:e0227021. doi:10.1371/journal.pone.0227021
9. Zheng X, Sun J, Lv Y, et al. Frequency-specific alterations of the resting-state BOLD signals in nocturnal enuresis: an fMRI Study. Sci Rep. 2021;11:12042. doi:10.1038/s41598-021-90546-3
10. Zhao N, Yuan LX, Jia XZ, et al. Intra- and inter-scanner reliability of voxel-wise whole-brain analytic metrics for resting state fMRI. Front Neuroinform. 2018;12:54. doi:10.3389/fninf.2018.00054
11. Hubbard CS, Becerra L, Heinz N, et al. Abdominal pain, the adolescent and altered brain structure and function. PLoS One. 2016;11:e0156545. doi:10.1371/journal.pone.0156545
12. Chen X, Chen Y, Xu Y, Gao Q, Shen Z, Zheng W. Microstructural and neurochemical changes in the rat brain after diffuse axonal injury. J Magn Reson Imaging. 2019;49:1069–1077. doi:10.1002/jmri.26258
13. Yu E, Liao Z, Tan Y, et al. High-sensitivity neuroimaging biomarkers for the identification of amnestic mild cognitive impairment based on resting-state fMRI and a triple network model. Brain Imaging Behav. 2019;13:1–14. doi:10.1007/s11682-017-9727-6
14. Liu X, Yan Z, Wang T, et al. Connectivity pattern differences bilaterally in the cerebellum posterior lobe in healthy subjects after normal sleep and sleep deprivation: a resting-state functional MRI study. Neuropsychiatr Dis Treat. 2015;11:1279–1289. doi:10.2147/NDT.S84204
15. Viñas-Guasch N, Wu YJ. The role of the putamen in language: a meta-analytic connectivity modeling study. Brain Struct Funct. 2017;222(9):3991–4004. doi:10.1007/s00429-017-1450-y
16. Sigirli D, Ozdemir ST, Erer S, et al. Statistical shape analysis of putamen in early-onset Parkinson’s disease. Clin Neurol Neurosurg. 2021;209:106936. doi:10.1016/j.clineuro.2021.106936
17. Freeman TB, Olanow CW, Hauser RA, et al. Bilateral fetal nigral transplantation into the postcommissural putamen in Parkinson’s disease. Ann Neurol. 1995;38:379–388. doi:10.1002/ana.410380307
18. Starr CJ, Sawaki L, Wittenberg GF, et al. The contribution of the putamen to sensory aspects of pain: insights from structural connectivity and brain lesions. Brain. 2011;134:1987–2004. doi:10.1093/brain/awr117
19. He X, Hong J, Wang Q, et al. Altered spontaneous brain activity patterns and functional connectivity in adults with intermittent exotropia: a Resting-State fMRI Study. Front Neurosci. 2021;15:746882. doi:10.3389/fnins.2021.746882
20. Portera-Cailliau C, Doherty CP, Buonanno FS, Feske SK. Middle cerebral artery territory infarction sparing the precentral gyrus: report of three cases. J Neurol Neurosurg Psychiatry. 2003;74:510–512. doi:10.1136/jnnp.74.4.510
21. Pula JH, Yuen CA. Eyes and stroke: the visual aspects of cerebrovascular disease. Stroke Vasc Neurol. 2017;2:210–220. doi:10.1136/svn-2017-000079
22. Mayr A, Jahn P, Stankewitz A, et al. Patients with chronic pain exhibit individually unique cortical signatures of pain encoding. Hum Brain Mapp. 2022;43:1676–1693. doi:10.1002/hbm.25750
23. Takamura Y, Fujii S, Ohmatsu S, et al. Interaction between spatial neglect and attention deficit in patients with right hemisphere damage. Cortex. 2021;141:331–346. doi:10.1016/j.cortex.2021.03.036
24. Xu MW, Liu HM, Tan G, et al. Altered regional homogeneity in patients with corneal ulcer: a Resting-State Functional MRI Study. Front Neurosci. 2019;13:743. doi:10.3389/fnins.2019.00743
25. Huang X, Li HJ, Peng DC, et al. Altered brain network centrality in patients with late monocular blindness: a resting-state fMRI study. Arch Medical Sci. 2019;15:1301–1307. doi:10.5114/aoms.2019.87133
26. Chun K, Kong E, Cho I. Comparison of perfusion 18F-FP-CIT PET and 99mTc-ECD SPECT in parkinsonian disorders. Medicine. 2021;100:e27019. doi:10.1097/MD.0000000000027019
27. Zhang Y, Cai J, Lin Z, Yao S, Miao W. Primary central nervous system lymphoma revealed by 68Ga-FAPI and 18F-FDG PET/CT. Clin Nucl Med. 2021;46:e421–e423. doi:10.1097/RLU.0000000000003517
28. Yang YC, Cai GQ, Yang QC, et al. Brain functional connectivity changes in patients with acute eye pain: a resting-state Functional Magnetic Resonance Imaging (fMRI) Study. Med Sci Monit. 2021;27:e930588. doi:10.12659/MSM.930588
 © 2023 The Author(s). This work is published and licensed by Dove Medical Press Limited. The
full terms of this license are available at https://www.dovepress.com/terms
and incorporate the Creative Commons Attribution
- Non Commercial (unported, 3.0) License.
By accessing the work you hereby accept the Terms. Non-commercial uses of the work are permitted
without any further permission from Dove Medical Press Limited, provided the work is properly
attributed. For permission for commercial use of this work, please see paragraphs 4.2 and 5 of our Terms.
© 2023 The Author(s). This work is published and licensed by Dove Medical Press Limited. The
full terms of this license are available at https://www.dovepress.com/terms
and incorporate the Creative Commons Attribution
- Non Commercial (unported, 3.0) License.
By accessing the work you hereby accept the Terms. Non-commercial uses of the work are permitted
without any further permission from Dove Medical Press Limited, provided the work is properly
attributed. For permission for commercial use of this work, please see paragraphs 4.2 and 5 of our Terms.