Back to Journals » International Journal of General Medicine » Volume 18
Investigating the Relationship between Ulcerative Colitis and Circadian Rhythm Genes Using Bioinformatics Analysis and Machine Learning
Authors Wang J, You M, Li J, Wang X, Liu Y, Chen S, Wang P
Received 27 February 2025
Accepted for publication 11 June 2025
Published 19 June 2025 Volume 2025:18 Pages 3239—3251
DOI https://doi.org/10.2147/IJGM.S521565
Checked for plagiarism Yes
Review by Single anonymous peer review
Peer reviewer comments 2
Editor who approved publication: Dr Xudong Zhu
Jianghao Wang, Meiyi You, Jichang Li, Xin Wang, Yucun Liu, Shanwen Chen, Pengyuan Wang
Department of Gastrointestinal Surgery, Peking University First Hospital, Peking University, Beijing, 100034, People’s Republic of China
Correspondence: Pengyuan Wang, Email [email protected] Shanwen Chen, Email [email protected]
Objective: This study investigated the correlation between circadian rhythm genes and ulcerative colitis (UC), aiming to identify biomarkers linked to immune microenvironment changes in UC.
Methods: Gene expression data from UC patients and healthy controls were obtained from the GEO database. Data preprocessing included batch correction and PCA for consistency assessment. Differentially expressed genes (DEGs) were identified using the “limma” package, and functional enrichment analysis was performed. Machine learning methods (LASSO, SVM, RF) refined candidate biomarkers. RNA sequencing in a mouse colitis model and immune infiltration analysis validated key genes. A regulatory network of lncRNA, miRNA, and mRNA for hub genes was constructed.
Results: 805 DEGs were identified, including 15 rhythm genes. Four key genes (CPT1A, PRKG2, PPARGC1A, SLC6A4) were screened, with PPARGC1A and SLC6A4 validated as hub genes. These genes were associated with immune cell infiltration and hold potential as biomarkers for UC diagnosis.
Conclusion: Disruptions in circadian rhythm are closely associated with the pathogenesis of ulcerative colitis (UC). The biomarkers PPARGC1A and SLC6A4 demonstrated significantly altered expression in UC patients and were correlated with immune cell infiltration. These findings underscore their potential as diagnostic markers, provide new insights into the immune microenvironment and pathogenesis of UC, and suggest potential therapeutic targets for the disease.
Keywords: ulcerative colitis, circadian rhythm genes, PPARGC1A, SLC6A4
Introduction
Ulcerative colitis (UC) is a chronic, relapsing inflammatory bowel disease (IBD) characterized by continuous mucosal inflammation primarily affecting the colon and rectum. The incidence of UC is increasing in the 21st century, especially in newly industrialized countries.1 Circadian rhythms have been confirmed to be associated with various inflammations in previous studies.2 but the exact etiology of UC remains uncertain.
Circadian rhythms are essential internal mechanisms that help organisms align with the day-night cycle. Disruptions in these rhythms have been associated with various health problems.3 Sleep and Circadian Rhythm Disruption (SCRD) is a widespread issue in modern society, contributing not only to cognitive impairments but also to metabolic syndrome and mental health conditions. These rhythms are governed by cell-autonomous transcription-translation feedback loops (TTFLs). In mammals, the transcriptional activators CLOCK and BMAL form a heterodimer that further activates the expression of circadian rhythm genes (CRGs).4 Key rhythm genes include PER, CRY, ROR and so on, but the mechanisms of many other rhythm genes remain not fully elucidated.
Understanding and targeting circadian regulation rhythms hold promise for advancing chronotherapy and improving health outcomes. In this study, we aimed to explore the relationship between UC and circadian rhythms.
Materials and Methods
Data Collection and Preprocessing
The data used for our analysis was obtained from the Gene Expression Omnibus (GEO) database (https://www.ncbi.nlm.nih.gov/geo/). We selected gene expression profiles from three GEO datasets (GSE11223, GSE16789, GSE92415), encompassing 297 samples from ulcerative colitis patients and 54 from healthy controls. The “sva” package in R was instrumental in harmonizing the datasets through merging, normalization, and batch effect correction. Principal Component Analysis (PCA) was subsequently utilized to evaluate dataset consistency, both before and after batch correction, with visualizations and statistical evaluations facilitated by the “ggplot2” R package. Besides, for further validation, we also incorporated another dataset, GSE87473.
Differentially Expressed Genes Analysis
We used the “limma” package in R to identify differentially expressed genes (DEGs) between the control and UC groups. The screening criteria were set at P values less than 0.05 and an absolute log2 fold change (|logFC|) greater than 1. To visualize the expression patterns of the DEGs, we employed the pheatmap and “ggplot2” packages to create heatmaps and volcano plots, respectively.
Functional Enrichment Analysis
To elucidate the biological relevance of the differentially expressed rhythm genes, we conducted functional enrichment analysis. The differentially expressed rhythm genes were subjected to Gene Ontology (GO) and Kyoto Encyclopedia of Genes and Genomes (KEGG) pathway analyses using the “clusterProfiler” R package and the ggplot2 package for visualizing the enrichment results.
Machine Learning
To identify potential candidate genes for diagnosing ulcerative colitis, we employed three machine learning methods: LASSO logistic regression (using the “glmnet” package), the support vector machine (SVM) algorithm (using the “e1071” package), and the random forest (RF) algorithm (using the “randomForest” package). These approaches were applied to refine the range of candidate biomarkers. The overlapping results from three algorithms were selected as the final candidate diagnostic genes. In both the training and validation datasets, the “pROC” package was utilized to generate receiver operating characteristic (ROC) curves and calculate the area under the curve (AUC) values for the identified hub genes.
Gene Set Enrichment Analysis
In the merged UC dataset, we utilized the “org.Hs.eg.db” and “clusterProfiler” packages to conduct gene set enrichment analysis for the four hub genes. The “Enrichplot” package was employed to visualize the top five activated and inhibited pathways for both high and low expression levels of the hub genes.
Immune Infiltration Analysis
Subsequently, we performed immune infiltration analysis on healthy individuals and UC patients using the CIBERSORT package to examine the composition of immune cells in UC patients. The relative proportions of 22 types of immune cells were visualized using the ggplot2 package. Differences were considered significant at p < 0.05.
Human Peripheral Blood CD4+ T Cell Isolation and in vitro Activation
Peripheral blood samples were harvested from participants after approval by the institutional review board. Peripheral blood mononuclear cells (PBMCs) were isolated by Ficoll density gradient centrifugation. Subsequently, CD4+ T cells were purified with CD4 Nanobeads (BioLegend) and cultured in RPMI-1640 medium supplemented with 1% Penicillin-Streptomycin, and 10% FBS. CD4+ T cells were stimulated with CD3/CD28 T Cell Activator (Stemcell) for the indicated time periods.
Mice and Colitis Model
C57BL/6N mice were bred inside the Animal Center of Peking University First Hospital. All mice experiments were approved by the Animal Ethics Committee of Peking University First Hospital. The acute colitis model was established according to previous reports.5 C57BL/6N mice at the age of 6–8 weeks were administered 3% (w/v) dextran sulfate sodium (DSS) in the drinking water for 7 days, followed by weighing every day. Then the mice were euthanized, the length of colon was measured and the colon tissues were collected.
Enzyme-Linked Immunosorbent Assay (ELISA)
IL-10 and IL-17A levels were quantified using ELISA kits (Elabscience) following the manufacturer’s protocol with minor adjustments. The assay involved incubating standards, blanks, and samples (90 min, 37°C), followed by biotinylated detection antibody (1h, 37°C), HRP conjugate (30 min, 37°C), and substrate (15 min). After stopping the reaction, absorbance was measured at 450 nm.
Western Blotting
Total protein was extracted from the proximal colon mucosa using RIPA buffer contained protease and phosphatase inhibitors (Beyotime). Protein concentrations were quantified using the bicinchoninic acid (BCA) assay. The protein lysates were then separated by SDS-PAGE (4–20%) and transferred onto polyvinylidene fluoride (PVDF) membranes. After blocking for 1 h at room temperature with 5% nonfat milk in Tris-buffered saline containing Tween-20 (TBS-T), the membranes were incubated overnight at 4°C with primary antibodies. Subsequently, they were incubated for 1 h at room temperature with horseradish peroxidase (HRP)-conjugated secondary antibodies. Protein bands were detected using electrochemiluminescence (ECL) reagents (Yeasen) and visualized. The primary antibodies were rabbit anti-SLC6A4 antibody (1:1000 diluted; invitrogen; 702076), rabbit anti-PGC-1α antibody (1:1000 diluted; CST; 2178S) and rabbit anti-GAPDH antibody (1:1000 diluted; CST; 8884S).
Immunohistochemistry
Each slide was completely deparaffinized by immersion in xylene three times for 10 min and rehydrated with water following incubation in graded ethanol (100, 90, 80, and 70%). The antigen retrieval procedure was carried out by microwaving the slides for 10 min in EDTA antigen retrieval solution (ZSJQ Biotech) followed by incubation in peroxidase-blocking solution block endogenous tissue peroxidase activity. The sections were blocked with goat serum (ZSJQ Biotech) for 30 min. Sections were incubated overnight at 4 °C with specific antibodies anti-PGC-1a (Proteintech) and anti-SERT (Proteintech). After washing with PBS, the sections were incubated with horseradish peroxidase-conjugated secondary antibodies (ZSJQ Biotech), stained with DAB, and counterstained with hematoxylin.
Ethics Approval
This study was approved by the Institutional Review Board at Peking University First Hospital, Beijing, China.
Results
Identifications of DEGs and Screening for Genes Associated with Circadian Rhythms
The conceptual framework of this study is depicted in Figure 1. Following the batch effect correction, we performed a Principal Component Analysis (Figure 2A). Furthermore, a total of 805 DEGs were identified, consisting of 521 upregulated genes and 284 downregulated genes. The DEGs were visualized using volcano plots and heatmaps (Figure 2B and C). Then, we cross-linked the DEGs with CRGs to yield 15 differentially expressed rhythm genes (Figure 2D). Details of these genes are provided in Supplementary Table 1.
 |
Figure 1 The flow chart of this study. |
GO and KEGG Analysis
The expression of the differentially expressed rhythm genes was graphically represented through a heatmap (Figure 2E), and also the internal correlations were revealed among the differential rhythm genes (Figure 2F). Finally, we conducted the GO and KEGG enrichment analysis to explore the potential functions and mechanisms between UC and circadian rhythm (Figure 2G and H). As depicted in Figure 2G, the majority of biological processes were found to be enriched in circadian rhythm, rhythmic process and regulation of small molecule metabolic process. In terms of cellular components, the GO terms with the highest enrichment degrees were the nuclear membrane and nuclear envelope. The KEGG analysis pinpointed significant enrichment of these genes in pathways such as Thermogenesis, Glucagon signaling pathway, Insulin resistance, AMPK signaling pathway, Apelin signaling pathway, and Alcoholic liver disease.
 |
Figure 2 GEO Data Processing, Differential Analysis, Enrichment Analysis, and Visualization of Differentially Expressed Genes. (A) The principal component analysis after batch effect correction. (B and C) The visualization of DEGs identified from the merged GEO datasets. Volcano plot (B) and Heatmap (C). (D) The intersection of DEGs and circadian rhythm genes. (E and F) The heatmap of these 15 intersecting genes and their correlation. (G and H) The GO terms and KEGG pathways enriched by the differentially expressed circadian rhythm genes. *p<0.05, **p<0.01, ***p<0.001. |
Screening for Hub Genes by Machine Learning
In order to further screen differentially expressed rhythm genes, we constructed three methods: Lasso regression (Figure 3A and B), SVM algorithm (Figure 3C), and RF algorithm (Figure 3D and E). These three methods screened and yielded 13, 6, and 5 candidate genes, respectively (Supplementary Table 2). Ultimately, we identified 4 overlapped genes: CPT1A, PRKG2, PPARGC1A and SLC6A4 (Figure 3F). Subsequently, we used ROC curves and cumulative residual distribution curves to evaluate the performance of the three machine learning algorithms. The results demonstrated that the candidate genes identified by all three algorithms exhibit strong predictive accuracy (Figure 3G and H).
 |
Figure 3 Screening of key genes by machine learning. (A and B) Lasso regression. (C) SVM-RFE.(D and E) RF algorithm. (F) Intersection genes identified by machine learning. (G) The ROC curves demonstrate the screening performance of the three machine learning algorithms. (H) Reverse Cumulative Distribution of Absolute Residuals for Lasso, Random Forest, and SVM Models. |
The Analysis of RNA Sequencing of Acute Colitis Models
In order to validate the genes we have screened, we established a mouse model of acute colitis: Control group (n=6) and DSS group (n=6). The changes in colon length and body weight are shown as below (Figure 4A and B). The colon length in the DSS group was significantly shortened, and also a noticeable decrease in body weight. After performing RNA sequencing on the colon tissues of mice and conducting differential gene expression analysis, we identified 488 upregulated genes and 725 downregulated genes. The differentially expressed genes (|logFC| >1, p < 0.05) were shown in volcano plot and hierarchical clustering heatmap (Figure 4C and D). KEGG signaling pathway enrichment on top differentially expressed genes (|logFC| >1, p < 0.05) shows that differential mRNAs mainly enriched in metabolicpathways (Figure 4E). We took the intersection of the DEGs obtained from sequencing and those selected by machine learning, ultimately identifying SLC6A4 and PPARGC1A as two hub genes (Figure 4F).
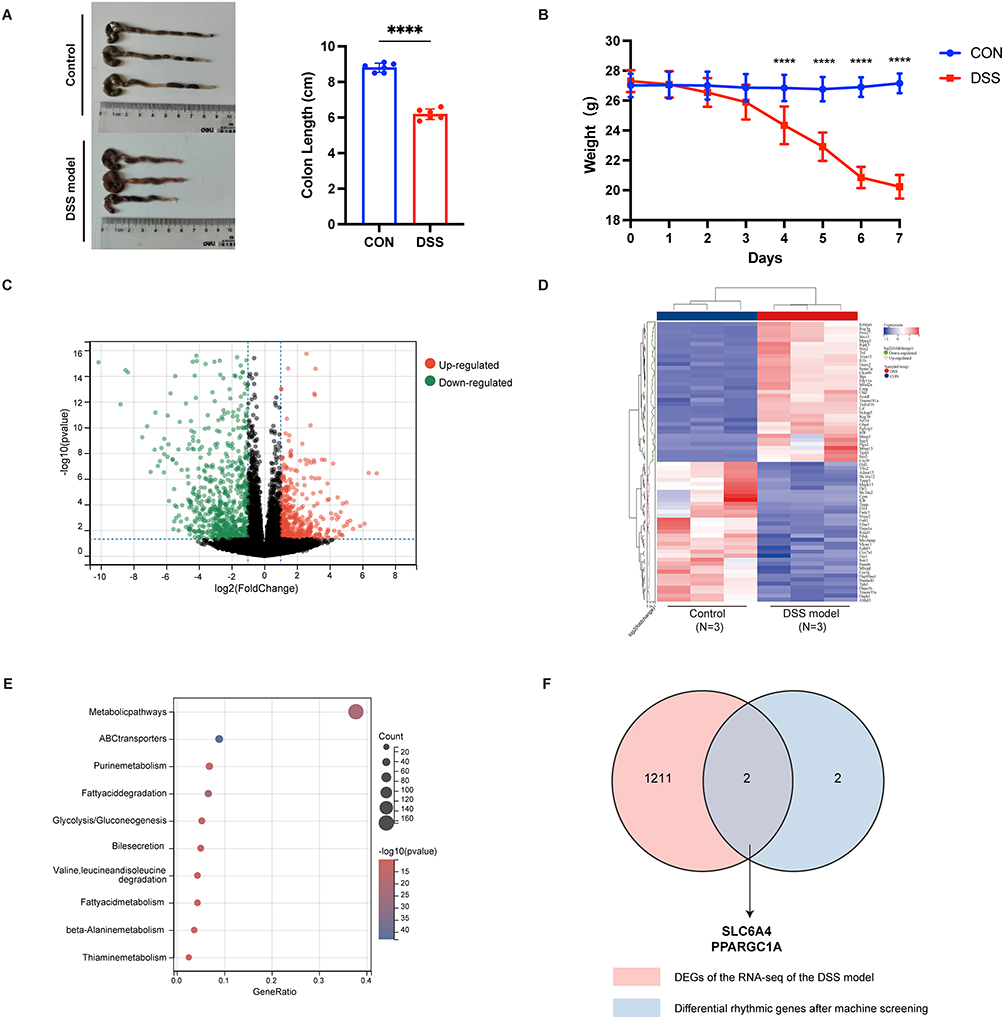 |
Figure 4 Construction and Validation of the DSS Mouse Model. (A) Colon length of mice given 3% DSS in drinking water for 7 days. n=6 per group. (B) Body weight. n=6 per group. (C and D) Differentially expressed genes (logFC > 1 or < −1, p < 0.05) between control and DSS colons. (E) KEGG signaling pathway enrichment on top differentially expressed genes (logFC > 1 or < −1, p < 0.05). (F) Venn diagram of differentially expressed genes and genes screened by machine learning. The data were presented as the mean ± SD, with significance indicated by ****p<0.0001. |
Validation of the Differential Expression of Hub Genes
After that, the ROC curve was established to assess the diagnostic specificity and sensitivity of hub genes (Figure 5A). The results demonstrated that the area under the curve (AUC) reached 0.992, which was higher than the result of each gene. This high AUC suggests that our model can distinguish patients with UC from healthy controls with greater specificity and sensitivity. Subsequently, we compared the expression differences of hub genes between the control group and the UC group in the GEO dataset. The expression levels of PPARGC1A, and SLC6A4 were significantly downregulated in the UC group, suggesting that these genes may serve as highly specific and sensitive biomarkers for the diagnosis of UC (Figure 5B). Besides, we selected another GSE87473 dataset for further validation and observed a significant downregulation of the four genes in the UC group, a finding consistent with the results obtained from the three integrated datasets above (Figure 5C). Subsequently, to examine the correlation between the expression levels of the two hub genes and disease activity in UC patients, we divided the UC group into two subsets based on the median Mayo score—a key clinical indicator of disease severity—and compared the expression levels of these genes between the two groups. (Figure S1A). The results showed that PPARGC1A expression was negatively correlated with Mayo scores, while no significant difference was observed for SLC6A4. Then we developed a machine learning-based nomogram to predict UC risk using signature genes identified through our screening process (Figure S1B). This nomogram predicted ulcerative colitis risk using SLC6A4 and PPARGC1A expression levels. Lower gene expression gives higher points (0–100 per gene). The total score (0–160) corresponds to disease risk probability (1–99%), where higher scores indicate significantly greater UC risk.
 |
Figure 5 The validation of hub genes. (A) ROC curve of hub genes in UC diagnosis. (B) Box plots show differences between UC and control for each of the hub genes using merged GEO datasets. (C) Box plots show differences between UC and control for each of the hub genes using GSE87473 dataset. (D and E) Representative PPARGC1A and SLC6A4 staining (scale bar represents 50 μm) and analysis of colon tissues. (F and G) PPARGC1A and SLC6A4 protein levels in normal and UC groups by Western blotting. The data were presented as the mean ± SEM, with significance indicated by **p<0.01, ***p<0.001. |
Furthermore, immunohistochemical staining (Figure 5D and E) and Western blotting (Figure 5F and G) showed that the expression of PPARGC1A protein and SLC6A4 protein was significantly decreased in the UC group compared to the control group.
Gene Set Enrichment Analysis
Gene set enrichment analysis (GSEA) was performed based on a merged GEO dataset. 2 hub genes—PPARGC1A and SLC6A4—were analyzed (Figure 6A and B). For each gene, samples were stratified into high- and low-expression groups, and the top five enriched pathways were identified. These pathways highlight the functional consequences associated with differential expression of the selected genes in UC.
 |
Figure 6 Gene set enrichment analysis (GSEA). (A) GSEA revealed top pathways in the high PPARGC1A group, including butanoate metabolism and TCA cycle, while the low group showed enrichment in chemokine signaling and cytokine interactions. (B) GSEA revealed top pathways in the high SLC6A4 group, including butanoate metabolism and TCA cycle, while the low group showed enrichment in CAMs and chemokine signaling. |
Immune Infiltration Analysis
To clarify the immune microenvironment of UC patients within the merged dataset, we employed the CIBERSORT algorithm to conduct an analysis of immune cell infiltration. The histogram illustrates the relative abundance of immune cell subsets between control and UC groups (Figure 7A). Subsequently, we conducted a comparative analysis of the infiltration levels of 22 immune cell within tissues from control and UC groups (Figure 7B). The data reveal significant differences in immune cell infiltration, with certain cell types exhibiting higher or lower levels in the UC group compared to controls. As shown in Figure 7B, it reveals a significant upregulation of proinflammatory immune cells in the UC group, including activated CD4 memory T cells, follicular helper T cells, M0 and M1 macrophages, activated dendritic cells, activated mast cells, and neutrophils. Conversely, there is a notable downregulation of regulatory T cells (Tregs), activated NK cells, M2 macrophages, resting dendritic cells, and resting mast cells. The relationship between the SLC6A4 and PPARGC1A genes and immune cells was shown (Figure 7C). Besides, we assessed the correlation between these immune cell populations (Figure 7D). Finally, we presented a network diagram to illustrate the relationships and correlations between immune cell types and hub genes (Figure 7E).
 |
Figure 7 Immune cell infiltration in UC and control group. (A) The 22 types of immune cell types shown in a histogram. Each bar chart represents cell proportions in each patient, and different colors represent each subtype. (B) Violin plot comparing the fractions of immune infiltrating cells between the UC group and the control group. (C) Correlation between 22 characteristic immune cells in UC group. (D and E) Correlation between immune cells and 2 hub genes. (F) Potential effective therapeutic drugs for 2 hub genes. (G) CeRNA regulatory network. lncRNA, miRNA and mRNA interactions regulating of 2 hub genes. *p<0.05, **p<0.01, ***p<0.001. |
To further investigate the hub genes’ immune interactions, we analyzed their relationship with PPARGC1A and SLC6A4 in CD4⁺ T cells. Subsequently, we isolated human peripheral blood CD4⁺ T cells and performed siRNA transfection (Figure S2A and C). We found that PPARGC1A and SLC6A4 knockdown in CD4⁺ T cells decreased IL-10 but increased IL-17A secretion, suggesting reduced Treg differentiation and promoted Th17 cell development (Figure S2B and D).
Screening of Potential Therapeutic Drugs and RNA Regulatory Network
We used the DGIdb database to identify potential therapeutic agents targeting PPARGC1A and SLC6A4 of interest (Figure 7F). Our analysis revealed 25 candidate drugs for PPARGC1A and 15 for SLC6A4. Furthermore, we constructed a comprehensive regulatory network encompassing lncRNA, miRNA, and mRNA that interact with these hub genes (Figure 7G).
Discussion
Ulcerative colitis, a chronic inflammatory bowel disease, may involve a complex interplay of genetic, immunological, and environmental factors in its etiology, but the specific mechanisms remain unclear.6 A study has unveiled the possibility that disruptions in the regulation of circadian genes could be among the initial indicators of ulcerative colitis.7 Circadian rhythm disruptions can perturb intestinal homeostasis, rendering the gut epithelium more susceptible to inflammation.8 In addition, researches also have shown that the expression of circadian genes is reduced in intestinal biopsy samples and PBMCs of patients with inflammatory bowel disease (IBD), and this reduction is associated with disease activity,9 which is consistent with the results of our study.
Circadian rhythms are associated with many aspects including light, activaty and diet.10 The study of circadian rhythm genes has recently has garnered widespread attention. These genes are essential for the biological clock, synchronizing an organism’s physiological processes with the 24-hour day-night cycle. Interruptions to circadian rhythms have been correlated with a broad array of health challenges. Disruptions in circadian rhythms may lead to the development of cardiovascular diseases, mental health disorders, and even tumors.11–13
In the present study, we used the bioinformatics analysis to investigate differences in circadian rhythm-related genes between healthy individuals and UC patients, identifying 15 differentially expressed rhythm genes. Enrichment analysis of differentially expressed rhythm genes reveals high enrichment levels in biological processes such as circadian rhythms, rhythmic processes, regulation of small molecule metabolic process, regulation of circadian rhythm, response to hypoxia, regulation of lipid metabolic process and response to decreased oxygen levels. These processes encompass three key domains: circadian rhythm regulation, metabolic process modulation, and adaptive responses to hypoxic conditions. Meanwhile, we found the KEGG analysis revealed principal enriched pathways included the thermogenesis, glucagon signaling pathway, insulin resistance, AMPK signaling pathway, apelin signaling pathway, alcoholic liver disease, adipocytokine signaling pathway, PPAR signaling pathway, Pertussis and longevity regulating pathway. Interestingly, A plethora of studies indicates that the occurrence and development of colitis are closely associated with metabolic disorders,14,15 which is consistent with our findings, and we have also provided new insights into the further mechanistic exploration of colitis.
Through the application of machine learning algorithms, we selected four genes: PPARGC1A, CPT1A, PRKG2, and SLC6A4. Subsequently, a mouse colitis model was established, followed by sequencing and validation of the genes PPARGC1A and SLC6A4 using Western blotting and immunohistochemistry. PPARGC1A, also called PGC-1α, is belonged to the PGC-1 family, which is known as pivotal regulators in mitochondrial function and energy metabolism.16 There is evidence suggesting that modulation of PGC-1α-associated pathways can enhance intestinal redox balance, potentially offering a therapeutic approach for colitis.17 SLC6A4, also called SERT (serotonin reuptake transporter), is involved in many biological processes. Studies have shown that deficiencies in the serotonin (5-HT) signaling pathway may underlie the alterations in intestinal motility, secretion, and sensory perception.18 Besides, research has revealed that serotonin possesses the ability to reduce the polarization of M1 macrophages, a mechanism that appears to contribute significantly to its impact on colonic inflammation.19 Though a small amount of studies currently have suggest a relationship between SLC6A4 and colitis, but further research is not yet comprehensive. Currently, elective serotonin re-uptake inhibitors (SSRI) drugs have been used to treat IBD by blocking SLC6A4,20 so our research provided a new direction for treating UC by associating SLC6A4 with rhythm. Moreover, as previously discussed, dietary factors—particularly fat intake—are closely intertwined with circadian genes. Long-term high-fat intake has also been considered a high-risk factor for ulcerative colitis,21 and recent studies have shown that 5-HT can promote fat absorption;22 thus regulating SLC6A4 may provide a new therapeutic approach for the treatment of colitis from the perspective of lipid metabolism.
In addition, the immune response plays a central role in the pathogenesis of IBD, involving abnormalities in both innate and adaptive immunity, leading to an excessive immune reaction to the gut microbiota and causing intestinal inflammation and damage.23 Immune cells, cytokines, pattern recognition receptors, and inflammatory caspases are crucial molecules in the development of IBD, directly participating in the inflammatory process and interacting with the gut microbiota to affect intestinal barrier function, thereby influencing the course and treatment response of IBD.24 Clock genes are closely related to the immune defense and inflammation regulation by controlling the activity of immune cells, the expression of inflammatory molecules, and the response to infections. Studies have shown that immune parameters vary across different times of the day, and the disruption of circadian genes is associated with inflammatory pathologies.25 Thus, it is crucial from a scientific perspective to delve deeper into the alterations of the immune microenvironment in UC and to explore the impact of CRGs on this environment. In this study, we found that activated CD4 memory T cells, ollicular helper T cells, activated NK cells, M2 macrophages, and many other types of immune cells may play an important role in UC. We have finally selected these two hub genes as potential therapeutic targets, such as amiodarone, verapamil, and celecoxib targeting the SLC6A4, and metformin, rosiglitazone targeting the PPARGC1A. Additionally, we have analyzed the RNA interaction networks related to these two genes.
In conclusion, circadian rhythms may be altered by circumstances of human life, thus, contributing to the development of various diseases. Our study investigated the correlation between the expression levels of circadian genes and their respective proteins with UC, using different machine learning models for screening and ultimately identifying two biomarkers, PPARGC1A and SLC6A4, which are closely related to changes in the immune microenvironment of UC. Our research further explores the molecular mechanisms underlying the development of UC and provided a foundation and new direction for future UC research.
Data Sharing Statement
The data that support the findings of this study are available on request from the corresponding author.
Ethics Statement
All animal experiments were carried out following the National Standard of Animal Care and Use Procedures and were approved by the Animal Ethics Committee of Peking University First Hospital (approval number: J2024047).
Consent
This study does not require consent.
Funding
This study was funded by the National Natural Science Foundation of China(32370837); Beijing Nova Program (20230484244); Peking University Clinical Scientist Training Program (BMU2023PYJH001), supported by “the Fundamental Research Funds for the Central Universities”; National High Level Hospital Clinical Research Funding (Scientific and Technological Achievements Transformation Incubation Guidance Fund Project of Peking University First Hospital)(2023CX04); Beijing Nova Programme Interdisciplinary Cooperation Project (20240484701).
Disclosure
The authors declare no conflicts of interest in this work.
References
1. Zuo T, Kamm MA, Colombel JF, Ng SC. Urbanization and the gut microbiota in health and inflammatory bowel disease. Nat Rev Gastroenterol Hepatol. 2018;15(7):440–452. doi:10.1038/s41575-018-0003-z
2. Veler H. Sleep and inflammation: bidirectional relationship. Sleep Med Clin. 2023;18(2):213–218. doi:10.1016/j.jsmc.2023.02.003
3. Neves AR, Albuquerque T, Quintela T, Costa D. Circadian rhythm and disease: relationship, new insights, and future perspectives. J Cell Physiol. 2022;237(8):3239–3256. doi:10.1002/jcp.30815
4. Reinke H, Asher G. Crosstalk between metabolism and circadian clocks. Nat Rev Mol Cell Biol. 2019;20(4):227–241. doi:10.1038/s41580-018-0096-9
5. Liang W, Peng X, Li Q, et al. FAM3D is essential for colon homeostasis and host defense against inflammation associated carcinogenesis. Nat Commun. 2020;11(1):5912. doi:10.1038/s41467-020-19691-z
6. Wangchuk P, Yeshi K, Loukas A. Ulcerative colitis: clinical biomarkers, therapeutic targets, and emerging treatments. Trends Pharmacol Sci. 2024;45(10):892–903. doi:10.1016/j.tips.2024.08.003
7. Weintraub Y, Cohen S, Chapnik N, et al. Clock gene disruption is an initial manifestation of inflammatory bowel diseases. Clin Gastroenterol Hepatol. 2020;18(1):115–122.e1. doi:10.1016/j.cgh.2019.04.013
8. Pagel R, Bär F, Schröder T, et al. Circadian rhythm disruption impairs tissue homeostasis and exacerbates chronic inflammation in the intestine. FASEB J. 2017;31(11):4707–4719. doi:10.1096/fj.201700141RR
9. Gombert M, Carrasco-Luna J, Pin-Arboledas G, Codoñer-Franch P. The connection of circadian rhythm to inflammatory bowel disease. Transl Res. 2019;206:107–118. doi:10.1016/j.trsl.2018.12.001
10. Farhud D, Aryan Z. Circadian Rhythm, Lifestyle and Health: a Narrative Review. Iran J Public Health. 2018;47(8):1068–1076.
11. Logan RW, McClung CA. Rhythms of life: circadian disruption and brain disorders across the lifespan. Nat Rev Neurosci. 2019;20(1):49–65. doi:10.1038/s41583-018-0088-y
12. Kinouchi K, Sassone-Corsi P. Metabolic rivalry: circadian homeostasis and tumorigenesis. Nat Rev Cancer. 2020;20(11):645–661. doi:10.1038/s41568-020-0291-9
13. Crnko S, Du Pré BC, Sluijter JPG, Van Laake LW. Circadian rhythms and the molecular clock in cardiovascular biology and disease. Nat Rev Cardiol. 2019;16(7):437–447. doi:10.1038/s41569-019-0167-4
14. Adolph TE, Meyer M, Schwärzler J, Mayr L, Grabherr F, Tilg H. The metabolic nature of inflammatory bowel diseases. Nat Rev Gastroenterol Hepatol. 2022;19(12):753–767. doi:10.1038/s41575-022-00658-y
15. Litvak Y, Byndloss MX, Bäumler AJ. Colonocyte metabolism shapes the gut microbiota. Science. 2018;362(6418):eaat9076. doi:10.1126/science.aat9076
16. Wu Z, Puigserver P, Andersson U, et al. Mechanisms controlling mitochondrial biogenesis and respiration through the thermogenic coactivator PGC-1. Cell. 1999;98(1):115–124. doi:10.1016/S0092-8674(00)80611-X
17. Ferramosca A, Treppiccione L, Di Giacomo M, et al. Prunus mahaleb fruit extract prevents chemically induced colitis and enhances mitochondrial oxidative metabolism via the activation of the Nrf2 pathway. Mol Nutr Food Res. 2019;63(22):e1900350. doi:10.1002/mnfr.201900350
18. Coates MD, Mahoney CR, Linden DR, et al. Molecular defects in mucosal serotonin content and decreased serotonin reuptake transporter in ulcerative colitis and irritable bowel syndrome. Gastroenterology. 2004;126(7):1657–1664. doi:10.1053/j.gastro.2004.03.013
19. Jiang L, Hao Y, Han D, et al. Gut microbiota dysbiosis deteriorates immunoregulatory effects of tryptophan via colonic indole and LBP/HTR2B-mediated macrophage function. ISME J. 2024;18(1):wrae166. doi:10.1093/ismejo/wrae166
20. González Delgado S, Garza-Veloz I, Trejo-Vazquez F, Martinez-Fierro ML. Interplay between serotonin, immune response, and intestinal dysbiosis in inflammatory bowel disease. Int J Mol Sci. 2022;23(24):15632. doi:10.3390/ijms232415632
21. Ananthakrishnan AN, Khalili H, Konijeti GG, et al. Long-term intake of dietary fat and risk of ulcerative colitis and Crohn’s disease. Gut. 2014;63(5):776–784. doi:10.1136/gutjnl-2013-305304
22. Wen X, Feng X, Xin F, et al. B. vulgatus ameliorates high-fat diet-induced obesity through modulating intestinal serotonin synthesis and lipid absorption in mice. Gut Microbes. 2024;16(1):2423040. doi:10.1080/19490976.2024.2423040
23. Zhang YZ, Li YY. Inflammatory bowel disease. Pathogenesis World J Gastroenterol. 2014;20(1):91–99. doi:10.3748/wjg.v20.i1.91
24. de Souza HS, Fiocchi C. Immunopathogenesis of IBD: current state of the art. Nat Rev Gastroenterol Hepatol. 2016;13(1):13–27. doi:10.1038/nrgastro.2015.186
25. Curtis AM, Bellet MM, Sassone-Corsi P, O’Neill LA. Circadian clock proteins and immunity. Immunity. 2014;40(2):178–186. doi:10.1016/j.immuni.2014.02.002
 © 2025 The Author(s). This work is published and licensed by Dove Medical Press Limited. The
full terms of this license are available at https://www.dovepress.com/terms
and incorporate the Creative Commons Attribution
- Non Commercial (unported, 4.0) License.
By accessing the work you hereby accept the Terms. Non-commercial uses of the work are permitted
without any further permission from Dove Medical Press Limited, provided the work is properly
attributed. For permission for commercial use of this work, please see paragraphs 4.2 and 5 of our Terms.
© 2025 The Author(s). This work is published and licensed by Dove Medical Press Limited. The
full terms of this license are available at https://www.dovepress.com/terms
and incorporate the Creative Commons Attribution
- Non Commercial (unported, 4.0) License.
By accessing the work you hereby accept the Terms. Non-commercial uses of the work are permitted
without any further permission from Dove Medical Press Limited, provided the work is properly
attributed. For permission for commercial use of this work, please see paragraphs 4.2 and 5 of our Terms.