Back to Journals » Clinical Epidemiology » Volume 14
Inverse Probability Weighting Enhances Absolute Risk Estimation in Three Common Study Designs of Nosocomial Infections
Authors Staus P ![]() , von Cube M
, von Cube M ![]() , Hazard D
, Hazard D ![]() , Doerken S, Ershova K
, Doerken S, Ershova K ![]() , Balmford J, Wolkewitz M
, Balmford J, Wolkewitz M
Received 25 January 2022
Accepted for publication 20 July 2022
Published 14 September 2022 Volume 2022:14 Pages 1053—1064
DOI https://doi.org/10.2147/CLEP.S357494
Checked for plagiarism Yes
Review by Single anonymous peer review
Peer reviewer comments 2
Editor who approved publication: Professor Vera Ehrenstein
Paulina Staus,1 Maja von Cube,1,* Derek Hazard,1,* Sam Doerken,1 Ksenia Ershova,2 James Balmford1 ,† Martin Wolkewitz1
1Institute of Medical Biometry and Statistics, Division Methods in Clinical Epidemiology, Faculty of Medicine and Medical Center, University of Freiburg, Freiburg, Germany; 2Department of Anesthesiology and Pain Medicine, University of Washington, Seattle, WA, USA
*These authors contributed equally to this work
†James Balmford passed away in March 2020
Correspondence: Paulina Staus, Institute of Medical Biometry and Statistics, Faculty of Medicine and Medical Center, University of Freiburg, Freiburg, Germany, Email [email protected]
Purpose: When studying nosocomial infections, resource-efficient sampling designs such as nested case-control, case-cohort, and point prevalence studies are preferred. However, standard analyses of these study designs can introduce selection bias, especially when interested in absolute rates and risks. Moreover, nosocomial infection studies are often subject to competing risks. We aim to demonstrate in this tutorial how to address these challenges for all three study designs using simple weighting techniques.
Patients and Methods: We discuss the study designs and explain how inverse probability weights (IPW) are applied to obtain unbiased hazard ratios (HR), odds ratios and cumulative incidences. We illustrate these methods in a multi-state framework using a dataset from a nosocomial infections study (n = 2286) in Moscow, Russia.
Results: Including IPW in the analysis corrects the unweighted naïve analyses and enables the estimation of absolute risks. Resulting estimates are close to the full cohort estimates using substantially smaller numbers of patients.
Conclusion: IPW is a powerful tool to account for the unequal selection of controls in case-cohort, nested case-control and point prevalence studies. Findings can be generalized to the full population and absolute risks can be estimated. When applied to a multi-state model, competing risks are also taken into account.
Keywords: selection bias, hospital infection, intensive care units, proportional hazards models, risk assessment, cohort studies
Graphical Abstract:

Plain Language Summary
Study designs employed to investigate hospital-acquired infections (nosocomial infections, NI) include nested-case control, case-cohort, and point prevalence studies. They focus on the investigation of relative risks, for example if males have an increased risk to acquire a NI. In addition, it is of interest how often patients acquire a NI: the absolute risk of infection. This can be challenging as often the study cohort is enriched with infected patients. Inverse probability weighting (IPW) can be applied to the study population to regain the proportions of infected and non-infected patients in the original hospital population. This can be achieved by cloning patients with a low probability of being included in the study several times in the dataset. Furthermore, competing risks need to be considered in this setting regardless of the study design. Patients who leave the hospital are no longer at risk to acquire an infection in the hospital. To account for competing risks we use a multi-state model. We explain, demonstrate, and compare how to apply this analysis strategy using data from a large study performed in Moscow, Russia. We sample the three different study designs and apply IPW in a multi-state model. We compare the results to the original “full” cohort. Relative risks can be estimated correctly without using IPW. In contrast, absolute risks can only be estimated when we apply IPW. You can expand your data analysis by the estimation of absolute risks with the usage of IPW, even when the study was originally focused on other estimates.
Introduction
When investigating rare outcomes such as specific nosocomial infections, it is common to use a study design which favors the selection of cases (eg, infected patients). These designs are especially attractive if resources are limited. Common examples of such sampling designs are the nested case control (NCC) and the case cohort design (CC), as well the point prevalence study (PP).1,2 All of these designs have in common that information on covariate values is only collected for a subsample of the source population. While the population from which samples are drawn is representative of the target population (eg, the population you want to draw conclusions for), the sample you select is distorted when cases are over-represented. For examples, one could perform a NCC study to investigate risk factors for bloodstream infections in the intensive care unit (ICU) by sampling four controls at the time of each infection. The case to control ratio in your study is one to four, which clearly is different from the case proportion in the ICU you drew your sample from, as well as from your target population of ICU patients in general. Thus, naïve analysis of such data may lead to selection bias and, thereby, misleading conclusions on the relative effect of covariates on the incidence of infections (even conclusions on the incidence itself).
In this paper, we discuss and demonstrate the use of inverse probability weights (IPW) for NCC, CC and PP studies in the nosocomial infection setting to repair the selection bias. We compare these three common sampling designs and show how to perform weighted risk factor analyses based on hazard ratio and absolute risk estimation using a dataset from the neuro-intensive care unit at the Burdenko Neurosurgery institute in Moscow, Russia (n = 2286).3 When studying nosocomial infections, patients leaving the risk set must be treated in the analysis adequately. A patient who is discharged from the hospital or dies is no longer at risk to acquire a nosocomial infection in the hospital. The risk to leave the hospital (dead or alive) competes with the risk to acquire an infection. Disregarding competing risks is a common error which results in a competing risks bias.4 Thus, all of our analyses will account for the competing risk of the composite event discharge alive/death.
Selection bias and competing risk bias can severely skew your results, if left unaddressed. Still, these biases are not generally known, although they are very common in the field of nosocomial infections. With this manuscript, we want to draw attention to these types of biases and provide a comprehensive explanation and solution with ready to use R code in addition.
Methods
Analysis Outline
We use the full cohort for the benchmark analysis. In reality, the full cohort would be a sample of the true population of interest itself. We disregard this here, to focus on the bias due to the sampling process. We sample NCC, CC and PP cohorts and compare how their naïve unweighted analyses diverge from the full cohort and how weighting can reconstruct the results. The rationale of IPW is to up-weight patients with a small inclusion probability in the study and to down-weight patients with a high inclusion probability to achieve a weighted survey sample that resembles the full cohort. Using the weighted cohort for your analysis, you are able to draw conclusion for the target population you are interested in. The individual weights correspond to the inverse of the inclusion probability for the specific patient.
A potential pitfall in the analysis of nosocomial infections is the presence of competing risks. Disregarding competing risks altogether is a common error, which often results in the overestimation of the absolute risk of the event of interest. In addition, the influence of a covariate on a patient’s risk of infection only becomes apparent when accounting for competing risks.4 A covariate of interest, such as an indicator of morbidity, might be uninfluential on the rate of infection per se. But morbidity may have a strong effect on mortality or discharge. As most patients in this setting are discharged, the influence of the morbidity on discharge might be a prominent effect. Let us say the morbidity you are interested in leads to an increased length of hospital stay, which is the combined effect of mortality and discharge. Because of their longer time at risk, patients with morbidity have an increased risk to acquire an infection.4 This shows that the risk for infection is, in addition to the rate of infection, dependent on the rate of discharge and death before acquiring an infection. To analyze the effects of morbidity on the risk of infection, we therefore apply two cause-specific Cox proportional-hazard models: one to estimate the effect of the covariate on the rate of infection and one to estimate the effect on the competing event. To take into account competing risks when we estimate both the incidence of infection and the cause specific hazards, we apply a simple multi-state model with three states as depicted in Figure 1. We used the Nelson-Aalen estimator for the cumulative cause specific hazard rates and the Aalen-Johansen estimator of the cumulative incidence function (CIF) to estimate cumulative incidences over time.5,6 These estimators give unbiased estimates, whereas the common Kaplan – Meier estimator would lead to biased results in the competing risk setting.7


The R code (R version 4.1.1) and respective packages we used for the analysis can be found in the supplement under the heading Appendix 1 – R code of Publication.8 For further reading on implementation and interpretation of competing risks see.4,5,9 The section Appendix 2 – R tutorial in the supplement supports to calculate your weights and apply these methods to your data.
Study Designs and the Application of IPW
Nested Case-Control Studies
In a NCC study, the reduced cohort is obtained by including all cases and by selecting a fixed number of controls each time a case occurs in the full cohort among those who are still at risk of infection (incidence density sampling) (Figure 2 top right). These sampling sets are illustrated by grey rectangles in the graphical abstract. As an extension, controls can also be matched on additional confounding factors.10 For the sake of simplicity, we omit this option. Each patient may act as a control for several different cases. Furthermore, a patient selected as a control may acquire an infection at a later time, and thus contribute data to the analysis as both a control and a case. While the time-matching of controls to cases facilitates consistent estimates for risk factor effects on the main event of interest, it can become problematic for the analysis of additional outcomes (ie, competing risks).11 However, an adapted method using inverse probability weighting can be employed to break the time matching and up-weight the controls for use in analyses of further endpoints.12 By using this method we are able to analyze the discharge hazard even though the matching of cases and controls was carried out on the basis of the infection times. Selected controls are weighted with the inverse probability of their inclusion, creating a dataset in which each control is assigned a different weight. The weights are higher for controls sampled earlier after hospital admission and lower for those sampled later after admission, when only patients with longer stays can be selected. A number of inclusion probability estimators have been proposed for NCC studies, however standard logistic regression model-type weighting (generalized linear model) is preferred as it has a smoothing effect on the weight distribution and weights are less prone to extreme values than in other methods.13 In order to calculate this inclusion probability for cases and controls in the NCC setting, entry and event/censoring times are required for the full cohort. This information is a base requirement for every NCC study, so applying IPW for estimation of competing events comes at no additional “cost” to the researcher. The adapted method has been shown to perform well in both simulated data and in a real hospital setting.14
 |
Figure 2 Illustration of sampling designs using Lexis diagrams. Each solid line represents a patient and their length of hospital stay. The black dots represent the moment when a patient becomes infected. From this point onwards the patient is considered a case (dark line). The dashed lines mark the time of sampling. In the nested case-control design, all cases are included and controls (white circles) are sampled at the case’s event time. In the case-cohort study a specified fraction of all patients is included and additionally all cases in the full cohort occurring outside of the sub-cohort. In the point prevalence study patients are sampled at a specific point in time. |
Case-Cohort Studies
In the CC design, a random sub-cohort of the full cohort is selected at the beginning of the study. Patients in the sub-cohort are accentuated with a grey rectangle in the CC image of the graphical abstract. All incident cases that arise in the full cohort (filled with dark color) are compared with the controls from the sub-cohort (filled with grey color). Cases outside of the sub-cohort enter the analysis at the time of incidence (Figure 2 bottom left).15 Thus, covariate information for analysis is only required from the sub-cohort plus cases that occur from outside the sub-cohort. As sampling of the sub-cohort takes place independently of time and disease status, it is possible to evaluate multiple disease outcomes using the same sub-cohort. As a consequence of the study design, however, infected patients (eg, cases) are over-represented relative to the full cohort, or conversely non-cases are under-represented (Table 1).
 |
Table 1 Comparison of the Selection Bias Across the Study Designs and the Corresponding Inverse Probability Weights |
Weighting patients in the sub-cohort by the inverse of the sampling fraction (ie, the proportion of the full cohort selected for the sub-cohort denoted by γ), as proposed by Barlow,16 can account for this imbalance. Thus, each sub-cohort member is weighted by 1/γ. If cases occur from within the sub-cohort, their weights change to 1 at the time of incidence.15 Cases from outside the sub-cohort enter the analysis only at the time of incidence, again with a weight of 1, since cases are always selected in this design.
To analyze the event of interest (eg, infection), the weighted case-cohort sample (sub-cohort and all patients with events) is used. When analyzing the competing event, which occurs more frequently, only the sub-cohort is used without weighting, as it is a random sample of the full cohort.17,18
Point Prevalence Studies
As the name suggests, PP surveys are cross-sectional studies in which patients are sampled at a single point in time (represented in Figure 2 on the bottom right by the dashed vertical line) to determine the prevalence of diseases. All patients who are in the hospital on the date of the survey are sampled and data, both current and retrospective (eg, from medical records), are gathered. Patients sampled are visualized in the graphical abstract by the grey rectangle. Some cases (dark outlined figure) are missing in the sample. If the study is intended to include prospective information, as we do here for the total length of stay, PP survey data is gathered at a second later date, but only for the originally-sampled patients. The main advantage of PP studies is that they can be carried out in relatively short time periods. One key limitation of PP studies is that patients are not sampled from the population with equal probability. It is more likely that patients who have long at-risk times (eg, longer hospital stays) will be recruited into the study, whereas patients with short at-risk times will be underrepresented. The analysis of prevalence is unaffected by this, but when incidences and risks are also in focus, this leads to a selection bias called “length bias”.19,20 Since longer at-risk times will often be associated with other risk factors, the PP survey sample might be unrepresentative of the target population in terms of risk factors, eg, patients who stay in hospital longer tend to be sicker than average. The probability of being sampled is therefore proportional to patients’ time-at-risk, ie, the length of their hospital stay. This bias can be corrected by weighting patients inversely proportional to their time-at-risk (Table 1).21–24
Comparison of Study Designs
Table 1 provides a brief overview of the selection bias associated with each sampling design and shows the weights applied to cases and controls. In contrast to NCC and PP weights, which are time-fixed, CC weights are time-dependent. In the CC design patients outside the sub-cohort, who are event free yet have a weight of 0. A patient’s weight changes to 1 at the time of the event (eg, infection). In contrast, a patient’s weight remains constant in the NCC and the PP designs.14,22 The amount of patient information required for the consideration of the competing risks is the same for the sampled cohort in all sampling designs (event of interest and competing event time, time of censoring). However, the information to construct IPW differs for each design. CC requires the number of patients in the full cohort, which patients were part of the cohort from the beginning and the time of the event for each patient. PP requires the lengths of stay for each sampled patient. For the calculation of weights in the NCC design, we need the most information because controls are sampled at the time a case occurs. Therefore, in addition, we need to know the time of entry into the study population, the time of each event (including competing events), and time of censoring to be able to calculate the inclusion probability for each patient.12
Description of the Dataset
We used data from a prospective single-center observational cohort study from the Burdenko Neurosurgery Institute in Moscow, Russia, carried out to determine, among other outcomes, the incidence of and risk factors for nosocomial blood stream infections (BSI).3
The study complies with the Declaration of Helsinki and the Institutional Review Board of the Burdenko Neurosurgery Institute approved the original study performed from 2011 to 2018 and granted a consent waiver status. Based on the non-intervention nature of the study with no additional interventions besides those in the regular therapeutic regimen, the study presented no more than minimal risk of harm to subjects and it was decided that no informed consent from the patient was required (criteria 45 CFR 46.117(c) and its Russian analogue).25,26 The data base was de-identified prior to downloading. All protected health information was removed.
Patients had a length of ICU stay from 1 to 898 days (median = 9, interquartile range (IQR) = 5–21). All patients included in the study are from the intensive care unit. The length of stay in the neurosurgical ICU may be longer than in other types of ICU but still comparable to other acute care settings. As risk factor, we used the Charlson Comorbidity Index (CCI),27 a validated measure of prognostic comorbidity. Patients with missing CCI at admission were excluded (n = 33). In our data example, the CCI ranged from 0 to 12 with a median (IQR) of 3 (2–5). For simplicity, we assume a linear effect of the CCI.
We sampled patients from the full cohort according to each of the three study designs (Supplement Table 1). To reduce the variability by the sampling process, we sampled each study design 100 times and pooled the calculated estimates. We chose a sampling fraction of 15% for the CC design and selected four controls for each case in the NCC study. We randomly assigned a pseudo-sampling day (between 0 and 137, the 0.99 quantile of the length of stay in the full cohort) for the simulation of the PP study. If the length of stay in the ICU was larger than the random number, the patient was sampled. Therefore, patients were sampled with a ‘length bias’ as would be the case in a real PP study.
Results
We first show how to interpret the results of the competing event analysis with the full cohort. Afterwards, we demonstrate the influence of selection bias on the analysis for the three sampling designs and illustrate how IPW corrects this bias.
How to Interpret the Results of the Full Cohort
In the data example, we were interested in how the daily hazards change over time of ICU stay, and what is the probability of a patient to acquire a BSI or a competing event.
The daily hazard of acquiring a BSI is almost steadily the same (Figure 3 top, slope of the solid line). The daily hazard of being discharged alive or dead is high in the first 10 days of the ICU stay and decreases from the 10th day onwards (Figure 3 bottom, slope of solid line). The risk of being discharged (alive/death) without BSI is a lot greater than the risk of acquiring a BSI. On the condition that the patient still is in the ICU, the probability to acquire a BSI in the first 60 days of the ICU stay is 5% (Figure 4). In addition, we were interested if the morbidity on admission, measured by the CCI, had an influence on acquiring a BSI. When analyzing the full cohort, a direct influence of the CCI on the rate of acquiring a BSI was undetectable (Figure 5 top left, the CI includes 1). However, the CCI seems to influence the length of stay (Figure 5 top right, the CI excludes 1) and therefore may also indirectly influence the absolute risk of infection (ie, the cumulative incidence). This is because the CIF depends on all competing events, including the hazards of the competing events. Patients with a higher CCI seem to be discharged at a lower rate (HR <1) and therefore might have a prolonged risk to acquire a BSI. The indirect effect of the CCI on the risk of acquiring BSI is also reflected by the odds ratio (OR >1) of infection (Figure 5 bottom left). Furthermore, we were interested in how many patients acquired a BSI, independent of the influence of comorbidity. This answers the baseline odds for infection, which can be interpreted as follows: in the group of patients with a CCI Score of 0 (most healthy, younger than 50), there are for every patient without a BSI, 0.05 (95% CI 0.03–0.06) patients who acquired a BSI (Figure 5 bottom right).
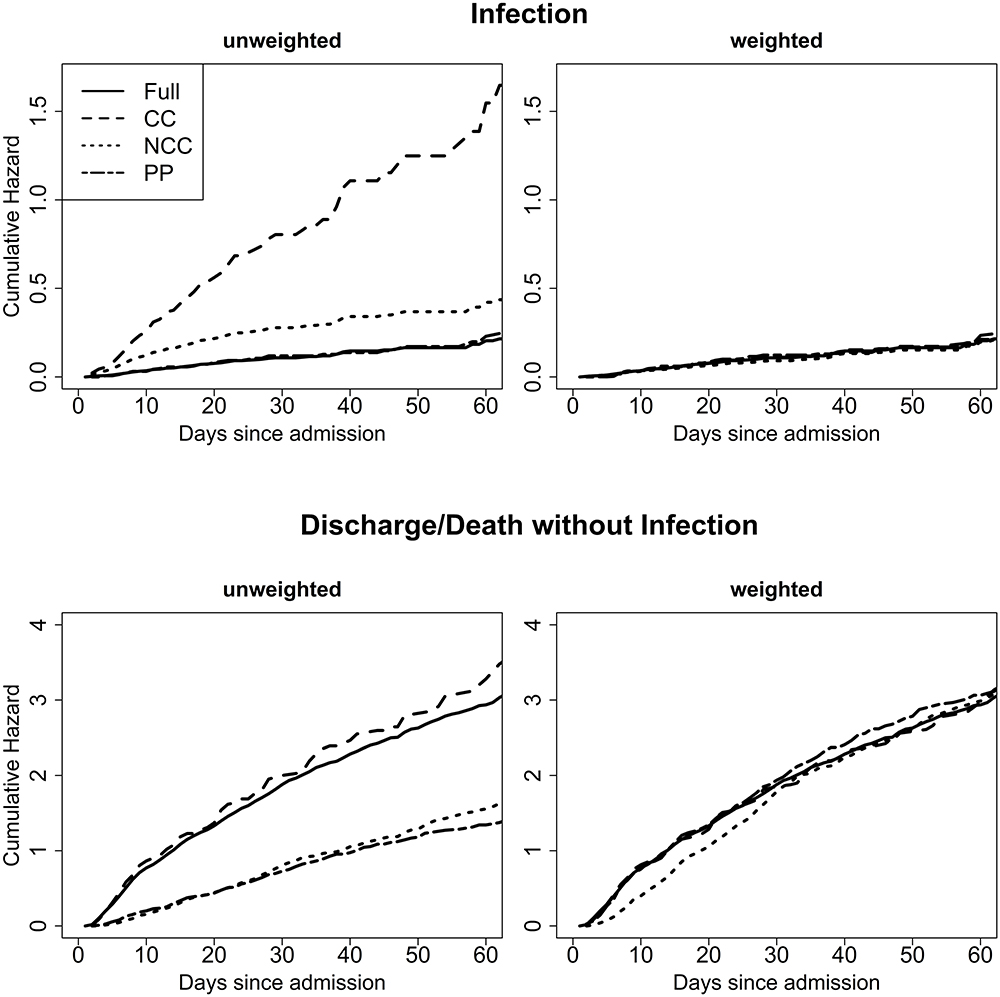 |
Figure 3 Inverse probability weighting corrects the cumulative hazards for infection (top) and discharge without infection (alive or death) (bottom) for the three study designs. The weighted estimates are close to the full cohort estimates. Each study design was sampled 100 times from the full cohort. One random sample is shown in the plot. For the calculation of the cumulative hazard of discharge in the CC study in the ´weighted` analyses, only the random sub-set was used and no inverse probability weights were applied. Abbreviations: Full, Full cohort; CC, case-cohort; NCC, nested case-control; PP, point prevalence. |
 |
Figure 4 Inverse probability weighting corrects the cumulative incidence function (CIF) for admission to either infection (top) or discharge (alive/death) without infection (bottom) for the three study designs. Each study design was sampled 100 times from the full cohort. One random sample is shown in the plot. For the calculation of the CIF of discharge (alive/death) without infection in the CC study, only the random sub-set was used and no inverse probability weights were applied. Abbreviations: Full, Full cohort; CC, case-cohort; NCC, nested case-control; PP, point prevalence. |
 |
Figure 5 Relative risks are less biased when calculated without inverse probability weighting. Absolute risk measures (baseline odds) are heavily biased otherwise. Hazard ratio for the event infection and discharge (alive/death) without infection (top) and odds ratio (OR) and baseline odds of infection (bottom) were calculated for the three study designs in comparison to the full cohort (full cohort estimate and 95% confident intervals (CI) represented by the straight line and grey bar). Each study design was sampled 100 times randomly from the full cohort. Estimates were calculated for each and pooled using Rubin’s rule. In the ´weighted` analysis of the CC study, the hazard ratio of discharge (alive/death) without infection was calculated only with the random sub-set and no weights were applied. Baseline odds are shown in logarithmic scale. Abbreviations: F, full cohort; CC, case-cohort; NCC, nested case-control; PP, point prevalence. |
Which Effect Has the Sampling Bias on the Results
Now we compare the results of the three sampling designs. The probability of becoming infected and being discharged over time as absolute risks measures are heavily biased. The cumulative hazard/ CIF for infection is overestimated, as cases are overrepresented in the sampled cohorts. The unweighted CC cohort analysis depicted in Figure 4 estimates the probability to have acquired a BSI at 60 days of ICU stay, when still in the ICU to be 25% compared to a probability of 5% analyzed with the full cohort. The cumulative hazard/ CIF for discharge without infection in contrast is underestimated by the naïve analysis of the NCC and PP design, as controls are underrepresented (Figure 3, Figure 4). The probability of a patient to be discharged at day 60 was estimated around 60% compared to 90% estimated with the full cohort. For the sake of simplicity only one randomly selected sample of the 100 performed is shown in Figures 3 and 4. The unweighted infection cumulative hazard/ CIF of the CC study are the most biased compared to the NCC and the PP study design in our setting because the case proportion differs greatest from the full study population. In our setting 28.6±1% of sampled patients were cases in the CC design, 25.7±0.5% in the NCC designs, and 15.5±1.4% in the PP design compared to 5.7% in the full cohort (mean ± standard deviation). The discharge cumulative hazard/ CIF of the CC study is less biased as controls are less underrepresented. In addition, the estimation of the CIF in the unweighted CC design has a greater variability, which is reduced by weighting (see Supplement Figure 1).
The naïve PP design most closely resembles the full population in terms of case proportion and therefore also in terms of the infection cumulative hazard/CIF in the unweighted analysis. Applying IPW can restore the cumulative hazard/CIF of the full cohort. When comparing relative risk measures as seen in Figure 5 for the HR of infection, the HR of discharge without infection and the OR for infection, the sampling bias is small. The selection bias is large when analyzing baseline odds, which are absolute risk measures. The baseline risk for infection is heavily overestimated by the naïve analysis of the sampling designs, as cases are overrepresented in the sampled cohorts. IPW can reconstruct the baseline odd estimates of the full cohort.
Discussion
To our knowledge, the different inverse probability weighting methods have not previously been compared side-by-side for the three study designs. In addition, the weighting methods combined with a competing risk approach, explained here, together solve several common pitfalls in the analysis of nosocomial infection studies.
For demonstration in this tutorial paper, we were interested in the incidence of blood stream infections acquired in the ICU and the effect of the CCI comorbidity measure at ICU admission on the infection rate. Using this example, we explained two common biases and how they can be solved. First, sampling bias was introduced by design (see Box 1). Second, competing risk bias was introduced due to the setting (see Box 2).
The Effect of the Sampling Bias Can Be Repaired by IPW
We showed that especially absolute risks are affected by the sampling bias. Relative risk measures are only slightly affected in the naïve analysis, as the ratio remains the same even when nominator and dominator are skewed. We demonstrated how this bias is counterbalanced by the integration of IPW. In NCC studies, controls are time-matched only to cases of a particular disease or event. IPW relaxes this time-matching, therefore exposures associated with other outcomes can be analyzed (eg, the competing risks discharge and death). CC studies are designed to estimate risk factors for several outcomes. PP studies are designed to evaluate prevalences. IPW extends the naïve analysis of NCC, CC and PP studies to be able to evaluate incidences and absolute risks. Applying IPW enables a re-evaluation of valuable datasets to exploit their full potential. This is possible without the cost of collecting additional information in NCC and CC studies. For PP studies, a follow-up is needed to capture the information of the total length of stay.
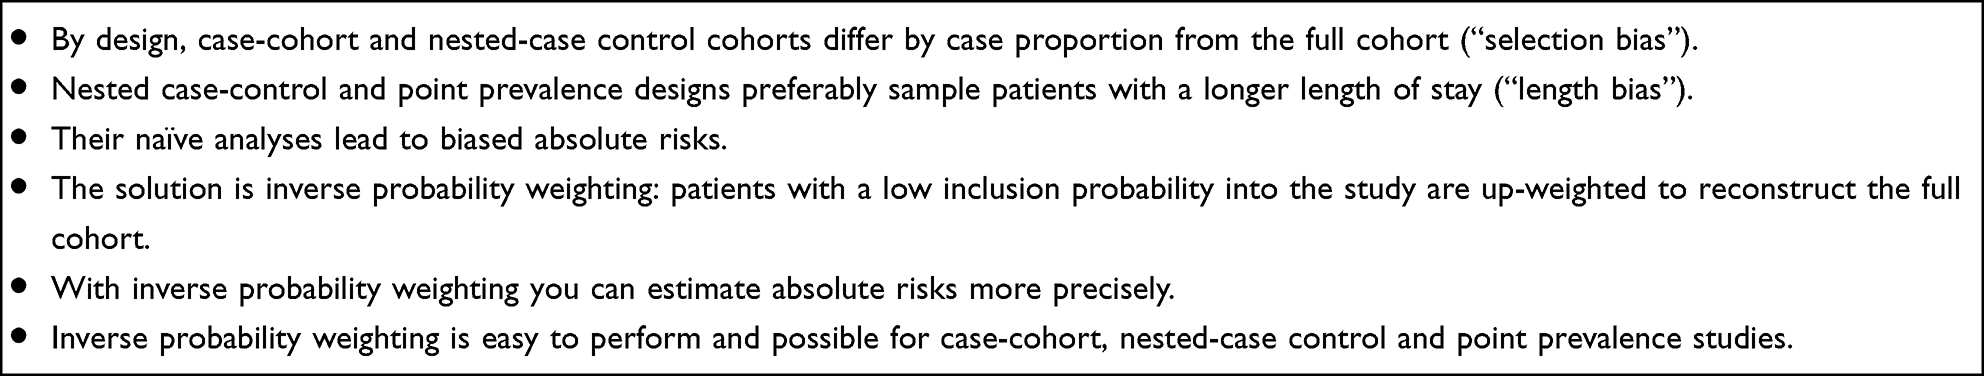 |
Box 1 Selection Biases by Design |
Competing Risk Bias Can Be Addressed by Using a Multi-State Model
In this setting, competing risks needed to be taken into account. As a result, we were able to investigate the direct and indirect effects of the covariate CCI on infection.
The results of the data example suggested that the CCI does not have a direct influence on the rate of infection. Using two separate Cox proportional hazards model, we could show that there is an indirect influence of the CCI on infection. As the CCI changes the rate of the competing risk discharge before infection, the CCI changes also the time at risk to acquire an infection. This is a common finding in nosocomial infection studies and further explained in Wolkewitz et al 2014.4 In this example, we were first and foremost interested in nosocomial infections in the ICU. Therefore, we emphasized that patients leaving the ICU are no longer at risk to acquire a nosocomial-ICU infection. When interested in surgical site infections for example, discharged patients are still at risk to acquire an infection. However, these infections are recorded less frequently when patients leave the hospital. Thus, the incidence of infections in these situations might be underestimated. Still, the competing event discharge has a large impact on whether the infection is observed and therefore an assumption of non-informative censoring is wrong. Therefore, discharge and death should still be acknowledged as competing risks as they change the probability to detect or to acquire an infection. Some selected tutorials for a competing risk analyses are.4,5,9
 |
Box 2 Competing Risk Bias by Setting |
Possible Extensions of the Methods
The quite simple competing risk modelling approach we used can be adapted to more complex settings with several states and more complex Cox models with several covariates. For example, one could investigate the different effect of a covariate on discharge alive compared to death, which we combined due to simplicity. When interested in the consequences of infection, rather than the risk of infection, the analysis can be expanded for all three study designs as shown nicely by von Cube et al18 for the case-cohort design, by Feifel et al28 for the nested-case cohort design and by Doerken et al23 for the point-prevalence design.
Summary
We want to emphasize with this paper that very simple weighting strategies can effectively avoid selection bias and expand your data analysis. The R code in the supplement can support the reader with their own analysis.
Acknowledgments
We thank Prof. Martin Schumacher for proofreading the manuscript. This work was supported by the Innovative Medicines Initiative Joint Undertaking resources (composed of financial contribution from the European Union’s Seventh Framework Programme (FP7/2007-2013) and EFPIA companies) [grant number 115737-2 – COMBACTE-MAGNET and 115523 – COMBACTE-NET]. The funding bodies had no role in the design of the study and collection, analysis, and interpretation of data and in writing the manuscript. This paper is dedicated to the memory of James Balmford.
Disclosure
Ms Paulina Staus reports grants from European Union’s Seventh Framework Programme and EFPIA companies, during the conduct of the study. The authors report no conflicts of interest in this work.
References
1. Ohneberg K, Wolkewitz M, Beyersmann J, et al. Analysis of clinical cohort data using nested case-control and case-cohort sampling designs. A powerful and economical tool. Methods Inf Med. 2015;54(6):505–514. doi:10.3414/ME14-01-0113
2. Doerken S, Mandel M, Zingg W, Wolkewitz M. Use of prevalence data to study sepsis incidence and mortality in intensive care units. Lancet Infect Dis. 2018;18(3):252. doi:10.1016/S1473-3099(18)30081-1
3. Savin I, Ershova K, Kurdyumova N, et al. Healthcare-associated ventriculitis and meningitis in a neuro-ICU: incidence and risk factors selected by machine learning approach. J Crit Care. 2018;45:95–104. doi:10.1016/j.jcrc.2018.01.022
4. Wolkewitz M, Cooper BS, Bonten MJM, Barnett AG, Schumacher M. Interpreting and comparing risks in the presence of competing events. BMJ. 2014;349:g5060. doi:10.1136/bmj.g5060
5. Beyersmann J, Allignol A, Schumacher M. Competing Risks and Multistate Models with R. New York, NY: Springer New York; 2012.
6. Aalen OO, Johansen S. An empirical transition matrix for non-homogeneous Markov chains based on censored observations. Scandinavian. J Stat. 1978;5(3):141–150.
7. van Walraven C, McAlister FA. Competing risk bias was common in Kaplan-Meier risk estimates published in prominent medical journals. J Clin Epidemiol. 2016;69:170–173.e8. doi:10.1016/j.jclinepi.2015.07.006
8. R Core Team. R: A language and environment for statistical computing. Vienna, Austria: R Foundation for Statistical Computing; 2022. https://www.R-project.org/
9. Austin PC, Lee DS, Fine JP. Introduction to the analysis of survival data in the presence of competing risks. Circulation. 2016;133(6):601–609. doi:10.1161/CIRCULATIONAHA.115.017719
10. Støer NC, Samuelsen SO. Inverse probability weighting in nested case-control studies with additional matching–a simulation study. Stat Med. 2013;32(30):5328–5339. doi:10.1002/sim.6019
11. Borgan O, Goldstein L, Langholz B. Methods for the analysis of sampled cohort data in the cox proportional hazards model. Ann Statist. 1995;23(5):1749–1778. doi:10.1214/aos/1176324322
12. Samuelsen SO. A pseudolikelihood approach to analysis of nested case-control studies. Biometrika. 1997;84(2):379–394. doi:10.1093/biomet/84.2.379
13. Støer NC, Samuelsen SO. Comparison of estimators in nested case-control studies with multiple outcomes. Lifetime Data Anal. 2012;18(3):261–283. doi:10.1007/s10985-012-9214-8
14. Hazard D, Schumacher M, Palomar-Martinez M, Alvarez-Lerma F, Olaechea-Astigarraga P, Wolkewitz M. Improving nested case-control studies to conduct a full competing-risks analysis for nosocomial infections. Infect Control Hosp Epidemiol. 2018;39(10):1196–1201. doi:10.1017/ice.2018.186
15. Barlow WE, Ichikawa L, Rosner D, Izumi S. Analysis of case-cohort designs. J Clin Epidemiol. 1999;52(12):1165–1172. doi:10.1016/S0895-4356(99)00102-X
16. Barlow WE. Robust variance estimation for the case-cohort design. Biometrics. 1994;50(4):1064–1072. doi:10.2307/2533444
17. Wolkewitz M, Palomar-Martinez M, Olaechea-Astigarraga P, Alvarez-Lerma F, Schumacher M. A full competing risk analysis of hospital-acquired infections can easily be performed by a case-cohort approach. J Clin Epidemiol. 2016;74:187–193. doi:10.1016/j.jclinepi.2015.11.011
18. von Cube M, Schumacher M, Palomar-Martinez M, Olaechea-Astigarraga P, Alvarez-Lerma F, Wolkewitz M. A case-cohort approach for multi-state models in hospital epidemiology. Stat Med. 2017;36(3):481–495. doi:10.1002/sim.7146
19. Delgado-Rodríguez M, Llorca J. Bias. J Epidemiol Community Health. 2004;58(8):635–641. doi:10.1136/jech.2003.008466
20. Mandel M, Fluss R. Nonparametric estimation of the probability of illness in the illness-death model under cross-sectional sampling. Biometrika. 2009;96(4):861–872. doi:10.1093/biomet/asp046
21. Fluss R, Mandel M, Freedman LS, et al. Correction of sampling bias in a cross-sectional study of post-surgical complications. Stat Med. 2013;32(14):2467–2478. doi:10.1002/sim.5608
22. Frantal S, Pernicka E, Hiesmayr M, Schindler K, Bauer P. Length bias correction in one-day cross-sectional assessments - The nutritionDay study. Clin Nutr. 2016;35(2):522–527. doi:10.1016/j.clnu.2015.03.019
23. Doerken S, Metsini A, Buyet S, Wolfensberger A, Zingg W, Wolkewitz M. Estimating incidence and attributable length of stay of healthcare-associated infections – modelling the Swiss point-prevalence survey. Infect Control Hosp Epidemiol. 2021;1–10. doi:10.1017/ice.2021.295
24. Mandel M. The competing risks illness-death model under cross-sectional sampling. Biostatistics. 2010;11(2):290–303. doi:10.1093/biostatistics/kxp048
25. LII/Legal Information Institute. 45 CFR § 46.117 - Documentation of informed consent. Available from: https://www.law.cornell.edu/cfr/text/45/46.117.
26. Federal agency for technical regulation and metrology. GOST 52379-2005. GCP: Good Clinical Practice. Available from: https://www.medtran.ru/rus/trials/gost/52379-2005.htm.
27. Charlson M, Szatrowski TP, Peterson J, Gold J. Validation of a combined comorbidity index. J Clin Epidemiol. 1994;47(11):1245–1251. doi:10.1016/0895-4356(94)90129-5
28. Feifel J, von Cube M, Ohneberg K, et al. Sampling designs for rare time-dependent exposures: a comparison of the nested exposure case-control design and exposure density sampling. Epidemiol Infect. 2021;149:e122. doi:10.1017/S095026882100090X
 © 2022 The Author(s). This work is published and licensed by Dove Medical Press Limited. The
full terms of this license are available at https://www.dovepress.com/terms
and incorporate the Creative Commons Attribution
- Non Commercial (unported, 3.0) License.
By accessing the work you hereby accept the Terms. Non-commercial uses of the work are permitted
without any further permission from Dove Medical Press Limited, provided the work is properly
attributed. For permission for commercial use of this work, please see paragraphs 4.2 and 5 of our Terms.
© 2022 The Author(s). This work is published and licensed by Dove Medical Press Limited. The
full terms of this license are available at https://www.dovepress.com/terms
and incorporate the Creative Commons Attribution
- Non Commercial (unported, 3.0) License.
By accessing the work you hereby accept the Terms. Non-commercial uses of the work are permitted
without any further permission from Dove Medical Press Limited, provided the work is properly
attributed. For permission for commercial use of this work, please see paragraphs 4.2 and 5 of our Terms.
Recommended articles
Nanomaterials for the Treatment of Contamination by Nosocomial Pathogens in Intensive Care Units
Chu YM, Zhang H, Huang Y, Li J, Huang M
International Journal of Nanomedicine 2025, 20:10213-10231
Published Date: 22 August 2025