Back to Journals » Journal of Multidisciplinary Healthcare » Volume 17
Inverse L-Shaped Association Between Body Mass Index and Myopia in Chinese Schoolchildren: A Pilot Study
Authors Zheng T ![]() , Fu W, Jiang S
, Fu W, Jiang S ![]() , Yang X
, Yang X
Received 10 January 2024
Accepted for publication 9 April 2024
Published 23 April 2024 Volume 2024:17 Pages 1839—1846
DOI https://doi.org/10.2147/JMDH.S458978
Checked for plagiarism Yes
Review by Single anonymous peer review
Peer reviewer comments 2
Editor who approved publication: Dr Scott Fraser
Tianli Zheng,1,2 Weiwei Fu,1,2 Shuang Jiang,3 Xiaodong Yang1,2
1School of Biomedical Engineering (Suzhou), Division of Life Sciences and Medicine, University of Science and Technology of China, Hefei, Anhui, People’s Republic of China; 2Suzhou Institute of Biomedical Engineering and Technology, Chinese Academy of Science, Suzhou, Jiangsu, People’s Republic of China; 3The Third Affiliated Hospital of Jinzhou Medical University, Jinzhou, Liaoning, People’s Republic of China
Correspondence: Xiaodong Yang, Suzhou Institute of Biomedical Engineering and Technology, Chinese Academy of Science, No. 88, Keling Road, Suzhou, Jiangsu Province, 215000, People’s Republic of China, Email [email protected]
Purpose: The prevalence of obesity and myopia in young people is increasing worldwide; however, the association between body mass index (BMI) and myopia remains controversial. This study aimed to assess the association between BMI and myopia in Chinese schoolchildren.
Patients and Methods: In this study, the open data for analysis were obtained from DATADRYAD website (www.datadryad.org). A total of 3658 children were enrolled in this study. Logistic regression model was used to analyze the relationship between BMI and myopia.
Results: Compared with individuals with lower BMI Q1 (less than 25 kg/m2), the adjusted odds ratios (ORs) for BMI and myopia were 2.15 (95% confidence interval [CI]: 1.62– 2.86) in Q2 (25.0– 29.9 kg/m2) and 2.39 (95% CI: 1.37– 4.18) in Q3 (30.0 kg/m2 or more). Moreover, the association between BMI and myopia exhibited an inverted L-shaped curve (nonlinear; p < 0.001). When the BMI was < 25 kg/m2, an increased BMI was significantly associated with a higher risk of myopia (OR = 1.244 [95% CI: 1.211– 1.277], p < 0.001). However, when the BMI was ≥ 25 kg/m2, the association lost its significance (OR = 1.063 [95% Cl: 0.964– 1.171], p = 0.219).
Conclusion: This study found an inverted L-shaped association between BMI and myopia in Chinese schoolchildren. A higher BMI was associated with a higher risk of myopia reaching 25 kg/m2, after which an increase in BMI was no longer associated with an increased risk of myopia.
Keywords: myopia, body mass index, cross-sectional, schoolchildren, logistic regression
Introduction
Myopia, or nearsightedness, is a prevalent refractive error that affects individuals globally. It has become a significant public health concern due to its increasing prevalence and related ocular complications.1 In 2010, approximately 28.3% of the global population was affected by myopia, and this figure is projected to rise to 49.8% by 2050.2 Uncorrected myopia is the major cause of vision impairment worldwide. Moreover, high myopia can lead to severe ocular damage and is linked to various ocular diseases, including retinal detachment, glaucoma, myopic maculopathy, and blindness.3–5 Typically, myopia develops and progresses most rapidly during childhood,6 and stabilizes gradually for most individuals after adolescence.7 However, early-onset myopia in Asian school-aged children is associated with longer progression duration and, in some cases, a faster rate of progression (−1D per year).8 Consequently, there is a higher prevalence of high myopia among young people in Asia and an increased risk of complications such as pathologic myopia.9 Therefore, children and adolescents are the primary target population for myopia prevention and control.
The cause of myopia is complex and not yet fully understood, and it is currently believed that genetic, environmental, and racial factors may all play a role in the development of myopia.1 Furthermore, researchers are also investigating the potential association between body mass index (BMI) and myopia. While current research findings on the relationship between BMI and myopia are inconsistent, with conflicting reports. Some studies indicate a positive correlation between the two,10–12 others suggest a negative correlation or no clear association.13–15 A study by Cordain showed that a carbohydrate diet with high glycemic load may be associated with myopia.16 Moreover, insulin resistance stimulates the production of insulin-like growth factor 1 (IGF-1), leading to axial elongation, which is also associated with the development of myopia. The high risk of insulin resistance is closely related to obesity, which can lead to increased levels of insulin and IGF in the blood, further increasing the risk of myopia.17–19 Notably, obese individuals tend to show higher BMIs.20 Therefore, the study on the relationship between BMI and myopia is of great significance. However, limited studies have been conducted in China to investigate this association. Consequently, this study explored the association between BMI and myopia in school-aged children in China.
Methods
Study Participants
The data for this study were obtained from a population-based observational study conducted in Jinshan District, Shanghai, China.21 This study included cross-sectional data from 3658 children and adolescents aged 7 to 18 years. Participants with a history of severe ocular and systemic diseases (such as glaucoma and cataracts), those who used low-concentration atropine eye drops or those who had undergone orthokeratology lens correction were excluded, as previously described. Measurements were collected after obtaining approval from the Medical Ethics Committee of Jinshan Hospital of Fudan University, China. This study was conducted in accordance with the tenets of the Declaration of Helsinki. Written informed consent of the parents or guardians was obtained from all the participants.
The data used in this study are publicly available through dryad, and the information is recorded in a manner that prevents direct or indirect identification of the subjects through relevant identifiers, as a result, this study has received an exemption from obtaining ethical approval from the medical ethics committee of the Ethics Review Board of The Third Affiliated Hospital of Jinzhou Medical University. Additionally, due to the utilization of existing data and the absence of personal privacy and commercial interests in the research project, written informed consent from the aforementioned ethics committee is also exempted as the subjects cannot be located.
Examinations
Participants underwent a comprehensive ophthalmological examination, as well as height and weight measurements, as previously described.21 The ophthalmological examination included the assessment of refractive error in both eyes using an automatic refractive instrument (RK-F1; Canon Corporation, Tokyo, Japan) without cycloplegia. Axial length was measured using an ocular Biometrics System (IOLMaster; Carl Zeiss Meditec, Oberkochen, Germany). The height and weight of all children were recorded in a standardized manner, without shoes or heavy clothing.
Variables and Measurement
The spherical equivalent refraction (SER) was calculated by adding the sphere power and half-cylinder power. Myopia was defined as an SER of −0.50 D or less, according to a study reported by the International Myopia Institute (IMI).22 It has been widely accepted that an SER of ≤ −0.50 D is used as the definition of myopia in nearly 90% of epidemiological studies on myopia. In this study, the right eye was included in this study for evaluation because previous studies have shown a high correlation between refractive errors in the right and left eyes.23
According to the definition provided by the World Health Organization (WHO), BMI was calculated by dividing the body weight in kilograms by the square of the height in meters. This study adopted the BMI cutoff points according based on the Asia-Pacific classification provided by the World Health Organization. BMI was categorized into three groups: Q1 (less than 25 kg/m2), Q2 (25.0–29.9 kg/m2), and Q3 (30.0 kg/m2 or more).24
Each student completed a questionnaire with their parents to gather information about their lifestyles, including factors such as the amount of time spent outdoors and the duration of daily studying. Time spent outdoors was defined as the total time spent on leisure and sports activities in an outdoor setting. The average number of hours spent outdoors per day was calculated using the following formula: [(hours spent on weekdays) ×5 + (hours spent on weekend days) ×2]/7.25
Statistical Analysis
For the baseline data of the subjects, the measurement data in accordance with the normal distribution were described by the mean ± standard deviation (SD), the measurement data that did not comply with the normal distribution were described by median (first quartile, third quartile), and the count data were described by n (%). Multivariate logistic regression analysis was performed to evaluate the association between BMI and myopia. Model 1 was adjusted for sex. Model 2 was adjusted sex, weekday study time, weekend study time, weekday outdoor time, and weekend outdoor time. The smooth curve fitting graph was established to evaluate the linearity between BMI and myopia. Considering the effect of extreme values, only the middle 95% of BMI data are shown.
All statistical analyses were conducted using the statistical package R version 4.1.0 (http://www.R-project.org, The R Foundation, Vienna, Austria) and the Free Statistics platform (version 1.8). Statistical significance was set at a two-sided P-value of <0.05.
Results
Baseline Characteristics of the Study Population
The baseline characteristics of the study population, consisting of 3658 enrolled participants (1841 boys and 1817 girls), were stratified by myopia category and presented in Table 1. The prevalence of myopia in this study was found to be 57.8% (N = 2116). Participants with myopia were observed to have a higher likelihood of being females, having a higher BMI, spending more time studying, and spending less time outdoors on weekends.
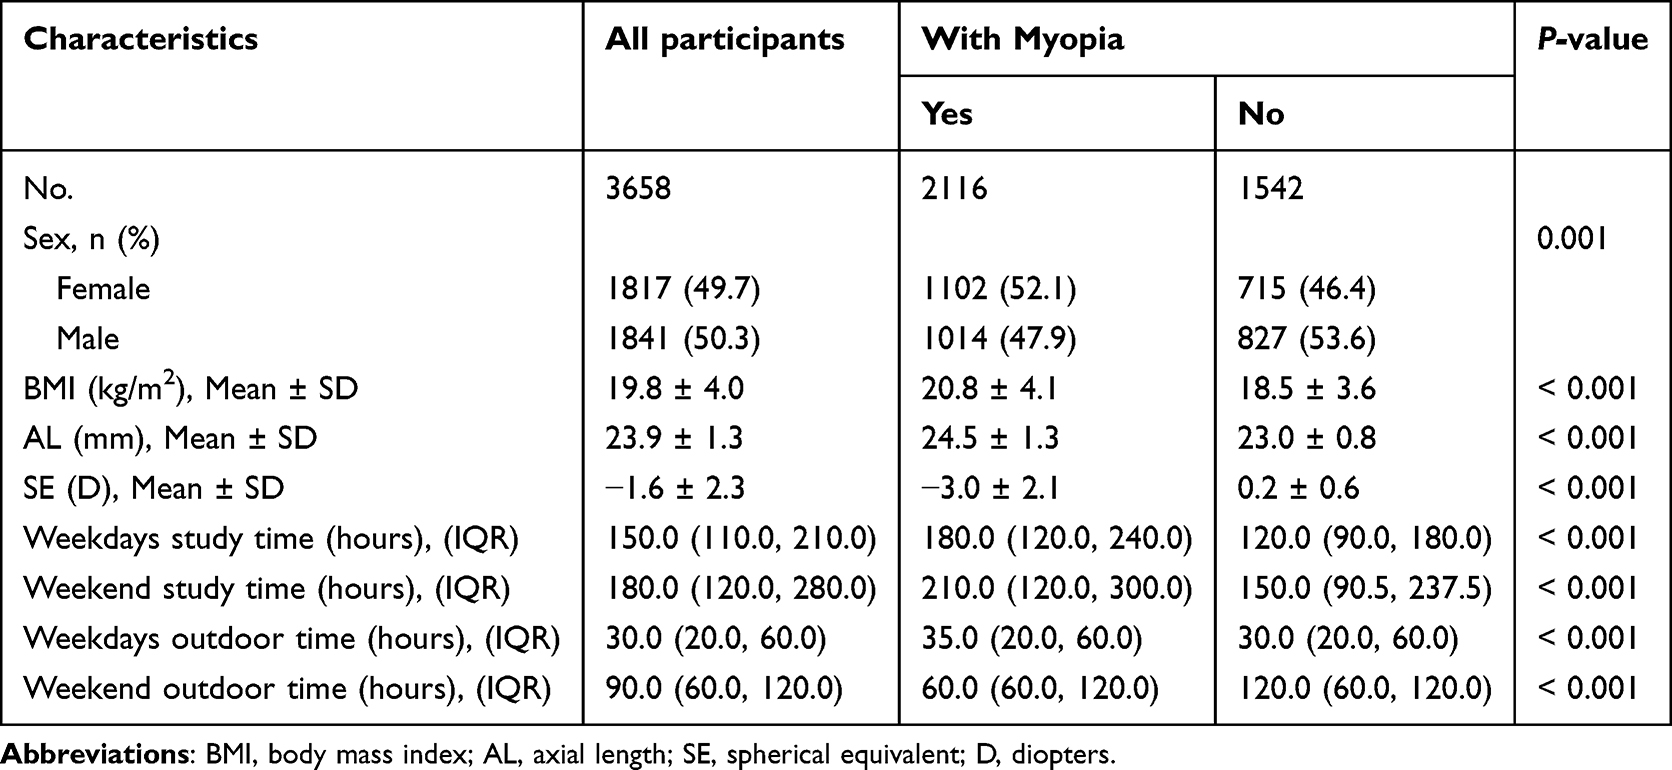 |
Table 1 Baseline Characteristics of the Participants |
Association Between BMI and Myopia
The association between BMI and myopia was examined using multiple logistic regression models, as shown in Table 2. BMI was correlated with myopia, with each 1 kg/m2 increase in BMI associated with a 14% increase in the risk of myopia (OR = 1.14 [95% CI: 1.12,1.17]). In the non-adjusted model, compared with the reference group (Q1), Q2 group had a 146% increased risk of myopia (OR = 2.46 [95% CI: 1.88, 3.22]), while Q3 group had a 183% increased risk (OR = 2.83 [95% CI: 1.67, 4.80]). After adjusting for confounding factors listed in model 2 (gender, weekday study time, weekend study time, weekday outdoor time, and weekend outdoor time), the adjusted ORs for myopia in Q2 and Q3 group were 2.15[95% CI: 1.62, 2.86] and 2.39 [95% CI: 1.37, 4.18], respectively, compared to Q1 (p < 0.001).
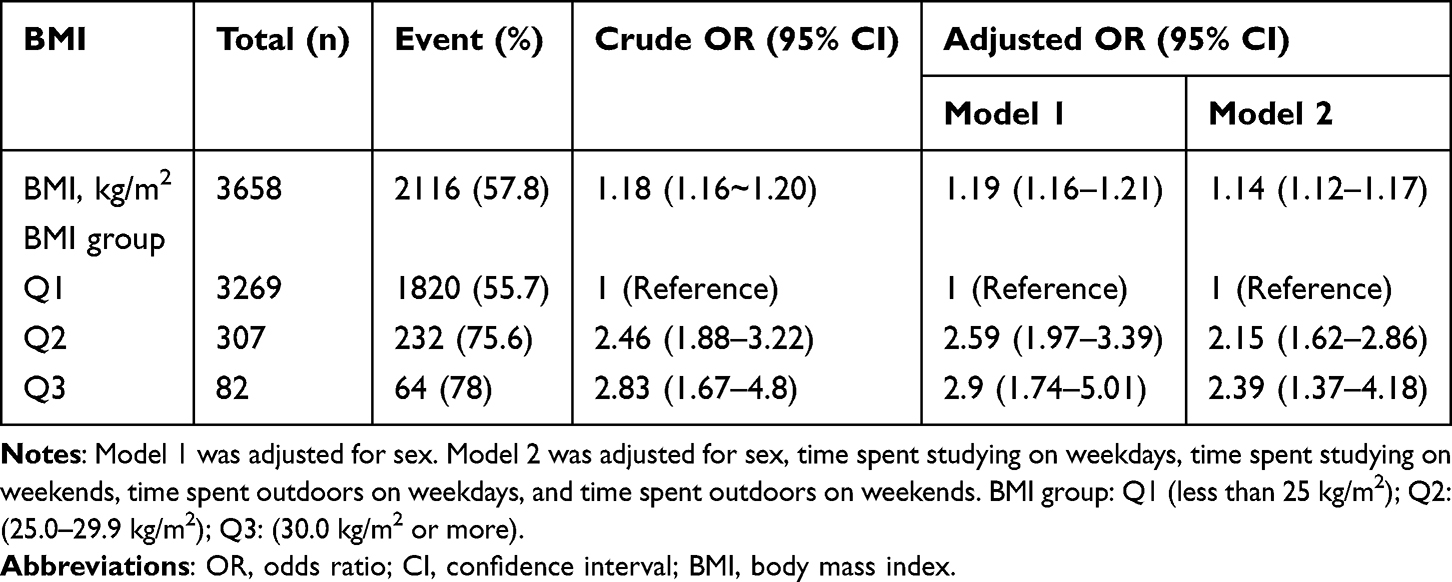 |
Table 2 Association Between BMI and Myopia in Multivariate Logistic Regression |
Stratified Analyses Based on Baseline Variables
The results of subgroup analysis and interactions were summarized in Figure 1. Additive interaction between BMI and myopia was observed in gender (P-value for interaction < 0.05). However, significant interactions were not found in axial length, weekday study time, weekend study time, weekday outdoor time, and weekend outdoor time.
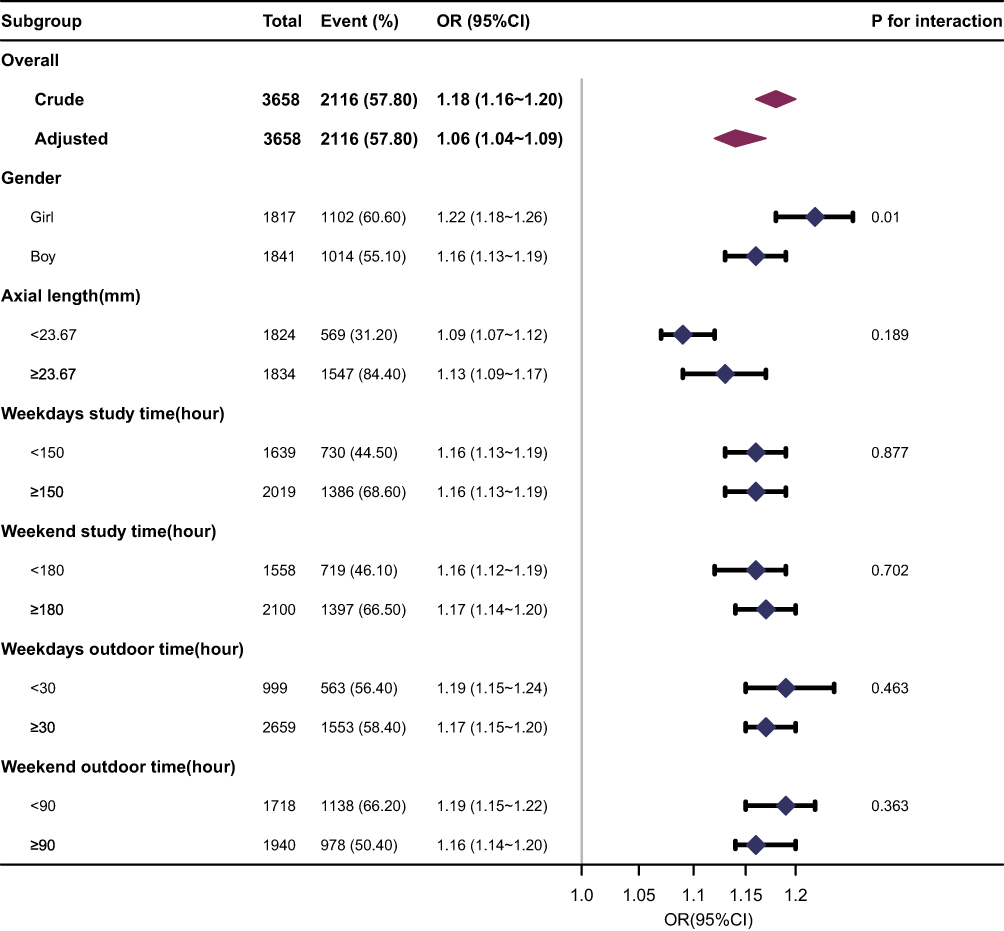 |
Figure 1 Association between BMI and myopia. |
An Inverse L-Shaped Association Between BMI and Myopia
The analysis using RCS regression revealed an inverse L-shaped curve (nonlinear, p = 0.011) in the association between BMI and myopia (as shown in Figure 2). In the threshold analysis, participants with a BMI < 25 kg/m2 had an OR of myopia of 1.244 (95% CI: 1.211–1.277, p < 0.001) (as shown in Table 3). This means that the risk of myopia increased by 24.4% for every 1 kg/m2 increase in BMI. However, no significant association was found between BMI and myopia when the BMI was ≥25 kg/m2 (as shown in Table 3). This suggests that the risk of myopia does not significantly increase with increasing BMI once the BMI reaches ≥25 kg/m2.
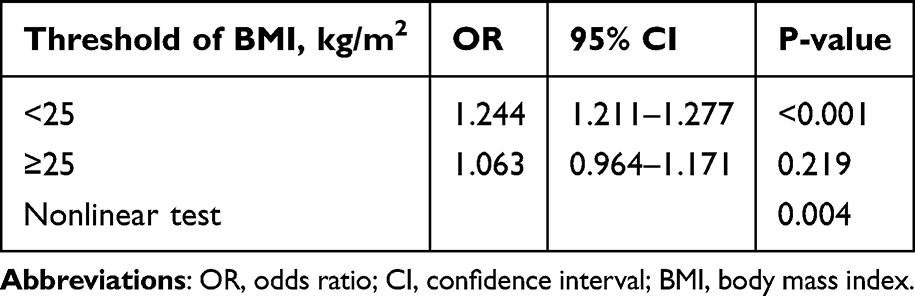 |
Table 3 Threshold Effect Analysis of the Relationship Between BMI and Myopia |
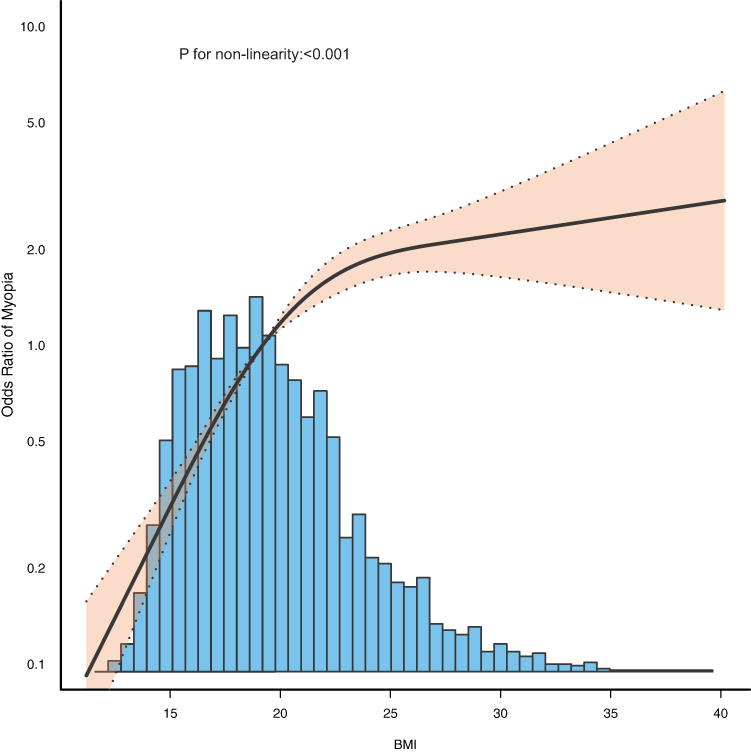 |
Figure 2 Association between BMI and myopia odds ratio. Solid and dashed lines represent the predicted value and 95% confidence intervals. Only 99% of the data are shown. |
Discussion
In this population-based cross-sectional study, BMI was positively associated with the risk of myopia (OR = 1.14 [95% CI: 1.12,1.17]), especially among girls. There was a positive association between BMI and myopia up to 25 kg/m2, while no significant correlation was observed between BMI and myopia when BMI is >25 kg/m2.
Previous studies conducted a school-based survey of 25,644 children aged 7 to 12 in Tianjin, China, revealing a negative correlation between BMI and spherical equivalent refraction (SER).26 Similarly, another cross-sectional study of 482 children aged 6 to 15 in Tianjin showed that BMI did not show correlation with SER in a multiple linear regression model.27 Univariate and multivariate logistic regression analysis methods were utilized in our study to investigate the direct relationship between BMI and myopia. We found a reverse L-shaped positive correlation between BMI and myopia. A recent study involving 8000 participants from the National Health and Nutrition Examination Survey (NHANES) in the United States from 1999 to 2008 found a linear relationship between myopia and BMI, with higher BMI being positively associated with myopia.10 Another cross-sectional study conducted in Israel involving 1.3 million adolescents revealed a J-shaped relationship between body mass index and myopia, with the effect being more prominent in adolescent males than females.11 In our study, we evaluated the association between BMI and myopia in the Chinese population, along with exploring the dose–response relationship, while conducting stratified analysis based on gender, axial length, weekday study time, weekend study time, weekday outdoor time, and weekend outdoor time. Overall, our conclusions were similar with those of the two previous studies; however, we observed that an increase in BMI among Chinese girls may be associated with a higher risk of myopia compared to boys. The reason for this difference may be attributed to variations in the study population selection.
The relationship between myopia and BMI exhibits a unique inverted L-shaped pattern, as shown in Figure 2. This relationship suggests that myopia may cease to progress once body weight reaches a certain level of obesity. This finding may be related to the increase in retrobulbar fat, as reported by Gunes,28 which in obese individuals may be constrained by the limited orbital space, potentially slowing down the growth of the axial growth and eye expansion. However, the underlying mechanisms of the relationship between BMI and myopia are not fully understood. Furthermore, subgroup analysis further revealed a significant gender-specific association between BMI and myopia, as shown in Figure 1. In the female population, the relationship between BMI and myopia is more pronounced, indicating that gender factors may need to be considered when assessing and managing myopia risk. Nonetheless, from a broader perspective, regardless of gender, maintaining a healthy weight is an important strategy to reduce overall health risks and alleviate myopia risk.
There are some limitations to this study. First, the data utilized in this study were obtained from a study in 2018,21 which lacked detailed inclusion and exclusion criteria. Therefore, the reliability of the data may be affected by selection bias. Second, the authors did not disclose age data, which are relevant to BMI and particularly crucial for children and adolescents who are still in the process of growth and development. Third, non-cycloplegic refraction was employed in this study to measure myopia, which may have led to an overestimate of its prevalence. Fourth, too few adjusted variables have been discussed in multivariate analysis, and more covariates such as exercise, diet, and lifestyle should be added. To address these limitations, a further study is planned to be conducted that comprehensively investigates the correlation between BMI and myopia.
Conclusion
Our study indicates an inverse L-shaped association between BMI and myopia. These findings underscore the significance of monitoring BMI and promoting healthy lifestyles in the prevention of myopia. Further research is necessary to investigate the underlying mechanisms and formulate effective strategies for the prevention and control strategies of myopia.
Data Sharing Statement
Publicly available datasets were used in this study. These can be found in [DRYAD] at http://doi.org/10.5061/dryad.c2fqz615c, reference number [20].
Ethics Approval and Informed Consent
Study approval statement: This study has been granted an exemption from requiring ethics approval by the Ethics Review Board of The Third Affiliated Hospital of Jinzhou Medical University.
Consent to Participate Statement: This study has been granted an exemption from requiring written informed consent by the Ethics Review Board of The Third Affiliated Hospital of Jinzhou Medical University.
Acknowledgment
We thank the authors of the article from which our data are cited. We thank those responsible for planning and managing this population-based study and providing the data set.
Author Contributions
All authors made a significant contribution to the work reported, whether that is in the conception, study design, execution, acquisition of data, analysis and interpretation, or in all these areas; took part in drafting, revising or critically reviewing the article; gave final approval of the version to be published; have agreed on the journal to which the article has been submitted; and agree to be accountable for all aspects of the work.
Funding
This data research was funded by the Youth Innovation Promotion Association of the Chinese Academy of Sciences (Y202072).
Disclosure
The authors have no conflicts of interest to declare in this work.
References
1. Morgan IG, Ohno-Matsui K, Saw SM. Myopia. Lancet. 2012;379(9827):1739–1748. doi:10.1016/S0140-6736(12)60272-4
2. Holden BA, Fricke TR, Wilson DA, et al. Global Prevalence of Myopia and High Myopia and Temporal Trends from 2000 through 2050. Ophthalmology. 2016;123(5):1036–1042. doi:10.1016/j.ophtha.2016.01.006
3. Saw SM, Chua WH, Hong CY, et al. Height and Its Relationship to Refraction and Biometry Parameters in Singapore Chinese Children. Br J Ophthalmol. 2002;43(5):567.
4. Bez D, Megreli J, Bez M, Avramovich E, Barak A, Levine H. Association Between Type of Educational System and Prevalence and Severity of Myopia Among Male Adolescents in Israel. JAMA Ophthalmol. 2019;137(8):887. doi:10.1001/jamaophthalmol.2019.1415
5. Musch DC, Archer SM. Can We Prevent or Delay the Onset of Myopia? JAMA Ophthalmol. 2023;141(4):303. doi:10.1001/jamaophthalmol.2023.0446
6. Polling JR, Klaver C, Tideman JW. Myopia progression from wearing first glasses to adult age: the DREAM Study. Br J Ophthalmol. 2022;106(6):820–824. doi:10.1136/bjophthalmol-2020-316234
7. Gwiazda J, Hyman L, Dong LM, et al. Factors Associated with High Myopia After 7 Years of Follow-up in the Correction of Myopia Evaluation Trial (COMET) Cohort. Ophthalmic Epidemiol. 2007;14(4):230–237. doi:10.1080/01658100701486459
8. Wu PC, Chuang MN, Choi J, et al. Update in myopia and treatment strategy of atropine use in myopia control. Eye. 2019;33(1):3–13. doi:10.1038/s41433-018-0139-7
9. Wong YL, Saw SM. Epidemiology of Pathologic Myopia in Asia and Worldwide. Asia-Pac J Ophthalmol. 2016;5(6):394–402. doi:10.1097/APO.0000000000000234
10. Qu Y, Huang H, Zhang H. Association between body mass index and myopia in the United States population in the National Health and Nutrition Examination Surveys 1999 to 2008: a cross-sectional study. Eur J Med Res. 2023;28(1):561. doi:10.1186/s40001-023-01542-4
11. Peled A, Nitzan I, Megreli J, et al. Myopia and BMI: a nationwide study of 1.3 million adolescents. Obesity. 2022;30(8):1691–1698. doi:10.1002/oby.23482
12. Lee S, Lee HJ, Lee KG, Kim J. Obesity and high myopia in children and adolescents: Korea National Health and Nutrition Examination Survey. PLoS One. 2022;17(3):e0265317. doi:10.1371/journal.pone.0265317
13. Rahi JS, Cumberland PM, Peckham CS. Myopia Over the Lifecourse: prevalence and Early Life Influences in the 1958 British Birth Cohort. Ophthalmology. 2011;118(5):797–804. doi:10.1016/j.ophtha.2010.09.025
14. Jung SK, Lee JH, Kakizaki H, Jee D. Prevalence of Myopia and its Association with Body Stature and Educational Level in 19-Year-Old Male Conscripts in Seoul, South Korea. Invest Ophthalmol Vis Sci. 2012;53(9):5579. doi:10.1167/iovs.12-10106
15. Harb EN, Wildsoet CF. Nutritional Factors and Myopia: an Analysis of National Health and Nutrition Examination Survey Data. Optom Vis Sci. 2021;98(5):458–468. doi:10.1097/OPX.0000000000001694
16. Cordain L, Eaton SB, Brand Miller J, Lindeberg S, Jensen C. An evolutionary analysis of the aetiology and pathogenesis of juvenile-onset myopia. Acta Ophthalmol Scand. 2002;80(2):125–135. doi:10.1034/j.1600-0420.2002.800203.x
17. Galvis V, López-Jaramillo P, Tello A, et al. Is myopia another clinical manifestation of insulin resistance? Med Hypotheses. 2016;90:32–40. doi:10.1016/j.mehy.2016.02.006
18. Ebbeling CB, Feldman HA, Klein GL, et al. Effects of a low carbohydrate diet on energy expenditure during weight loss maintenance: randomized trial. BMJ. 2018;363:k4583. doi:10.1136/bmj.k4583
19. Ludwig DS, Ebbeling CB. The Carbohydrate-Insulin Model of Obesity: beyond Calories In, Calories Out. JAMA Intern Med. 2018;178(8):1098–1103. doi:10.1001/jamainternmed.2018.2933
20. World Health Organization. Obesity and overweight. Available from: https://www.who.int/news-room/fact-sheets/detail/obesity-and-overweight.
21. Li T, Jiang B, Zhou X. Age-Related Change of Axial Length, Spherical Equivalent, and Prevalence of Myopia and High Myopia in School-Age Children in Shanghai: 2014–2018. Journal of Ophthalmol. 2020;2020:1–8. doi:10.1155/2020/4235893
22. Wolffsohn JS, Flitcroft DI, Gifford KL, et al. IMI - Myopia Control Reports Overview and Introduction. Invest Ophthalmol Vis Sci. 2019;60(3):M1–M19. doi:10.1167/iovs.18-25980
23. Wu PC, Tsai CL, Wu HL, Yang YH, Kuo HK. Outdoor Activity during Class Recess Reduces Myopia Onset and Progression in School Children. Ophthalmology. 2013;120(5):1080–1085. doi:10.1016/j.ophtha.2012.11.009
24. World Health Organization. Regional Office for the Western P. The Asia-Pacific perspective: redefining obesity and its treatment. Sydney; 2000.
25. He M, Xiang F, Zeng Y, et al. Effect of Time Spent Outdoors at School on the Development of Myopia Among Children in China: a Randomized Clinical Trial. JAMA. 2015;314(11):1142. doi:10.1001/jama.2015.10803
26. Du W, Ding G, Guo X, et al. Associations between anthropometric indicators and refraction in school-age children during the post-COVID-19 era. Front Public Health. 2023;10:1059465. doi:10.3389/fpubh.2022.1059465
27. Ye S, Liu S, Li W, Wang Q, Xi W, Zhang X. Associations between anthropometric indicators and both refraction and ocular biometrics in a cross-sectional study of Chinese schoolchildren. BMJ Open. 2019;9(5):e027212. doi:10.1136/bmjopen-2018-027212
28. Gunes A, Uzun F, Karaca EE, Kalaycı M. Evaluation of Anterior Segment Parameters in Obesity. Korean J Ophthalmol. 2015;29(4):220–225. doi:10.3341/kjo.2015.29.4.220
 © 2024 The Author(s). This work is published and licensed by Dove Medical Press Limited. The
full terms of this license are available at https://www.dovepress.com/terms
and incorporate the Creative Commons Attribution
- Non Commercial (unported, 3.0) License.
By accessing the work you hereby accept the Terms. Non-commercial uses of the work are permitted
without any further permission from Dove Medical Press Limited, provided the work is properly
attributed. For permission for commercial use of this work, please see paragraphs 4.2 and 5 of our Terms.
© 2024 The Author(s). This work is published and licensed by Dove Medical Press Limited. The
full terms of this license are available at https://www.dovepress.com/terms
and incorporate the Creative Commons Attribution
- Non Commercial (unported, 3.0) License.
By accessing the work you hereby accept the Terms. Non-commercial uses of the work are permitted
without any further permission from Dove Medical Press Limited, provided the work is properly
attributed. For permission for commercial use of this work, please see paragraphs 4.2 and 5 of our Terms.